Embed Size (px)
Citation preview
1
Numerical simulations of volcanic jets: Importance of vent overpressure 1
Darcy E. Ogden1*, Kenneth H. Wohletz2, Gary A. Glatzmaier1 & Emily E. Brodsky1 2
1 Earth & Planetary Sciences Department, University of California at Santa Cruz, 1156 High Street, Santa Cruz, CA 3 95064 4 2 Los Alamos National Laboratory, EES11 MS F665, Los Alamos, NM 87545 5 *corresponding author, [email protected] 6
7

2
Abstract 7
Explosive volcanic eruption columns are generally subdivided into a lower, momentum-8
dominated or gas-thrust section and an upper convection-dominated plume. Where pressure in 9
excess of atmospheric exists within the vent, the gas-thrust region is overpressured and develops 10
a jet-like structure of standing and reflecting shock waves known as a Mach Stem. Using a 11
pseudogas approximation for a mixture of rhyolite tephra and gas, we conducted a series of 12
numerical experiments that simulate the effects of Mach Stem development on the gas-thrust 13
region. Our results show that the strength and position of standing shock waves are strongly 14
dependent on the eruptive fluid pressure and vent radius. These factors control the gas-thrust 15
region’s shape and height and the character of vertical heat and mass flux into the convective 16
plume. With increased overpressure, the gas-thrust region becomes wider and develops an outer 17
sheath or shear zone in which the erupted mixture moves at higher speeds than it does near the 18
center of the column. The radius of this sheath is linearly dependent on the vent radius and the 19
square root of the overpressure. The sheath structure results in an annular vertical velocity (and 20
vertical heat flux) profile at the base of the convective plume. This result is in stark contrast to 21
the generally applied Gaussian or top-hat profile, which has been a fundamental assumption for 22
calculation of buoyant plume rise within and dispersion from an eruption column. 23
24
25 26

3
Notation 26
c Sound speed (m s-1). 27
CP Specific heat capacity of a gas at constant pressure (J kg-1K-1). 28 CV Specific heat capacity of a gas at constant volume (J kg-1K-1). 29
CS Specific heat capacity of a solid (J kg-1K-1). 30 hdisk Mach disk height (m). Height on jet axis of the standing Mach disk relative to vent exit. 31
K Overpressure ratio. Ratio of vent pressure (Pvent) to atmospheric pressure (Patm). 32 M Mach number. Ratio of fluid velocity (v) to sound speed in the fluid (c). Subscript: vent- 33
M at the vent, 1- just before the Mach disk, 2- just after the Mach disk. 34 n Mass fraction solids in the pseudogas mixture. 35
P Pressure (Pa). Subscript: vent- pressure at vent exit, atm- atmospheric pressure and 36 initial pressure in simulation box 37
q Vertical convective heat flux (J m-2 s-1). Subscript: vent- heat flux at the vent, peak- 38 highest heat flux in a horizontal slice located at z=1.25hdisk 39
Q Vertical convective heat flow (J s-1), i.e. heat flux integrated over an area. 40 r Radius (m), i.e. distance from jet centerline. Subscript: vent- radius of the vent, 41
max- radius of the simulation mesh, peak- horizontal location of
!
˙ q peak relative to jet 42 centerline 43
R Specific gas constant (J kg-1 K-1). Subscript: gas- of the gas portion of the pseudogas, 44 fluid- of the pseudogas itself. 45
Re Reynolds number. Re=ULν-1 where L is a characteristic length scale (e.g., the radius of 46 the jet), U a characteristic velocity, and ν the viscous diffusivity of the eruptive fluid. 47
T Temperature (K). Subscript: vent- at vent, atm- initial temperature in the mesh, fluid- 48 temperature of the eruptive pseudogas 49
v Velocity (m s-1). Subscript: r- radial component, z- vertical component, vent- at vent (all 50 vertical). 51
w Approximate thickness of fast moving sheath above the Mach disk (m). 52
z Vertical distance relative to vent exit (m), i.e. height. Subscript: max- height of 53 computational mesh. 54
γ Isentropic expansion coefficient for an ideal gas (γ=Cp/Cv). 55
Γ Isentropic expansion coefficient for a pseudogas. 56
ρ Density (kg m-3) Subscript: vent- at the vent. 57
σh Standard deviation of the Mach disk height (hdisk) over time. 58 59

4
1. Introduction 59
In large, explosive volcanic eruptions, the eruptive fluid issues from the vent as a high 60
speed, compressible gas with entrained solid particulates. It is important to quantify the behavior 61
of this gas-thrust region because it provides a connection between the fluid dynamics in the 62
conduit and that of the buoyant column. If the eruptive fluid velocity is at or greater than sonic 63
and vent pressure is higher than atmospheric pressure, the dynamics will be complicated by the 64
presence of standing shock waves that can drastically alter the distribution of the vertical heat 65
flux necessary for eruption column stability. The fluid dynamics and structure of a compressible 66
jet issuing from a sonic nozzle into an ambient atmosphere of lower pressure are well known 67
from experimental, analytical and computational studies (Figure 1,[Thompson, 1972]). Although 68
application of compressible jet dynamics to explosive volcanic eruptions was first suggested over 69
25 years ago by Kieffer [1981], the concept has yet to be widely applied in modeling and 70
analysis of explosive eruption columns. In this paper, we present computational results that 71
quantify the important effects of vent pressure on the fluid dynamics of volcanic jets and show 72
that overpressured jets produce vertical heat flux profiles that are drastically different than those 73
of pressure-balanced jets. (Note: to avoid confusion, here we use the physics convention and 74
consider “heat flux” the thermal energy transfer per area per unit time (J m-2 s-1) and “heat flow” 75
the thermal energy transfer integrated over an entire area per time (J s-1). In volcanology 76
literature, the term “heat flux” is often used to mean either of these things [e.g. Woods, 1988; 77
Mastin, 2007]). 78
Fixing the vent pressure to that of the surrounding atmosphere drastically limits the 79
complexity of the flow field. However, this simplifying assumption allowed fundamental 80
aspects of volcanic eruption dynamics to be determined. We briefly highlight only a few of them 81

5
here (for a more thorough review, see Valentine[1998] and Woods[1998]). Wilson et al. [1978] 82
demonstrate that eruptive columns behave like convective thermal plumes [Morton et al., 1956] 83
with a height proportional to the quarter-root of mass flow. This important finding built upon the 84
earlier prediction that eruptive mass flow is determined by conduit and vent shape and size 85
[Wilson, 1976]. Since that time, 30 years of observation and experiments have supported 86
Wilson’s predictions and demonstrated that vent shape and size also evolve during the course of 87
an eruption [Wohletz et al., 1984; Woods, 1995; Valentine and Groves, 1996; Sparks et al., 88
1997]. Notably in the last decade, a research group at the University of Pisa [e.g. Dobran, 1992; 89
Macedonio et al., 1994; Papale et al., 1998; Neri et al., 2007] demonstrated the advantages of 90
making nonlinear numerical simulations in two and three dimensions with sophisticated 91
constitutive relationships and subgrid-scale turbulence parameterizations. These models have 92
improved our understanding of the factors that influence eruptions including magma viscosity, 93
rheology and composition. 94
Kieffer first suggested that the well-understood fluid dynamics of an overpressured, 95
supersonic jet could describe volcanic eruption dynamics; she used this understanding to explain 96
the lateral blast of Mount St. Helens on May 18, 1980 [Kieffer, 1981]. She applied the method of 97
characteristics to solve for the general flow field and locations of standing shock structures in the 98
proximal areas of the blast (for a description of this commonly used method, see [Thompson, 99
1972]). This approach was later expanded [Kieffer, 1989] and used with laboratory experiments 100
of overpressured jets as volcanic analogs [Kieffer and Sturtevant, 1984]. This theory of volcanic 101
jets has been more widely applied in the planetary volcanism regime, e.g. sulfuric plumes on Io 102
[Kieffer, 1982], where large overpressure ratios are more easily achieved due to low atmospheric 103
densities. However, the theory that the gas-thrust region of volcanic jets may controlled by 104

6
compressibility effects (and associated shock waves) has not been widely applied to eruptions on 105
Earth. 106
Despite the lack of extensive application and quantification, there have been a few 107
computational and analytical studies, some with overpressure effects. Wohletz et al. [1984] 108
applied an implicit multifield Eulerian numerical method to simulate the initial phases of a large 109
caldera-eruption, showing that overpressure produces a blast wave analogous to the physics of a 110
shock tube. Later, Valentine and Wohletz [1989] computed later-stage eruption column 111
development, finding that overpressure is a dominant control of whether or not column collapse 112
occurs. Woods and Bower [1995] explore the effects of rapid expansion and decompression from 113
shock waves in one-dimensional (1D) semi-analytical conduit and plume models with and 114
without a crater (Figure 2). Using computational simulations, Neri et al. [1998] show that 115
overpressured, supersonic volcanic jets accelerate vertically and expand laterally much more 116
rapidly than jets issuing at atmospheric pressure. However, the overpressure in their models is 117
based upon the degree of magma differentiation in the conduit portion of the model and therefore 118
does not allow a direct quantification of overpressure effects. Most recently, Pelanti [2005] 119
developed a numerical algorithm for modeling of high speed, compressible multiphase flows. 120
Her simulations of overpressured jets demonstrate the importance of accounting for shocks in the 121
gas-thrust region. The results of our study are compared to previous work in the discussion 122
section. 123
Although not extensively studied in volcanology, numerous experimental, analytical and 124
computational studies on overpressured supersonic jets at laboratory and machine scale have 125
yielded a wealth of information about this complicated and often counterintuitive fluid dynamics. 126
With the development of rocketry and high-speed air travel in the mid-20th century, laboratory 127

7
experiments of supersonic jets [e.g. Ladenburg et al., 1949] emerged. These experiments consist 128
of gas at high pressure expanding through a nozzle, accelerating to sonic or supersonic velocities, 129
and exiting into a quiescent chamber (or atmosphere) at lower pressure. A jet is considered 130
underexpanded if the pressure at the end of the nozzle (i.e. beginning of the atmosphere) has not 131
fully dropped to the atmospheric pressure. In other words, the ratio (K) of the pressure at the 132
vent (Pvent) to the pressure in the atmosphere (Patm) is greater than one. Similarly, jets are 133
considered overexpanded and perfectly expanded when K<1 and K=1, respectively. All three 134
kinds begin from overpressured gas chambers. Primarily, the shape of the nozzle determines the 135
final value of K at the vent. Here we use the term “overpressured” to refer only to the higher 136
pressure at the vent relative to that of the undisturbed atmosphere. 137
Various imaging techniques, including, shadowgrams, Schlieren photographs, and 138
interferograms have been used to document density variations and flow field structure within 139
experimental jets. The early experimental studies [e.g. Ladenburg et al., 1949; Lewis and 140
Carlson, 1964; Crist et al., 1966; Antsupov, 1974; Chang and Chow, 1974] provided information 141
about the general flow field (Figure 1) and empirically determined relationships between the 142
dimensions of the standing shock structures and the vent radius (rvent) , the Mach number (Mvent) 143
at the vent (i.e., the ratio of the fluid velocity, v, to the sound speed, c), the overpressure ratio (K) 144
and the isentropic expansion coefficient (i.e., the ratio of specific heats, γ) of the gas. 145
These empirical relationships determined by the experimental studies suggest a 1D 146
analytical solution for Mach disk height, prompting a number of analytical studies of 147
underexpanded jet dynamics [e.g. Adamson and Nicholls, 1959; Young, 1975; Ewan and Moodie, 148
1986]. Using first principles and some assumptions of ideal behavior, these studies verified that, 149
for a given mass flux at the vent, the Mach disk height is proportional to the vent radius and the 150

8
square root of the overpressure (as well as a limited dependence on γ). In addition to these 1D 151
solutions, semi-analytical solutions using the method of characteristics [e.g. Chang and Chow, 152
1974] have also provided information about the location and strength of shock waves in 153
underexpanded jets. These methods compare well to experimental jets in the region up to and 154
including the first Mach disk. 155
Both experimental and analytical studies of underexpanded jets have provided insight to 156
the basic fluid dynamics in this regime. However, each is limited in scope. The measurements 157
in experimental studies are strongly limited by the magnitude of velocities, the presence of shock 158
waves and temporal and spatial resolution. Analytical studies can be very applicable to the flow 159
field just downstream of the vent. However, after the first Mach disk, the flow field typically 160
becomes too turbulent for the method of characteristics [Thompson, 1972]; and the lack of 161
correlation between fluid velocities of the axial and outer regions precludes a 1D treatment 162
downstream of the first Mach disk [Chang and Chow, 1974]. 163
The limitations of analytical solutions and experimental design and measurement lead to 164
the development of computational studies of the flow dynamics of underexpanded jets [e.g. 165
Norman et al., 1982; Gribben et al., 2000; Ouellette and Hill, 2000; Li et al., 2004; Cheng and 166
Lee, 2005]. Unlike laboratory experiments, computational simulations provide spatial and 167
temporal information about the fluid flow limited only by computational power, not instrument 168
capabilities. In addition, computational simulations do not require the simplifying 169
approximations needed for analytical methods. These advantages enable computational studies 170
to focus on the more complicated aspects of the fluid dynamics, like the axial flow profile 171
downstream of the Mach disk and the turbulent entrainment and mixing of particle laden jets 172

9
[e.g. Post et al., 2000]. Of course, computational studies also have limitations, which we 173
describe in the discussion section. 174
175

10
2. Methods 175
Thirty-five time-dependent simulations of pseudogas jets expanding into ambient air 176
were produced for a range of vent radii and overpressure ratios. The simulations were performed 177
with CFDLib, a computational fluid dynamics library developed at Los Alamos National 178
Laboratory. CFDLib utilizes a finite volume computational scheme with cell-centered state 179
variables to solve the Navier-Stokes equations for multiple fluids [Kashiwa and VanderHeyden, 180
2000]. It is written in modular format and can solve a variety of computational fluid dynamics 181
problems in one-, two-, or three-dimensions. It utilizes a multiblock data structure that is highly 182
efficient when run on parallel processing supercomputers. For compressible materials, CFDLib 183
uses a variation of the Implicit Continuous-fluid Eulerian (ICE) method, developed in the late 184
1960's [Amsden and Harlow, 1968; Harlow and Amsden, 1975]. 185
Modeling supersonic turbulent flow requires a numerical technique that can resolve 186
shock waves with high precision. CFDLib employs a modified Godunov method (Godunov, 187
1999), well established as one of the best methods for this type of problem, which can resolve a 188
shock front with a small number of grid cells. The simulations we present here were performed 189
using a cylindrically symmetric two-dimensional (2D) mesh of an air filled cylinder initially at 190
rest with a pressure (Patm) and temperature (Tatm) of 101,325 Pa and 298 K, respectively (Figure 191
3). In the middle of the cylinder at the bottom we specify an inflow boundary to simulate a 192
volcanic vent. The top of the cylinder allows outflow of heat and fluid. The side and bottom 193
boundaries (excluding the vent) are impermeable, stress-free boundaries. We stop our 194
simulations when the eruptive fluid reaches the top of the cylinder, which takes between 3 and 195
125 seconds, depending on the case simulated. These simulations typically require from 15,000 196
to 200,000 numerical time steps. 197

11
In order to minimize complexity and present our results in context of previous efforts, 198
we model the eruptive fluid as a pseudogas and the atmosphere as simple diatomic gas, both 199
behaving as ideal gases. The pseudogas approximation treats the entrained particles as another 200
species of gas, remaining perfectly mixed with a vapor phase (steam) such that the two species 201
coexist in perfect thermodynamic and mechanical equilibrium. We defend the application of this 202
approximation by analysis of its required assumptions in the Discussion section that follows. 203
To fully specify the eruptive fluid as an ideal gas mixture, we determine the effective gas 204
constant (Rfluid) and the isentropic expansion coefficient (Γ). For the pseudogas approximation, 205
Rfluid = nRgas, where n is the mass fraction of volatiles in the mixture and Rgas is the gas constant 206
for the vapor phase [Kieffer, 1981]. We assume a rhyolitic magma composition with 4 w.t.% 207
aqueous fluid (Rgas=461.5 J/kgK), a mid-range value for magma volatile content [Sparks, 1997]. 208
Our eruptive fluid then has Rfluid of 18.46 J/kgK, that is, a molecular weight of 450.4 kg/kmol. 209
The isentropic expansion coefficient for a pseudogas is defined as 210
211
!
" =nCp + (1# n)Cs
nCv + (1# n)Cs
(1) 212
213
where Cp and Cv are the specific heat capacities of the gas (steam) at constant pressure and 214
volume, respectively, and Cs is the specific heat capacity of the entrained (solid) particles. We 215
use Cs = 1000 J/kgK, an average value for volcanic rock. Although Cp and Cv vary with 216
temperature and pressure, the equation is dominated by Cs. Therefore, we choose a fixed Γ of 217
1.02. Within the range of temperatures and pressures computed in our simulations, this fixed 218
value is always within less than a percent of Γ calculated with the varying Cp and Cv. The 219
physical meaning of this value of Γ is that our pseudogas behaves as an almost perfectly 220

12
isothermal gas (Γ=1), which is expected for eruptive fluids in which sufficiently small particles 221
continuously supply heat to the expanding gas [Kieffer, 1981]. 222
We assume a choked flow condition at the vent; therefore the inflow velocity is the sound 223
speed of the eruptive fluid, c=(Γ Rfluid Tvent)1/2, where Tvent is the temperature of the eruptive fluid 224
at the vent. It has been shown analytically [Young, 1975] and experimentally [Wu et al., 1999] 225
that shock dimensions in underexpanded jets do not depend on the ratio Tvent/Tatm below 226
supercritical temperatures. For all of the simulations we present here, we specify a Tvent of 227
1200K. Therefore, the inflow velocity at the vent is the same for all of our simulations, 150.3 228
m/s. 229
We perform simulations using five different vent radii (rvent): 10, 20, 40, 80, and 100 m. 230
For each rvent, we simulate seven different overpressure ratios: K = 1, 5, 10, 20, 40, 80 and 100. 231
We vary the pressure of the eruptive fluid by changing the density of the eruptive mixture 232
according to an ideal gas equation of state so that the density of the eruptive fluid at the vent 233
(ρvent) is 234
235
!
"vent =KPatm
R fluidTvent (2). 236
237
Using the values given for Rfluid, Tvent and K, we solve equation 2 for inflow densities ranging 238
from about 4.6 to 460 kg/m3 for our simulations. 239
We determine a simulation domain height and diameter (zmax and 2rmax in Figure 3) to be 240
10 times the anticipated Mach disk height, estimated with the empirical formula of Lewis and 241
Carlson [1964]. This consideration places the boundaries far enough away so they do not affect 242
the results of the simulations. These simulations are performed in the absence of gravity in order 243

13
to isolate the effects of compressibility. Future work will incrementally add complications like 244
gravity and a stratified atmosphere. 245
We use a uniform mesh with a cell size based on the simulation height. For simulation 246
heights of 0-2 km, 2-5km and 5-15km we use uniform square cells with widths of 1, 2 and 4 m, 247
respectively. We have tested the effects of smaller cell sizes on our simulations and find 248
negligible differences in the flux profiles and jet structures. 249
Because numerical diffusion is resolution dependent and the jet flow regime is dominated 250
by inertial forces, we further simplified our simulations by specifying zero viscous and thermal 251
diffusivities. For these experiments, it is easy to show that their characteristic effects are much 252
smaller than the imposed advection; setting them to typical values for the atmosphere and 253
erupting fluid produced no visible differences, but their specific parameterization is expected to 254
be important for other eruptive flow regimes. 255
Snapshots (graphical portrayal of the calculated flow field at a specific time) are 256
presented for qualitative understanding of the flow structures. All other plots are time averages 257
of the data from the final
!
45 of each simulation, which consists of the time after the 258
establishment of the steady-state barrel shock and Mach disk structures. All data presented for 259
radial profiles are taken from heights 25% higher than the time-averaged height of the Mach disk 260
for each simulation. 261
262
263

14
3. Results 263
3.1 General flow structure 264
Our simulations closely match the expected behavior of a supersonic, high-pressure jet as 265
described in Figure 1. An example of the development of this structure can be seen in the series 266
of vertical velocity snapshots in Figure 4a (within the "Analyzed region" indicated in Figure 3) 267
for the simulation of K=5 and rvent=10 m. All of our simulations begin with a compression wave 268
(bow shock) that precedes the eruptive fluid. As the fluid expands rapidly from the vent, it 269
accelerates and its pressure, density and temperature decrease. A barrel-shaped shock structure 270
develops, topped with a horizontal Mach disk. The fluid in the core of the jet crosses the Mach 271
disk, undergoing an abrupt decrease in velocity and increase in pressure, density and 272
temperature. The fluid to either side of the standing Mach disk does not experience a strong 273
shock, but flows around the Mach disk forming a high speed, turbulent sheath surrounding the 274
slow moving core. This flow field is typical of all of our overpressured simulations (K>1). For 275
comparison, Figure 4b shows snapshots of a pressure-balanced jet (K=1) with the same vent 276
radius as in Figure 4a and at the same time steps using the same color scale. Pressure-balanced 277
jets behave like incompressible fluids and do not rapidly expand at the vent. Instead, a steady 278
velocity profile persists throughout the column that mimics that of the vent. Similar velocity 279
profiles are seen in other simulations of overpressured volcanic jets [Neri et al., 1998; Ongaro 280
and Neri, 1999; Pelanti, 2005]. 281
The height of the Mach disk (hdisk) in all of our overpressured simulations (Figure 5) 282
depends linearly on vent radius (rvent) and on the square root of the overpressure ratio (K): 283
hdisk=1.7 rvent K1/2. This is consistent with analytical [Adamson and Nicholls, 1959] and 284
experimental results [Lewis and Carlson, 1964; Crist et al., 1966; Antsupov, 1974; Addy, 1981]. 285

15
Repeating barrel shock and Mach disk structures downstream of the first Mach disk appear 286
intermittently in the smaller jets (rvent<40) at lower overpressures (K<20). However, the larger 287
jets are too turbulent downstream of the first Mach disk to repeat the pattern of expansion and 288
shock formation. 289
3.2 Axial profiles 290
Although axial profiles are not adequate to describe the dynamics of the flow field, we 291
include them here for comparison to other semi-analytical methods and jet theory. The effect of 292
the Mach disk on the flow along the jet centerline can be seen in Figure 6, which shows 293
snapshots of axial profiles of velocity, density, pressure and vertical heat flux for a typical 294
overpressured simulation. The rapid expansion and acceleration of the fluid is clearly seen 295
above the vent, upstream of the Mach disk. In all overpressure cases, the pressure along the axis 296
rapidly decreases, dropping below atmospheric pressure. This overshooting of the expansion to 297
levels below atmospheric pressure during expansion is well understood, and its magnitude is 298
dependent on Mvent, K, and Γ. The fluid on the axis continues to accelerate and decompress after 299
reaching atmospheric pressure until it crosses the Mach disk. As the fluid crosses this shock 300
wave, pressure increases in a step-wise manner to something slightly higher than that of the 301
atmosphere for our eruption-scale jet simulations. At this point, the vertical velocity of the fluid 302
on the axis decreases to subsonic speeds. Along the axis, the temperature and density of the fluid 303
decrease rapidly with expansion and increase in an abrupt manner across the Mach disk. The 304
axial vertical heat flux profile below the Mach disk is dominated by the rapidly decreasing 305
density and temperature, decreasing in magnitude with height despite the increase in velocity 306
during the initial expansion. 307

16
As the fluid rapidly expands, it undergoes a large acceleration, which is dependent on 308
vvent (sonic in all of the cases presented here), K (a varied parameter), and Γ (1.02 in all cases). 309
Larger initial overpressure ratios (K) cause greater expansion and acceleration of the fluid. This 310
may seem to imply that larger overpressures result in larger vertical velocity on the axis at the 311
base of the buoyant plume. However, due to the Mach disk, the opposite occurs. The higher the 312
Mach number of any compressible fluid before passing through a shock, the stronger the shock 313
will be. That is, the more supersonic the upstream flow the more subsonic the flow is 314
downstream of the Mach disk. For a perfect gas, this relationship is governed by 315
316
!
M2
2 =2 + " #1( )M1
2
2"M1
2# " #1( )
(3) 317
318
where M1 and M2 are the Mach numbers upstream and downstream, respectively, of a 319
compressive shock front [Liepmann and Roshko, 1957]. Therefore, although counterintuitive, 320
an increase in overpressure results in a decrease in fluid velocity on the axis above the Mach disk 321
for the sonic vent conditions we have prescribed. The drop in vertical velocity across the Mach 322
disk as a function of overpressure can be seen in Figure 7. 323
3.3 Vertical heat flux distribution 324
The shock structure that develops and the resulting downstream velocity pattern 325
determine the heat and mass flux distributions in the lower part of the plume. Figure 8 shows 326
snapshots of different variables at the same times in the jet region for a typical simulation. The 327
vertical mass flux, ρvz (Figure 8.e), and the vertical advective heat flux, q& = Cp(Tfluid-Tatm)ρvz 328
(Figure 8.b), are dominated by the density (Figure 8.f) and fluid temperature (Figure 8.b) below 329
the Mach disk and by the vertical velocity (Figure 8.d) above the Mach disk. The velocity 330

17
distribution created by the standing shock structures results in an annular vertical heat flux 331
profile above the Mach disk, i.e., a slowly rising fluid in the core with little advective vertical 332
heat flux surrounded by rapidly rising fluid in a sheath that contains the bulk of the heat flow. A 333
three-dimensional representation of this annular structure is shown in Figure 9b for the case with 334
K=5 and rvent=10m. For comparison, the vertical heat flux profile at the same height for the jet 335
with K=1 with the same vent radius is shown in Figure 9a. The distinct top-hat vertical heat flux 336
profile is clearly apparent in the pressure-balanced case (Figure 9a), but is replaced by an annular 337
structure in the ovepressured jet with a minimum vertical heat flux on the axis (Figure 9b). 338
The shape and size of these annular structures depend on the vent radius and the 339
overpressure ratio. Figure 10 shows the vertical heat flux profile in radius for a slice just above 340
the Mach disk for all of our cases. As shown in Figure 10, the vertical heat flux profiles in radius 341
above the Mach disk for a given overpressure have the same basic shape and magnitude when 342
normalized to vent radius. Increasing vent radius and increasing overpressure forms wider jets 343
with thicker ring structures 344
The radius of the ring structure increases linearly with vent radius and with the square 345
root of the overpressure. Figure11 shows the radius of the peak vertical heat flux (rpeak) above the 346
Mach disk as a function of the overpressure. Our simulations suggest that, to first order, rpeak 347
goes as 348
349
!
rpeak = rventK12 . (4). 350
351

18
The radius of the Mach disk, which is controlled by the same dynamics that forms the ring 352
structure, follows this same general relationship in our simulations and in other experimental and 353
analytical studies [e.g. Crist et al., 1966; Antsupov, 1974; Addy, 1981; Cumber et al., 1995]. 354
The magnitude of the vertical heat flux in this annular profile drops off with increasing 355
overpressure. Figure 12 shows the peak vertical heat flux (
!
qpeak ) in the sheath above the Mach 356
disk as a function of overpressure for all overpressured cases. From these data, the magnitude of 357
the vertical heat flux as a function of the vent vertical heat flux (
!
qvent ) and overpressure (K) can 358
be estimated as 359
360
!
qpeak = 3qventK" 5
4 . (5) 361
Since
!
qvent increases linearly with K, the discrepancy between the commonly used parameter 362
!
qvent and the more physically relevant
!
qpeak increases with K. 363
As seen in Figure 10, the width, or thickness, of the fast moving sheath is also a function 364
of vent radius and overpressure. An approximation for this width can be made by simple 365
geometric arguments and by conserving heat flow (Figure 13). Assume that there exists some 366
equivalent ring thickness, w, such that the heat flow through the entire sheath (
!
Q, Js-1 ) at a given 367
height is 368
369
!
Q = 2"rpeakqpeakw . (6) 370
371
Since the bulk of the heat flow passes through the sheath and these simulations are relatively 372
steady in time (i.e., heat flow is conserved vertically), a good assumption is that
!
Q can be set 373
equal to the heat flow at the vent (
!
Qvent
): 374

19
375
!
Qvent = "rvent2qvent . (7) 376
377
Setting equation 6 equal to equation 7, using the empirical relationships shown in equations 4 378
and 5, and solving for w, we find 379
380
!
w = 16 rventK
34 . (8) 381
382
Thus, together, equations 4, 5 and 8 provide a first order description of the vertical heat flux 383
distribution and magnitude above the Mach disk as a function of the radius, overpressure and 384
vertical heat flux at the vent. These crude approximations do not perfectly describe the system. 385
For example, our approximation for rpeak (equation 5) is more accurate at high K and that for w is 386
more accurate at low K (equation 6). Additionally, how high into the column above the Mach 387
disk this vertical heat flux distribution persists cannot be calculated from these preliminary 388
simulations since buoyancy forces have not been included. 389
3.4 Mach disk stability 390
In addition to increasing the plume width, an increase in overpressure or vent radius 391
decreases the stability of the Mach disk. Figure 14 shows the variability (in time) of the Mach 392
disk height as a function of the average Mach disk height,
!
hdisk
, on the axis. At higher 393
overpressures and larger vent radii (i.e. higher and wider Mach disks), the Mach disk height is 394
more time-dependent, and its shape is more undulatory. A fit to the data in Figure 14 gives the 395
standard deviation (σh) of the Mach disk height to be proportional to
!
hdisk
5 / 4 . 396

20
In general, the larger jets are more chaotic and produce more turbulent eddies than the 397
smaller jets. These turbulent eddies cause more oscillation and disruption as they interact with 398
the Mach disk. The smaller, more laminar jets have cleaner annular velocity profiles (Figure 10) 399
and smaller turbulent boundary layers, which produce less interference and fewer oscillations in 400
the Mach disk. The interaction between shock fronts and turbulent shear layers is currently a 401
very active area of research as it causes noise known as jet screech in large jet engines. 402
403

21
4. Discussion 403
4.1 Implications for plume models and hazard assessment 404
The majority of volcanic plume analyses used for hazard assessment employ one-405
dimensional, semi-analytical models that assume the radial distribution of the vertical velocity 406
within the plume to be either a Gaussian or top-hat profile with the highest velocities on the 407
centerline axis. This kind of velocity profile is typically associated with incompressible or 408
pressure-balanced (K=1) jets and can be seen in Figures 4b, 9a, and 10a. The velocity profile in 409
a plume controls the magnitude of the air entrainment into the plume and therefore its maximum 410
height and stability. The maximum height of the plume, along with other factors, like rainfall 411
and horizontal wind, determines the direction and extent of the affected fallout region and the 412
amount of long-term atmospheric residence. The amount of entrainment relative to the amount 413
of heat flow also determines the stability of the column and may lead to the formation of 414
dangerous lateral flows by column collapse. 415
Our simulations of overpressured jets show that within the gas-thrust region, the vertical 416
velocity in a plume develops an annular profile, a fast rising sheath surrounding a much more 417
slowly rising core of the plume. This concentration of mass flux near the boundary of the plume 418
may entrain more of the surrounding air than would a plume with the same total heat flow but 419
with the traditional top-hat velocity profile. Consequently, predictions for column collapse and 420
plume height may also need to be revised. It is uncertain from our simulations whether or not 421
this velocity profile persists into the buoyant region of the plume. At a minimum, the annular 422
velocity profile may only affect entrainment rates within the gas-thrust region of the jet. 423
However, this annular profile may persist into the buoyant plume region (especially for large 424
overpressures), therefore affecting the dynamics of the entire column. 425

22
It has previously been suggested that the heat flux distribution within the plume may have 426
an important effect on column stability. Legros et al. [2000] suggest that the curtain jets present 427
in ring-fissure conduits increase air entrainment making the transition to column collapse more 428
difficult. In our case, the vertical heat flux distribution is controlled by the level of overpressure 429
at the vent, implying a relationship between overpressure magnitude and column height and 430
stability that will be quantified in future simulations that include a stratified atmosphere. 431
Preliminary simulations that include a stratified atmosphere and gravity have shown that high 432
resolution is necessary to capture the effects of this different vertical heat flux distribution. 433
4.2 Field application: Vent pressure estimates 434
The rapid expansion apparent in many volcanic eruptions including the Plinian eruption 435
of Mount St. Helens, May 18, 1980, suggest a sonic or supersonic overpressured vent. It may be 436
possible to use the observed plume dimensions to constrain the order of magnitude of this 437
overpressure. Since the fast moving sheath defines the outer part of the plume above the Mach 438
disk, we can use the radius of the peak vertical heat flux in this structure (rpeak) as a proxy for 439
plume radius. Equation 4 therefore provides a first-order estimate for vent overpressure based 440
on the ratio of the plume radius in the lower part of the column to the vent radius (rvent). For 441
example, for the Mount St. Helens eruption above, field data suggest rvent=60m and rpeak=500m 442
[Carey and Sigurdsson, 1985]. Therefore, assuming this eruption had a sonic vent velocity, the 443
vent pressure was at least 70 times atmospheric pressure. 444
Several uncertainties are inherent in this estimation. First, it is based on simulations 445
performed with an ideal gas approximation for a multiphase fluid. Simulations and laboratory 446
experiments with particle-laden jets show that the addition of entrained solid particles makes the 447
barrel shock structure shorter and wider [Hishida et al., 1987; Dartevelle, 2006]. Also, the 448
23
simulations presented here prescribed a Mach number of unity at the vent. Multiphase effects 449
and vent flaring may cause rapidly expanding volcanic eruptions to have higher Mach numbers 450
at the ground surface, which would lead to greater expansion for the same overpressure ratio. 451
Both of these considerations suggest that our estimate for the overpressure in the Mount St. 452
Helens eruption may be an overestimate. Volcanic eruptions are also very time-dependent. Our 453
results were obtained by fixing K and rvent and time averaging the plume dimensions. For a real 454
volcanic eruption, K and rvent vary in time. The final measured rvent may be much wider than the 455
rvent that should be associated with the observed rpeak, leading to underestimates of overpressure. 456
However, even with these complications, the relationship between plume radius and 457
overpressure ratio (equation 4) provides an order of magnitude estimate for vent overpressure 458
that may help constrain conduit and vent dynamics. 459
4.3 1D semi-analytical treatments of overpressured volcanic jets 460
Woods and Bower [1995] offer two different treatments of the expansion of eruptive 461
fluid into the atmosphere, one for “free decompression” into the atmosphere and a separate 462
treatment for decompression into a crater. Since our simulations here do not include a crater, we 463
will just consider the former. In their 1D, semi-analytical model, Woods and Bower solve for 464
the axial flow parameters above a vent based on the conservation of mass, momentum and 465
enthalpy. However, in their model, they assume that once the fluid pressure has reached 466
atmospheric, it stops decompressing. Our models, consistent with the well-established 467
underexpanded jet theory and experimentation, show that as a jet decompresses, the centerline 468
pressure decompresses well below the atmospheric pressure until reaching the Mach disk 469
(Figures 2 and 6d). Woods and Bower’s analysis claims the temperature, density, and (most 470
importantly) vertical velocity profile of their jets when they first reach atmospheric pressure 471

24
should be the inflow parameters for the buoyant plume portion of the model. The current study 472
suggests two problematic features of the previous work: 1.) the Woods and Bower model 473
suggests inflow velocities for buoyant plume models of hundreds of meters per second for 474
overpressured volcanic jets and 2.) jet decompression in their analysis takes place within the first 475
few tens of meters of an eruption column. A number of studies have used this second claim as 476
reason to ignore the effects of overpressure in their models. Our results do not support these 477
claims. The overexpansion of the fluid and subsequent velocity decrease from the Mach disk 478
actually leads to much slower axial velocities (Figure 7); and decompression can take up to 479
several kilometers for jets with large vent radii and overpressures. The height of the Mach disk 480
can be considered the minimum height necessary for decompression of an overpressured jet. 481
Our results in Figure 5 show that, for example, a jet with a vent radius of 100 m and overpressure 482
of 100 may take almost 2 km to fully decompress. This height increases with increasing 483
overpressure, vent radius and vent Mach number. Woods and Bower’s model also suggests that 484
an increase in overpressure leads to an increase in vertical heat flux (due to the increase in axial 485
velocity with overpressure). However, our models show that an increase in overpressure actually 486
leads to significantly lower vertical heat flux (Figure 12). 487
It is possible, however, to obtain more accurate estimates of the axial velocity profiles of 488
underexpanded jets using semi-analytical 1D models. For example, models based on entropy 489
arguments [e.g. Young, 1975] make very accurate predictions of the axial velocity profiles and 490
the location of the first Mach disk. However, because of the highly nonlinear turbulent flow 491
after the first Mach disk, these treatments are only valid up to the first Mach disk. Downstream 492
from the Mach disk it is necessary to make approximations for the interaction with the fast 493
moving sheath, which is not directly modeled in the equations for the axial flow. Although there 494

25
are numerous attempts at axial flow models in engineering literature [e.g. Baum, 1993], many 495
argue that 2- or 3D computational simulations are necessary to robustly capture the flow 496
dynamics downstream of the Mach disk [e.g. Cheng and Lee, 2005]. 497
4.4 Laboratory experiments 498
Using laboratory experiments of underexpanded jets as volcanic analogs also has its problems. 499
Although the linear relationships described above of the shock structures and plume dimensions 500
to vent radius suggest that dimensionality is not important, other features of underexpanded jets 501
downstream of these shocks are not directly dependent on vent radius. The fluid dynamics of the 502
area downstream of the Mach disk is highly dependent on the turbulence generated at the shear 503
layer between the fast moving sheath and the slow moving core. The level of this turbulence is 504
predicted by the Reynolds number of the jet, defined as
!
Re =UL"#1 , where L is a characteristic 505
length scale (e.g., the radius of the jet), U a characteristic velocity, and ν the viscous diffusivity 506
of the eruptive fluid. For our simulations, however, due to numerical viscosity, Re is only about 507
103-104, approximately the same order as the laboratory scale simulations of Kieffer & 508
Sturtevant [1984]. Estimates for Re for real volcanic eruptions can be greater than 1011[Kieffer 509
and Sturtevant, 1984]. Although both our simulations and laboratory experiments have much 510
smaller Reynolds numbers than estimates for real eruptions, both are at least in the turbulent 511
regime for underexpanded jets. 512
4.5 Overpressured supersonic volcanic jets in nature 513
Although the terms “supersonic” and “Mach number” intuitively suggest almost 514
prohibitively large velocities for a real volcanic eruption, they are relatively easy to achieve for 515
even lower energy eruptions due to the effects of mixtures on sound speed. Kieffer [1977] 516
shows that the speed of sound in a dusty gas is less than the speed of sound in either the 517

26
particulates or the gas itself. For eruptive fluids, sound speeds can be as low as tens of meters 518
per second [Kieffer, 1977]. Vulcanian, Strombolian, and Plininian eruptions have estimated vent 519
exit velocities ranging from tens to hundreds of meters per second [Wilson and Self, 1980], 520
which can easily be sonic or supersonic in particulate laden eruptive fluids. In the simulations 521
presented here, we chose to set the inflow velocity of our eruptive fluid to be exactly sonic, i.e. 522
choked flow, which is the appropriate boundary condition if the vent exit is the point of 523
minimum area in the conduit and the eruption is in near-steady state. The natural system is 524
almost certainly more complex with flaring vents and significant non-steady behavior. The 525
interaction between an evolving flaring vent and high-speed multiphase eruptive fluid will be the 526
topic of future work. Although we suspect a range of velocities in nature, our assumption of 527
choked flow provides a minimum vent velocity for overpressured volcanic jets that exhibit these 528
shock structures. With increasing vent velocity, the expansion and shock strength increases, and 529
we would expect more pronounced results. 530
Whether or not an eruption is overpressured, however, is far more complicated. The 531
decompression of a gas through a nozzle or conduit and vent system can result in vent exit 532
pressures that are greater than (K>1), less than (K<1), or equal (K=1) to that of the ambient 533
pressure. This vent exit pressure is dependent on a number of factors, including, but not limited 534
to, the pressure in the magma chamber, the shape of the conduit and vent, and the frictional 535
interaction with the walls. Even without the complicating factors of magma fragmentation, 536
evolution, and rheology, the pressure at the surface can be easily changed by the shape of the 537
vent. One-dimensional analysis shows that simple cone-shaped vents are capable of causing 538
decompression of the eruptive fluid before it reaches the surface [e.g. Woods and Bower, 1995], 539
and this process is also demonstrated computationally by Pelanti [2005]. In addition, 540
27
experimental studies have shown that the shape of a jet nozzle plays a role in the shape and size 541
of the barrel shock structure and position of the Mach disk [Addy, 1981]. Kieffer [1989] 542
suggested that, in explosive eruptions, the flow from sub- to supersonic conditions through the 543
vent can erode the solid host rock into a nozzle shape and size that maximize mass flux. In 544
support of Kieffer’s suggestion, preliminary CFDLib simulations of explosive eruptions 545
involving a compressible, multiphase fluid venting through a solid host rock show that the 546
conduit wall rocks do indeed erode to form a nozzle-like vent in response to the stresses 547
imposed by an overpressured jet [Wohletz et al., 2006]. Thus, the effects of an evolving vent 548
shape in solid host rock appear to be very important factors in determining the development of 549
eruption columns and our plan is to address this aspect in future work. 550
4.6 Effects of simplifications and future work 551
In addition to holding the vent radius constant in space and time, we make a number of 552
other numerical approximations in order to limit the complexity of the problem and quantify the 553
effects of only a few parameters. Here we discuss some of these simplifications and their 554
possible effects on the results. 555
Although these are time-dependent simulations, we have not attempted to truly capture 556
the time-dependent nature of volcanic eruptions. In our simulations, fluid temperature, 557
composition, velocity, pressure and density at the vent are fixed; the highly time-dependent 558
nature of the conduit and magma chamber dynamics is neglected. The importance of the 559
variability of these parameters on plume stability and structure has been previously demonstrated 560
[e.g. Neri et al., 1998]. However, by holding these inflow parameters constant, our simulations 561
have quantified the effects of vent radius and overpressure ratio alone on plume shape and 562
vertical heat flux. 563

28
A significant simplification in this study is the use of the pseudogas approximation, 564
which has been applied numerous times in volcanic literature [e.g. Kieffer and Sturtevant, 1984; 565
Woods, 1988; Suzuki et al., 2005]. One of the main assumptions of the pseudogas approximation 566
is that the entrained solid particles maintain their homogeneous distribution throughout the flow 567
field. In reality, the fluid dynamics of a multiphase mixture interacting in a supersonic 568
compressible flow with shock waves is far more complicated. A more detailed discussion is 569
beyond the scope of this paper. However, for the purposes of this study, the pseudogas 570
approximation is capable of representing the fluid dynamics to first order. Future simulations 571
will include a more robust, multiphase treatment of the eruptive fluid. 572
We also have not included gravity or a stratified atmosphere. Based on entropy balance 573
principles, this may not make a significant difference in the structure of the smaller jets. 574
However, the presence of gravity and atmospheric stratification may have an influence on the 575
shock structure in the larger jets. In addition, as the surrounding atmosphere is entrained in the 576
hot eruptive fluid the plume would become buoyant. However, in the gas-thrust region, inertia 577
dominates the flow. It is therefore unlikely that the lack of buoyancy is strongly affecting the 578
results presented here. Future simulations will follow the plume longer into a more realistic 579
atmosphere and with buoyancy. 580
Spatial resolution is limited in all computational simulations and so there is a question of 581
accuracy. We have tested the sensitivity of our results to doubling the spatial resolution in each 582
direction and have found that the values in Figures 5, 11 and 12 change by less than the errors in 583
the curve fits. 584
One of the important aspects of volcanic plume dynamics is the production of turbulent 585
eddies at the jet boundaries. These eddies are necessary for the entrainment and heating of 586

29
ambient air and are ultimately responsible for the buoyant nature of volcanic plumes. Since this 587
study is primarily concerned with the shock structures in the inertial jet region, we used no 588
subgrid-scale turbulence model. However, the generation of turbulence at the shear layers plays 589
an important role in the stability of the Mach disk. Many of the resolved eddies formed in the 590
turbulent shear layer between our slow moving core and fast moving sheath rapidly spin into the 591
standing Mach disk causing distortions of up to tens of percent of the total Mach disk height. The 592
effects of the unresolved turbulence will be investigated in the future using a subgrid-scale 593
turbulence model. 594
595

30
5. Conclusions 595
Many explosive volcanic eruptions likely involve overpressured sonic or supersonic 596
vents. The nature of these eruptions strongly depends on the rapid expansion of the fluid out of 597
the vent and the presence of standing shock structures. Studying this complex flow improves our 598
understanding of the connection between the observed plume profiles and the velocities and 599
pressures at the vent. Using our computational simulations, we quantify the effects of the ratio 600
of vent pressure to atmospheric pressure (K) on large scale overpressured (K>1) jets as follows. 601
1.) Jet decompression in volcanic plume takes place at minimum up to the height (hdisk) of the 602
standing shock wave (the Mach disk), which can be approximated as hdisk=1.7rventK1/2, where 603
rvent is the vent radius. This is a much larger portion of the plume than is assumed in most other 604
models. 605
2.) The radius of the plume (rpeak) just above the height of the first Mach disk depends on 606
overpressure and can be estimated by rpeak=rventK1/2. This relationship provides a vent pressure 607
estimate that can be made from simple visual and field observations of plume and vent radii. 608
3.) The peak vertical heat flux (
!
qpeak , Jm-2s-1) in the plume above the Mach disk is drastically 609
reduced by vent overpressure. Relative to the vertical heat flux at the vent (
!
qvent ), this effect is 610
quantified by
!
qpeak = 3qventK" 5
4 . 611
4.) The presence of standing barrel shocks and Mach disks strongly influences the distribution of 612
vertical heat flux in the lower part of the eruption column. Rather than a Gaussian or top-hat 613
profile that is typically used in plume modeling, our simulations show that the vertical heat flux 614
takes on an annular profile in the gas-thrust region after the fluid passes through the standing 615
shock waves. This profile develops because of the decrease in velocity, by two orders of 616
magnitude, in the core of the jet after it passes through the standing Mach disk. Fluid in the 617

31
outer region of the jet does not pass through a strong shock wave and therefore becomes a fast 618
moving sheath that surrounds the slow moving core. The thickness (w) of this sheath above the 619
first Mach disk can be estimated by
!
w = 16 rventK
34 . 620

32
6. Appendix: Benchmarking of CFDLib 621
We benchmark our codes by simulating well-known laboratory experiments. The 622
approach has the advantage over benchmarking against natural eruptions in that we can compare 623
specific measurable quantities related to the shock structures in overpressured jets, which are the 624
focus of our study. We compare CFDLib simulations to laboratory experiments of sonic 625
underexpanded jets using the methods of Dartevelle [2006]. We compare the height of the Mach 626
disk measured in these experiments against time-averaged values from our simulations. There 627
are a number of different laboratory experiments of overpressured jets from which to choose. 628
We use that of Lewis and Carlson [1964] who fit an empirical curve to their experiments 629
determining the relationship between overpressure ratio (K), Mach disk height (hdisk), nozzle 630
diameter (d), Mach number at the nozzle (Mvent), and isentropic expansion coefficient (γ): hdisk/d 631
= 0.69 Mvent(γK)1/2. Figure A1 shows the results from two different laboratory scale simulations 632
(symbols) and the empirical curve of Lewis and Carlson (line). In the simulations plotted as 633
diamonds, we use a two-dimensional cylindrically symmetric mesh with heights ten times that of 634
the Mach disk and 5 times the Mach disk height in radius. The mesh consists of evenly 635
distributed square grid cells with height and widths of 2x10⁻⁴m. The simulations plotted as stars 636
are twice the resolution but half the mesh height. For all of our benchmarking simulations, we 637
use air (γ=1.4) as the ambient fluid in the box and the jet fluid and set the inflow velocity to be 638
just sonic (Mvent=1). We specify the same temperature for the inflow temperature as the ambient 639
fluid. 640
To within 10%, the heights of the Mach disk predicted by our simulations match those 641
measured by Lewis & Carlson. In general, our simulations overpredict the Mach disk height 642
slightly. For the purposes of this study, however, we consider the level of this match appropriate 643

33
as there are many complications to this kind of benchmark. First, it is never possible to exactly 644
simulate a laboratory experiment. For example, our simulations use a flat inflow boundary with 645
a top-hat velocity profile in radius at the vent to represent the nozzle in the experiments. It is 646
unlikely that the fluid in the experiment has a consistent velocity that neglects drag along the 647
nozzle walls. In addition, the exact shape of the nozzle is known to change the height of the first 648
Mach disk [Addy, 1981]. Since we are not taking nozzle shape into consideration in these 649
preliminary simulations, some error is introduced here. As with all comparisons to laboratory 650
data, it is important to keep in mind that although simulations afford almost complete spatial and 651
temporal coverage of the system, laboratory data is often dependent on snapshots of often 652
difficult to measure data. In our benchmark, we have chosen to use an empirical formula based 653
on numerous experiments and time averages of our own simulations to help limit the 654
discrepancies that come from comparing snapshots of data. 655
656

34
Acknowledgments 656
Support for this research has been provided by a grant (Astro-1716-07) from the Institute of 657
Geophysics and Planetary Physics, Los Alamos National Laboratory. Computing resources have 658
been provided by an NSF/MRI grant and by a NASA High End Computing allocation. 659
660

35
Adamson, T.C., and J.A. Nicholls, On the structure of jets from highly underexpanded nozzles 660
into still air, J. Aero/Space Sci., 26 (1), 16-24, 1959. 661
Addy, A.L., Effects of axisymmetric sonic nozzle geometry on Mach disk characteristics, AIAA 662
Journal, 19 (1), 121-122, 1981. 663
Amsden, A.A., and F.H. Harlow, Numerical calculation of almost incompressible flows, J. 664
Comput. Phys., 3, 80-93, 1968. 665
Antsupov, A.V., Properties of underexpanded and overexpanded supersonic gas jets, Soviet 666
Phys. Tech. Phys., 19 (2), 234-238, 1974. 667
Baum, M.R., Velocity of a single small missile ejected from a vessel containing high-pressure 668
gas, J. Loss Prevention in the Process Industries, 6 (4), 251-264, 1993. 669
Carey, S., and H. Sigurdsson, The May 18, 1980 eruption of Mount St-Helens .2. Modeling of 670
dynamics of the Plinian phase, J. Geophys. Res., 90 (NB4), 2948-2958, 1985. 671
Chang, I.S., and W.L. Chow, Mach disk from underexpanded axisymmetric nozzle flow, AIAA 672
Journal, 12 (8), 1079-1082, 1974. 673
Cheng, T.S., and K.S. Lee, Numerical simulations of underexpanded supersonic jet and free 674
shear layer using WENO schemes, Int. J. Heat Fluid Flow, 26 (5), 755-770, 2005. 675
Crist, S., P.M. Sherman, and D.R. Glass, Study of the highly underexpanded sonic jet, AIAA 676
Journal, 4 (1), 68-71, 1966. 677
Cumber, P.S., M. Fairweather, S. Falle, and J.R. Giddings, Predictions of the structure of 678
turbulent, highly underexpanded jets, J. Fluids Engineering-Transactions of the ASME, 679
117 (4), 599-604, 1995. 680
Dartevelle, S., Verification and Validation (V&V) Methodologies for Multiphase Turbulent and 681
Explosive Flows. V&V Case Studies of Computer Simulations from Los Alamos 682
36
National Laboratory GMFIX codes, Abstract V43C-1821, Eos, 87(52), 2006. 683
Dobran, F., Nonequilibrium-flow in volcanic conduits and application to the eruptions of Mt St-684
Helens on May 18, 1980, and Vesuvius in AD 79, J. Volcanology Geotherm. Res., 49 (3-685
4), 285-311, 1992. 686
Ewan, B.C.R., and K. Moodie, Structure and Velocity-Measurements in Underexpanded Jets, 687
Combustion Sci. Tech., 45 (5-6), 275-288, 1986. 688
Gribben, B.J., K.J. Badcock, and B.E. Richards, Numerical study of shock-reflection hysteresis 689
in an underexpanded jet, AIAA Journal, 38 (2), 275-283, 2000. 690
Harlow, F.H., and A.A. Amsden, Multifluid flow calculations at all Mach numbers, J. Comp. 691
Phys., 16, 1-19, 1975. 692
Hishida, K., K. Takemoto, and M. Maeda, Turbulence characteristics of gas-solids two-phase 693
confined jet (effect of particle density), Japanese J. Multiphase Flow, 1, 56-68, 1987. 694
Kashiwa, B.A., and W.B. VanderHeyden, Toward a general theory for multiphase turbulence 695
Part I: Development and gauging of the model equations, in Los Alamos National 696
Laboratory Report, pp. 88, Los Alamos National Laboratory, Los Alamos, NM, 2000. 697
Kieffer, S.W., Sound speed in liquid-gas mixtures - water-air and water-steam, J. Geophys. Res., 698
82 (20), 2895-2904, 1977. 699
Kieffer, S.W., Blast dynamics at Mount St-Helens on 18 May 1980, Nature, 291 (5816), 568-700
570, 1981. 701
Kieffer, S.W., Fluid dynamics and thermodynamics of Ionian volcanism, in Satellites of Jupiter, 702
edited by D. Morrison, and M.S. Matthews, University of Arizona Press, Tucson, Ariz., 703
1982. 704
Kieffer, S.W., Geologic nozzles, Rev. Geophys., 27 (1), 3-38, 1989. 705

37
Kieffer, S.W., and B. Sturtevant, Laboratory studies of volcanic jets, J. Geophys. Res., 89 706
(NB10), 8253-8268, 1984. 707
Ladenburg, R., C.C. Van Voorhis, and J. Winckler, Interferometric studies of faster than sound 708
phenomena. Part II. Analysis of supersonic air jets, Phys. Rev., 76 (5), 662-677, 1949. 709
Legros, F., K. Kelfoun, and J. Marti, The influence of conduit geometry on the dynamics of 710
caldera-forming eruptions, Earth Planet. Sci. Lett., 179 (1), 53-61, 2000. 711
Lewis, C.H.J.R., and D.J. Carlson, Normal shock location in underexpanded gas and gas-particle 712
jets, AIAA Journal, 2 (4), 776-777, 1964. 713
Li, Y., A. Kirkpatrick, C. Mitchell, and B. Willson, Characteristic and computational fluid 714
dynamics modeling of high-pressure gas jet injection, J. Engineering for Gas Turbines 715
and Power-Trans. ASME, 126 (1), 192-197, 2004. 716
Liepmann, H.W., and A. Roshko, Elements of Gasdynamics, 439 pp., Wiley, New York, 1957. 717
Macedonio, G., F. Dobran, and A. Neri, Erosion processes in volcanic conduits and application 718
to the AD 79 eruption of Vesuvius, Earth Planet. Sci. Lett., 121 (1-2), 137-152, 1994. 719
Mastin, L.G., A user-friendly one-dimensional model for wet volcanic plumes, Geochem. 720
Geophys. Geosys., 8, 2007. 721
Morton, B.R., G. Taylor, and J.S. Turner, Turbulent gravitational convection from maintained 722
and instantaneous sources, Proceedings of the Royal Society of London. Series A, 723
Mathematical and Physical Sciences, 234 (1196), 1-23, 1956. 724
Neri, A., T.E. Ongaro, G. Menconi, M.D. Vitturi, C. Cavazzoni, G. Erbacci, and P.J. Baxter, 4D 725
simulation of explosive eruption dynamics at Vesuvius, Geophys. Res. Lett., 34 (4), 2007. 726
Neri, A., P. Papale, and G. Macedonio, The role of magma composition and water content in 727
explosive eruptions: 2. Pyroclastic dispersion dynamics, J. Volcan. Geotherm. Res., 87 728

38
(1-4), 95-115, 1998. 729
Norman, M.L., L. Smarr, K.H.A. Winkler, and M.D. Smith, Structure and dynamics of 730
supersonic jets, Astron. Astrophys., 113 (2), 285-302, 1982. 731
Ongaro, T.E., and A. Neri, Flow patterns of overpressured volcanic jets, in European 732
Geophysical Society, XXIV General Assembly, The Hague, 1999. 733
Ouellette, P., and P.G. Hill, Turbulent transient gas injections, J. Fluids Engineering-Trans. 734
ASME, 122 (4), 743-752, 2000. 735
Papale, P., A. Neri, and G. Macedonio, The role of magma composition and water content in 736
explosive eruptions - 1. Conduit ascent dynamics, J. Volcan. Geotherm. Res., 87 (1-4), 737
75-93, 1998. 738
Pelanti, M., Wave propagation algorithms for multicomponent compressible flows with 739
applications to volcanic jets, Doctor of Philosophy thesis, University of Washington, 740
Seattle, Washington, 2005. 741
Post, S., V. Iyer, and J. Abraham, A study of near-field entrainment in gas jets and sprays under 742
diesel conditions, J. Fluids Engineering-Trans. ASME, 122 (2), 385-395, 2000. 743
Sparks, R.S.J., Volcanic plumes, xii, 574 pp., Wiley, Chichester ; New York, 1997. 744
Sparks, R.S.J., M.C. Gardeweg, E.S. Calder, and S.J. Matthews, Erosion by pyroclastic flows on 745
Lascar volcano, Chile, Bull. Volcan., 58 (7), 557-565, 1997. 746
Suzuki, Y.J., T. Koyaguchi, M. Ogawa, and I. Hachisu, A numerical study of turbulent mixing in 747
eruption clouds using a three-dimensional fluid dynamics model, J. Geophys. Res., 110 748
(B8), 2005. 749
Thompson, P.A., Compressible-Fluid Dynamics, xvii, 665 pp., McGraw-Hill, New York, 1972. 750
Valentine, G., Eruption column physics, in From Magma to Tephra : Modeling Physical 751

39
Processes of Explosive Volcanic Eruptions, edited by A. Freundt, and M. Rosi, pp. 318, 752
Elsevier, Amsterdam ; New York, 1998. 753
Valentine, G.A., and K.R. Groves, Entrainment of country rock during basaltic eruptions of the 754
Lucero volcanic field, New Mexico, J. Geology, 104 (1), 71-90, 1996. 755
Valentine, G.A., and K.H. Wohletz, Numerical-models of Plinian eruption columns and 756
pyroclastic flows, J. Geophys. Res., 94 (B2), 1867-1887, 1989. 757
Wilson, L., Explosive volcanic eruptions; III, Plinian eruption columns, Geophys. J. Roy. Astron. 758
Soc., 45 (3), 543-556, 1976. 759
Wilson, L., and S. Self, Volcanic explosion clouds; density, temperature, and particle content 760
estimates from cloud motion, J. Geophys. Res., 85 (B5), 2567-2572, 1980. 761
Wilson, L., R.S.J. Sparks, T.C. Huang, and N.D. Watkins, Control of volcanic column heights by 762
eruption energetics and dynamics, J. Geophys. Res., 83 (NB4), 1829-1836, 1978. 763
Wohletz, K.H., T.R. McGetchin, M.T. Sandford, and E.M. Jones, Hydrodynamic aspects of 764
caldera-forming eruptions - Numerical-models, J. Geophys. Res., 89 (NB10), 8269-8285, 765
1984. 766
Wohletz, K.H., D.E. Ogden, and G.A. Glatzmaier, Preliminary numerical simulations of nozzle 767
formation in the host rock of supersonic volcanic jets, Abstract V41C-1748, Eos, 87(52), 768
2006. 769
Woods, A.W., The fluid dynamics and thermodynamics of eruption columns, Bull. Volcan., 50 770
(3), 169-193, 1988. 771
Woods, A.W., The dynamics of explosive volcanic-eruptions, Rev. Geophs., 33 (4), 495-530, 772
1995. 773
Woods, A.W., Observations and models of volcanic eruption columns, in The Physics of 774

40
Explosive Volcanic Eruptions, edited by J.S. Gilbert, and R.S.J. Sparks, pp. 186, 775
Geological Society, London, 1998. 776
Woods, A.W., and S.M. Bower, The decompression of volcanic jets in a crater during explosive 777
volcanic eruptions, Earth Planet. Sci. Lett., 131 (3-4), 189-205, 1995. 778
Wu, P.K., M. Shahnam, K.A. Kirkendall, C.D. Carter, and A.S. Nejad, Expansion and mixing 779
processes of underexpanded supercritical fuel jets injected into superheated conditions, J. 780
Propulsion Power, 15 (5), 642-649, 1999. 781
Young, W.S., Derivation of free-jet Mach-disk location using entropy-balance principle, Phys. 782
Fluids, 18 (11), 1421-1425, 1975. 783
784

41
Figure 1. Schematic underexpanded jet. As fluid flows from a nozzle at sonic velocities with 784
a pressure that is greater than the atmospheric pressure (a), the fluid undergoes Prandtl-Meyer 785
expansion, rapidly accelerating to high Mach numbers (b, c) and decreasing in pressure and 786
density. A continuous series of expansion waves form at the nozzle exit (d), which are reflected 787
as compression waves from the free surface at the jet flow boundary (e). These compression 788
waves coalesce to form a barrel shock (f) roughly parallel to the flow, and a standing shock wave 789
called a Mach disk (g) perpendicular to the flow. The high Mach number fluid crossing the 790
Mach disk undergoes an abrupt decrease in velocity to subsonic speeds (j), and increases in 791
pressure and density. The resulting fluid dynamics after the Mach disk consist of a slow moving 792
(subsonic) core surrounded by a fast moving (supersonic) shell with a turbulent eddy producing 793
shear layer, or slip line (i), dividing these regions. The length scales of this structure are 794
dependent on the nozzle diameter and the ratio of the inflow pressure to the ambient pressure and 795
are weakly dependent on the isentropic expansion coefficient of the fluid. [Thompson, 1972] 796
797
Figure 2. Schematic axial profiles of pressure and vertical velocity for an overpressured 798
supersonic jet. Jets with vent velocities of sonic or greater speeds and vent pressures greater 799
than atmospheric rapidly expand into the atmosphere, resulting in decompression and 800
acceleration (dashed lines). The axial pressure overshoots the atmospheric pressure. The fluid 801
continues accelerating until crossing the Mach disk where it decelerates to speeds below sonic 802
and increases pressure to roughly that of the atmosphere. For comparison, the dotted lines show 803
the approximation of Woods and Bower [1995] for free-jet decompression, which assumes that 804
expansion ends when the fluid reaches atmospheric pressure and no shock wave is present. Their 805
treatment results in axial velocities at the base of the plume that are orders of magnitude greater 806

42
than those predicted by overpressured jet theory. The vertical velocity within the plume in the 807
Woods & Bower model is assumed to be independent of the distance from the jet axis. In 808
contrast, the vertical velocity within an overpressured supersonic jet varies with distance from 809
the axis. Above the Mach disk, it is minimum on the axis and peaks near the outer boundary of 810
the plume. 811
812
Figure 3. Simulation design. Thirty-five time dependent simulations of overpressured volcanic 813
jets were run with CFDLib in a 2D cylindrical mesh with an axis of symmetry passing through 814
the jet centerline. We begin with a cylinder of air at rest and specify an outflow condition at the 815
top of the box, a small inflow boundary representing the vent at the base, and free-slip 816
boundaries everywhere else. An inflow of pseudogas at sonic speeds is specified at the base. 817
The simulations consist of seven different overpressure values at the vent (K = 1, 5, 10, 20, 40, 818
80, and 100), and five different vent radii (rvent = 10, 20, 40, 80, and 100m). The height (zmax) 819
and width (rmax) of the mesh are ten and five times the expected height of the first Mach disk, 820
respectively. We present data from the small subsection of the total mesh, the “analyzed region”, 821
in the remainder of this paper. 822
823
Figure 4. Vertical velocity snapshots for overpressured (a) and pressure balanced (b) jets. 824
These simulations highlight the difference in velocity profile between a jet erupting at 825
atmospheric pressure (b) and one undergoing rapid expansion from a modest overpressure of 5 826
times atmospheric (a). Both simulations have vent radii of 10 m. The snapshots are at the same 827
times for both simulations: 0.0625, 0.125, 0.21875, 0.3125, 0.4375, and 3.0 seconds. The full 828

43
velocity vectors are included at every 5 grid cells. The same color and vector length scale is 829
used for both simulations. The area shown is a subsection of the entire mesh just above the vent. 830
831
Figure 5. Mach disk height as a function of overpressure for all overpressured simulations. 832
The time averaged Mach disk height on the jet axis normalized to vent radius is shown to be 833
directly dependent on the square root of the overpressure. Symbols are simulation data. Solid 834
curve is the analytical expression and not a best-fit curve. The overprediction at large values of 835
K is likely due to the Mach disk being pushed downward by turbulent eddies produced at high 836
overpressures. 837
838
Figure 6. Snapshots of axial profiles of pressure, vertical velocity, density, and vertical heat 839
flux for a typical overpresured simulation. These snapshots from a simulation with rvent=40 m 840
and K=20 clearly show the rapid expansion of the gas to pressure values well below atmospheric 841
before returning to approximately atmospheric values after the Mach disk. The stepwise change 842
in vertical velocity and pressure as the fluid crosses the shock wave can be seen in (a) and (d). 843
These snapshots show only a small portion of the total mesh just above the vent as the mesh 844
extends to 2.5 km. 845
846
Figure 7. Time-averaged decrease in vertical velocity across the Mach disk on the axis as a 847
function of overpressure for all overpressured simulations. As discussed in the text, 848
increasing overpressure increases axial velocities resulting in stronger Mach disk shocks and a 849
greater decrease in velocity across the shock. 850
851

44
Figure 8. Snapshots of volume fraction eruptive fluid (a), vertical heat flux (b), 852
temperature (c), vertical velocity (d), vertical mass flux (e), and density (f) for a typical 853
overpressured simulation. The vertical velocity profile clearly has a larger influence on the 854
vertical heat flux profile than the temperature, density, or fluid distribution. The turbulent nature 855
of the simulations can also be seen. Snapshots are of area of interest at t=20s for the jet with 856
rvent=40m and K=20. 857
858
Figure 9. 3D visualization of time-averaged top hat (a) and annular (b) vertical heat flux 859
profiles above the Mach disk rotated about the z-axis. x- and y-axes are horizontal spatial 860
axes extrapolated from radial profile. Shading and grid scale the same for both simulations. Fig. 861
(a), a top-hat profile vertical heat flux profile of simulation rvent=10m and K=1, is the expected 862
profile for K=1 or incompressible fluids. Fig. (b), an annular vertical heat flux profile of 863
simulation rvent=10m and K=5, is typical of all simulations with K>1. Note the hollow center in 864
(b) and flat top of (a). The heat flux relative to the vent heat flux in overpressured jets (b) is 865
lower than that of pressure balanced jets due to the increased area of the plume. 866
867
Figure 10. Time-averaged vertical heat flux above the Mach disk as a function of distance 868
from the jet centerline for all simulations. Vertical heat flux (q& , Jm-2s-1) above the Mach disk 869
as a function of distance from the jet centerline (r) normalized to the vent radius (rvent). Each 870
frame is a different overpressure value showing the shape of the heat profile is a function of 871
overpressure. The increasing radius of the peak heat flux and the decrease in heat flux with 872
increasing overpressure are shown in Figures 11 and 12, respectively. (Note that the density and 873
therefore the heat flux at the vent increases directly with overpressure. Therefore, the apparent 874

45
increase in heat flux between K=1 and K=5 is actually due to the increase in heat flux at the vent. 875
Figure 9 shows these same profiles normalized to vent heat flux.) 876
877
Figure 11. Time-averaged radius of peak vertical heat flux above the Mach disk for all 878
overpressured simulations. The distance of the peak vertical heat flux can be seen as a proxy 879
for plume width in these overpressured jets. The plume width increases linearly with vent radius 880
and the square root of the overpressure. The values plotted here are the radial values under the 881
peaks of the curves in Figure 10. Symbols are simulation data. Line corresponds to only to the 882
equation shown which represents the data trend but is not a calculated curve fit. 883
884
Figure 12. Time-averaged peak vertical heat flux above the Mach disk for all 885
overpressured simulations. (a) The peak vertical heat flux in the plume above the Mach disk 886
is severely decreased by the overpressure as the greater expansion spreads the jet over a greater 887
area. (b) qpeak is normalized to qvent in order to account for the increase in qvent with K. Symbols 888
are simulation data. Line corresponds to only to the equation shown which represents the data 889
trend but is not a calculated curve fit. 890
891
Figure 13. Schematic change in vertical heat flux profile. An illustration showing the 892
geometry of the vertical heat flux distribution at the vent (a) and above the Mach disk (b). As 893
described in the text, by empirical fit to our data and simple geometric analysis, the shape and 894
magnitude of the vertical heat flux distribution above the Mach disk as a function of 895
overpressure, vent radius, and vent vertical heat flux can be described by the three equations 896
given. 897

46
898
Figure 14. Standard deviation (σh) of Mach disk height on the axis as a function of average 899
Mach disk height for all overpressured simulations. Oscillations in Mach disk height are 900
common in overpressured jets and increase with increasing height of the Mach disk. This 901
phenomenon is related to the larger shear layers produced in larger jets and their interaction with 902
the Mach disk. This turbulence production can be quantified by the Reynolds number, which, 903
for these simulations is of the order 104. Symbols are simulation data. Line corresponds to only 904
to the equation shown which represents the data trend but is not a calculated curve fit. 905
906
Figure A1. Positive results of benchmark simulations of laboratory underexpanded jets. 907
Simulations based on the laboratory experiments of Lewis and Carlson [1964]. Line is a curve fit 908
of the empirical equation determined by Lewis and Carlson. Diamonds are time averaged data 909
from our simulations of air jets at the same scale and inflow velocity. Stars are simulation results 910
at higher resolution but smaller mesh height and width. Diamond simulations have a mesh that 911
is scaled to the Mach disk height in a similar way to the large scale jets. 912
913

47
913 Figure 1. Schematic underexpanded jet. As fluid flows from a nozzle at sonic velocities with 914 a pressure that is greater than the atmospheric pressure (a), the fluid undergoes Prandtl-Meyer 915 expansion, rapidly accelerating to high Mach numbers (b, c) and decreasing in pressure and 916 density. A continuous series of expansion waves form at the nozzle exit (d), which are reflected 917 as compression waves from the free surface at the jet flow boundary (e). These compression 918 waves coalesce to form a barrel shock (f) roughly parallel to the flow, and a standing shock wave 919 called a Mach disk (g) perpendicular to the flow. The high Mach number fluid crossing the 920 Mach disk undergoes an abrupt decrease in velocity to subsonic speeds (j), and increases in 921 pressure and density. The resulting fluid dynamics after the Mach disk consist of a slow moving 922 (subsonic) core surrounded by a fast moving (supersonic) shell with a turbulent eddy producing 923 shear layer, or slip line (i), dividing these regions. The length scales of this structure are 924 dependent on the nozzle diameter and the ratio of the inflow pressure to the ambient pressure and 925 are weakly dependent on the isentropic expansion coefficient of the fluid. [Thompson, 1972] 926
927

48
927 Figure 2. Schematic axial profiles of pressure and vertical velocity for an overpressured 928 supersonic jet. Jets with vent velocities of sonic or greater speeds and vent pressures greater 929 than atmospheric rapidly expand into the atmosphere, resulting in decompression and 930 acceleration (dashed lines). The axial pressure overshoots the atmospheric pressure. The fluid 931 continues accelerating until crossing the Mach disk where it decelerates to speeds below sonic 932 and increases pressure to roughly that of the atmosphere. For comparison, the dotted lines show 933 the approximation of Woods and Bower [1995] for free-jet decompression, which assumes that 934 expansion ends when the fluid reaches atmospheric pressure and no shock wave is present. Their 935 treatment results in axial velocities at the base of the plume that are orders of magnitude greater 936 than those predicted by overpressured jet theory. The vertical velocity within the plume in the 937 Woods & Bower model is assumed to be independent of the distance from the jet axis. In 938 contrast, the vertical velocity within an overpressured supersonic jet varies with distance from 939 the axis. Above the Mach disk, it is minimum on the axis and peaks near the outer boundary of 940 the plume. 941
942 943

49
943 Figure 3. Simulation design. Thirty-five time dependent simulations of overpressured volcanic 944 jets were run with CFDLib in a 2D cylindrical mesh with an axis of symmetry passing through 945 the jet centerline. We begin with a cylinder of air at rest and specify an outflow condition at the 946 top of the box, a small inflow boundary representing the vent at the base, and free-slip 947 boundaries everywhere else. An inflow of pseudogas at sonic speeds is specified at the base. 948 The simulations consist of seven different overpressure values at the vent (K = 1, 5, 10, 20, 40, 949 80, and 100), and five different vent radii (rvent = 10, 20, 40, 80, and 100m). The height (zmax) 950 and width (rmax) of the mesh are ten and five times the expected height of the first Mach disk, 951 respectively. We present data from the small subsection of the total mesh, the “analyzed region”, 952 in the remainder of this paper. 953
954

50
Overpressured jet (K=5) 954
955
956 957
Pressure balanced jet (K=1) 958
959
960 961
962 963 Figure 4. Vertical velocity snapshots for overpressured (a) and pressure balanced (b) jets. 964 These simulations highlight the difference in velocity profile between a jet erupting at 965

51
atmospheric pressure (b) and one undergoing rapid expansion from a modest overpressure of 5 966 times atmospheric (a). Both simulations have vent radii of 10 m. The snapshots are at the same 967 times for both simulations: 0.0625, 0.125, 0.21875, 0.3125, 0.4375, and 3.0 seconds. The full 968 velocity vectors are included at every 5 grid cells. The same color and vector length scale is 969 used for both simulations. The area shown is a subsection of the entire mesh just above the vent.970

52
971 Figure 5. Mach disk height as a function of overpressure for all overpressured simulations. 972 The time averaged Mach disk height on the jet axis normalized to vent radius is shown to be 973 directly dependent on the square root of the overpressure. Symbols are simulation data. Solid 974 curve is the analytical expression and not a best-fit curve. The overprediction at large values of 975 K is likely due to the Mach disk being pushed downward by turbulent eddies produced at high 976 overpressures. 977
978

53
978
979 Figure 6. Snapshots of axial profiles of pressure, vertical velocity, density, and vertical heat 980 flux for a typical overpresured simulation. These snapshots from a simulation with rvent=40 m 981 and K=20 clearly show the rapid expansion of the gas to pressure values well below atmospheric 982 before returning to approximately atmospheric values after the Mach disk. The stepwise change 983 in vertical velocity and pressure as the fluid crosses the shock wave can be seen in (a) and (d). 984 These snapshots show only a small portion of the total mesh just above the vent as the mesh 985 extends to 2.5 km. 986
987

54
987 Figure 7. Time-averaged decrease in vertical velocity across the Mach disk on the axis as a 988 function of overpressure for all overpressured simulations. As discussed in the text, 989 increasing overpressure increases axial velocities resulting in stronger Mach disk shocks and a 990 greater decrease in velocity across the shock. 991
992

55
(a) (b) 992 993
(c) (d) 994 995
(e) (f) 996

56
Figure 8. Snapshots of volume fraction eruptive fluid (a), vertical heat flux (b), 997 temperature (c), vertical velocity (d), vertical mass flux (e), and density (f) for a typical 998 overpressured simulation. The vertical velocity profile clearly has a larger influence on the 999 vertical heat flux profile than the temperature, density, or fluid distribution. The turbulent nature 1000 of the simulations can also be seen. Snapshots are of area of interest at t=20s for the jet with 1001 rvent=40m and K=20. 1002
1003

57
1003 Pressure balanced jet (K=1) Overpressured jet (K=5) 1004
Figure 9. 3D visualization of time-averaged top hat (a) and annular (b) vertical heat flux 1005 profiles above the Mach disk rotated about the z-axis. x- and y-axes are horizontal spatial 1006 axes extrapolated from radial profile. Shading and grid scale the same for both simulations. Fig. 1007 (a), a top-hat profile vertical heat flux profile of simulation rvent=10m and K=1, is the expected 1008 profile for K=1 or incompressible fluids. Fig. (b), an annular vertical heat flux profile of 1009 simulation rvent=10m and K=5, is typical of all simulations with K>1. Note the hollow center in 1010 (b) and flat top of (a). The heat flux relative to the vent heat flux in overpressured jets (b) is 1011 lower than that of pressure balanced jets due to the increased area of the plume. 1012
1013

58
1013

59
Figure 10. Time-averaged vertical heat flux above the Mach disk as a function of distance 1014 from the jet centerline for all simulations. Vertical heat flux (q& , Jm-2s-1) above the Mach disk 1015 as a function of distance from the jet centerline (r) normalized to the vent radius (rvent). Each 1016 frame is a different overpressure value showing the shape of the heat profile is a function of 1017 overpressure. The increasing radius of the peak heat flux and the decrease in heat flux with 1018 increasing overpressure are shown in Figures 11 and 12, respectively. (Note that the density and 1019 therefore the heat flux at the vent increases directly with overpressure. Therefore, the apparent 1020 increase in heat flux between K=1 and K=5 is actually due to the increase in heat flux at the vent. 1021 Figure 9 shows these same profiles normalized to vent heat flux.) 1022
1023
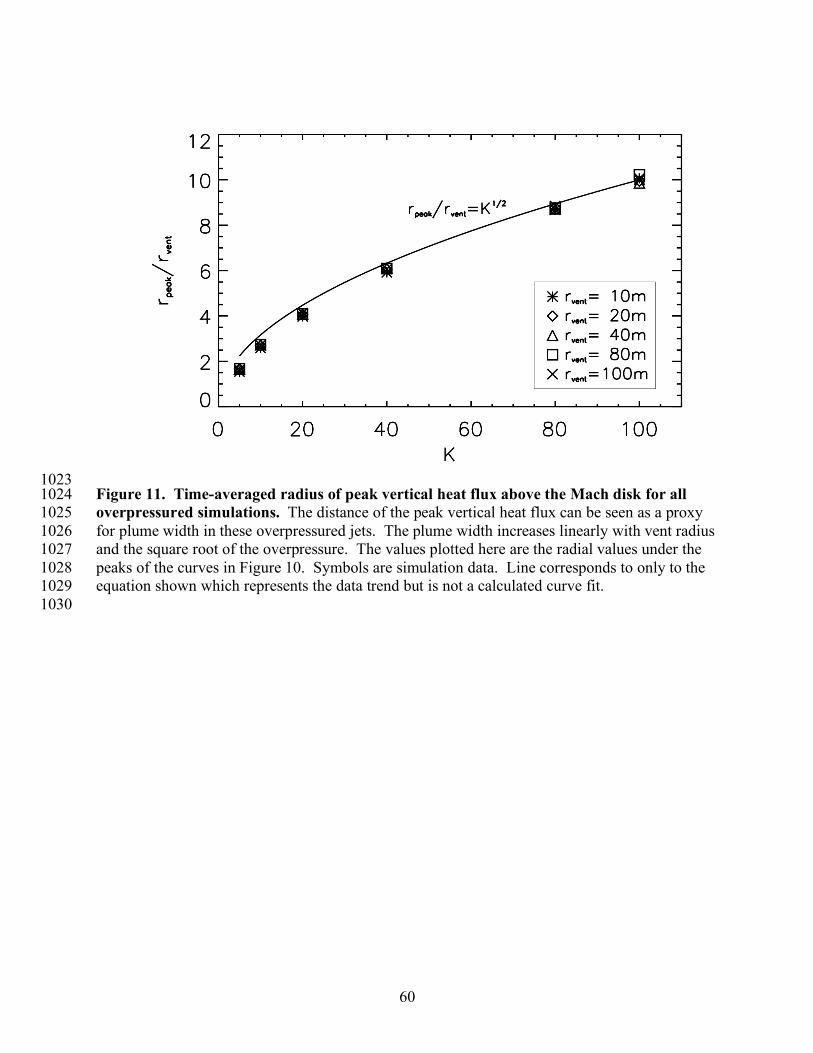
60
1023 Figure 11. Time-averaged radius of peak vertical heat flux above the Mach disk for all 1024 overpressured simulations. The distance of the peak vertical heat flux can be seen as a proxy 1025 for plume width in these overpressured jets. The plume width increases linearly with vent radius 1026 and the square root of the overpressure. The values plotted here are the radial values under the 1027 peaks of the curves in Figure 10. Symbols are simulation data. Line corresponds to only to the 1028 equation shown which represents the data trend but is not a calculated curve fit. 1029
1030

61
1030 Figure 12. Time-averaged peak vertical heat flux above the Mach disk for all 1031 overpressured simulations. (a) The peak vertical heat flux in the plume above the Mach disk 1032 is severely decreased by the overpressure as the greater expansion spreads the jet over a greater 1033 area. (b) qpeak is normalized to qvent in order to account for the increase in qvent with K. Symbols 1034 are simulation data. Line corresponds to only to the equation shown which represents the data 1035 trend but is not a calculated curve fit. 1036
1037

62
1037
Figure 13. Schematic change in vertical heat flux profile. An illustration showing the 1038 geometry of the vertical heat flux distribution at the vent (a) and above the Mach disk (b). As 1039 described in the text, by empirical fit to our data and simple geometric analysis, the shape and 1040 magnitude of the vertical heat flux distribution above the Mach disk as a function of 1041 overpressure, vent radius, and vent vertical heat flux can be described by the three equations 1042 given. 1043
1044

63
1044
1045
Figure 14. Standard deviation (σh) of Mach disk height on the axis as a function of average 1046 Mach disk height for all overpressured simulations. Oscillations in Mach disk height are 1047 common in overpressured jets and increase with increasing height of the Mach disk. This 1048 phenomenon is related to the larger shear layers produced in larger jets and their interaction with 1049 the Mach disk. This turbulence production can be quantified by the Reynolds number, which, 1050 for these simulations is of the order 104. Symbols are simulation data. Line corresponds to only 1051 to the equation shown which represents the data trend but is not a calculated curve fit. 1052
1053

64
1053
1054 Figure A1. Positive results of benchmark simulations of laboratory underexpanded jets. 1055 Simulations based on the laboratory experiments of Lewis and Carlson [1964]. Line is a curve fit 1056 of the empirical equation determined by Lewis and Carlson. Diamonds are time averaged data 1057 from our simulations of air jets at the same scale and inflow velocity. Stars are simulation results 1058 at higher resolution but smaller mesh height and width. Diamond simulations have a mesh that 1059 is scaled to the Mach disk height in a similar way to the large scale jets. 1060