Embed Size (px)
Citation preview

Advances in Chemical Engineering and Science, 2017, 7, 34-44 http://www.scirp.org/journal/aces
ISSN Online: 2160-0406 ISSN Print: 2160-0392
DOI: 10.4236/aces.2017.71004 December 21, 2016
Numerical Simulation for Hot Dry Rock Geothermal Well Temperature Field
Hao Yang1, Yuan Shao2
1China University of Geosciences, Beijing, China 2Oil & Gas Technology Research Institute, Petrochina Changqing Oilfield Company, Xi’an, China
Abstract Study on temperature distribution simulation during cementing of hot dry rock (HDR) geothermal well is rare. It has important guiding significance to simulate the construction process of temperature distribution of hot dry rock on site construction. Based on numerical simulation of HDR considering heat-fluid-solid coupling, the in-fluence of temperature distribution on well cementing is analyzed when the drilling fluid cycles and reaches stable state, respectively, and when the cement slurry is in-jected during the cementing process. It is found that the seepage at the well bottom accelerates the flow velocity of wellbore; the stable temperature change is less than the cyclic temperature change; and the upper and lower temperature variation of the stratum is greater when the cement slurry is injected. Therefore, as to cement retard-er involved, the influence of temperature variation on concretion should be consi-dered during cementing of the hot dry rock geothermal well.
Keywords Hot Dry Rock, Geothermal Well, Temperature Field, Numerical Simulation
1. Horizontal Temperature Field Simulation
Currently, articles on the simulation of downhole temperature field during well ce-menting are in a limited number, and especially those on simulating the temperature field of hot dry rock (HDR) well cementing are comparatively rare. By simulating the horizontal and vertical distribution of the HDR downhole temperature field, we inves-tigated the distributing characteristics and influential factors of HDR downhole tem-perature field, aiming at guiding operation of HDR well cementing.
1.1. Geometric Model Building
When the depth of hot dry rock (HDR) well is reaching 1000 m, heat-fluid-solid coupling should be considered for HDR numerical simulation, where both stratum
How to cite this paper: Yang, H. and Shao, Y. (2017) Numerical Simulation for Hot Dry Rock Geothermal Well Tempera-ture Field. Advances in Chemical Enginee- ring and Science, 7, 34-44. http://dx.doi.org/10.4236/aces.2017.71004 Received: August 19, 2016 Accepted: December 18, 2016 Published: December 21, 2016 Copyright © 2017 by authors and Scientific Research Publishing Inc. This work is licensed under the Creative Commons Attribution International License (CC BY 4.0). http://creativecommons.org/licenses/by/4.0/
Open Access

H. Yang, Y. Shao
35
thickness and radius are 1 m; the borehole diameter and length are 0.25 m and 1 m, re-spectively; the relevant wall thickness and length of drill pipe are 0.015 m and 0.9 m, respectively; and the length of drill bit is 0.05 m, as shown in Figure 1.
1.2. Governing Equation
1) Flow equation Flow in free and porous media is applied, which should satisfy the continuity equa-
tion:
( ) ( )( )1 Tu u u p u u Ft
ρ ρ µ∂ + ⋅∇ = ∇ ⋅ − + ∇ + ∇ + ∂ (1)
where ρ is fluid density, kg/m3; t is time, s; µ is fluid viscosity, Pa∙s; T is tem-perature, K; F is volume force, Pa; Total differential Displacement is ( ), ,u u t x y= .
2) Temperature distribution In the present model, heat transfer within HDR stratum, fluid, drill stem and drill bit
in the borehole is considered. Assume that no heat was generated from drill bit, and then the continuity equation of the relevant heat circulation is as follows:
( ) ( )p p eqeq
Tc c u T k T Qt
ρ ρ∂+ ⋅∇ = ∇ ⋅ ∇ +
∂ (2)
where, ρ is fluid density, kg/m3; t is time, s; T is temperature, K; eqK is thermal conductivity coefficient, W/(m∙K); pc is specific heat capacity, J/(kg∙K); Q is Heat source, W/m3.
3) Convection heat transfer The governing equation of convection heat transfer between drilling fluid and well
wall is given below,
( ) ( )estn k T h T T− − ∇ = − (3)
where k is thermal conductivity coefficient, [W/m∙K]; T is temperature, K; n is
Figure 1. Diagram of the geometric model.

H. Yang, Y. Shao
36
normal vector of solid surface; h is convective heat transfer coefficient, [W/m2∙k];
estT is fluid near-surface temperature.
1.3. Boundary and Initial Value
The drilling fluid flows in from the entrance and flows out from the exit as for seepage field. Boundaries , , , , a b d e f and g are set as six seepage boundaries, and c is set as the seepage wall with a seepage velocity of 8 - 10 m/s. The surfaces of drill pipe and drill bit are set as non-slip wall. The entrance boundary is set as the velocity boundary with a value of 3 m/s, and the velocity of exit boundary is set as zero, with no viscous stress.
As for temperature field, considering heat transfer in the porous media, the values for boundaries a, b, exit and entrance boundaries are all 293.15 K, while those of the borehole wall and boundaries f and g are 3˚C/100 m, calculated according to geothermal gradient; considering heat transfer in the fluid, the exit and entrance tem-peratures are also set as 293.15 K; the external temperature concerning convection heat transfer is set the same as borehole wall temperature. The detailed boundary informa-tion is shown in Figure 1. The figure was established according to the general structure of hot dry rock drilling.
1.4. Parameter Selection
HDR stratum parameters [1]-[10] are used here regarding stratum to be investigated, and polymer drilling fluid is utilized. The materials [11] [12] [13] [14] of drill pipe and drill bit are alloy and diamond, respectively. Detailed information of the above men-tioned parameters is shown in Table 1.
1.5. Mesh Division
Mesh division of the geometric model is shown in Figure 2, through using grid refine-ment method near the wellbore appropriately, and considering the calculation work-load.
Table 1. Model parameters.
Well depth 1000 m Pore water heat conductivity coefficient 0.5 W/(m∙K)
Geothermal gradient 3˚C/100 m Slurry density 1300 kg/m3
Rock density 2700 kg/m3 Specific heat capacity of slurry 2800 J/(kg∙K)
Specific heat capacity of rock 1400 J/(kg∙K) Surface heat transfer coefficient 200 W/(m3∙K)
Rock heat conductivity coefficient 10 W/(m∙K) Slurry heat conductivity coefficient 1 W/(m∙K)
Porosity 0.1 Drill pipe heat conductivity coefficient 17 W/(m∙K)
Permeability 1e-14(D) Drill pipe density 7800 kg/m3
Internal friction angle 30˚ Drill pipe atmospheric heat capacity 460 J/(kg∙K)
Poisson’s ratio 0.3 Drill bit density 3200 kg/m3
Biot coefficient 1 Drill bit heat conductivity coefficient 1500 W/(m∙K)
Pore water density 1000 kg/m3 Drill bit atmospheric heat capacity 400 J/(kg∙K)
Pore water specific heat capacity 4200 J/(kg∙K) Heat transfer coefficient 200 W/(m2∙K)
H. Yang, Y. Shao
37
Figure 2. Mesh division of the geometric model.
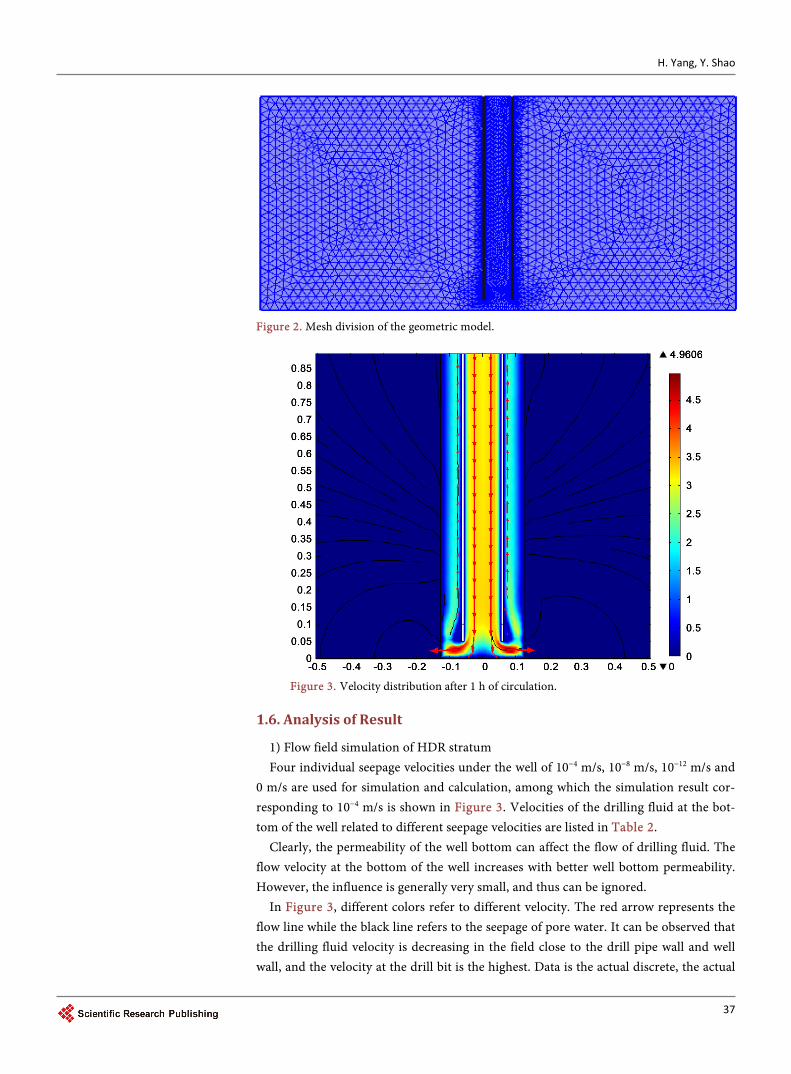
Figure 3. Velocity distribution after 1 h of circulation.
1.6. Analysis of Result
1) Flow field simulation of HDR stratum Four individual seepage velocities under the well of 10−4 m/s, 10−8 m/s, 10−12 m/s and
0 m/s are used for simulation and calculation, among which the simulation result cor-responding to 10−4 m/s is shown in Figure 3. Velocities of the drilling fluid at the bot-tom of the well related to different seepage velocities are listed in Table 2.
Clearly, the permeability of the well bottom can affect the flow of drilling fluid. The flow velocity at the bottom of the well increases with better well bottom permeability. However, the influence is generally very small, and thus can be ignored.
In Figure 3, different colors refer to different velocity. The red arrow represents the flow line while the black line refers to the seepage of pore water. It can be observed that the drilling fluid velocity is decreasing in the field close to the drill pipe wall and well wall, and the velocity at the drill bit is the highest. Data is the actual discrete, the actual

H. Yang, Y. Shao
38
grid may not completely symmetrical. 2) HDR temperature field simulation In Figure 4, the continuous and discontinuous color legend refers to the geothermal
gradient and stratum isotherm, respectively. From analysis of Figure 4, it can be found that during the circulation of drilling fluid, when the temperature of returning drilling fluid under certain well depth is lower than the stratum temperature, the temperature of the upward moving fluid will be raised via continuously absorbing the heat from the well wall rock, thus resulting in temperature decrease of well wall rock due to heat loss. With the circulation of drilling fluid in the well arriving at a stable state, the heat ex-change between drilling fluid in the well and well wall rock reaches a balance state gradually, thus the temperature difference between them also decreases gradually. When the time is long enough for drilling fluid keeping stable, the temperature of the drilling fluid in the well will gradually approaches the earth temperature. Therefore, as a function of time, the stratum temperature near the well wall, is a problem concerning transient heat transfer.
In Figure 4, the color legends refer to the geothermal gradient and stratum isotherm separately.
2. Longitudinal Temperature Field Simulation 2.1. Longitudinal Simulation of Well Structure (Example)
As for HDR geothermal well, the well surface and bottom temperatures are 20˚C and
Table 2. Flow velocity corresponding to different seepage velocities at the bottom of the well.
Seepage velocity (m/s) 10−4 10−8 10−12 0
Flow velocity of drilling fluid (m/s) 4.9616 4.9607 4.9606 4.9606
Figure 4. Stratum temperature distribution and geothermal gradient (Drilling fluid circulation after 60 min).

H. Yang, Y. Shao
39
220˚C respectively, and the well depth is 2000 m. Well structure is shown in Figure 5.
2.2. Continuous Circulation Simulation of Temperature Distribution before Well Cementing
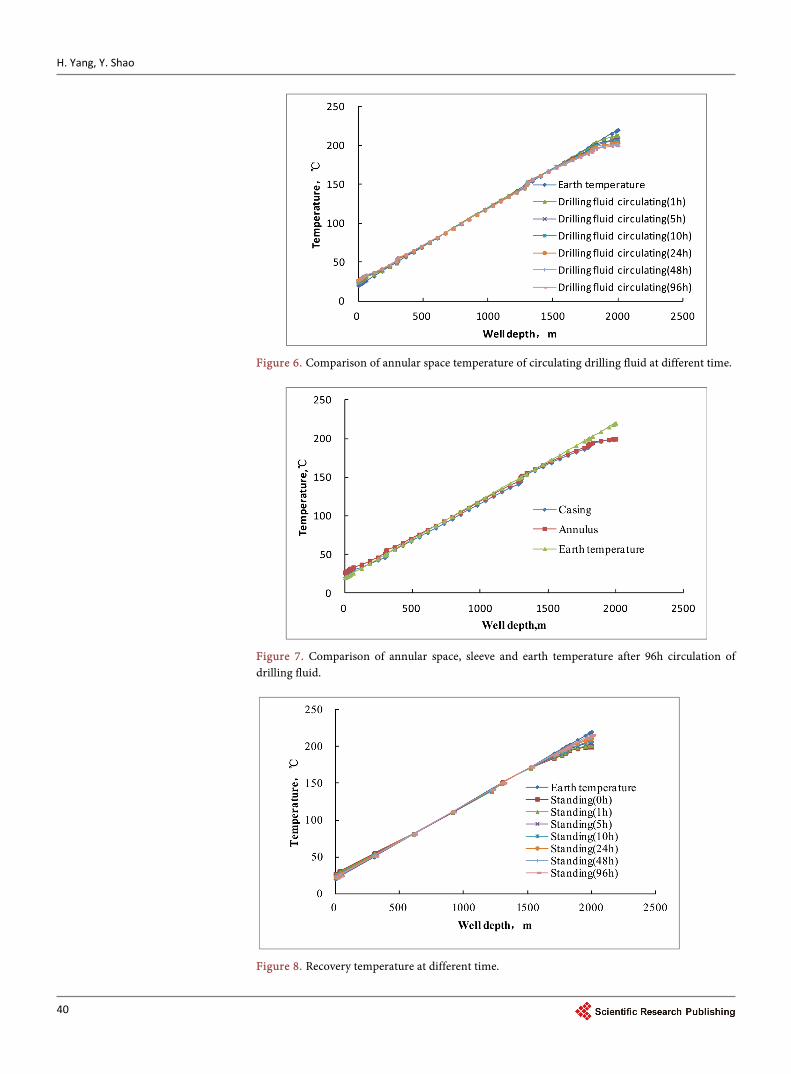
Simulation results of temperature distribution of circulating drilling fluid at 0 h, 1 h, 5 h, 10 h, 24 h, 48 h and 96 h are presented in Figure 6. It can be observed that the tem-perature of upper stratum increases with increasing circulation time, but that of lower stratum decreases. Seen from Figure 7, it can be found that the temperature variation of upper part is smaller than that of lower part. During 96 hours’ circulation simula-tion, the temperature variation at selected time of upper stratum is within 10˚C, while that of lower stratum exceeds 20˚C.
2.3. Discontinuous Circulation Simulation of Temperature Distribution before Well Cementing
Figure 8 shows temperature variation at seven different times during 96 hours’ circula-tion simulation, but the difference between that shown in Figure 7 is that individual temperature is obtained on condition that the circulation is stopped at certain selected
Figure 5. Configuration of well structure for longitudinal temperature simulation.
H. Yang, Y. Shao
40
Figure 6. Comparison of annular space temperature of circulating drilling fluid at different time.
Figure 7. Comparison of annular space, sleeve and earth temperature after 96h circulation of drilling fluid.
Figure 8. Recovery temperature at different time.
H. Yang, Y. Shao
41
time. The temperature at different stopping time of upper part decreases while that of lower part increases. Comparison of temperature distribution at different stopping time reveals that temperature variation of upper and lower parts are 5˚C and 16˚C, respec-tively, and temperature difference of upper annular space is far smaller than that of lower part. Meanwhile, regarding comparison between Figure 6 and Figure 8, it can be found that temperature change of discontinuous case is less than that of continuous case.
2.4. Temperature Variation during Injection of Cement Slurry
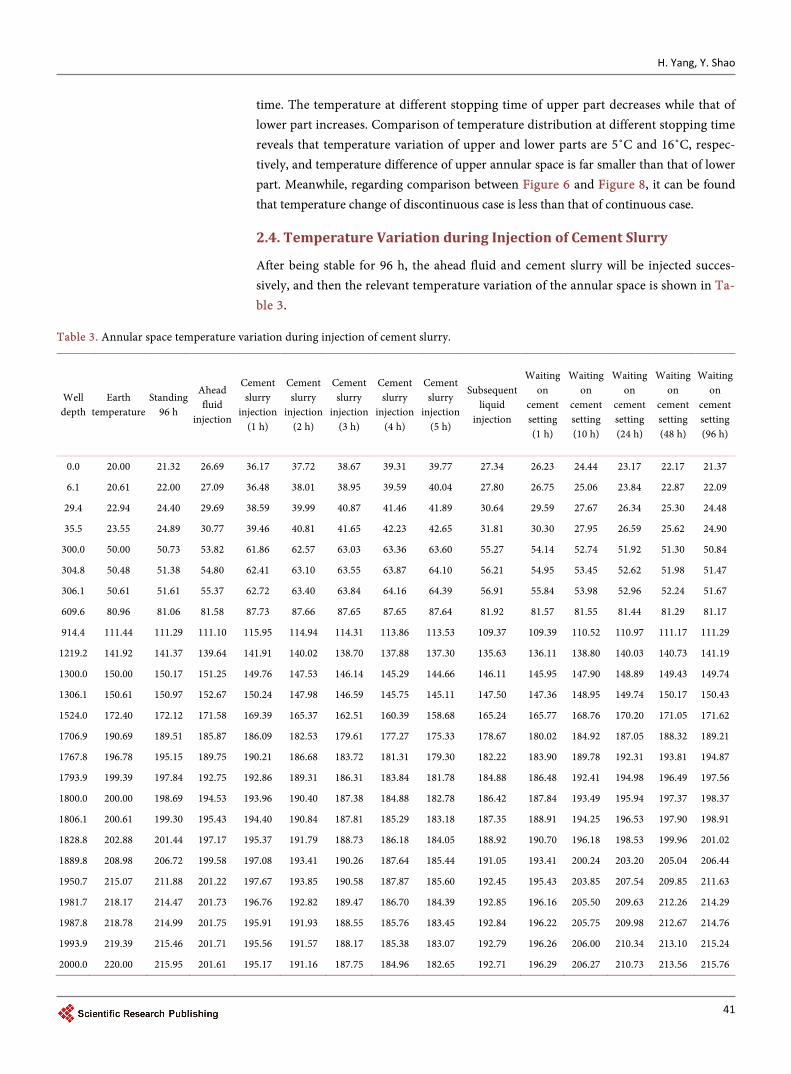
After being stable for 96 h, the ahead fluid and cement slurry will be injected succes-sively, and then the relevant temperature variation of the annular space is shown in Ta-ble 3.
Table 3. Annular space temperature variation during injection of cement slurry.
Well depth
Earth temperature
Standing 96 h
Ahead fluid
injection
Cement slurry
injection (1 h)
Cement slurry
injection (2 h)
Cement slurry
injection (3 h)
Cement slurry
injection (4 h)
Cement slurry
injection (5 h)
Subsequent liquid
injection
Waiting on
cement setting (1 h)
Waiting on
cement setting (10 h)
Waiting on
cement setting (24 h)
Waiting on
cement setting (48 h)
Waiting on
cement setting (96 h)
0.0 20.00 21.32 26.69 36.17 37.72 38.67 39.31 39.77 27.34 26.23 24.44 23.17 22.17 21.37
6.1 20.61 22.00 27.09 36.48 38.01 38.95 39.59 40.04 27.80 26.75 25.06 23.84 22.87 22.09
29.4 22.94 24.40 29.69 38.59 39.99 40.87 41.46 41.89 30.64 29.59 27.67 26.34 25.30 24.48
35.5 23.55 24.89 30.77 39.46 40.81 41.65 42.23 42.65 31.81 30.30 27.95 26.59 25.62 24.90
300.0 50.00 50.73 53.82 61.86 62.57 63.03 63.36 63.60 55.27 54.14 52.74 51.92 51.30 50.84
304.8 50.48 51.38 54.80 62.41 63.10 63.55 63.87 64.10 56.21 54.95 53.45 52.62 51.98 51.47
306.1 50.61 51.61 55.37 62.72 63.40 63.84 64.16 64.39 56.91 55.84 53.98 52.96 52.24 51.67
609.6 80.96 81.06 81.58 87.73 87.66 87.65 87.65 87.64 81.92 81.57 81.55 81.44 81.29 81.17
914.4 111.44 111.29 111.10 115.95 114.94 114.31 113.86 113.53 109.37 109.39 110.52 110.97 111.17 111.29
1219.2 141.92 141.37 139.64 141.91 140.02 138.70 137.88 137.30 135.63 136.11 138.80 140.03 140.73 141.19
1300.0 150.00 150.17 151.25 149.76 147.53 146.14 145.29 144.66 146.11 145.95 147.90 148.89 149.43 149.74
1306.1 150.61 150.97 152.67 150.24 147.98 146.59 145.75 145.11 147.50 147.36 148.95 149.74 150.17 150.43
1524.0 172.40 172.12 171.58 169.39 165.37 162.51 160.39 158.68 165.24 165.77 168.76 170.20 171.05 171.62
1706.9 190.69 189.51 185.87 186.09 182.53 179.61 177.27 175.33 178.67 180.02 184.92 187.05 188.32 189.21
1767.8 196.78 195.15 189.75 190.21 186.68 183.72 181.31 179.30 182.22 183.90 189.78 192.31 193.81 194.87
1793.9 199.39 197.84 192.75 192.86 189.31 186.31 183.84 181.78 184.88 186.48 192.41 194.98 196.49 197.56
1800.0 200.00 198.69 194.53 193.96 190.40 187.38 184.88 182.78 186.42 187.84 193.49 195.94 197.37 198.37
1806.1 200.61 199.30 195.43 194.40 190.84 187.81 185.29 183.18 187.35 188.91 194.25 196.53 197.90 198.91
1828.8 202.88 201.44 197.17 195.37 191.79 188.73 186.18 184.05 188.92 190.70 196.18 198.53 199.96 201.02
1889.8 208.98 206.72 199.58 197.08 193.41 190.26 187.64 185.44 191.05 193.41 200.24 203.20 205.04 206.44
1950.7 215.07 211.88 201.22 197.67 193.85 190.58 187.87 185.60 192.45 195.43 203.85 207.54 209.85 211.63
1981.7 218.17 214.47 201.73 196.76 192.82 189.47 186.70 184.39 192.85 196.16 205.50 209.63 212.26 214.29
1987.8 218.78 214.99 201.75 195.91 191.93 188.55 185.76 183.45 192.84 196.22 205.75 209.98 212.67 214.76
1993.9 219.39 215.46 201.71 195.56 191.57 188.17 185.38 183.07 192.79 196.26 206.00 210.34 213.10 215.24
2000.0 220.00 215.95 201.61 195.17 191.16 187.75 184.96 182.65 192.71 196.29 206.27 210.73 213.56 215.76

H. Yang, Y. Shao
42
It can be observed from Table 3 and Figure 9, the temperature of the lower stratum is high but that of the upper stratum is low, and the temperature variation of the upper and lower stratum is larger, with a value about 40˚C. The cement slurry in lower posi-tion will solidify at first to avoid the bridge plug, because in general, the higher the temperature, the faster the cement solidification. Consequently, this whole process can help improve cementing quality. The temperature of subsequent cement slurry will be increased due to convective heat transfer from solidified cement in the lower position, thus its solidification can be quickened, without changing the condition that the cement temperature of lower layer is higher than that of the upper. During waiting on the ce-ment setting stage, the subsequent annular space temperature will return to the stratum temperature gradually.
When conditions are ripe, we can test how the simulations correspond to the real experimental data.
3. Conclusions
1) The seepage at the bottom of the well can accelerate the velocity of flow in the wellbore, but the impact is negligible.
2) The temperature of upper stratum increases with the increase of circulation time, but the temperature variation of lower stratum has an opposite trend.
3) At stable circulation state, the temperature of upper part decreases, while that of lower part increases. The temperature variation of upper annular space is far lower than that of lower part in stable state. The temperature variation in stable state is less than
Figure 9. Temperature distribution during injection of cement slurry.

H. Yang, Y. Shao
43
that in cyclic state. 4) During injection of cement slurry, the temperature variation of upper and lower
stratum is greater. During waiting on the cement setting period, the subsequent annular space temperature will return to stratum temperature gradually. Generally, the control agent of cement slurry solidification is very sensitive to temperature, so the influence of stratum temperature variation on cement slurry solidification should be considered during circulation of drilling fluid and injection of cement slurry, aiming at ensuring construction safety and increasing well cementing quality.
Acknowledgements
This research was supported by NSFC project “Study on the evolution mechanism of composite materials with high temperature resistance, high pressure resistance, and low elastic modulus”, No. 51474192; and “Basic research funding of central universities”, No. 2652015067.
References [1] Shan, J.L. (2009) Study on Underground Heat Exchanger Performance Test and Model De-
sign of Ground Source Heat Pump System. Chongqing University, Chongqing.
[2] Wang, M.G. (2007) Ground Source Heat Pump System Engineering Case Analysis. Chong- qing University, Chongqing.
[3] Li, M. (2010) Buried Pipe Ground Source Heat Pump System Regional Adaptability Study [D]. NUST, Nanjing.
[4] Zhu, Q.Y., Xu, W. and Shen, L. (2010) Technical Code for Ground Source Heat Pump Sys-tem Revised. Construction Technology, 18, 19-21.
[5] Xu, W., Zou, Y. and Feng, X.M. (2010) Advancement • Safety • Operability—National Standard Engineering Technical Code for Ground Source Heat Pump System Compilation Points. Construction Technology, 18, 10-12.
[6] Peng, L. (2008) Ground Source Heat Pump System Characteristics Research and Simulation Program Development. Chongqing University, Chongqing.
[7] Yang, F., Li, J. and Ren, X.J. (2012) China Hot Dry Rock Exploration and Exploitation Sta-tus. Resources Environment & Engineering, 26, 339-341.
[8] Lin, W.J., Liu, Z.M., Ma, F., Liu, C.L. and Wang, G.L. (2012) China Land Zone Hot Dry Rock Resource Potential Estimation. Acta Geoscientica Sinica, 33, 807-811.
[9] Xu, T.F., Zhang, Y.J., Zeng, Z.F. and Bao, X.H. (2012) Enhanced Geothermal System (Hot Dry Rock) Development Technology Progress. Science & Technology Review, 32, 42-45.
[10] Wang, J.Y., Hu, S.B., Pang, Z.H., et al. (2012) China Land Zone Hot Dry Rock Geothermal Resource Potential Assessment. Science & Technology Review, 32, 25-31.
[11] Ran, H.Q. and Feng, Q.Z. (2010) Technology Problems Related to China Hot Dry Rock Ex-ploration. Exploration Engineering (Drilling & Tunneling Engineering of Rock and Soil), 37, 17-21.
[12] Yang, J.L. and Hu, K. (2001) Hot Dry Rock (HDR) Resource Study and Development Technology Overview. Global Geology, 20, 43-51.
[13] Feng, X.Y. (2012) Study on Utilization of Hot Dry Rock Resource for Heating Technology in Shenyang District. Shenyang Architecture University, Shenyang.
[14] Gamier, A., Saint-Marc, J., Kermanac, H.Y. and Bois, A. (2008) Singular Methodology to Design Cement Sheath Integrity Exposed to Steam Stimulation. Society of Petroleum Engi-

H. Yang, Y. Shao
44
neers, International Thermal Operations and Heavy Oil Symposium, ITOHOS 2008, Cal-gary, 20-23 October 2008, 1-15.
Submit or recommend next manuscript to SCIRP and we will provide best service for you:
Accepting pre-submission inquiries through Email, Facebook, LinkedIn, Twitter, etc. A wide selection of journals (inclusive of 9 subjects, more than 200 journals) Providing 24-hour high-quality service User-friendly online submission system Fair and swift peer-review system Efficient typesetting and proofreading procedure Display of the result of downloads and visits, as well as the number of cited articles Maximum dissemination of your research work
Submit your manuscript at: http://papersubmission.scirp.org/ Or contact [email protected]