Embed Size (px)
Citation preview

- 1 -
LBNL-61917
NUMERICAL MODELING OF WATER INJECTION INTO VAPOR-DOMINATED
GEOTHERMAL RESERVOIRS
Karsten Pruess
Earth Sciences Division, Lawrence Berkeley National Laboratory
Berkeley, CA 94720
Abstract
Water injection has been recognized as a powerful technique for enhancing energy
recovery from vapor-dominated geothermal systems such as The Geysers. In addition to
increasing reservoir pressures, production well flow rates, and long-term sustainability of steam
production, injection has also been shown to reduce concentrations of non-condensible gases
(NCGs) in produced steam. The latter effect improves energy conversion efficiency and reduces
corrosion problems in wellbores and surface lines.
This report reviews thermodynamic and hydrogeologic conditions and mechanisms that
play an important role in reservoir response to water injection. An existing general-purpose
reservoir simulator has been enhanced to allow modeling of injection effects in heterogeneous
fractured reservoirs in three dimensions, including effects of non-condensible gases of different
solubility. Illustrative applications demonstrate fluid flow and heat transfer mechanisms that are
considered crucial for developing approaches to in situ abatement of NCGs.
- 2 -
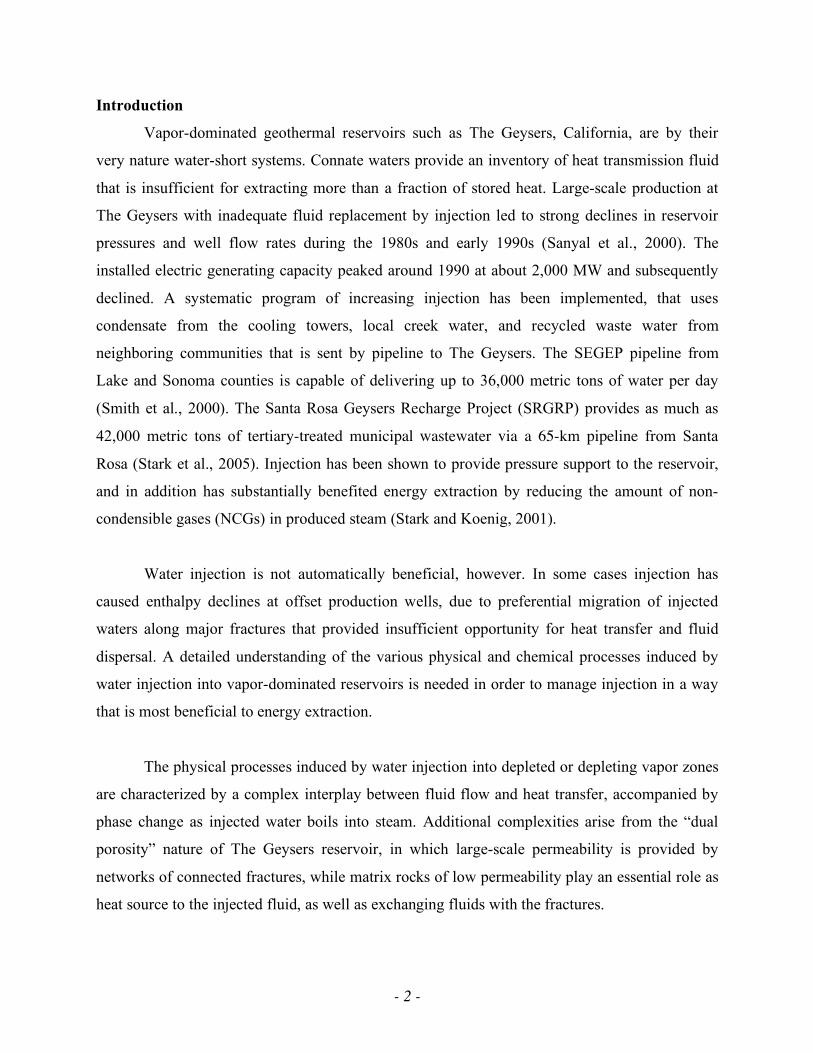
Introduction
Vapor-dominated geothermal reservoirs such as The Geysers, California, are by their
very nature water-short systems. Connate waters provide an inventory of heat transmission fluid
that is insufficient for extracting more than a fraction of stored heat. Large-scale production at
The Geysers with inadequate fluid replacement by injection led to strong declines in reservoir
pressures and well flow rates during the 1980s and early 1990s (Sanyal et al., 2000). The
installed electric generating capacity peaked around 1990 at about 2,000 MW and subsequently
declined. A systematic program of increasing injection has been implemented, that uses
condensate from the cooling towers, local creek water, and recycled waste water from
neighboring communities that is sent by pipeline to The Geysers. The SEGEP pipeline from
Lake and Sonoma counties is capable of delivering up to 36,000 metric tons of water per day
(Smith et al., 2000). The Santa Rosa Geysers Recharge Project (SRGRP) provides as much as
42,000 metric tons of tertiary-treated municipal wastewater via a 65-km pipeline from Santa
Rosa (Stark et al., 2005). Injection has been shown to provide pressure support to the reservoir,
and in addition has substantially benefited energy extraction by reducing the amount of non-
condensible gases (NCGs) in produced steam (Stark and Koenig, 2001).
Water injection is not automatically beneficial, however. In some cases injection has
caused enthalpy declines at offset production wells, due to preferential migration of injected
waters along major fractures that provided insufficient opportunity for heat transfer and fluid
dispersal. A detailed understanding of the various physical and chemical processes induced by
water injection into vapor-dominated reservoirs is needed in order to manage injection in a way
that is most beneficial to energy extraction.
The physical processes induced by water injection into depleted or depleting vapor zones
are characterized by a complex interplay between fluid flow and heat transfer, accompanied by
phase change as injected water boils into steam. Additional complexities arise from the “dual
porosity” nature of The Geysers reservoir, in which large-scale permeability is provided by
networks of connected fractures, while matrix rocks of low permeability play an essential role as
heat source to the injected fluid, as well as exchanging fluids with the fractures.

- 3 -
A number of studies published in the literature have demonstrated numerical simulation
approaches for treating multi-phase fluids in dual-porosity systems, and for handling the
extremely non-linear coupled fluid flow and heat transfer processes during production from and
injection into vapor-dominated systems (Wu et al., 2004). However, mathematical modeling of
injection into vapor-dominated systems remains a difficult task. Issues requiring additional
research include (1) the interplay of multiple spatial scales for fluid migration along fractures and
between fractures and matrix rocks, (2) vapor adsorption and capillary condensation effects, (3)
numerical artifacts arising from finite spatial resolution of gradients in temperature and fluid
saturation, (4) behavior of strongly water-soluble gases, such as HCl and NH3, during fluid
injection and production, and (5) chemical and mechanical interactions between reservoir fluids
and rocks.
The present report is part of a study that is focused on the coupled fluid flow, heat
transfer, and geochemical effects induced by large-scale injection into vapor-dominated system.
Our primary interest is in gas-rich and depleted vapor zones, and the mechanisms through which
injection could improve not only well flow rates and energy extraction, but help reduce
concentrations of corrosive non-condensible gases such as HCl and CO2 in produced steam.
Theoretical Considerations
One possible way to reduce HCl and other NCGs in Geysers steam would be to scrub
them out in situ, by dissolving them in an aqueous phase that would be introduced by means of
appropriately placed water injection. Although conceptually simple, a “literal” implementation of
this idea seems unworkable, because in practice it would not be possible to control where the
injected liquid goes, so that the idea of placing water in the path of steam flowing to the
production wells seems unrealistic. However, it may be possible to achieve removal of NCGs in
situ even if no specific control can be exerted on the migration of injected water. Injected water
will be heated by contact with the reservoir rocks and will begin to vaporize when its
temperature reaches the saturation temperature at prevailing reservoir pressures. The
vaporization will cause volume expansion and pressurization that will propagate fairly rapidly
outward, away from the injection plume. Liquid saturations will then increase throughout the
volume in which steam pressures rise, by a combination of vapor adsorption on mineral surfaces

- 4 -
and condensation effects in small capillaries (Pruess and O’Sullivan, 1992). This well-known
phenomenon is quantitatively described by Kelvin’s equation, which expresses vapor pressure as
a function of temperature and liquid saturation,
!
Pvap T,Sliq( ) = fVPL T,Sliq( )"Psat T( ) (1)
Here
!
fVPL = expMw Psuc Sliq( )
"liq R T+273.15( )
#
$ % %
&
' ( ( (2)
is the vapor pressure lowering (VPL) factor. Psat is the saturated vapor pressure of bulk aqueous
phase, the “suction pressure” Psuc < 0 is the difference between aqueous and gas phase pressures,
ρliq is liquid density, Mw is the molecular weight of water, R is the universal gas constant, and T
is temperature in oC. “Suction pressure” Psuc is a phenomenological concept that includes
conventional capillary pressures, as well as pressures generated by adsorption of liquid water on
hydrophilic mineral surfaces. When the ratio Pvap/Psat increases due to pressurization from
injection-derived steam (IDS), we have fVPL ==> 1 from Eq. (1), and Psuc ==> 0 from Eq. (2), to
which corresponds an increasing amount of condensed phase Sliq.
As vapor pressures rise throughout a broad zone surrounding the injection plume, the
additional condensed (liquid) phase formed can dissolve NCGs according to Henry’s law.
!
PNCG
= KH"x
NCG (3)
Here, PNCG is the partial pressure of the NCG, KH is Henry’s coefficient (units of Pascals), and
xNCG is the mole fraction of NCG dissolved in the liquid phase. Henry’s coefficient describes
partitioning of a volatile and water-soluble compound between two phases and can be regarded
as an inverse solubility. It is a function of temperature and also depends on the composition and
state of tension (suction pressure) of the condensed aqueous phase. Typical values of Henry’s
- 5 -
coefficient for pure water (no salinity) are of order 1010 Pa for a sparingly soluble gas such as
nitrogen, 5x10⁸ Pa for CO2, and 105 Pa or less for highly soluble HCl.
The propagation of vapor pressure increases outward from the injection plume is
described by a parabolic (diffusive) equation, suggesting that it may be possible to increase
condensed phase saturations broadly, throughout a large region. Such condensed phase may be
effective in dissolving highly soluble corrosive gases such as HCl. To achieve this effect it will
not be necessary to place the actual injection water into the pathway of the steam towards the
production wells. Once the HCl is dissolved, additional beneficial effects may be derived from
chemical interactions with rock minerals that would buffer the acidity.
Test Problems
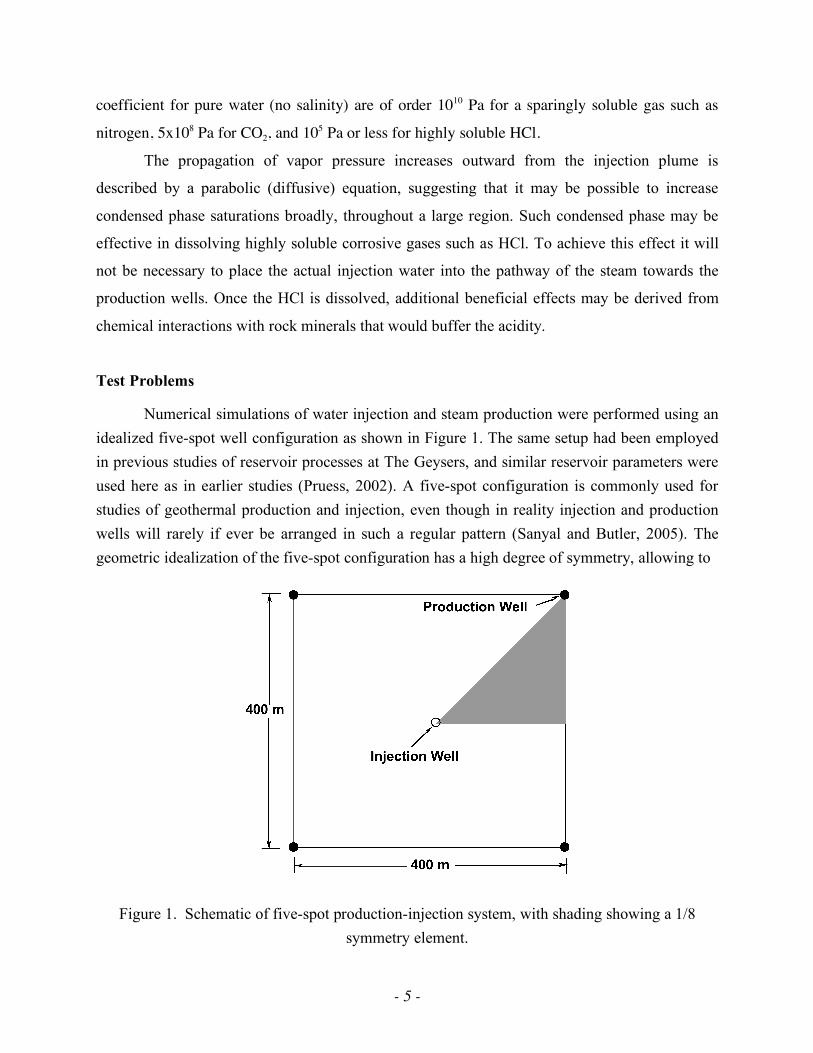
Numerical simulations of water injection and steam production were performed using an idealized five-spot well configuration as shown in Figure 1. The same setup had been employed in previous studies of reservoir processes at The Geysers, and similar reservoir parameters were used here as in earlier studies (Pruess, 2002). A five-spot configuration is commonly used for studies of geothermal production and injection, even though in reality injection and production wells will rarely if ever be arranged in such a regular pattern (Sanyal and Butler, 2005). The geometric idealization of the five-spot configuration has a high degree of symmetry, allowing to
Figure 1. Schematic of five-spot production-injection system, with shading showing a 1/8 symmetry element.
- 6 -
work with a reservoir subdomain of limited spatial extent, so that reasonable spatial resolution
can be achieved without requiring an inordinately large numbers of grid blocks. Because of
symmetry, only 1/8 of the basic five-spot pattern needs to be modeled, and a 5-point parallel grid
(Pruess, 1991) of 196 square blocks with 10.88 m length was used to represent one layer of this
1/8 symmetry element. Reservoir thickness was 500 m, which for our 3-D simulations was
divided into five layers of 100 m thickness each. Some simulations used a single porous medium
description for the reservoir, while others employed a fractured reservoir description, using the
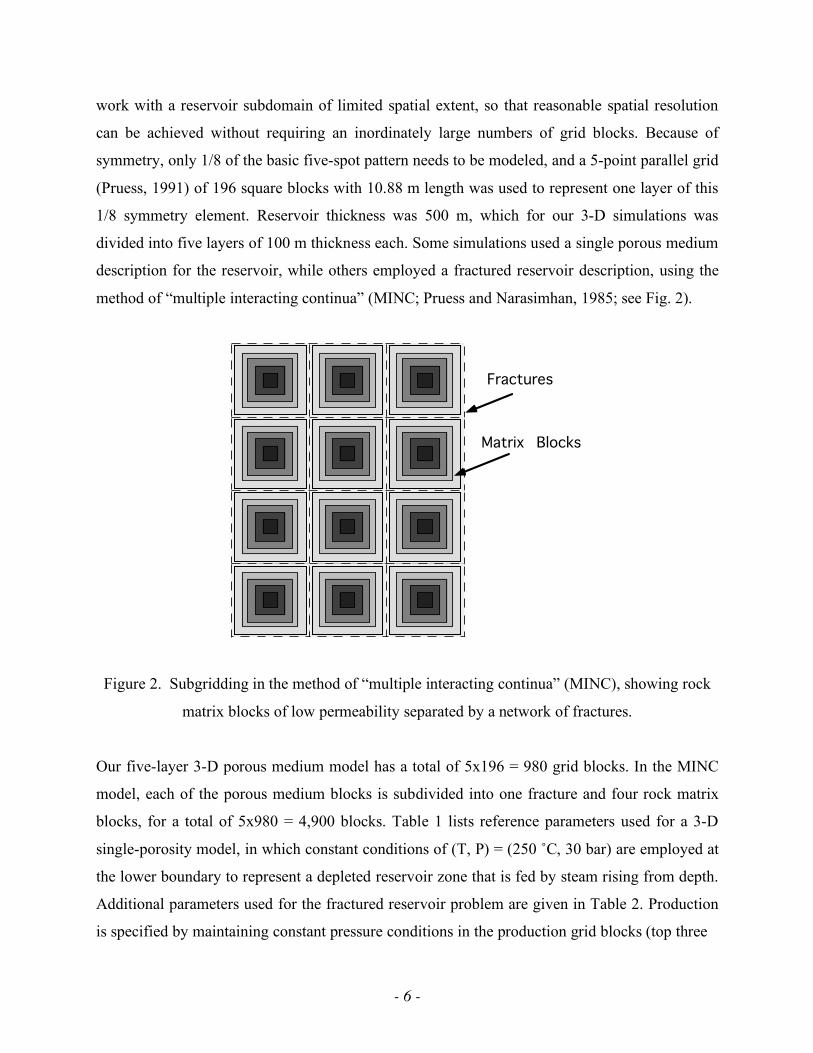
method of “multiple interacting continua” (MINC; Pruess and Narasimhan, 1985; see Fig. 2).
Fractures
Matrix Blocks
Figure 2. Subgridding in the method of “multiple interacting continua” (MINC), showing rock
matrix blocks of low permeability separated by a network of fractures.
Our five-layer 3-D porous medium model has a total of 5x196 = 980 grid blocks. In the MINC
model, each of the porous medium blocks is subdivided into one fracture and four rock matrix
blocks, for a total of 5x980 = 4,900 blocks. Table 1 lists reference parameters used for a 3-D
single-porosity model, in which constant conditions of (T, P) = (250 ˚C, 30 bar) are employed at
the lower boundary to represent a depleted reservoir zone that is fed by steam rising from depth.
Additional parameters used for the fractured reservoir problem are given in Table 2. Production
is specified by maintaining constant pressure conditions in the production grid blocks (top three

- 7 -
Table 1. Specifications of five-spot single-porosity reservoir problem
Reservoir properties Horizontal permeability 43.2x10⁻¹⁵ m2 Porosity 4 % Thickness 500 m Vertical permeability 43.2x10⁻¹⁵ m2 (top 300 m)
10x10-15 m2 (bottom 200 m) Relative permeability
liquid: van Genuchten (1980); parameters gas: Corey (1954); parameter
λ = 0.4438; Slr = 0.80 Sgr = 0.05
Capillary pressure van Genuchten (1980); parameters
λ = 0.4438; Slr = 0; P0 = 17.27x10⁵ Pa
Pattern area 160,000 m2 (= 39.5 acres) Well spacing (distance from injector to producer)
282.8 m (928.0 ft)
Initial production rate (full well basis) 10.45 kg/s Injection# rate (full well basis)& enthalpy
40 kg/s 100 kJ/kg
Gridding horizontal: 5-point parallel grid, spacing vertical: 5 layers, thickness
10.88 m 100 m
Boundary conditions top bottom
no flow T = 250 oC, P = 30 bar
Initial conditions steady state (see text) # injection well is assumed open in the top layer only. & “full well basis” means rate for the entire well, which is 8 times the value used
in the 1/8 symmetry domain considered in our model.
layers). For the 10.88 m grid spacing used here this corresponds to an effective wellbore radius
of 6.14 m, or a skin factor of -4.1 for an 8’’ well (rw = 4’’ = 10.16 cm), a value that is not
unreasonable for wells at The Geysers. Flowing bottomhole pressure is specified as 8 bar
opposite the top layer of the model. Initial conditions for this case are prepared by running the
system to steady state, resulting in a production rate of 6.56 kg/s (full well basis) and conditions
of (T, P) ≈ (225 ˚C, 15 bar) in the top layer, with a liquid saturation of Sl ≈ 4 %. Injection is then
made at a rate of 40 kg/s (full well basis). The possibility that liquid water may be trapped in the
tight matrix rock is accounted for in the porous medium model by specifying a large irreducible
water saturation of 80 %. Some variations of the reference parameters were explored, as was

- 8 -
behavior of non-condensible gases with a range of solubilities in the aqueous phase (see
“Results” section, below). All simulations reported here were made with our general-purpose
reservoir simulator TOUGH2 and the EOS4 fluid property module for water-NCG mixtures
including VPL effects (Pruess et al., 1999; Pruess, 2004). Special enhancements were
implemented to allow modeling of NCGs with different molecular weight and aqueous
solubility. An existing grid generator for 3-D five-spot grids was extended to be able to interface
with the MINC subgridding process required for fractured media, and various enhancements
were made for generating output data of interest in the context of in situ NCG abatement in
vapor-dominated systems.
Table 2. Additional specifications for the fractured reservoir problem
Reservoir properties Average permeability (of fracture network) 43.2x10⁻¹⁵ m2 Matrix permeability 1.9x10⁻¹⁸ m2 Klinkenberg parameter 7.6x10⁵ Pa Fracture porosity
average intrinsic
1 % 50 %
Matrix porosity 3 % Thickness 500 m Relative permeability
liquid: van Genuchten (1980); parameters gas: Corey (1954); parameter
λ = 0.4438; Slr = 0.08 Sgr = 0.05
Capillary pressure van Genuchten (1980); parameters
λ = 0.4438; Slr = 0; P0 = 3238 Pa (fractures); 17.27x10⁵ Pa (matrix)
MINC subgridding number of continua volume fractions
5 0.02, 0.08, 0.20, 0.35, 0.45
Diffusion parameters for NCG molecular weight gas phase diffusivity& aqueous diffusivity tortuosity in fractures tortuosity in matrix
36.45 (HCl) 1.7x10⁻⁵ m2/s 1.7x10⁻⁹ m2/s 1.0 0.01
& at standard conditions of P0 = 1 atm, T0 = 0 ˚C

- 9 -
Results
Single-Porosity Reservoir Problem
As the injected water migrates outward, away from the injection point, it is being heated
and partially vaporized by contact with the reservoir rocks. Fig. 3 shows the compex non-
monotonic behavior of fluid pressures resulting from injection. Along a line from the injection to
the production point (going from right to left in Fig. 3), there initially is a strong pressure
decline. Then a local minimum is reached, followed by pressure increase and a local maximum,
and subsequently there is a gradual decline towards the production well. Over time this pattern
persists and moves towards larger distance from the injector.
Figure 3. Pressure profiles at different times in the top reservoir layer along a line extending
from the production well (at distance 0) to the injection well (located at a distance of 282.8 m).
The pressure behavior arises from an interplay of single-phase liquid flow near the
injection well with two-phase steam-water flow under non-isothermal conditions at larger
distance. In the region with steep pressure gradients around the injector we have single-phase
- 10 -
liquid. Pressure gradients increase in this region over time, due to strong increases in water
viscosity as temperatures decline from continued injection. The local minimum in pressure
occurs at the outer boundary of the single-phase liquid region (compare water saturations in Fig.
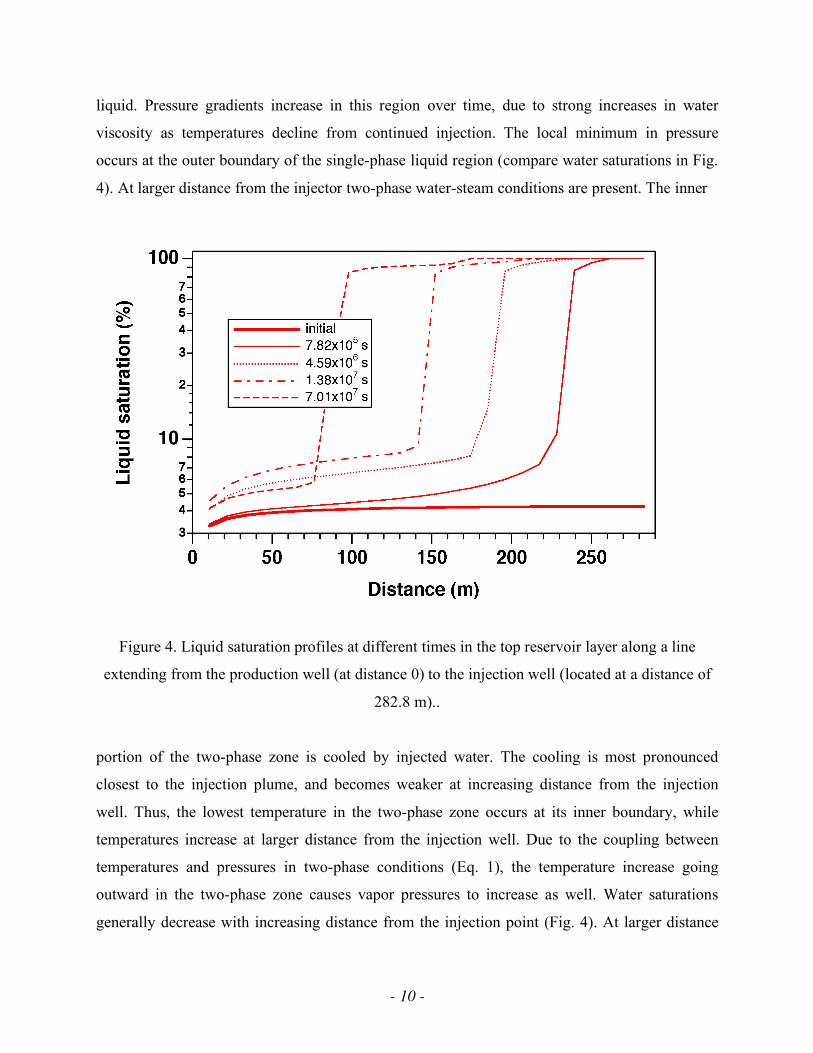
4). At larger distance from the injector two-phase water-steam conditions are present. The inner
Figure 4. Liquid saturation profiles at different times in the top reservoir layer along a line
extending from the production well (at distance 0) to the injection well (located at a distance of
282.8 m)..
portion of the two-phase zone is cooled by injected water. The cooling is most pronounced
closest to the injection plume, and becomes weaker at increasing distance from the injection
well. Thus, the lowest temperature in the two-phase zone occurs at its inner boundary, while
temperatures increase at larger distance from the injection well. Due to the coupling between
temperatures and pressures in two-phase conditions (Eq. 1), the temperature increase going
outward in the two-phase zone causes vapor pressures to increase as well. Water saturations
generally decrease with increasing distance from the injection point (Fig. 4). At larger distance
- 11 -
from the injection point, associated vapor pressure lowering effects (declining fVPL coefficient in
Eq. 2 as water saturation decreases) become stronger than increases in saturated vapor pressure
due to increasing temperatures, giving rise to a local maximum in vapor pressure. Beyond the
local pressure maximum there is a monotonic pressure gradient towards the production well. In
the region between the local maximum and local minimum in pressure, steam flows towards
rather than away from the injection point. Liquid phase pressures decline monotonically away
from the injection point, due to capillary pressure gradients that are stronger than the increases in
steam pressure. Thus, liquid water flows away from the injection point everywhere. In the inner
(near-injector) portion of the two-phase zone, we therefore have a steam-water counterflow, with
water flowing away from and steam flowing towards the injection point. The steam flowing
towards the liquid portion of the injection plume condenses there, depositing its latent heat of
vaporization and heating injected water.
Pressures near the injection well continue to increase over time, but it is interesting to
note that at late time pressures in the more distant portions of the two-phase zone actually
decline. This is a consequence of overall temperature decline due to heat transfer from the rock
to injected water. As had been anticipated, increases in water saturation occur far ahead of the
actual injection plume (Fig. 4), due to partial condensation of steam caused by increasing vapor
pressures.
At early time, only a small fraction of the injected liquid is vaporized (Fig. 5), which can
be understood from the small geometric size of the injection plume. Only a small reservoir
volume is contacted by the injected water, and steam is generated in a small radius around the
injection well. Steam fluxes are limited by limited surface area of the injection plume, and the
large pressure gradients required to allow steam to flow outward. Over time the injection plume
grows outward and eventually downward as well. This facilitates heat transfer and steam flow
away from the surface of the plume, causing an increasing fraction of injectate to be vaporized.
Our simulation ends after 400 time steps at a time of 70.1x10⁶ s (115.9 weeks), at which time
more than 40 % of total injected liquid has been vaporized.

- 12 -
Figure 5. Mass balance for liquid phase on a full-well basis. For the applied constant injection
rate of 40 kg/s, the mass of injected liquid grows linearly with time. The dashed curve (labeled
“additional”) shows the increase in liquid mass in the reservoir with time. The difference
between “injected” and “additional” liquid mass indicates the amount of liquid that is vaporized.
The fraction of injected liquid remaining as liquid in the reservoir (unvaporized) is also shown.
The steam production rate shows a non-monotonic behavior, more than doubling over the
first 20x106 s, and then slowly declining (Fig. 6). The decline is due to a slow decrease in
temperature over the surface of the expanding injection plume and associated pressure decrease.
Fig. 6 also shows NCG mass fractions in produced steam, for three different values of NCG
solubility (Henry’s coefficient). For modeling NCG behavior, the initial (pre-injection) steady
state was prepared by specifying a small, constant NCG partial pressure at the bottom boundary,
typically in the range of 10 – 1000 Pa. Steam flow rates are not affected by the presence of small
concentrations of NCG. For the lower-solubility gases (KH = 1010 and 107 Pa), injection gives
rise to a brief increase in NCG concentration, followed by a steep decline. This behavior can be
seen more clearly in the early-time plot, Fig. 7. For a high-solubility NCG (KH = 105 Pa) the
decline is monotonic but weaker, and long-term NCG concentrations remain much higher. These

- 13 -
outcomes can be readily understood as follows. For NCGs with low aqueous solubility (large
KH), the partial steam condensation induced by injection-derived pressurization (Fig. 3) will
leave the residual steam enriched in NCGs and will increase NCG concentrations in produced
steam. Such increase is temporary, however, because over time an increasing fraction of
produced steam is derived from vaporization of injected water, which is low in NCGs. For NCGs
with large solubility, pressurization-induced condensation will cause substantial dissolution of
NCGs, and will reduce NCG concentrations in residual steam. Long-term NCG concentrations in
produced steam remain higher for more soluble NCGs, however, because there is a larger
inventory dissolved in the condensed phase that continues to supply NCGs to the steam through
slow evaporation.
Figure 6. Steam production rate (full-well basis) and NCG mass fractions in produced steam for
NCGs with different solubilities. (Henry’s coefficient is inverse solubility.)

- 14 -
Figure 7. NCG mass fractions in produced steam at early times for NCGs with different
solubilities. (Henry’s coefficient is inverse solubility.)
3-D Fractured Reservoir Problem
The numerical simulation of the fractured reservoir system is considerably more difficult
than for the porous medium, for the following reasons: (1) the total number of grid blocks is
increased by a factor 5; (2) the fracture grid blocks have small volumes, which limits time step
sizes; (3) the fracture-matrix interaction is extremely non-linear, due to very strong capillary
pressures in the rock matrix; (4) in addition to advective effects, NCG behavior is strongly
influenced by molecular diffusion between fractures and rock matrix. The numerical simulations
presented here are the first quantitative analyses of water injection into a fully 3-D fractured
reservoir system with inclusion of NCG effects. Results for a time period of 37.7x10⁶ s (436.6
days) are shown in Figs. 8 and 9.
Prior to startup of injection, all of the liquid present in the system resides in the rock
matrix. This is because suction pressure and VPL effects are very weak in the fractures, so that at

- 15 -
pressures substantially below saturated vapor pressure no condensed phase can be formed in the
fracture domain. In response to water injection, liquid mass increases in both fractures and rock
matrix, the latter being due to (capillary) suction effects that draw liquid from the fractures into
the rock matrix (Fig. 8). For an initial period of approximately 8x10⁶ s, most of the increase in
liquid mass in the reservoir occurs in the fracture system. At later time, the increase in liquid
inventory of the fractures tapers off, and most increase occurs in the rock matrix. Comparing
Figure 8. Liquid mass balances for the 3-D fractured reservoir system (MINC; full-well basis).
Total additional liquid mass (injected liquid that remains unvaporized) calculated for the porous
medium (PM) model is also shown.
with the porous medium model (Fig. 5), Fig. 8 shows that increase of liquid mass in the fracture
system is significantly smaller. Fig. 9 shows that steam production in the fractured reservoir
responds more rapidly to injection than was the case for the porous medium model. This is
because pressurization effects from injection propagate more rapidly in the fracture system, due
to its smaller pore volume. The longer-term increase in steam production induced by injection is
smaller, however, than for the porous medium, and decline from the local maximum sets in

- 16 -
earlier and is steeper than in the porous medium case. These latter effects are primarily due to
heat transfer limitations in the fractured medium. In the porous medium model, heat transfer
from rocks to fluids is local and instantaneous, while in the fractured reservoir description, heat
transfer occurs by conduction from the interior of low-permeability matrix blocks to the
surrounding fracture network. Conduction is a slow process, so that rates of heat transfer to the
injection plume, hence vaporization rates, are smaller.
Figure 9. Comparison of steam flow rates (full-well basis) and NCG concentrations in produced
steam for the fractured (MINC) and porous medium (PM) models. The NCG calculation is for a
highly soluble gas with a Henry’s coefficient of KH = 105 Pa.
From the steam production rates shown in Fig. 9 it is evident that long-term cumulative
steam production is smaller in the fractured (MINC) than in the porous medium model. Fig. 8
shows that cumulative addition of liquid phase to the fractured reservoir is also smaller. Given
that rates of fluid injection are the same in both systems, this raises a question as to overall mass
conservation in the fractured reservoir. Inspecting our simulation results, the simple answer to

- 17 -
this seeming inconsistency is that the “missing” portion of the injected fluid leaves the fractured
reservoir through the lower boundary of the system, at 500 m depth below the reservoir top, and
is then no longer included in the mass balances for the top 500 m of reservoir that is considered
in our model. There is a point of practical importance here, namely, that due to the relatively
small volume of the fracture system (here assumed as 1 % of total reservoir volume), and due to
heat transfer limitations in a fractured reservoir, a substantial fraction of injected liquid migrates
fairly rapidly to considerable depth. Vertical downflow of unvaporized liquid water is a much
smaller effect in the porous medium model.
Fig. 9 shows that NCG concentrations in produced steam decline much more rapidly in
the fractured reservoir than in the porous medium. This is due to two effects, (1) NCG-rich steam
is rapidly purged from the fracture system by vaporization of injectate, and (2) most of the NCG
inventory of the fractured reservoir is in the rock matrix, from where it can reach the fracture
system only by molecular diffusion, which is a slow process.
Concluding Remarks
The studies presented here have demonstrated numerical simulation capabilities for
accurate modeling of the thermodynamics of NCG-water mixtures under non-isothermal
multiphase conditions in porous media. Flow and transport processes in three dimensions can be
modeled taking into account heterogeneous hydrogeologic properties, including fracture
networks, and fracture-matrix interaction due to diffusion, advection, and heat conduction.
Future work will consider chemical reactions between aqueous fluids and reservoir rocks as well.
Our simulations have shown significant vapor pressure increases from injection,
condensation effects arising from the pressurization, and NCG dissolution effects in the
condensed phase. These effects form possible building blocks for achieving in situ abatement of
NCGs, which is the central objective of the present project. Future studies will investigate
possibilities and limitations for using targeted water injection to control NCGs, and to aid in
design and interpretation of laboratory experiments that are currently being assembled.

- 18 -
Acknowledgement
Thanks are due to Tim Kneafsey and Nic Spycher for a careful review of the manuscript
and suggestions for improvements. This work was supported by a PIER grant from the California
Energy Commission (CEC) and by the Assistant Secretary for Energy Efficiency and Renewable
Energy, Office of Geothermal Technologies, of the U.S. Department of Energy under Contract
No. DE-AC02-05CH11231.
References
Pruess, K. Grid Orientation and Capillary Pressure Effects in the Simulation of Water Injection
into Depleted Vapor Zones, Geothermics, Vol. 20, No. 5/6, pp. 257 - 277, 1991.
Pruess, K. Numerical Simulation of Multiphase Tracer Transport in Fractured Geothermal
Reservoirs, Geothermics, Vol. 31, pp. 475 - 499, 2002.
Pruess, K. The TOUGH Codes—A Family of Simulation Tools for Multiphase Flow and
Transport Processes in Permeable Media, Vadose Zone J., Vol. 3, pp. 738 - 746, 2004.
Pruess, K., C. Oldenburg and G. Moridis. TOUGH2 User’s Guide, Version 2.0, Lawrence
Berkeley National Laboratory Report LBNL-43134, Berkeley, CA, November 1999.
Pruess, K. and M. O’Sullivan. Effects of Capillarity and Vapor Adsorption in the Depletion of
Vapor-Dominated Geothermal Reservoirs, Lawrence Berkeley Laboratory Report LBL-
31692, presented at Seventeenth Workshop on Geothermal Reservoir Engineering,
Stanford University, Stanford, CA, January 1992.
Pruess, K. and T.N. Narasimhan. A Practical Method for Modeling Fluid and Heat Flow in
Fractured Porous Media, Soc. Pet. Eng. J., 25 (1), 14-26, February 1985.
Sanyal, S.K. and S.J. Butler. An Analysis of Power Generation Prospects from Enhanced
Geothermal Systems, Proceedings, Paper 1632.pdf, World Geothermal Congress 2005,
Antalya, Turkey, 24-29 April 2005.

- 19 -
Sanyal, S.K., S.J. Butler, P.J. Brown, K. Goyal, and T. Box. An Investigation of Productivity
and Pressure Decline Trends in Geothermal Steam Reservoirs, Proceedings, World
Geothermal Congress 2000, pp. 873 - 877, International Geothermal Association, May-
June 2000.
Smith, B., J. Beall and M. Stark. Induced Seismicity in the SE Geysers Field, California, USA,
Proceedings, World Geothermal Congress 2000, pp. 2887 - 2892, International Geothermal
Association, May-June, 2000.
Stark, M. and B. Koenig. Generation Gain in the Northern Geysers Due to Injection-Derived
NCG Reduction, Transactions, Geothermal Resources Council, Vol. 25, pp. 469–474,
2001.
Stark, M.A., W.T. Box Jr., J.J. Beall, K.P. Goyal, and A.S. Pingol, The Santa Rosa – Geysers
Recharge Project, Geysers Geothermal Field, California, USA, Proc. World Geotherm.
Cong. 2005, paper 2420, 2005.
Wu, Y.S., L. Pan and K. Pruess. A Physically Based Approach for Modeling Multiphase
Fracture-Matrix Interaction in Fractured Porous Media, Advances in Water Resources, Vol.
27, pp. 875 - 887, 2004.