Embed Size (px)
Citation preview
NUMERICAL MODEL FOR FLEXURE RESPONSE OF MASONRY WALLS REINFORCED WITH GFRP SHEETS
Marc D. Kuzik1 , Alaa E. Elwi2 , J.J. Roger Cheng2
ABSTRACT
A numerical model for out-of-plane flexure was developed for concrete block masonry walls reinforced with externally bonded glass fibre reinforced polymer (GFRP) sheets. The model predicts the loading envelope response by defining three points of bending moment and lateral deflection, which are then connected using a simple nonlinear stiffness degradation model found in the literature. The strength model is based on strain compatibility and the predicted ultimate deflection is determined using a maximum GFRP strain value to obtain the ultimate curvature. A comparison between the actual and predicted bending moment versus lateral deflection responses from nine full-scale tests was performed with good agreement. Key words : (None supplied by author) 1Ph.D. Student 2Professor University of Alberta Edmonton, Alberta Canada, T6G 2G7
INTRODUCTION
In the first part of this work (Kuzik et al. 1999), the authors have tested a series of full-scale masonry block walls reinforced with glass fiber reinforced polymer (GFRP) sheet reinforcement. These tests were carried out cyclically under out-of-plane flexure combined with moderate in-plane axial compression. In that work, the test setup, test specimens and results were all reported and the characteristics of the behavior were discussed. Nine tests were performed in which three parameters were studied. These included the level of compressive axial load, amount of internal steel reinforcement, and amount of externally bonded GFRP sheet reinforcement.
Of the three parameters studied, varying the amount of GFRP sheet reinforcement was the only parameter that significantly affected the behavior of the walls. The GFRP sheet reinforcement governed the response of the bending moment versus centerline deflection. Increasing or decreasing the amount of GFRP sheet reinforcement either increased or decreased both the wall stiffness and ultimate strength respectively. Except for visible cracks, the walls maintained their structural integrity throughout the out-of-plane cyclic loading. The response in either side of a fully reversible cycle was identical, indicating no compression degradation of the bond between the GFRP sheets and the face shell. The unloading/reloading paths for successive loading cycles were nearly linear and progressively softer in successive loading excursion. There was, however, no strength degradation in the successive excursions up to the failure point. Thus, the general behavior of the walls was robust and predictable. The system, therefore, could be used to advantageously rehabilitate older masonry structures that are inadequately reinforced to withstand seismic events.
To generalize the test results obtained by the authors, a model capable to predict the envelope of the behaviour is needed. There are many models available to predict the load versus deflection response for reinforced concrete elements but most are too complicated to implement (Saiidi, 1982). A very simple and, therefore, practical model developed by Saiidi and Sozen (1979) includes all of the characteristics of the hysteresis loops obtained. The model is referred to as the Q-HYST and is governed by only four rules. Key features of this model include: the loading response is bilinear with an ascending post-yield branch, the unloading stiffness beyond yielding is a function of the maximum experienced deformation, and stiffness degradation is accounted for during load reversal.
The observed behavior as mentioned above consisted of a loading envelope and progressively degrading unloading/reloading paths as shown in Fig. 1. The loading envelope consisted of an initial uncracked linear zone ending at a transition point. Beyond this point, diagonal cracks start to appear on the tension side in the face shell adjacent to the GFRP. These cracks are caused by shear lag strains in the face shell. These cracks may be modeled in the form of progressive debonding of the GFRP sheets causing progressive stiffness degradation. In this zone of behavior that is past the transition point the loading envelope has a positive slope and could be characterized as either bilinear or trilinear (Fig. 1), depending on whether the wall

contains ordinary steel reinforcement that could yield before the wall reaches its ultimate strength.
Because the nature of the behaviour was found governed largely by the amount of GFRP sheet reinforcement on the tension side, the hysteretic response showed a pinched picture. Degradation of the behaviour was thus attributed only to progressive debonding of the sheets coupled with face shell diagonal cracks that are attributed to shear lag behaviour. This allowed a simple unloading path that is dependent only on the amount of degradation, which is in turn linked to the total curvature or strain achieved at the top of loading excursion.
The proposed model, shown in Fig. 2 has two parts: a loading envelope and an unloading/reloading path. The loading envelope has an initial linear portion ending at a transition moment. This is followed by a nonlinear portion ending at the ultimate moment. The unloading/reloading path is a linear secant path that accounts for progressive degradation of the stiffness. This paper presents the detailed derivation of the model as well as verification of the model against the test results obtained by the authors (Kuzik et al. 1999).
To successfully quantify and thus predict the out-of-plane behavior of any wall system, an understanding of the mechanics of each material and the interaction between materials is required. In assessing the qualitative behavior, the GFRP sheet reinforcement and steel reinforcement strains were used extensively. These data were again used along with a fundamental strength of materials approach to mathematically quantify the strength behavior. In addition, a flexural stiffness model was used to predict the stiffness degradation, thus deflections, throughout the loading history.
To define the loading path, joint cracking moments as well as the contribution of externally bonded sheets to the cracked stiffness are needed to define the transition moment, MT, and the deflection at which it takes place. The ultimate moment, Mu, is next determined together the deflection at which it takes place. The two points are joined with a nonlinear path that is dependent on an effective stiffness evaluation at any point during that phase of behaviour. The current strength and secant stiffness at any point are state parameters that allow unloading/reloading of the system.
NUMERICAL MODEL FOR FLEXURE
To generalize the test results obtained by the authors, a model capable to predict the envelope of the behaviour is needed. There are many models available to predict the load versus deflection response for reinforced concrete elements but most are too complicated to implement. A very simple and, therefore, practical model developed by Saiidi and Sozen (1979) includes all of the characteristics of the hysteresis loops obtained. The model is referred to as the Q-HYST and is governed by only four rules. Key features of this model include: the loading response is bilinear with an ascending post-yield branch, the unloading stiffness beyond yielding is a function of the maximum experienced deformation, and stiffness degradation is accounted for during load reversal.
The proposed model, shown in Fig. 2 has two parts: a loading envelope and an unloading/reloading path. The loading envelope has an initial linear portion ending at a transition moment. This is followed by a nonlinear portion ending at the ultimate moment. The unloading/reloading path is a linear secant path that accounts for progressive degradation of the stiffness.

To define the loading path, joint cracking moments as well as the contribution of externally bonded sheets to the cracked stiffness are needed to define the transition moment, MT, and the deflection at which it takes place.
The maximum moment point on the response could be taken as the ultimate moment. However, since the only failure mode observed was a shear failure mode, changing conditions may result in a different failure mode such as rupture of the GFRP, or crushing of the masonry. The ultimate moment obtained form the tests will be treated as a point on the response curve. The ultimate moment of the section may in general be determined in a more general manner as either that obtained above or limited by some strain value in the GFRP, or the masonry. For purposes of this model, the maximum moment, Mu and the corresponding deflection ∆u, will be determined from regression analysis. The two points are joined with a nonlinear path that is dependent on an effective stiffness evaluation at any point during that phase of behaviour. The current strength and secant stiffness at any point are state parameters that allow unloading/reloading of the system.
Joint Cracking Moment
Theoretically, the cracking moment is determined from the tensile strength of masonry, ft, and the section modulus, S in a straightforward manner. In concrete block masonry walls cracking at the bed joint location occurs through the depth of the tension face shell under very small moments. Thus, a good approximation of the moment of inertia up to the cracking moment is calculated using the net area with only one face shell. For reference, all moments of inertia discussed in this document are calculated about the geometric centroid of the cross section. Abboud et al. (1995) designated this modified moment of inertia as Ig
f. The cracking moment can be described to account for axial forces as:
⋅
+=
h
I
A
PfM
f
g
e
t
f
cr
2 (1)
in which P is the axial compressive force and Ae is the effective area of the uncracked cross section. The term h is the total depth of the cross section.
Transition Moment
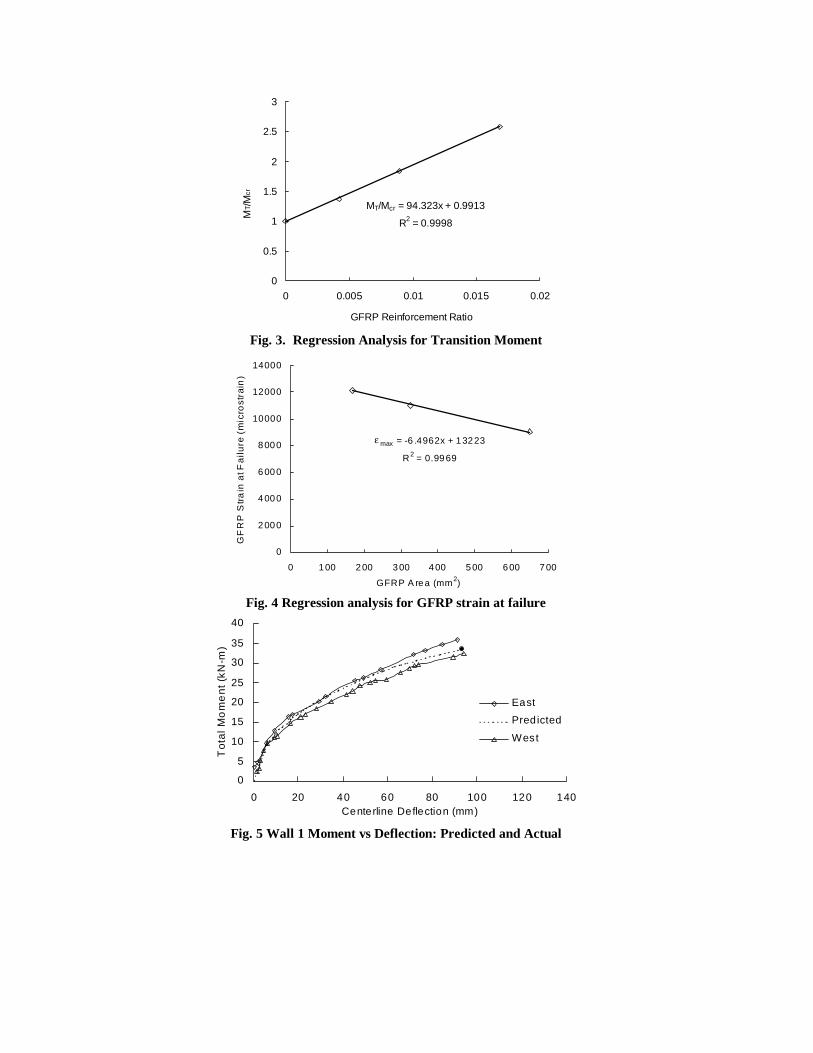
As mentioned in the previous section, the transition moment depends solely on the amount of GFRP sheet reinforcement bonded to the wall. To assess MT, the GFRP sheet reinforcement ratios were plotted against the ratios of MT/Mcr determined from the test data obtained by Kuzik et al. (1999) and a linear regression was performed. Figure 3 shows the regression line plotted through the data and the resulting linear equation relating the two ratios. The linear approximation is an excellent fit through the data as the coefficient of determination, R2, is very close to 1.0. The relationship determined from the regression analysis can be mathematically incorporated into the cracking moment equation quite easily. However, a physical interpretation must be associated with this factor for it to be justified.
The two components making up the theoretical cracking moment relationship are the masonry tensile strength and the section modulus. Some boundary layer regions of masonry directly adjacent to the bonded GFRP sheet reinforcement may have a slight increase in tensile strength due to the absorption of epoxy. However, this boundary layer is highly variable and small relative to the effective area that it can be neglected. The only remaining term is the section modulus, which is what the regression equation targets. With the addition of the GFRP sheet reinforcement, the

initial cracking point is not delayed. But, once a crack starts, the rate at which the crack propagates through the cross section is influenced greatly by the amount of GFRP sheet reinforcement on the tension face (Kuzik et al. 1999). The amount of GFRP sheet reinforcement can be expressed as a reinforcement ratio (ρGFRP) in terms of the transformed section area as
me
GFRPGFRPGFRP EA
EA=ρ (2)
The terms AGFRP and EGFRP are respectively the area and modulus of elasticity of the GFRP sheet reinforcement on one side of the wall and Em is the prism modulus of elasticity of masonry.
The regression term from Fig. 3 is multiplied by Eq. (1), to yield an expression for MT as:
( )
+
⋅
+= GFRP
f
g
e
tT h
I
A
PfM ρ3.941
2 (3)
Maximum Moment
In the tests carried out, the failure has followed a masonry shear flexure mode. It is not possible to determine the limiting values of stain without sophisticated finite element analysis. No such successful analysis of masonry is reported in the literature. Alternately, one may use limiting shear stresses reported by the various design practices. However, this varies widely and may not be applicable in the presence of GFRP without further investigation.
Since each specimen failed at a different level of moment, observed to be strongly related to the amount of GFRP sheet reinforcement bonded to the masonry wall specimens, a linear regression analysis was performed between the measured strain in the GFRP sheet reinforcement at the point of wall failure and the corresponding area of GFRP sheet reinforcement used. Figure 4 shows the linear relationship from the regression analysis. The coefficient of determination, R2, was 0.9969, which indicates a strong correlation between these variables. From this analysis, a relationship between the GFRP sheet reinforcement area and the maximum strain at the ultimate moment, εu GFRP, is proposed in Eq. (4) by
( ) 6105.613200 −×−= GFRPGFRPuAε (4)
The procedure used to calculate the ultimate moment is the same used in the flexural design of reinforced concrete members plus the contribution of the GFRP:
−+
−=
22
ahEA
adfAM
GFRPuGFRPGFRPssu ε (5)
The nominal thickness of the GFRP sheet reinforcement is neglected. The term representing the depth of the equivalent rectangular stress block for a cross section is modified based on Eq. 5 and the work of Kaar et al. (1978) for the typically low masonry prism strength as:

bf
EAfAPa
m
GFRPuGFRPGFRPss
'96.0
ε++= (6)
Lateral Deflection
Accurately predicting the out-of-plane deflections in masonry is difficult due largely to the continually changing flexural stiffness, EI. The deflection analysis developed for the GFRP sheet reinforcement reinforced walls tested (Kuzik et al. 1999) is based upon the flexural stiffness degradation model proposed by Abboud et al. (1995).
The model predicts an effective stiffness for a given level of moment above the cracking moment. This effective stiffness can then be used in an appropriate beam deflection equation to determine the desired lateral displacements. The effective stiffness is interpolated between the gross and cracked stiffnesses as:
(EI)eff = EmIgfR + α Em Icr(1-R) (7)
The term α describes the maximum degradation of the stiffness at the ultimate moment. The Interpolation factor R is a function of the applied bending moment, Ma, relative to the cracking and nominal capacities, Mcr and Mn respectively:
−−
+
−−=
M crM u
M aM uMM
MMRcru
au
4
6.04.0 (8)
To incorporate the model proposed by Abboud et al. (1995), some modifications were made. First, it should be noted that the model is only applied at levels of moment beyond the transition moment. From point A to point C on Fig. 2, a linear path is used with the slope determined using EmIg
f for the stiffness. From point C to point F, the model is applied to predict the loading stiffness of the envelope.
Abboud et al. (1995) stated the general form of the term α as:
max∆∆
=crcr
cr
f
gu
IM
IMα (9)
To assess the coefficient α, the maximum deflection (∆max) is required. This information is easy to obtain from test specimens in a research program. However, a rational method is required to compute ∆max for any wall to make the model a useful design tool.
The authors propose to use the ultimate strains predicted by Eq. 4 to assess the ultimate curvature, and from that, the ultimate deflection can then be evaluated. For systems that behave plastically, quantifying an ultimate deflection requires an iterative procedure or one of trial and error. Once the system yields, determining how much plastic strain the system will tolerate is difficult to assess. This renders calculating the ultimate deflection from a curvature approach highly variable. However, this is not the situation for walls with externally bonded GFRP sheet reinforcement. The GFRP sheet reinforcement behaves in a linear elastic manner until it ruptures. The expression for the maximum curvature can be expressed as:
ahEI
M GFRPu
−=
ε (10)

For the walls tested under a two point load system located at x distance from the beam ends, the applicable beam deflection equation is:
( )24
43 22
max
xL
EI
M −=∆ (11)
Although some horizontal cracking was observed in individual masonry units during testing, these crack widths were much smaller than those observed at the bed joint locations. Thus, all the horizontal cracks from center-to-center of each course can be assumed to be concentrated in one large crack at the bed joint location. A deflection correction factor is, therefore, proposed to account for the joint crack spacing:
( )
−
−
−
=∆
L
S
xL
ah cr
GFRPu
21
1
24
43 22
max
ε (12)
in which L is the wall height; x is the shear span length; and Scr is the crack spacing, assumed at 200 mm (normal bed joint spacing for most masonry structures).
PREDICTED HYSTERESIS ENVELOPE
The procedure outlined was used to predict the loading region of the moment versus deflection envelopes for each of the wall specimens tested by the authors (Kuzik et al. 1999). Table 1 lists the properties used in the wall deflection calculations and Table 2 lists the test-to-predicted ratios for both the strength model and the deflection model. Figure 5 show the predicted and actual bending moment versus centerline deflection envelopes for wall 1 as an example.
As shown in Table 2, the test-to-predicted ratios for the walls with externally bonded GFRP sheet reinforcement ranges from 1.01 to 1.14 for the ultimate bending moment calculations. This agreement between the test specimens and the mathematical model validates the rational mechanics approach used. Because the test-to-predicted results for the GFRP sheet reinforcement walls are greater than one, the rational approach proposed in this paper is slightly conservative with no material safety factors applied. However, decreasing the area of GFRP may result in different failure modes
The test-to-predicted ratios for the GFRP sheet reinforcement wall deflections range from 0.93 to 1.33. However, it must be born in mind that the ultimate strain expression was obtained from a regression analysis of the same test set. The proposed approach set forth for determining the ultimate deflections achieves the ±20 percent for five of the eight walls tested with GFRP sheet reinforcement. Walls 6 and 7 have a test-to-predicted ratio of 1.21 and 1.22 respectively. Thus, seven of the eight walls tested with external GFRP sheet reinforcement are within ±22 percent of the actual deflections. The curvature analysis approach, which assumes the mechanics from a continuum body, is thus justified with confidence for walls with externally bonded GFRP sheet reinforcement.
In predicting the bending moment versus deflection hysteresis, small differences in the ultimate bending moment have a greater influence on the shape of the envelope than do small differences in the ultimate deflection. At the ultimate limit state, the bending moment versus deflection envelope has a relatively flat slope as compared to the initial region of loading. Where a maximum allowable error of 10 percent in

predicting the moment may be desired, an error of 20 percent in predicting the deflections may be tolerable. Because the unloading path is linear from the maximum experienced moment/deflection coordinate to the origin, the slope is not adversely effected if both errors approach the maximum allowable.
The poorest test-to-predicted results were obtained for Wall 5a, the standard masonry wall reinforced only with steel reinforcement. This wall was tested to its ultimate load but not its ultimate deflection, as it was desired to retrofit a partially damaged wall with GFRP sheet reinforcement. Thus, the test-to-predicted ratio for the strength parameter is valid but the ultimate deflection comparison is not. With a test-to-predicted ratio of 1.38 for the ultimate moment capacity, the mechanics approach adopted from reinforced concrete design was found to be highly conservative for masonry design in this case. The predicted deflection for Wall 5a presented in Table 2 was calculated by the same procedure used for the walls with GFRP sheet reinforcement. Instead of using the GFRP sheet reinforcement strains and geometry, the steel strain was taken as 0.002 mm/mm and the appropriate distance to the neutral axis was used to compute the ultimate curvature. This is not an accurate technique as the ultimate strain could exceed 0.005 mm/mm, which would produce a large error in the predicted curvature.
CONCLUSIONS
A rational model was developed to predict the bending moment versus centerline deflection response of concrete block masonry walls reinforced externally with GFRP sheets. The model includes the parameters of axial load, masonry properties, steel reinforcement properties, and GFRP sheet properties. It is recommended that additional work be carried out on sheets with smaller width and blocks with smaller depth to bring out other failure modes such as rupture of the GFRP sheets and compression failure of the blocks.
ACKNOWLEDGEMENTS
his work was conducted in the course of research leading to a Master of Science degree for the first author. The research was funded in part by the Canadian Masonry Research Institute (CMRI), the Network of Centre of Excellence on Intelligent Sensing For Innovative Structures (ISIS) and the Natural Sciences and Engineering Research Council of Canada (NSERC).
REFERENCES Abboud, B.E., Hamid, A.A., and Harris, H.G. (1996). “Flexural Behavior of Reinforced Concrete Masonry Walls under Out-of-Plane Monotonic Loads,” ACI Structural Journal, Vol. 93, No. 3, pp.327-335.
Abboud, B.E., Lu, X., and Becica, I.J. (1995). “Deflection of Reinforced Masonry Wall under Out-of-Plane Loads,” Proceedings of the Seventh Canadian Masonry Symposium, McMaster Univerisity, Hamilton, Ontario, Vol. 2, pp. 895-910.
Albert, M.L., Cheng, J.J.R., and Elwi, A.E. (1998). Rehabilitation of Unreinforced Masonry Walls with Externally Applied Fiber Reinforced Polymers, Structural Engineering Report No. 226, Department of Civil & Environmental Engineering, University of Alberta, Edmonton, T6G 2G7.

Kaar, P.H., Hanson, N.W., and Capell, H.T. (1978). “Stress-Strain Characteristics of High Strength Concrete,” Douglas McHenry International Symposium on Concrete and Concrete Structures, ACI Publication SP-55, American Concrete Institute, Detroit, pp. 161-185.
Kuzik, M.D., Elwi, A.E., and Cheng, J.J.R. (1999). Out-of-Plane Cyclic Behavior of Masonry Walls Reinforced Externally with GFRP, Structural Engineering Report No. 228, Department of Civil & Environmental Engineering, University of Alberta, Edmonton, T6G 2G7.
Saiidi, M. (1982). “Hysteresis Models for Reinforced Concrete,” Journal of the Structural Division, ASCE, Vol. 108, No. ST5, pp. 1077-1086.
Saiidi, M. and Sozen, M.A. (1979). Simple and Complex Models for Nonlinear Seismic Response of Reinforced Concrete Structures, Structural Research Series No. 465, Department of Civil Engineering, University of Illinois at Urbana, Illinois, 61801.
LIST OF NOTATIONS A area (mm2) a depth of the equivalent rectangular stress block, (mm) b width of the compression zone, (mm) d distance from extreme compression fibre to centroid of tension steel,
(mm) E modulus of elasticity, (MPa) f material strength (MPa) ft tensile masonry strength, (MPa) h depth of the wall, (mm) I moment of inertia, (mm4) L wall height, (mm) M bending moment, (Nmm) P compressive axial load, (N) R stiffness interpolation factor S section modulus, (mm3) Scr spacing of horizontal cracks, (mm) tGFRP nominal GFRP thickness, (mm) V shear force, (N) x length of shear span, (mm) ∆ wall centerline deflection (mm) ε uGFRP ultimate strain in the GFRP sheets ρGFRP GFRP reinforcement ratio
Subscripts ( )a actual quantity ( )c concrete quantity ( )cr cracking value ( )e effective quantity ( )m masonry quantity ( )s steel quantity ( )T transition quantity

Table 1 Flexural Stiffness of Wall Specimens
Cracked Gross Modified Gross
Icr EmIcr Ig EmIg Igf EmIg
f εGFRP a Mr
Wall (108 mm4)
(1012 Nmm2)
(108 mm4)
(1012 Nmm2)
(108 mm4)
(1012 Nmm2) (mm/mm) (mm) (kN-
m) 1 2.11 1.79 5.51 4.69 3.15 2.68 0.00818 22.9 33.6
2 1.46 1.24 4.90 4.17 2.54 2.16 0.00695 13.7 22.9
3 1.78 1.51 5.51 4.69 3.15 2.68 0.01101 19.4 26.3
4 1.42 1.21 5.51 4.69 3.15 2.68 0.01219 15.0 17.7
5a 1.00 0.85 5.51 4.69 3.15 2.68 N/A 10.4 7.8
5b 2.09 1.78 5.51 4.69 n/a n/a 0.00790 22.7 33.5
6 2.16 1.84 5.51 4.69 3.15 2.68 0.00940 23.7 38.4
7 2.43 2.07 5.51 4.69 3.15 2.68 0.01079 28.6 42.6
8 2.58 2.19 5.51 4.69 3.15 2.68 0.01098 33.0 48.3
Note: Em = 850f'm = 8500 MPa
Table 2 Test-to-Predicted Ratios for Bending Moment and Deflection
Moment Deflection
Test Predicted Test/Predicted Test (East) Test (West) Test
(Maximum) Predicted Test/Predicted
Wall (kN-m) (kN-m) (mm) (mm) (mm) (mm)
1 37.57 33.6 1.12 93.9 98.9 98.9 93.2 1.06 2 25.5 22.9 1.11 70.5 82.3 82.3 88.4 0.93 3 26.5 26.3 1.01 101.3 122.2 122.2 111.5 1.10 4 19.7 17.6 1.12 86.6 137.0 137.0 120.4 1.14 5a 10.8 7.8 1.38 56.5 58.9 58.9 41.0 1.44 5b 34.6 32.7 1.06 88.3 88.6 88.6 93.1 0.95 6 40.9 37.4 1.09 113.5 113.3 113.5 93.7 1.21 7 46.9 41.2 1.14 92.4 118.0 118.0 96.5 1.22 8 54.3 48.2 1.13 76.5 132.0 132.0 99.2 1.33

0
10
20
30
40
0 50 100 150 Centerline Deflection (mm)
Total Moment (kN-m)
SR: 2-10M @600 mm o/c GFRP: 2 - 250 mm Sheets Axial Load: 30 kN
Fig. 1 Wall 1: (a) Bending Moment vs Deflection
C : (∆ T,MT)
F: (∆ u ,Mu)
A : (0 ,0)Centerline Deflection
To
tal
Mo
me
nt
(∆a,Ma)
Fig. 2. Proposed Model for Bending Moment versus Deflection Response
MT/Mcr = 94.323x + 0.9913
R2 = 0.9998
0
0.5
1
1.5
2
2.5
3
0 0.005 0.01 0.015 0.02
GFRP Reinforcement Ratio
MT /
Mcr
Fig. 3. Regression Analysis for Transition Moment
ε max = -6 .4962x + 13223
R2 = 0.9969
0
2000
4000
6000
8000
10000
12000
14000
0 100 200 300 400 500 600 700
GFRP A rea (mm2)
GF
RP
Str
ain
at F
ail
ure
(m
icro
stra
in)_
Fig. 4 Regression analysis for GFRP strain at failure
0
5
10
15
20
25
30
35
40
0 20 40 60 80 100 120 140Centerline Deflection (mm)
To
tal
Mo
me
nt
(kN
-m)
East
Predicted
West
Fig. 5 Wall 1 Moment vs Deflection: Predicted and Actual