Embed Size (px)
Citation preview
5TH EUROPEAN CONFERENCE FOR AERONAUTICS AND SPACE SCIENCES (EUCASS)
Copyright 2013 by Falk Middelstädt, Jens Gerstmann. Published by the EUCASS association with permission.
Numerical Investigations on Fluid Flow through Metal Screens
Falk Middelstädt*, Jens Gerstmann**
* Fritz-Büsing Str. 3, 26655 Westerstede, Germany
** German Aerospace Center (DLR), Institute of Space Systems, Bremen, Germany
Abstract
Metallic screens have important functions in tank systems and feedline systems of spacecraft’s due to their filtering
capabilities and capillary features. The screen resistance upon flow through is significant influenced by the individual
mesh and pore geometry of the individual screen. The flow behavior in the screen is experimentally difficult to
observe. In order to obtain more insight and to gain a deeper understanding of the flow phenomena in the screen,
numerical calculations with respect to the flow resistance and the flow field insight the screen were performed. In
this paper the screens “Twilled Dutch 165x800” and “Twilled Dutch 200x1400” are numerical investigated by using
the commercial solver ANSYS Fluent 13.0. Calculations for low to medium screen Reynolds numbers with the
different fluids water, liquid hydrogen and IPA are carried out. The results show good agreement with experimental
and analytical data. Furthermore the streamlines, the local velocity and pressure field are investigated. Predicted
effects such as the transient behaviour at screen Reynolds number 40 by Green et al. [1] can be approved.
1. Introduction
The knowledge and understanding, as well as the application of intelligent propellant management is one of the key
technologies for a successful development of future advanced cryogenic upper stage systems, prepared to meet the
future market demands concerning more mission flexibility like multiple restart options and long duration missions
with intermediate long ballistic flight phases. Main functions of the propellant system are: to guarantee the gaseous
and bubble free supply of propellants at the specified thermodynamic conditions during the complete mission; to
minimize the boil-off losses due to evaporation; to ensure no loss of propellants during venting; to avoid critical
sloshing phenomena; to avoid critical pressure variations generated by heat- and mass transfer processes at the
gas/liquid interface. Metallic screens in tank systems of spacecraft’s are of fundamental importance. Beside to their
filtering function their capillary features were used for liquid acquisition or phase separation [2] [3]. The flow
through resistance is main parameter of the screen and has to be known for preliminary tank system design. For the
preliminary design and estimation of the propellant behavior in space crafts, validated CFD-Tools with the capability
to calculate the complex physical behavior in tank systems are of crucial importance.
Numerical only a few studies have been performed on this topic so far, limited due to available computing power.
Today, the computer and CFD tools are able to resolve the flow field in the screen, which opens up the possibility to
obtain more insight in the flow behavior within and around screens. In this paper the flow through behavior of two
fine metal screens, “Twilled Dutch 165x800” and “Twilled Dutch 200x1400”, are investigated with the commercial

Falk Middelstädt, Jens Gerstmann
2
CFD tool ANSYS Fluent. The screen resistance is compared with experimental data and empirical correlations from
Armour et al. [4] and Cady [5].
2. State of the Art
Screens consist of single threads which are woven under a certain pattern. As materials are used metals like cooper
and iron steel, but also cotton, nylon and other synthetic materials. The threads which are parallel with respect to the
woven direction are called filling threads, the threads perpendicular are called chaining threads. In tank systems of
spacecrafts and satellites, metallic screens are widely used and are of importance. Three different weave types are
generally used, .the “plain weave”, the “twilled weave” and the “dutch weave”. The three different weave types are
shown in Fig. 1.
Figure 1: Plain weave, twilled weave and dutch weave [4]
Depending on the weave pattern, there are four different pore types. These pore types are shown in Fig. 2. In contact
with a fluid, each pore type has its own flow through behavior which results in an individual screen resistance
behavior.
Pore typ 1
Pore typ 2
Pore type 3
Pore Type 4
Figure 2 Pore types in dependence on the weave [7].

NUMERICAL INVESTIGATIONS ON FLUID FLOW THROUGH METAL SCREENS
3
Since the 1930s the screen resistance was investigated systematically by various authors [4] [5] [8] [9] [7], mainly
experimentally. In these experiments the flow resistance was measured in dependence of the fluid velocity prior to
the screen. As result analytical correlations for the dimensionless friction factor fs were presented. The most common
approach is given by Armour [4]:
(1)
Where and are empirical constants, which have to be found. is the screen Reynolds number defined as
( ) (2)
with the hydraulic diameter, the mean velocity of the approaching liquid, the dynamic viscosity and the
density; represents the coefficient of the screen surface area to screen volume. is the friction factor defined as
(3)
stands for the porosity. L is the ratio of the length of the streamline passing through the screen and the screen
thickness. Armour shows that for twilled dutch screens the streamlines inside the screen are 1,28 times longer than
the screen thickness, whereas for plain the length of the flow path is equal to the screen thickness.
The general finding is, that the resistance behavior can be spitted in two separate regions, a low Reynolds number
and a high Reynolds number region. At low Reynolds numbers viscous effects dominates the occurring pressure
drop. The fluid shows laminar flow behavior when passing the screen and can be described by creping flow models.
For high Reynolds numbers the flow becomes turbulent character and the intertia forces dominates the resistance
behavior and therewith the resulting pressure drop. Armour [4] determined the value of for the laminar
region and for the turbulent region. Armour assumes, that these are general constants and they are valid for
each of the above mentioned screen types.
E.C. Cady [5] suppose the same general dependency of the flow resistance on Reynolds number like Armour.
However, Cady shows that each screen type has its own constants with some major differences, see Tab. 1.
Table 1: Screen parameter determined by Cady [5]
Screen type Screen notation
Thread diameter [µm]
α β
Chaining threads Filling threads
Twilled Dutch
325x2300 38,10 25,40 3,2 0,19
200x1400 71,12 40,64 4,2 0,20
165x800 73,66 50,80 3,3 0,17
Reverse Dutch 720x140 35,56 109,22 11,0 0,47
Plain Dutch 50x50 139,70 114,30 13,5 0,26
24x110 381,00 266,70 8,61 0,52
Falk Middelstädt, Jens Gerstmann
4
Twilled Square 500x500 25,40 25,40 5,7 0,65
Square
150x150 66,04 66,04 5,7 0,50
60x60 190,50 190,50 5.7 0,40
40x40 254,00 254,00 5,7 0,60
Belov et al. [9] shows that the present models in the literature have large deviations with respect to the magnitude of
the coefficients. The porosity of the screen material was estimated by geometrical factors mostly. Since the pressure
drop over the screen is proportional to the square of the porosity, an erroneous value will have a significant effect on
the determined coefficients in the empirical model.
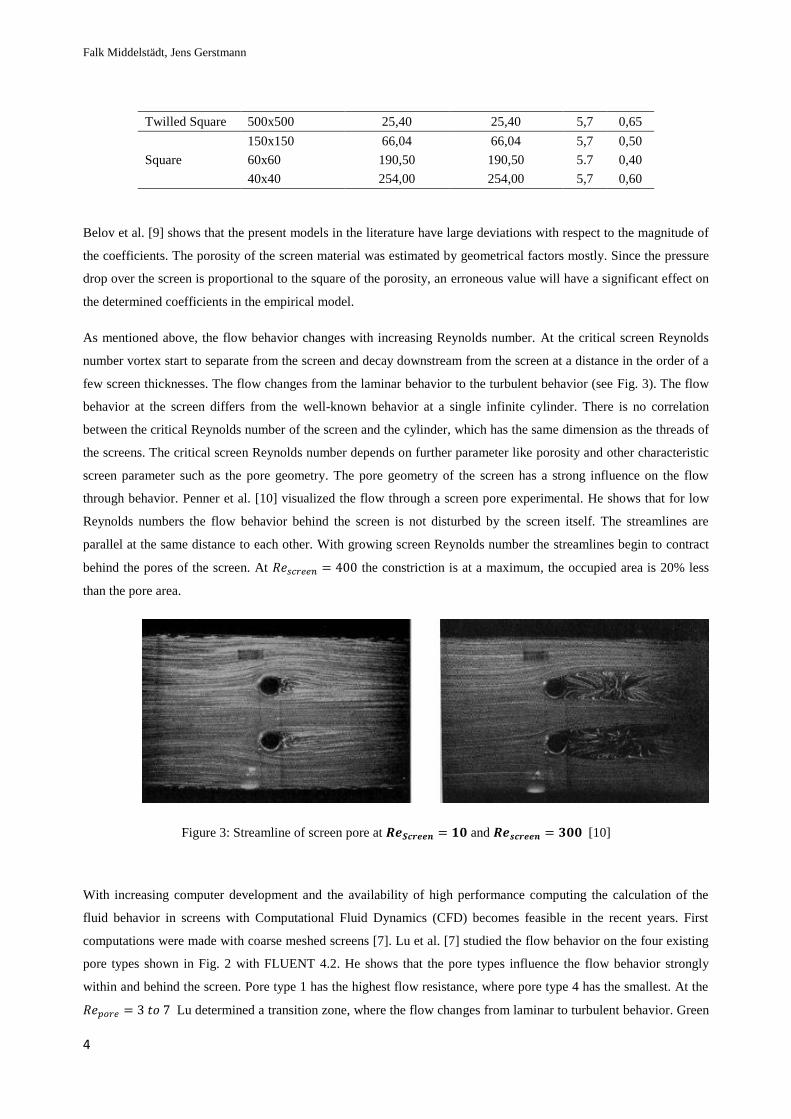
As mentioned above, the flow behavior changes with increasing Reynolds number. At the critical screen Reynolds
number vortex start to separate from the screen and decay downstream from the screen at a distance in the order of a
few screen thicknesses. The flow changes from the laminar behavior to the turbulent behavior (see Fig. 3). The flow
behavior at the screen differs from the well-known behavior at a single infinite cylinder. There is no correlation
between the critical Reynolds number of the screen and the cylinder, which has the same dimension as the threads of
the screens. The critical screen Reynolds number depends on further parameter like porosity and other characteristic
screen parameter such as the pore geometry. The pore geometry of the screen has a strong influence on the flow
through behavior. Penner et al. [10] visualized the flow through a screen pore experimental. He shows that for low
Reynolds numbers the flow behavior behind the screen is not disturbed by the screen itself. The streamlines are
parallel at the same distance to each other. With growing screen Reynolds number the streamlines begin to contract
behind the pores of the screen. At the constriction is at a maximum, the occupied area is 20% less
than the pore area.
Figure 3: Streamline of screen pore at and [10]
With increasing computer development and the availability of high performance computing the calculation of the
fluid behavior in screens with Computational Fluid Dynamics (CFD) becomes feasible in the recent years. First
computations were made with coarse meshed screens [7]. Lu et al. [7] studied the flow behavior on the four existing
pore types shown in Fig. 2 with FLUENT 4.2. He shows that the pore types influence the flow behavior strongly
within and behind the screen. Pore type 1 has the highest flow resistance, where pore type 4 has the smallest. At the
Lu determined a transition zone, where the flow changes from laminar to turbulent behavior. Green

NUMERICAL INVESTIGATIONS ON FLUID FLOW THROUGH METAL SCREENS
5
et al. [1] performed calculations on screens used in wind tunnels and made comparisons with experimental data from
Schubauer [8]. The deviations for high screen Reynolds numbers are in the order of 10% and for low screens
Reynolds numbers in the order of 40%. Green et al. [1] used no turbulence model. He assumed a laminar flow
character in the screen. P.M. Heertjes [11] postulated a transition at in accordance to Lu et al. [7].
At S.I. Green [1] determined transient flow behavior behind the screen. The fluctuation of the
pressure drop behind the screen across the flow section is only 1,5% compared to the mean pressure drop.
Shklyar et al. [12] used the commercial CFD tool FLUENT with a SST k-ω turbulence model for his calculations on
screens deployed in green houses. These structures consist of large and small scaled geometries like screens causing
high meshing costs. To decrease the calculations effort, an analytical model was developed from the numerical
results, and implemented within FLUENT.
3. Numerical Model
In this study the commercial CFD code ANSYS FLUENT 13.0 is used to calculate the pressure drop occurring upon
flow through of metallic screens. Two different screens are investigated, a “Twilled Dutch 165x800” woven screen
and a “Twilled Dutch 200x1400” woven screen. Due to the high packing densities, the threads are squeezed. During
the screen production the threads are strapped into each other, which will cause deformations. In the numerical
model a CAD model of the screens is implemented into the numerical model. The real shape of the screen is taken
into account for modeling the screen as far as possible. In Tab. 2 are listed the geometric data of the real screen
compared with the data of the used CAD model for the numerical calculations.
Table 2: Screen parameters
Screen type Geometry parameter Manufacture Model
Twilled Dutch 165x800
Chaining thread [numbers per inch] 165 165,0422
Filling thread [numbers per inch] 800 800,0000
Chaining thread diameters [µm] 70 50
Filling thread diameter [µm] 50 50
Porosity [-] 0,460 0,467*
Twilled Dutch 200x1400
Chaining thread [numbers per inch] 200 200,0000
Filling thread [numbers per inch] 1400 1400,0276
Chaining thread diameters [µm] 70 70
Filling thread diameter [µm] 40 40
Porosity [-] 0,330 0,301*
* calculated following screen model of Fischer [13]
The data in Tab. 2 shows, that there is a very good agreement between the used CAD model and the real screen data.
To minimize the calculation effort the smallest periodic cutout is used. The used cut out is shown in Fig. 4. At the
boundaries of the cut out periodic boundary conditions can be defined.

Falk Middelstädt, Jens Gerstmann
6
Figure 4: CAD screen model, periodic cutout of "Twilled Dutch 165x800" with the dimensions 0.200 mm x
0,782mm x 0,170 mm
The full numerical model used for the calculation of the friction factor is shown in Fig. 5. Upstream to the screen an
inflow region is defined. The inflow region has a length of two screen thicknesses. At the backside, downstream to
the screen, the flow domain is of ten screen thicknesses length and ends with a velocity outlet boundary condition. At
higher Reynolds numbers the flow domain must be extended to be able to calculate turbulent mixing length after the
screen and to meet the outflow boundary condition.
Figure 5: Numerical model, screen with mesh domain
The mesh of the fluid domain is structured. The cell size is in the order of 1e-6 mm. Close to the screen the mesh is
refined to fulfill a high local resolution to be able to calculate the high velocity gradients in the screen region. At the
inlet and outlet the mesh has a coarse resolution, to limit the cell number and to optimize the calculation effort. At
periodic non-
conformel interface
velocity outlet
massflow inlet
screen periodic boundary
condition

NUMERICAL INVESTIGATIONS ON FLUID FLOW THROUGH METAL SCREENS
7
the intersections non-conformal interfaces are used. Non-conformal interfaces do not need equal sized neighbor cells.
An interpolation algorithm provided by the ANSYS FLUENT code calculated the fluxes through the mesh interface.
The inner screen region is unstructured meshed. A structured mesh is due to the complex geometry not efficient and
with regard to the convergence behavior very time-consuming. Due to the upper limit of 8 Mio cells, it was not
possible to mesh both screen types with the same resolution. At the threads of the screen “Twilled Dutch 165x800”
20 prism layers with a total heights of 3,43 µm where defined. The screen “Twilled Dutch 200x1400” has 13 prism
layers with a height of 3,21 µm.. The “Twilled Dutch 200x1400” is much denser than the “Twilled Dutch 165x800”,
which requires a higher surface mesh resolution. The tightness of the threads limits the prism heights. At close
proximities prims layers could not be defined. TGrid, the used commercial meshing tool provided by ANSYS, has
the ability to stop prims growth in these areas. At such end surfaces non-con-formal interfaces are implemented, as
displayed in Fig. 6.
Figure 6: Screen mesh with prism layers at close proximities
The remaining screen domain was filled up with tetrahedron elements. In total 7,5 mio. cells for “Twilled Dutch
165x800” and 8,0 mio. cells for screen “Twilled Dutch 200x1400” are used. The skewness of the cells are below the
critical value, just a few cells are above 0.9. The convergence criterion of each calculation is reached satisfactory.
The remaining residuals are below 10-7
.
Three different fluids are used to calculate the pressure drop over the screens – water, liquid nitrogen and IPA. The
different fluid properties are listed in Tab. 3.
Table 3 Fluid properties
Property Density [kg/m³] dyn. Viscosity Pa s
Liquid water 998,24 1,01e-3
Liquid nitrogen 807.7 1,63e-4
IPA 787,227 2,395e-3
Prismlayer
Chained threads
Filling threads 1
Non-conformal interfaces at
heat surfaces
Filling threads 2
Fluid
Falk Middelstädt, Jens Gerstmann
8
The flow is assumed to be incompressible and isothermal. The energy equation is not solved. The inlet is defined as
mass-flow inlet, the outlet as outflow without specific pressure boundary-condition. The periodic non-conformal
interfaces could not be specified at every cell intersection. Due to local very small cell sizes ANSYS FLUENT is not
able to adopt the intended cell face definition. These areas are converted to walls with a slip-condition to exclude
viscous resistance. Since these cell faces are parallel to the flow the influence of this cleanup is negligible. Following
Green [1] no turbulence model is used. The cell sizes are of 1e-9 mm and therewith below the limit set by Fluent.
With the numerical model Reynolds numbers in the region from 1e-1 to 1000 can be calculated, to be able to cover
the laminar, the transition and the turbulent region. For low Reynolds numbers steady-state calculations are
performed. For higher Reynolds numbers transient calculations with small time steps are carried out.
4. Numerical Results and Discussion
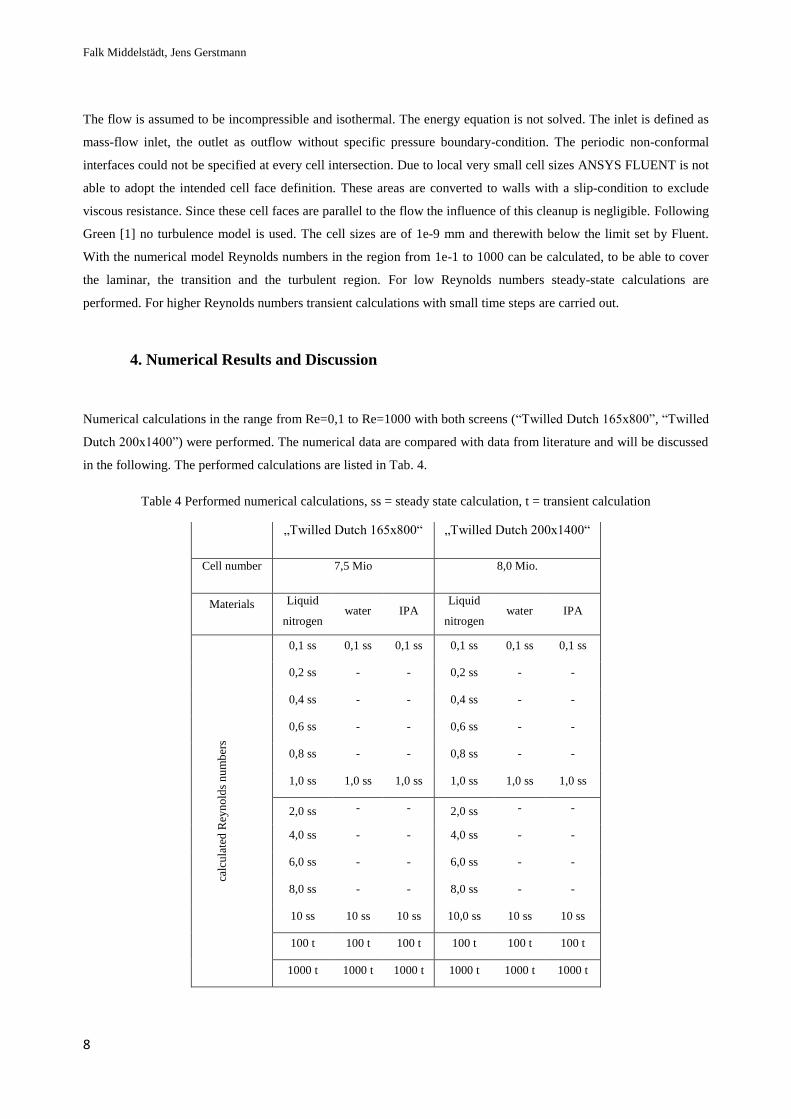
Numerical calculations in the range from Re=0,1 to Re=1000 with both screens (“Twilled Dutch 165x800”, “Twilled
Dutch 200x1400”) were performed. The numerical data are compared with data from literature and will be discussed
in the following. The performed calculations are listed in Tab. 4.
Table 4 Performed numerical calculations, ss = steady state calculation, t = transient calculation
„Twilled Dutch 165x800“ „Twilled Dutch 200x1400“
Cell number 7,5 Mio 8,0 Mio.
Materials Liquid
nitrogen water IPA
Liquid
nitrogen water IPA
calc
ula
ted
Rey
nold
s n
um
ber
s
0,1 ss 0,1 ss 0,1 ss 0,1 ss 0,1 ss 0,1 ss
0,2 ss - - 0,2 ss - -
0,4 ss - - 0,4 ss - -
0,6 ss - - 0,6 ss - -
0,8 ss - - 0,8 ss - -
1,0 ss 1,0 ss 1,0 ss 1,0 ss 1,0 ss 1,0 ss
2,0 ss - - 2,0 ss - -
4,0 ss - - 4,0 ss - -
6,0 ss - - 6,0 ss - -
8,0 ss - - 8,0 ss - -
10 ss 10 ss 10 ss 10,0 ss 10 ss 10 ss
100 t 100 t 100 t 100 t 100 t 100 t
1000 t 1000 t 1000 t 1000 t 1000 t 1000 t
NUMERICAL INVESTIGATIONS ON FLUID FLOW THROUGH METAL SCREENS
9
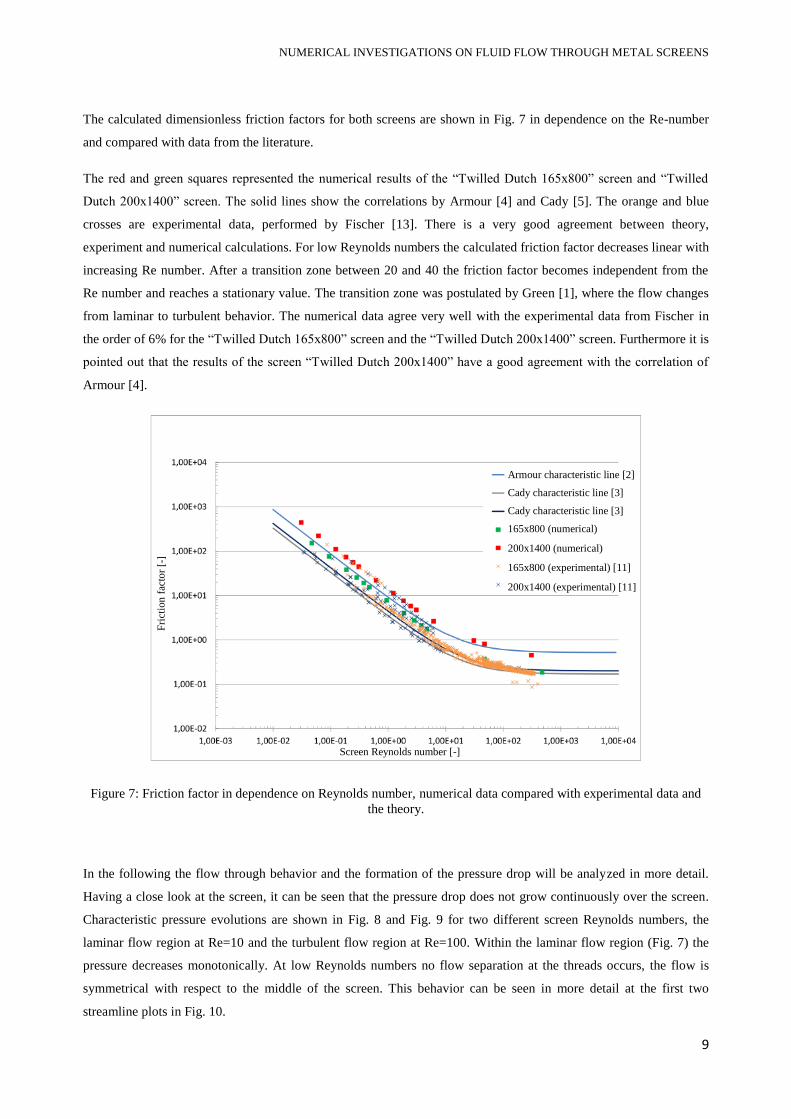
The calculated dimensionless friction factors for both screens are shown in Fig. 7 in dependence on the Re-number
and compared with data from the literature.
The red and green squares represented the numerical results of the “Twilled Dutch 165x800” screen and “Twilled
Dutch 200x1400” screen. The solid lines show the correlations by Armour [4] and Cady [5]. The orange and blue
crosses are experimental data, performed by Fischer [13]. There is a very good agreement between theory,
experiment and numerical calculations. For low Reynolds numbers the calculated friction factor decreases linear with
increasing Re number. After a transition zone between 20 and 40 the friction factor becomes independent from the
Re number and reaches a stationary value. The transition zone was postulated by Green [1], where the flow changes
from laminar to turbulent behavior. The numerical data agree very well with the experimental data from Fischer in
the order of 6% for the “Twilled Dutch 165x800” screen and the “Twilled Dutch 200x1400” screen. Furthermore it is
pointed out that the results of the screen “Twilled Dutch 200x1400” have a good agreement with the correlation of
Armour [4].
Figure 7: Friction factor in dependence on Reynolds number, numerical data compared with experimental data and
the theory.
In the following the flow through behavior and the formation of the pressure drop will be analyzed in more detail.
Having a close look at the screen, it can be seen that the pressure drop does not grow continuously over the screen.
Characteristic pressure evolutions are shown in Fig. 8 and Fig. 9 for two different screen Reynolds numbers, the
laminar flow region at Re=10 and the turbulent flow region at Re=100. Within the laminar flow region (Fig. 7) the
pressure decreases monotonically. At low Reynolds numbers no flow separation at the threads occurs, the flow is
symmetrical with respect to the middle of the screen. This behavior can be seen in more detail at the first two
streamline plots in Fig. 10.
Screen Reynolds number [-]
Fri
ctio
n f
acto
r [-
]
Armour characteristic line [2]
Cady characteristic line [3]
Cady characteristic line [3]
165x800 (numerical)
200x1400 (numerical)
165x800 (experimental) [11]
200x1400 (experimental) [11]

Falk Middelstädt, Jens Gerstmann
10
Figure 8: Numerical calculated pressure characteristic for screen 165x800 at Rescreen = 10
With increasing screen Reynolds numbers the behavior changes, due to the occurring flow separation at the threads.
Behind the screen the static pressure increases. At a distance of about five screen thicknesses, the pressure reaches a
constant level. In the screen and upon leaving the screen a small unphysical increase in total pressure is calculated.
Figure 9: Numerical calculated pressure characteristics for screen 165x800 at Rescreen = 1000
The pressure is calculated by the integration of cell surface values. In regions with flow separation and high flow
gradients, the flow path line cross these surfaces more than one time and causes the observed small overestimation.
Static pressure
Total pressure
Length (weighted on screen thickness) [-]
Pre
ssu
re [
Pa]
screen
screen
Static pressure
Total pressure
0
0
Pre
ssu
re [
Pa]
Length (weighted on screen thickness) [-]

NUMERICAL INVESTIGATIONS ON FLUID FLOW THROUGH METAL SCREENS
11
Figure 10: Screen 200x1400 - flow behavior at different screen Reynolds numbers
Falk Middelstädt, Jens Gerstmann
12
Fig. 10 illustrates the flow conditions at various screen Reynolds numbers with liquid nitrogen. In front of the screen
the flow is smooth and laminar. Within the screen the path lines start to spread up following the pore geometry. At
low Reynolds numbers the path lines get back together when leaving the screen. The detachment area behind the
screen is small, but starts to grow with increasing screen Reynolds number. At screen Reynolds numbers ten the
onset of vortex formation can be observed. Downstream from the screen at a distance of about one screen thickness
the vortices are decayed and the flow is laminar again.
Higher screen Reynolds numbers generates a fully developed turbulent flow after the screen. At the investigated
periodic screen sample eight main outflow regions can be identified as shown in Fig. 10. In Fig. 10 four different
flow through steram pathes are visible, the corresponding additional four flow pathes are parallel behind. At higher
Reynolds number than Rescreen = 40 the flow is strongly constricted at the pore outlets, like Penner et al. [10] could
also show in their investigations. At the individual pores the flow character is similar to a forming turbulent free jet.
The separated jets are interacting downstream from the screen. The generated turbulence needs more than ten screen
thicknesses to decay. For a detailed investigation of this flow region, the mesh has to be refined with a much higher
resolution. During passing the “Twilled Dutch 165x800” screen the flow is accelerated to a value 4.3 times higher
than the approaching flow velocity Due to the lower porosity, the fluid is accelerated in the screen “Twilled Dutch
200x1400” up to the twelvefold. This maximum is located at the chain threads, where the cross section is smallest. A
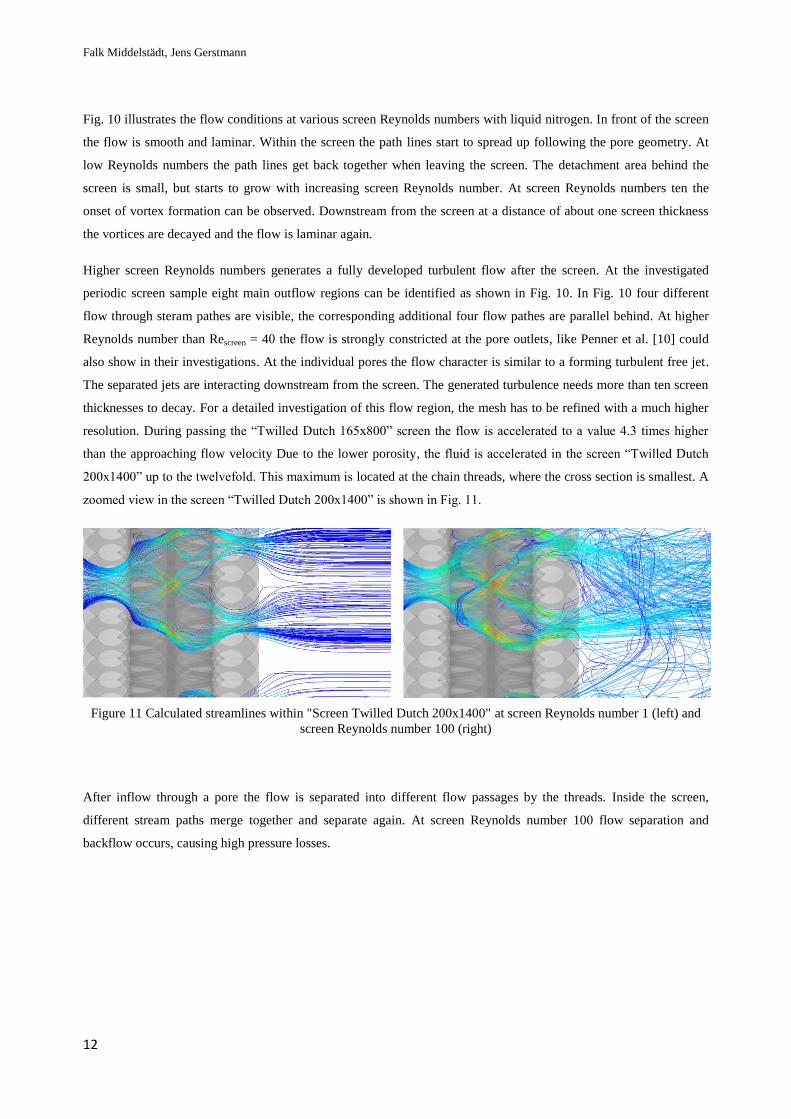
zoomed view in the screen “Twilled Dutch 200x1400” is shown in Fig. 11.
Figure 11 Calculated streamlines within "Screen Twilled Dutch 200x1400" at screen Reynolds number 1 (left) and
screen Reynolds number 100 (right)
After inflow through a pore the flow is separated into different flow passages by the threads. Inside the screen,
different stream paths merge together and separate again. At screen Reynolds number 100 flow separation and
backflow occurs, causing high pressure losses.
NUMERICAL INVESTIGATIONS ON FLUID FLOW THROUGH METAL SCREENS
13
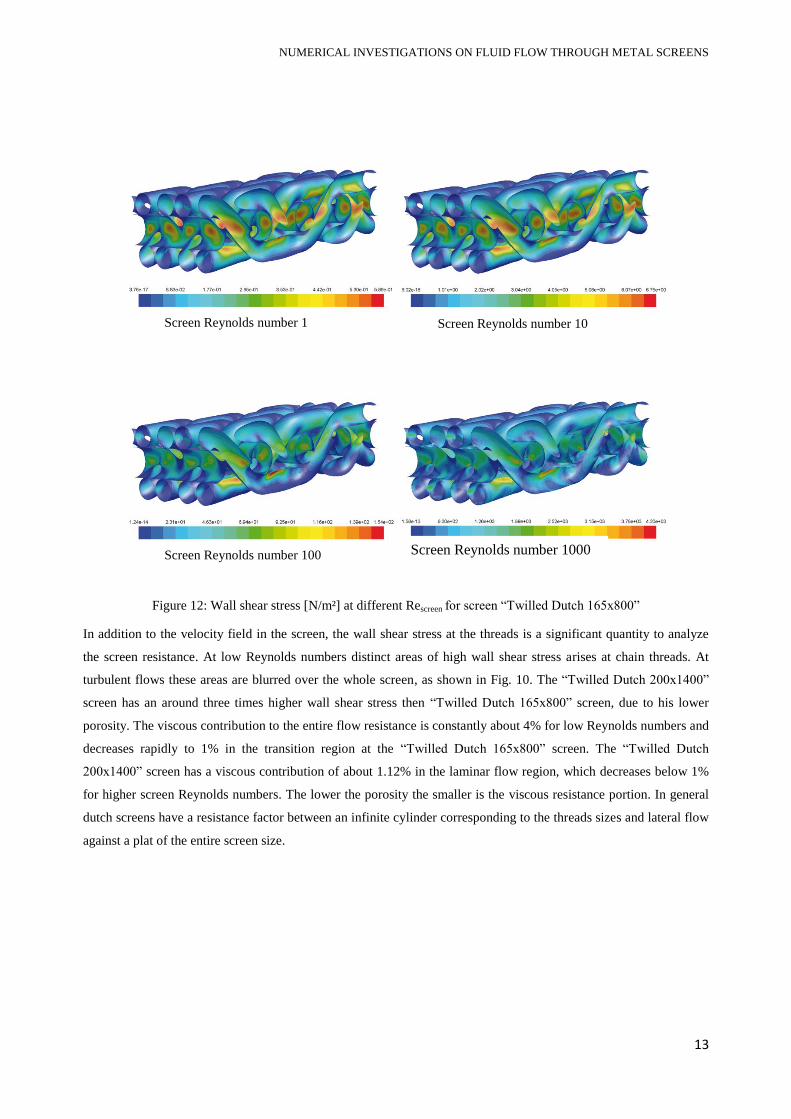
Figure 12: Wall shear stress [N/m²] at different Rescreen for screen “Twilled Dutch 165x800”
In addition to the velocity field in the screen, the wall shear stress at the threads is a significant quantity to analyze
the screen resistance. At low Reynolds numbers distinct areas of high wall shear stress arises at chain threads. At
turbulent flows these areas are blurred over the whole screen, as shown in Fig. 10. The “Twilled Dutch 200x1400”
screen has an around three times higher wall shear stress then “Twilled Dutch 165x800” screen, due to his lower
porosity. The viscous contribution to the entire flow resistance is constantly about 4% for low Reynolds numbers and
decreases rapidly to 1% in the transition region at the “Twilled Dutch 165x800” screen. The “Twilled Dutch
200x1400” screen has a viscous contribution of about 1.12% in the laminar flow region, which decreases below 1%
for higher screen Reynolds numbers. The lower the porosity the smaller is the viscous resistance portion. In general
dutch screens have a resistance factor between an infinite cylinder corresponding to the threads sizes and lateral flow
against a plat of the entire screen size.
Screen Reynolds number 1 Screen Reynolds number 10
Screen Reynolds number 100 Screen Reynolds number 1000

Falk Middelstädt, Jens Gerstmann
14
5. Conclusion
In this paper the flow through behavior of metallic screens are investigated numerically. A CAD model is created of
two screens, the “Twilled Dutch 165x800” screen and the “Twilled Dutch 200x1400” screen, The screen models is
implemented in the commercial CFD Code ANSYS FLUENT. Numerical calculations with varying screen Reynolds
numbers are performed in the range of 0,1 to 1000. The results are compared with experimental data and theories by
Armour et al. [4] and Cady [5]. The numerical data show good agreement with the experimental data from Fischer
[13] and the correlation for the friction factor defined by Armour [4]. The analysis of the numerical results show
further that at the screen Reynolds number 40 flow separation takes place and the pressure drop increases rapidly as
predicted by Green [1]. The flow becomes transient and the forming vortex need a long distance in the backflow to
decay. It could be verified, that the porosity is an important screen parameter, influencing the pressure drop and flow
behavior. The occurring wall shear stress at the threads is calculated and analyzed for both screen types in
dependence on the screen Reynolds number. The numerical results show that for low Reynolds numbers, in the
laminar flow region, areas of high wall shear stress arises at chain threads. For high screen Reynolds numbers, in the
turbulent flow region, these areas are blurred over the whole screen. The “Twilled Dutch 200x1400” screen has an
around three times higher wall shear stress then “Twilled Dutch 165x800” screen, due to his lower porosity. The
presented numerical models demonstrate its applicability for calculating isothermal screen flow through behavior. In
the next step the model will be extended to be able to consider the non-isothermal conditions, which are present in
real spacecraft systems like cryogenic upper stage systems.
6. References
[1] T. Waung, A. Vakil, S. Green and Z. Wang, "Simulation of Flow Through Woven fabrics," Department of
Mechanical Engineering and Pulp and Paper Centre, Canada, 2007.
[2] P. Behruzi, J. Klatte and G. Netter, "Passive Phase Separation in Cryogenic Upper Stage Tanks," in Joint
Propulsion Conf., to be published, July 2013.
[3] P. Behruzi, J. Klatte, N. Fries, G. Netter, T. Kranz and A. Sirbi, "Cryogenic Propellant Management during," in
Space Propulsion Conf., Bordeaux, France, 2012.
[4] J. Armour and J.N. Cannon, "Fluid Flow Through Woven Screens," The Procter and Gamble Company, Mai
1968.
[5] E. Cady, "Study of Thermodynamic Vent and Screen Baffle Integration for Orbital Storage and Transfer of
Liquid Hydrogen," Mc Donnal Douglas Astronautics Company and National Aeronautics and Space
Administration, August 1973.
[6] Deutsches Institut für Normung e.V., Begriffe und Kurzteichen für Siebböden- DIN 5185-1, 2000.
[7] W.-M. Lu, K.-L. Tung and K.-J. Hwang, "Fluid Flow through Basic Weaves of Monofilament Filter Cloth,"
Department of Chemical Engineering, National Taiwan University and Department of Chemical Engineering,

NUMERICAL INVESTIGATIONS ON FLUID FLOW THROUGH METAL SCREENS
15
Tamkang University, 1996.
[8] G. Schubauer, P. Klebanoff and W. Spangenberg, Aerodynamic Characteristics of Damping Screens, National
Advisory Committee of Aeronautics NACA, 1950.
[9] V. Devisilov, S. Zhdanov and S. Belov, "Hydaulic Resistance of Woven Screens," 1990.
[10] S. Penner and A.F. Robertson, "Flow Through Fabric-like Structures," Textile Research Journal, pp. 775-782,
1951.
[11] P. M. Heertjes, "Studies in Filtration: The initial stages of the cake filtration," Chemical Engineering Science
Vo.6, pp. 269 - 276, 1957.
[12] A. Shklyar and A. Arbel, "Numerical Solutions of Turbulent Flow Through Screen," Institute of Agricultureal
Engineering, Israel, 2009.
[13] A. Fischer, "Flow Resistance of Metallic Screens in Liquid, Gaseous and Cryogenic Flow - to be published," in
European Conference for Aero-Space science, Munich, Germany, 2013.