Embed Size (px)
Citation preview

Transaction A: Civil EngineeringVol. 16, No. 4, pp. 331{339c Sharif University of Technology, August 2009
Numerical Investigation of theE�ects of Soil Densi�cation on theReduction of Liquefaction-InducedSettlement of Shallow Foundations
H. Shahir1 and A. Pak1;�
Abstract. The liquefaction phenomenon is usually accompanied by a large amount of settlement.Based on the observations made in past earthquakes, ground improvement by densi�cation is one ofthe most useful approaches to reduce the liquefaction-induced settlement. Currently, there is no analyticalsolution for evaluation of the amount of settlement and tilting of footings that are constructed on densi�edground surrounded by lique�able soil. A number of factors, such as underlying soil properties, dimensionsof the footing and earthquake loading characteristics, cause the problem to become complicated. In thispaper, the dynamic response of shallow foundations on both lique�able and non-lique�able (densi�ed) soilsis studied using a 3D fully-coupled dynamic analysis. A well-calibrated critical state two-surface plasticitymodel has been used in the numerical analysis, which is capable of accounting for the volumetric/shearresponse of the soil skeleton at a wide range of densities (void ratios) and con�ning pressures. TheOpenSEES platform is used to conduct the numerical simulations. The proposed numerical model hasbeen applied in simulating a series of centrifuge experiments. Comparison of the numerical results andthe centrifuge experiment measurements reveals that the numerical model is capable of capturing theimportant aspects of the dynamic response of footings on lique�able and densi�ed subsoils, and can beused as a valuable tool for investigating the amount of liquefaction-induced settlement, tilting of footingsand their reduction due to densi�cation.
Keywords: Liquefaction; Ground improvement; Densi�cation; Shallow foundation; Settlement.
INTRODUCTION
The settlement and tilting of buildings due to lique-faction are major causes of structural damage dur-ing earthquakes. One of the main approaches toreduce liquefaction damage is ground improvement bydensi�cation-based methods such as vibro- oatation,dynamic compaction and blasting. The e�ectivenessof densi�cation in mitigating the e�ects of liquefac-tion can be demonstrated by reviewing the low levelof damage in shallow foundations built on densi�edzones during major seismic events as far back as the
1. Department of Civil Engineering, Sharif University of Tech-nology, Tehran, P.O. Box 11155-9313, Iran.
*. Corresponding author. E-mail: [email protected].
Received 9 July 2008; received in revised form 12 January 2009;accepted 2 March 2009
1964 Niigata earthquake [1,2]. Observations in �eldcase histories indicate that by densi�cation throughoutthe full lique�able soil thickness and adequate lateralextent, the displacement of the foundation decreasesconsiderably in comparison to the adjacent unimprovedareas. The observations, however, reveal that somedeformation may be expected, even when the total liq-ue�able depth is improved especially at high intensityof shaking.
Current design practice, regarding the use of den-si�cation as a liquefaction resistance measure, is mostlybased on the mitigation of liquefaction triggering by areasonable safety margin. In this design procedure, theamount of reduction of the foundation settlement underearthquake loading is unknown. Currently, there is nostandard design procedure for evaluating the amountof foundation settlement considering soil improvementmeasures employed to mitigate liquefaction.

332 H. Shahir and A. Pak
The seismic response of a shallow foundation ona saturated granular soil layer subjected to seismically-induced liquefaction is complicated. The evaluationof liquefaction-induced settlement and tilting requiresmodeling the process of liquefaction and subsequentconsolidation and its e�ect on the behavior of shallowfoundations. Quantitative analysis of liquefactioncan only be accomplished by considering the coupledinteraction of the soil skeleton and the pore uid. Forthis purpose, a suitable formulation for the behaviorof the two-phase continuum and a proper constitutivemodel are required.
In some numerical investigations, the in uenceof soil liquefaction on the soil-structure interactionphenomenon has been studied [3-6]. These modelingsgenerally consist of simulation of the dynamic inter-action between a homogeneous liquefying soil layerand a structure resting on the ground surface, usinga 2D (plane strain assumption) coupled �nite elementanalysis. To the best of the authors' knowledge,the dynamic response of a shallow foundation onimproved ground by compaction methods has not yetbeen investigated. There are, however, a numberof centrifuge experiments, in which the reduction ofa foundation settlement due to subsoil densi�cationhas been studied [2,7,8]. The experimental mea-surements indicate that, as the compaction depthincreases, the settlement and tilting of footing de-creases. It was observed that there is a de�nitedepth, below which, further compaction has a minore�ect on reducing the foundation settlement. Liuand Dobry [7] determined this depth to be equal to1.5 times the footing width, which was equivalentto 0.55 times of the total lique�able soil thickness.Hausler [2] obtained this depth equal to 1.75 timesof the footing width, which was 0.7 times of thetotal lique�able soil thickness. The centrifuge ex-periments performed by Coelho et al. [8] revealedthat the most important bene�t, resulting from theenlargement of the width of the improved region, isthe reduction of the post-earthquake settlement of thefoundation.
In this paper, a 3D �nite element model, com-posed of a fully coupled dynamic analysis and a well-calibrated constitutive model, is introduced in simu-lating the seismic response of shallow foundations onsaturated granular soil strata. OpenSEES [9] has beenused to conduct the numerical simulations. OpenSEESis an open-source software framework developed atPEER (Paci�c Earthquake Engineering Research Cen-ter) for simulating the seismic response of structuraland geotechnical systems. A series of centrifuge ex-periments is simulated to show the model capabilityin capturing the important aspects of the dynamicresponse of footings on lique�able and densi�ed sub-soils.
FULLY COUPLED DYNAMIC ANALYSISOF SATURATED POROUS MEDIA
For a fully coupled analysis, equilibrium or momentumbalance for the soil- uid mixture, momentum balancefor the uid phase and, �nally, the mass balance forthe whole system of soil and uid must be satis�ed.The unknowns in this complete set of equations aredisplacements of the solid phase (us), displacements ofthe uid phase relative to the solid phase (urf ) andpressure of the uid phase (P ). It is convenient toreduce the number of variables by neglecting the termsthat have little in uence on the results. For dynamicproblems in which high-frequency oscillations are notimportant, such as earthquake loading, the relativevelocity of the uid phase has little e�ect on the systemand can be disregarded [10]. Therefore, the governingequations are reduced to two. The primary variablesin this form of equation are solid displacements and uid pressure. Thus, this form is called us � P or forsimplicity u� P formulation.
Using the �nite element method for spatial dis-cretization, the u� P formulation is as follows:
M �U +Zv
BT�0dV �QP � f (s) = 0; (1a)
QT _U +HP + S _P � f (p) = 0; (1b)
where M is the mass matrix, U is the solid displace-ment vector, B is the strain-displacement matrix, �0 isthe e�ective stress tensor, Q indicates the discrete gra-dient operator coupling the motion and ow equations,P is the pore pressure vector, S is the compressibilitymatrix, and H is the permeability matrix. Vectors f (s)
and f (p) include the e�ects of body forces, externalloads and uid uxes. Details of the above mentionedmatrices and vectors can be found in Zienkiewics andShiomi [10].
THE CRITICAL STATE TWO-SURFACEPLASTICITY SAND MODEL
A plasticity constitutive model developed by Dafaliasand Manzari [11] was employed for modeling of themonotonic and cyclic behavior of sand. The formula-tion of the model is based on the two-surface plasticitytheory [12], within the critical state soil mechanicsframework [13].
A schematic representation of the two-surfacemodel in the �-plane is shown in Figure 1. Inthis model, the isotropic hypoelasticity assumption isadopted with the elastic moduli as a function of currentpressure and void ratio. The yield surface is a circularcone with its apex located at the origin. The sizeof the yield surface is normally considered a constant

Densi�cation E�ects on Liquefaction-induced Settlement 333
Figure 1. Schematic representation of the two-surfacemodel in the �-plane [11].
(no isotropic hardening) of rather small value in mostapplications. This model includes three other surfaces,namely bounding (peak), dilatancy and critical. Thecritical surface is in direct correspondence to the criticalstress ratio in the triaxial space. The critical state ofa soil [13] is attained when the stress ratio, � = q=p,equals the critical stress ratio, (M), which is a materialconstant. In the current model, the bounding anddilatancy stress ratios are related to the critical stressratio by way of the \state parameter" as follows:
M b = M exp(�nb ); Md = M exp(nd ); (2)
where M b and Md are peak and dilatancy stress ratiosand nb and nd are positive material constants. =e� ec is the \state parameter" proposed by Been andJe�eries [14], where e is the current void ratio of the soilelement and ec is the critical void ratio correspondingto the existing con�ning stress. The following powerrelationship is used to de�ne the Critical State Line(CSL):
ec = e0 � �c�pcpat
��; (3)
where e0, �c and � are critical state constants.As shown in Figure 1, the bounding and dilatancy
surfaces are shown by dash lines, indicating theirchange with , and the critical surface by a solidline. All surfaces are fully determined by the valueof state parameter and this increases the numericale�ciency of the model. Also, the state parameterincludes the combined e�ect of density (void ratio) andcon�ning stress. Thus, one of the main features ofthe current constitutive model is its applicability toall densities and con�ning pressures with one set ofmaterial constants.
The plastic modulus (Kp) and dilatancy coe�-cient (D) are related to the distance from the bounding
and dilatancy surfaces as follows:
Kp =23phb : n; (4)
D = Add : n: (5)
The vectors b and d shown in Figure 1, are de�nedas the vectors connecting the current stress state toits image on the bounding and dilatancy surfaces,respectively; p is the mean e�ective stress and h isa positive scalar-valued function. Ad is a functionincluding the e�ects of \fabric change phenomenon"arisen during stress increment reversal after a dilativeplastic volumetric strain occurrence.
The \distance dependent plastic modulus" isthe main feature of the classical bounding surfacemodel [12]. In the current model, the dilatancycoe�cient is also de�ned based on the basic idea of\distance dependency" in the bounding surface model.
The constants of the Dafalias and Manzari modelwere calibrated for Toyoura sand [11]. However, in thisresearch, the centrifuge experiments that were chosenfor numerical simulation have been conducted usingNevada sand. Therefore, the model constants werecalibrated for Nevada sand using the triaxial test dataperformed under di�erent conditions [15]. A list of themodel constants is shown in Table 1. The model has15 constants divided into 6 categories based on theirfunctions.
VARIABLE PERMEABILITY FUNCTION
The shaking of a saturated sand deposit results in thestructural change of the soil skeleton and a decrease
Table 1. Material parameters of the critical statetwo-surface plasticity model for Nevada sand.
Constant Variable Value
Elasticity G0 150� 0.05
Critical state M 1.14c 0.78�c 0.027e0 0.83� 0.45
Yield surface m 0.02Plastic modulus h0 9.7
ch 1.02nb 2.56
Dilatancy A0 0.81nd 1.05
Fabric-dilatancy tensor zmax 5cz 800

334 H. Shahir and A. Pak
in the void ratio. Due to the void ratio reduction,the permeability coe�cient of the sand must decrease.However, this reduction in void ratio and its e�ect onpermeability is not signi�cant. On the other hand,structural changes in the soil skeleton results in areduction of the pore shape factor and tortuosity,which cause a signi�cant increase in the permeabilitycoe�cient during liquefaction [16]. At the onset ofliquefaction, soil particles lose full contact with eachother which creates easier paths for water to ow. Thecreation of such ow paths reduces pore shape factorand tortuosity and, consequently, leads to an increasein the permeability coe�cient at the time of initialliquefaction. The basic mechanism that is involved inthis phenomenon is the pore pressure increase.
Based on the research performed by Shahir etal. [15], there is a direct relationship between thepermeability coe�cient and the excess pore pressureratio for all pore pressure build-up, liquefaction, anddissipation phases. They proposed the following func-tion for the variations of permeability coe�cient insimulation of the liquefaction process:
kki
=8><>:1+(��1)�r�1u in build-up phase (ru<1:0)
� in lique�ed state (ru = 1:0)1+(��1)�r�2
u in dissipation phase (ru<1:0)(6)
where k is the soil permeability coe�cient duringthe process of liquefaction, ki is the initial (at-rest)permeability coe�cient before shaking and �, �1 and�2 are positive material constants. ru is the excess porepressure ratio, de�ned as follows:
ru = �u=�0v0; (7)
where �u is the excess pore water pressure and �0v0 isthe initial vertical e�ective stress.
The above formulation was implemented intoOpenSEES for updating the coe�cient of permeabilityat the end of each time step during seismic analysis.For this purpose, a new element with a formulationsimilar to the element of EightNodeBrick u p from theUCD (University of California, Davis) computationalgeomechanics toolset [17], was created with addition ofthe variable permeability function.
Then, it was applied to simulate the behavior of asaturated sand layer subjected to earthquake loading inthe centrifuge experiment. By comparing the numer-ical results with centrifuge experimental observations,the constants were calibrated as follows:
� = 20; �1 = 1:0; �2 = 8:9:
This basically means that the permeability coe�cientincreases up to 20 times during the initial liquefaction.
The amount of increase in permeability coe�cientduring liquefaction was reported in some investigations.Arulanandan and Sybico [16], based on the measure-ment of changes in the electrical resistance of saturatedsand deposits in the centrifuge tests, concluded thatthe \in- ight permeability" of saturated sand duringliquefaction increases up to 6 to 7 times greater thanits initial value. Jafarzadeh and Yanagisawa [18], bymeasurement of the volume of expelled water fromsaturated sand columns in shaking table model tests,indicated that the average permeability coe�cientduring excitation is 5 to 6 times greater than itsstatic value. This is nearly equivalent to an increaseof 10 to 12 times in the peak value of permeabilityduring liquefaction. In this study, the choice of thisincreasing factor (�) is essentially to obtain the best �twith the centrifuge results, which have been obtained2 to 3 times greater than the reported values fromexperimental evidence. From a practical viewpoint,this di�erence can be attributed to the inaccuracyinvolved in the measurement of the initial permeabilitycoe�cient.
Incorporation of the permeability variation in thenumerical model is necessary for capturing both porepressure and settlement responses of a lique�able soilmass. Therefore, the above mentioned variable perme-ability function has been used in numerical simulationsconducted in this research.
VERIFICATION OF THE NUMERICALMODEL BY CENTRIFUGE EXPERIMENTS
Description of the Centrifuge Experiment
For veri�cation of the numerical model, the centrifugeexperiments conducted by Hausler [2] were considered.Hausler [2] carried out several centrifuge experimentsto study the e�ects of ground improvement on theresponse of shallow footings under di�erent conditions.Four centrifuge experiments were selected here fornumerical modeling in which the e�ects of improvementdepth on the foundation settlement and other responsesare studied.
The centrifuge model 1 consisted of a square rigidstructure rested on approximately 20 meters of lique�-able Nevada sand with an initial relative density (Dr)of 30%, which was placed in a exible container. Asketch of the geometry of the experiments is presentedin Figure 2. In models 2 to 4, the soil beneath thestructure was compacted up to a relative density of 85%with di�erent depths of 6 m (0.3 H improved), 14 m(0.7 H improved) and 20 m (full depth improved). Theinitial relative density of the surrounding unimprovedsoil was 30%. The improved zone was square in planand symmetric around the foundation axis, and thewidth of the improvement zone was approximately
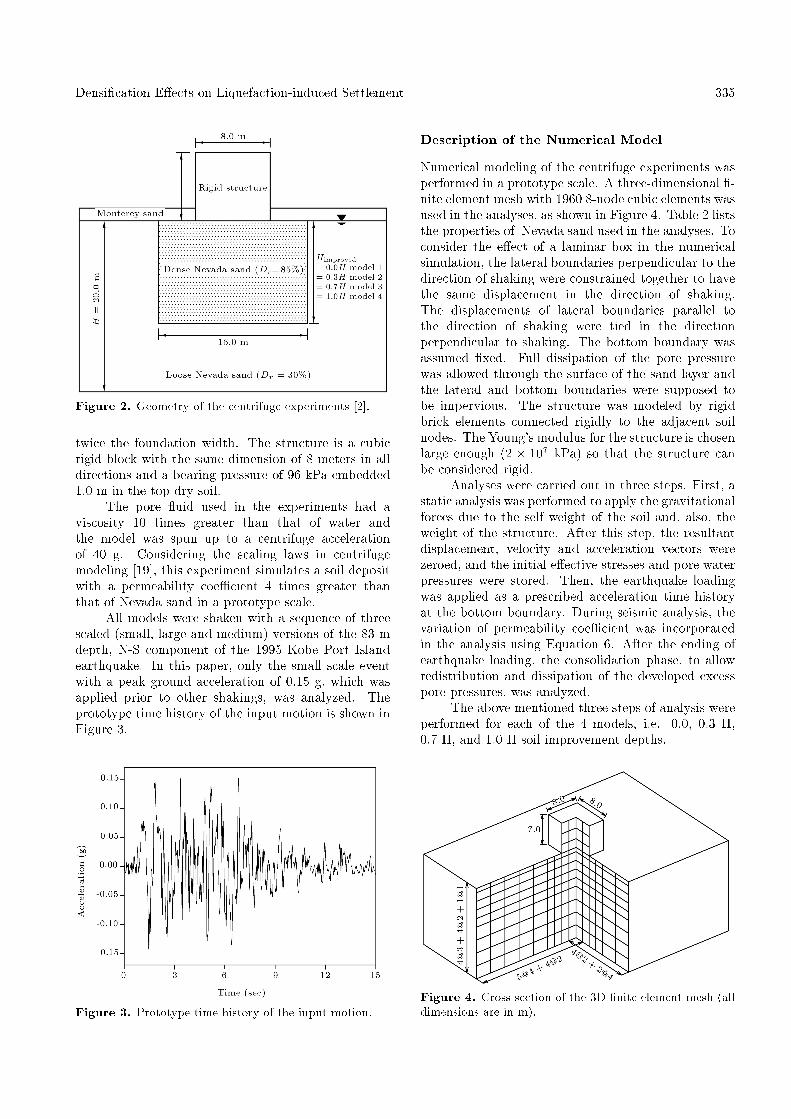
Densi�cation E�ects on Liquefaction-induced Settlement 335
Figure 2. Geometry of the centrifuge experiments [2].
twice the foundation width. The structure is a cubicrigid block with the same dimension of 8 meters in alldirections and a bearing pressure of 96 kPa embedded1.0 m in the top dry soil.
The pore uid used in the experiments had aviscosity 10 times greater than that of water andthe model was spun up to a centrifuge accelerationof 40 g. Considering the scaling laws in centrifugemodeling [19], this experiment simulates a soil depositwith a permeability coe�cient 4 times greater thanthat of Nevada sand in a prototype scale.
All models were shaken with a sequence of threescaled (small, large and medium) versions of the 83 mdepth, N-S component of the 1995 Kobe Port Islandearthquake. In this paper, only the small scale eventwith a peak ground acceleration of 0.15 g, which wasapplied prior to other shakings, was analyzed. Theprototype time history of the input motion is shown inFigure 3.
Figure 3. Prototype time history of the input motion.
Description of the Numerical Model
Numerical modeling of the centrifuge experiments wasperformed in a prototype scale. A three-dimensional �-nite element mesh with 1960 8-node cubic elements wasused in the analyses, as shown in Figure 4. Table 2 liststhe properties of Nevada sand used in the analyses. Toconsider the e�ect of a laminar box in the numericalsimulation, the lateral boundaries perpendicular to thedirection of shaking were constrained together to havethe same displacement in the direction of shaking.The displacements of lateral boundaries parallel tothe direction of shaking were tied in the directionperpendicular to shaking. The bottom boundary wasassumed �xed. Full dissipation of the pore pressurewas allowed through the surface of the sand layer andthe lateral and bottom boundaries were supposed tobe impervious. The structure was modeled by rigidbrick elements connected rigidly to the adjacent soilnodes. The Young's modulus for the structure is chosenlarge enough (2 � 107 kPa) so that the structure canbe considered rigid.
Analyses were carried out in three steps. First, astatic analysis was performed to apply the gravitationalforces due to the self weight of the soil and, also, theweight of the structure. After this step, the resultantdisplacement, velocity and acceleration vectors werezeroed, and the initial e�ective stresses and pore waterpressures were stored. Then, the earthquake loadingwas applied as a prescribed acceleration time historyat the bottom boundary. During seismic analysis, thevariation of permeability coe�cient was incorporatedin the analysis using Equation 6. After the ending ofearthquake loading, the consolidation phase, to allowredistribution and dissipation of the developed excesspore pressures, was analyzed.
The above mentioned three steps of analysis wereperformed for each of the 4 models, i.e. 0.0, 0.3 H,0.7 H, and 1.0 H soil improvement depths.
Figure 4. Cross section of the 3D �nite element mesh (alldimensions are in m).

336 H. Shahir and A. Pak
Table 2. Properties of Nevada sand used in the analyses [2].
Parameter Value at Dr = 30% Value at Dr = 85%
Void ratio 0.781 0.586
Saturated unit weight 19.0 kN/m3 20.15 kN/m3
Water permeability 4:0� 10�5 m/sec 2:5� 10�5 m/sec
Prototype permeability 1:6� 10�4 m/sec 1:0� 10�4 m/sec
RESULTS AND DISCUSSION
Excess Pore Pressure
Figures 5 and 6 display the predicted and measuredmaximum excess pore pressure ratios along the soildepth under the foundation centerline and at free �eld,respectively. It is noted that the maximum excesspore pressure ratios at all elevations do not occur atthe same time. The maximum excess pore pressureratios were presented in tabular format by Hausler [2]and the digital data of the centrifuge experiments wasnot available. Thus, the time history of excess porepressures could not be compared and the maximumexcess pore pressure ratios were used for comparison.
As shown in Figure 6, the occurrence of lique-faction (ru = 1:0) up to the depth of about 12.0 m inthe free �eld was accurately predicted by the numericalmodel. The zero depth represents foundation bottomlevel. In deeper strata, both numerical simulation andthe experimental model indicate that the conditionof zero e�ective stress or initial liquefaction state didnot occur. The predicted pore pressure ratios in thefree �eld from all four models are nearly the sameand match well with the measured values. At thebottom of the soil layer, the predicted pore pressureratio is somewhat greater than the measured one(Figure 6).
The predicted excess pore pressure ratios pre-sented in Figure 5 are generally in good agreement
Figure 5. Distribution of excess pore pressure ratio along the soil depth under the foundation.

Densi�cation E�ects on Liquefaction-induced Settlement 337
Figure 6. Distribution of excess pore pressure ratio alongthe soil depth at free �eld.
with the experimental measurements. According tothe experimental measurements, as well as simula-tion results, densi�cation had a major in uence onreduction of the developed excess pore pressure ratiobeneath the foundation. The average excess porepressure ratios under the foundation in Model 4 areabout 65% of Model 1. It is noted that, even inModel 1, in which no ground improvement was madeand where the developed excess pore pressure under thefoundation was higher than other improved models, theinitial liquefaction state was not observed beneath thefoundation. Contrary to the observed behavior in thefree �eld, the experimental and numerical results inall four models show that the minimum excess porepressure ratio occurs at shallow depths beneath thefoundation and increases gradually downward. Themaximum excess pore pressure ratio, however, does not
occur at the bottom of the models but rather at someintermediate depth.
The di�erence between the pattern of excesspore pressure ratio in the free �eld and beneath thefoundation is mainly attributed to di�erences betweenthe initial vertical e�ective stresses. The initial verticale�ective stress used for calculating the excess porepressure ratio (Equation 7) is due to the e�ectiveweight of the soil layers in the free �eld. However,under the foundation, the e�ect of the foundation loadalso contributes to excess pore pressure. Therefore,the values of excess pore pressure ratios under thefoundation are substantially lower than those in thefree �eld.
Structure Settlement and Tilting
The measured and predicted foundation settlementsversus normalized compaction depth in all experimentsare presented in Figure 7a. Figure 7b shows thefoundation settlement normalized to the free �eld soilsettlement. The measured free �eld settlement inthe experiments varies between 20 to 25 cm and thepredicted value for the free �eld settlement is about20 cm in all numerical models. In Figure 7b, thein uence of di�erent free �eld settlements has beenremoved by normalization of the foundation settlement.As seen in this �gure, the predicted settlements are ingood agreement with the experimental observations.
The normalized foundation settlement has de-creased from 2.13 in the experiment without com-paction to 0.43 in the experiment with full depth com-paction, i.e. the foundation settlement has decreasedabout 5 times due to densi�cation. This indicates thee�ectiveness of densi�cation in mitigation of the lique-faction induced settlement. As observed in Figure 7,there is a rather negligible reduction of foundation
Figure 7. Foundation settlement versus normalized compaction depth. (a) Absolute amounts of settlement; (b)Normalized values.

338 H. Shahir and A. Pak
settlement in the case of super�cial compaction up toa depth of 0.3 H (H: total soil depth). The majorreduction in foundation settlement is achieved whenthe improved zone extends through 0.7 H. Furthercompaction below the depth of 0.7 H has a minor e�ecton reducing the amount of foundation settlement. It isnoted that the obtained values may not be generalizedfor other situations and more research is warranted,considering a wide range of soils, foundations andshaking parameters.
In Figure 8, distribution of the foundation set-tlement along the soil depth is shown. The measuredvalues, by installation of the settlement pads, are onlyavailable for Experiments 1 and 4, which are presentedin this �gure. As shown, the predicted and measuredvalues show good similarities. In the cases of uniformsubsoil under the foundation (Experiments 1 and 4),the results indicate that the lowest vertical strains oc-
Figure 8. Distribution of foundation settlement along soildepth.
curred at shallow and deep layers (about 0-4 and 16-20m). This con�rms the previous �nding that super�cialcompaction as well as further deep compaction hasminor in uence on reducing the foundation settlement.In partially compacted experiments, the major partof settlement occurs in the loose layer. As shownin Figure 8, in Experiment 3, 55% of the foundationsettlement is due to the vertical strain of the loose layerwhere its thickness is only 30% of the total depth.
Another important quantitative assessment re-garding the performance of the improved ground is thetilting of the structure (di�erential settlement dividedby structure width). Figure 9a displays the predictedtime history of the structure tilting in all of the experi-ments. In Figure 9b, the predicted maximum transientand permanent tilting of the structure is comparedwith the experimental measurements. The predictedand measured values di�er signi�cantly. However, bothexperimental and simulation results indicate that al-though the in uence of super�cial compaction on totalsettlement reduction is minor, it reduces the structuretilting considerably. Therefore, if the total settlementis not a concern, a super�cial compaction may su�cefor elimination of the di�erential settlement. Thegeneral implication of this result, however, requiresextensive experimental and numerical investigation.
SUMMARY AND CONCLUSION
In this study, a 3D fully coupled dynamic analy-sis was applied for simulating the seismic responseof shallow foundations on both lique�able and non-lique�able (densi�ed) subsoils in a series of centrifugeexperiments. By employing the critical state two-surface plasticity model and taking the variabilityof permeability into account, it becomes possible toobtain good results for pore pressure variation in the
Figure 9. (a) Predicted time history of structure tilting; (b) Maximum transient and permanent tilting of structureversus normalized compaction depth.

Densi�cation E�ects on Liquefaction-induced Settlement 339
soil mass beneath a shallow foundation and, also, topredict reliable values for foundation settlement.
The simulation results indicate that the valuesof excess pore pressure ratio under the foundation aresubstantially less than those in the free �eld, owing tothe e�ects of the structure surcharge, and so, contraryto the free �eld, the liquefaction state is not observedbeneath the foundation. Soil densi�cation proved tohave a major e�ect on reducing the developed excesspore pressure ratio beneath the foundation.
The e�ectiveness of densi�cation in the reduc-tion of the liquefaction-induced settlement has beensimulated well. The simulation results, as well asexperimental measurements, reveal that further com-paction below the depth of 0.7 H has a minor e�ecton reducing the amount of foundation settlement. Itwas shown that, although super�cial compaction hasa minor in uence on reducing settlement, it is able toreduce the structure tilting considerably.
REFERENCES
1. Mitchell, J.K., Baxter, C.D.P. and Munson, T.C. \Per-formance of improved ground during earthquakes",Proceeding of Soil Improvements for Earthquake Haz-ard Mitigation, Geotechnical Special Publication No.49, ASCE, pp. 1-36 (1995).
2. Hausler, E.A. \In uence of ground improvement onsettlement and liquefaction: A study based on �eldcase history evidence and dynamic geotechnical cen-trifuge tests", PhD Dissertation, University of Califor-nia, Berkeley (2002).
3. Koutsourelakis, S., Prevost, J.H. and Deodatis, G.\Risk assessment of an interacting structure-soil sys-tem due to liquefaction", Earthquake Engineering andStructures Dynamics, 31(4), pp. 851-79 (2002).
4. Chakrabortty, P., Popescu, R. and Prevost, J.H.\Tower structures on lique�able soil excited by ran-dom seismic input", 9th ASCE Specialty Conferenceon Probabilistic Mechanics and Structural Reliability,Albuquerque (2004).
5. Popescu, R., Prevost, J.H., Deodatis, G. andChakrabortty, P. \Dynamics of nonlinear porous mediawith applications to soil liquefaction", Soil Dynamicsand Earthquake Engineering, 26, pp. 648-65 (2006).
6. Lopez-Caballero, F. and Modaressi Farahmand-Razavi, A. \Numerical simulation of liquefaction ef-fects on seismic SSI", Soil Dynamics and EarthquakeEngineering, 28, pp. 85-98 (2008).
7. Liu, L. and Dobry, R. \Seismic response of shallowfoundation on lique�able sand", Journal of Geotechni-
cal and Geoenvironmental Engineering, ASCE, 123(6),pp. 557-567 (1997).
8. Coelho, P.A.L.F., Haigh, S.K., Madabhushi, S.P.G.and O'brein, T.S. \Post-earthquake behavior of foot-ings employing densi�cation to mitigate liquefaction",Ground Improvement, 11(1), pp. 45-53 (2007).
9. OpenSees (Open System for Earthquake EngineeringSimulation) Platform, Developed by the Paci�cEarthquake Engineering Research Center(PEER), at the University of California, Berkeley,http://opensees.berkeley.edu/.
10. Zienkiewics, O.C. and Shiomi, T. \Dynamic behaviorof saturated porous media: The generalized Biotformulation and its numerical solution", InternationalJournal for Numerical Methods in Engineering, 8, pp.71-96 (1984).
11. Dafalias, Y.F. and Manzari, M.T. \Simple plasticitysand model accounting for fabric change e�ects",Journal of Engineering Mechanics, 130(6), pp. 622-634 (2004).
12. Dafalias, Y.F. \Bounding surface plasticity, I: Math-ematical foundation and hypoplasticity", Journal ofEngineering Mechanics, 112(9), pp. 966-987 (1986).
13. Scho�eld, A.N. and Wroth, C.P., Critical State SoilMechanics, McGraw-Hill, New York (1968).
14. Been, K. and Je�eries, M.G. \A state parameter forsands", Geotechnique, 35(2), pp. 99-112 (1985).
15. Shahir, H., Pak, A. and Taiebat, M. and Jeremic, B.\Evaluation of variation of permeability in lique�ablesoil under earthquake loading", Submitted to SoilDynamics and Earthquake Engineering.
16. Arulanandan, K. and Sybico, J. Jr. \Post-liquefactionsettlement of sand", Proceeding of the Wroth MemorialSymposium, Oxford University, England (1992).
17. Jeremic, B. \Development of geotechnical capabilitiesin OpenSees", Paci�c Earthquake Engineering Re-search Center, Report PEER 2001/12 (2001).
18. Jafarzadeh, F. and Yanagisawa, E. \Settlement ofsand models under unidirectional shaking", First In-ternational Conference on Earthquake GeotechnicalEngineering, K. Ishihara, Ed., IS-Tokyo, pp. 693-698(1995).
19. Scho�eld, A.N. \Dynamic and earthquake centrifugegeotechnical modeling", Proceeding of InternationalConference on Recent Advances in Geotechnical Earth-quake Engineering and Soil Dynamics, University ofMissouri-Rolla, MO, pp. 1081-1100 (1981).


![Contribution to the modeling of densi cation in …Ji Xing Meng. Contribution to the modeling of densi cation in silicate glasses under very high pressures. Other [cond-mat.other]](https://img.dokumen.tips/doc/110x75/5f084d207e708231d421553c/contribution-to-the-modeling-of-densi-cation-in-ji-xing-meng-contribution-to-the.jpg)


![Analytical approach to evaluate stability of pile …scientiairanica.sharif.edu/article_4218_93eb17677e52db7c...the stability of soil slopes is pile reinforcement [1]. Cursory review](https://img.dokumen.tips/doc/110x75/5f7fee0b7d23290b636beef5/analytical-approach-to-evaluate-stability-of-pile-the-stability-of-soil-slopes.jpg)

![Predicting potential of controlled blasting-induced ...scientiairanica.sharif.edu/article_4184_66abada1973d3893c79f9f2e32... · Lewis [19] developed FHWA’s LS-DYNA soil material](https://img.dokumen.tips/doc/110x75/5a78c03c7f8b9a70648c53f9/predicting-potential-of-controlled-blasting-induced-19-developed-fhwas.jpg)


![Predicting potential of blast-induced soil liquefaction ...scientiairanica.sharif.edu/article_4184_4c92541c36dcaa3c08b53c1c9... · Lewis [19] developed FHWA's LS-DYNA soil material](https://img.dokumen.tips/doc/110x75/5b8629407f8b9a2e3f8c4bb3/predicting-potential-of-blast-induced-soil-liquefaction-lewis-19-developed.jpg)