Embed Size (px)
Citation preview
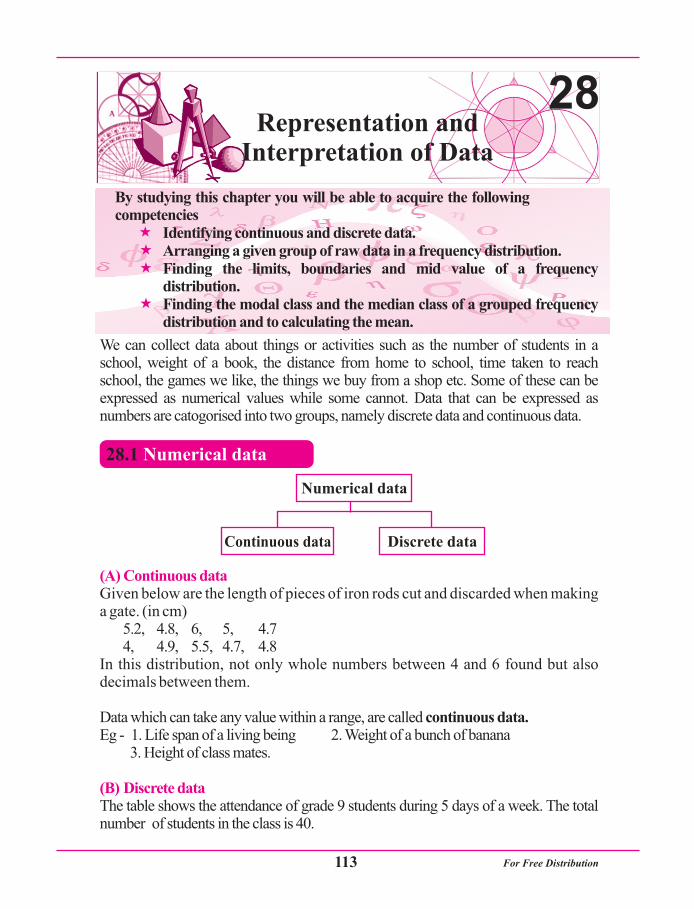
28
Numerical data
Continuous data Discrete data
28.1 Numerical data
For Free Distribution113

The data which take only integral values are called a discrete data.
i The number of employees in a factory
ii The number of books in a library
iii The number of chairs in a class room.
State whether the following are continuous or discrete data.
1. The number of telephone calls received by a certain institution in a day.2. The weight of children in a class.3. Number of families living in a certain village4. Monthly salary of a bank manager.5. The number of hours per day that a student watches television.6. The number of students who get admission to the main universities in a year.7. The number of runs scored by a cricket team in a match 8. Number of news articles in a news paper.9. Weight of a fish10. The number of distinctions that can be obtained by a student in the ordinary
level examination.
You have already studied how to prepare a frequency distribution. When the number of data is very large, it is a difficult task to prepare an ungrouped frequency distribution. Then the frequency distribution is prepared by grouping the given data into classes.
Given below are the marks obtained by 50 grade 9 students of a certain school, in a Mathematics test.
4, 12, 16, 20,22, 25, 29, 30, 33, 35, 35, 37, 39, 41, 41, 43, 43, 43, 44, 45, 46, 48, 51, 52, 52, 52, 53, 54, 55, 55, 56, 57, 58, 59, 62, 63, 64, 65, 67, 68, 71, 74, 75, 75, 77, 81, 83, 86, 89, 95
This data can be separated into 10 class intervals and shown in a table as follows.
Column 1 shows how all the marks from 0 to 100 are divided into groups (classes)
of equal length intervals. This is called the class interval column.
Eg -
Exercise 28.1
28.2 Grouped frequency distribution
Days of the week Monday Tuesday Wednesday Thursday Friday
Number of students present 34 30 40 38 35
Here the number of students present is not a fraction or a decimal number. It is a whole number between 0 and 40
For Free Distribution114

column 2 shows the number of students who obtained the marks given in that particular interval. This column is called the frequency column (f)
Row 3 indicates the fourth class interval. There are 5 candidates who obtained markes in the range 31 to 40
The length of a class interval is called the size of the class. For this distribution the class size is 10.
Representing a large number of data in a grouped frequency table, facilitates calculations and the communication of data.
In preparing a grouped frequency table, first of all we have to find the range of the given data. (Range is the difference between the largest and the smallest value of the given data). Then to separate into suitable class intervals, one of the following methods can be used.
Decide the number of class intervals and then find the width of aclass.
If the range is 55 and it is decided to have 8 intervals, the width of a class
Size of each interval (width)
\ the size of a class is approximately 7
- Decide the size of a class interval and then find the number of intervals.
Eg- Let us take the class size as 10
Method 1
Eg -
Method 2
1 - 10 1 11 - 20 321 -30 431 - 40 541 - 50 951 - 60 1261 - 70 671 - 80 581 - 90 4
91 - 100 150
Class interval Number of students(Marks) (Frequency)
3
A large number of data arranged in class intervals together with the corresponding frequencies is called a grouped frequency table.
55
8= = 6.817
1 2
Range
Number of clasess=
For Free Distribution115
In a frequency distribution it is more suitable to have the number of class intervals between 7 and 10
Example 1
Class interval Tally marks Frequency (f )
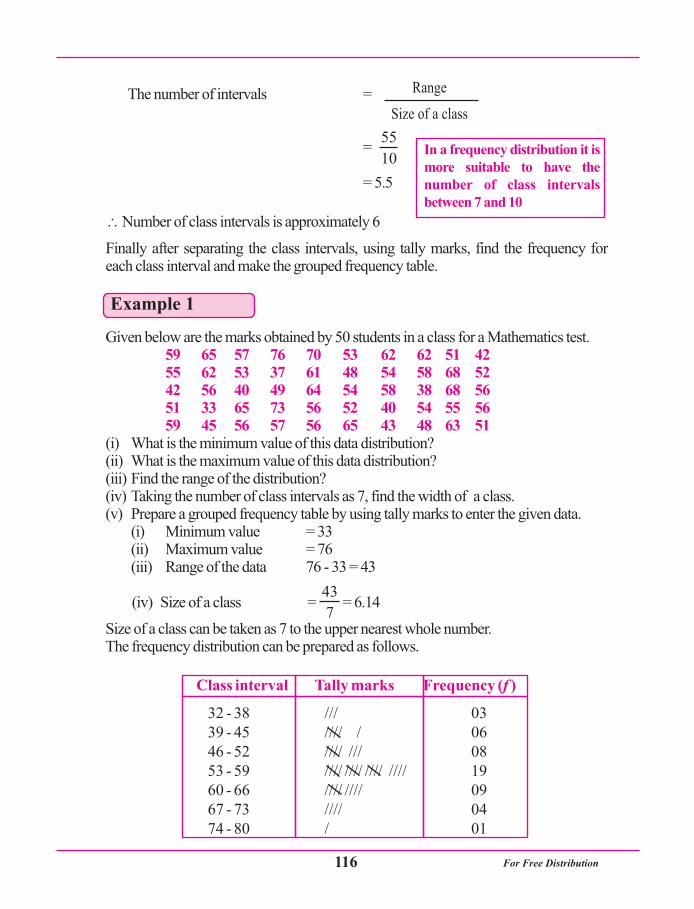
32 - 38 /// 0339 - 45 //// / 0646 - 52 //// /// 0853 - 59 //// //// //// //// 1960 - 66 //// //// 0967 - 73 //// 0474 - 80 / 01
The number of intervals =
=
= 5.5
\ Number of class intervals is approximately 6
Finally after separating the class intervals, using tally marks, find the frequency for each class interval and make the grouped frequency table.
Given below are the marks obtained by 50 students in a class for a Mathematics test.
(i) What is the minimum value of this data distribution?(ii) What is the maximum value of this data distribution?(iii) Find the range of the distribution?(iv) Taking the number of class intervals as 7, find the width of a class.(v) Prepare a grouped frequency table by using tally marks to enter the given data.
(i) Minimum value = 33(ii) Maximum value = 76(iii) Range of the data 76 - 33 = 43
(iv) Size of a class = = 6.14
Size of a class can be taken as 7 to the upper nearest whole number.The frequency distribution can be prepared as follows.
59 65 57 76 70 53 62 62 51 4255 62 53 37 61 48 54 58 68 5242 56 40 49 64 54 58 38 68 5651 33 65 73 56 52 40 54 55 5659 45 56 57 56 65 43 48 63 51
43
7
Range
Size of a class
55
10
For Free Distribution116

1. The raw data given below are the number of units of electricity used by 70 residents of a certain housing scheme. Prepare a grouped frequency table taking the class intervals as 70-79, 80-89, 90- 99 ----
71 86 81 70 78 81 85 84 76 7286 87 89 89 84 87 88 94 101 10491 102 103 111 115 112 105 108 109 116
116 129 130 119 107 109 106 108 109 106107 121 106 107 124 105 105 104 108 12698 96 97 86 87 84 94 94 92 9389 89 98 99 97 93 91 87 88 98
2. The number of words in the telegrams sent by a certain post office is given below.19 23 7 12 15 21 19 26 28 2916 17 20 19 26 22 24 8 18 1720 31 33 23 24 34 35 28 27 3634 30 26 29 25 26 24 25 20 1821 20 22 18 17 25 25 24 23 27
(i) What is the minimum number of words in a telegram and what is the maximum number of words in a telegram.
(ii) Find the range of this distribution.(iii) Prepare a grouped frequency table for this data taking the size of each
interval as 5 words.3. The information about the ages (in years) of residents in a home for the elders is
given below.60 70 68 66 73 80 68 76 68 7974 52 74 68 68 61 65 62 67 7466 68 68 69 69 64 57 60 68 6777 82 65 71 72 60 63 70 70 6974 65 64 72 84 64 58 59 73 88
Taking class intervals of suitable size so as to include all the given data, prepare a grouped frequency table.
4. Given below are the number of customers who visited 50 branches of a certain state bank of Sri lanka on a particular day, in various parts of the country.
98 70 60 53 69 100 117 48 67 79109 73 81 102 88 69 88 88 76 9663 90 88 73 76 96 70 76 104 8494 87 93 108 64 94 85 112 73 6349 118 58 64 68 73 76 54 84 45
Prepare a grouped frequency table with 8 class intervals having the same width.
Exercise 28.2
For Free Distribution117

Considering the given grouped frequency table, let us learn about the class limits, class boundaries and the mid value of a class.
In a class interval of a distribution, the upper value is called the upper limit and the lower value is called the lower limit. for the class interval 46- 52,
When continuous data is grouped and separated into intervals, the class intervals should be joined together, There should not be a gap between the classes. Therefore in continuous data, if there is a gap between the intervals, to get rid of the gap, we have to take the class boundaries. The class bounderies (real limits) can be calculated as follows.
Corresponding boundaries of the class limits considered above can be shown as follows.
(A) Class limits
(B) Class boundaries (Real limits)
Class interval Frequency
32 - 38 0339 - 45 0646 - 52 0853 - 59 1960 - 66 1067 - 73 0374 - 80 01
Lower limit Upper limit
Lower limit of the class + upper limit of the class below it
2
2
Upper limit + lower limit of the class above it
Lower boundary =
Upper boundary =
46 - 52
28.3 Class limits, class boundaries and the mid value of a class
For Free Distribution118
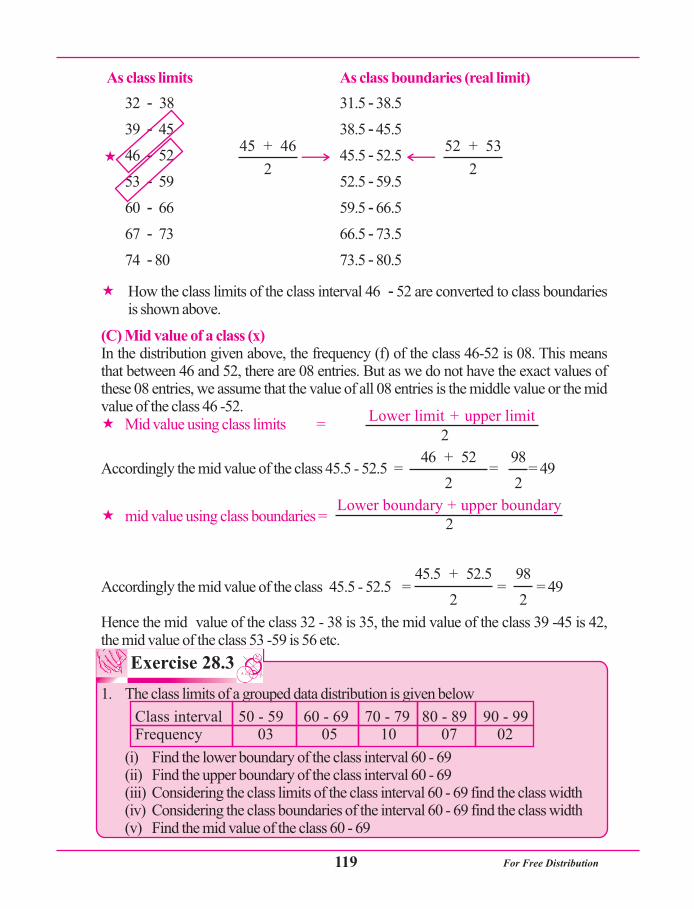
As class limits As class boundaries (real limit)
«
(C) Mid value of a class (x)
«
« mid value using class boundaries =
32 - 38 31.5 - 38.5
39 - 45 38.5 - 45.5
46 - 52 45.5 - 52.5
53 - 59 52.5 - 59.5
60 - 66 59.5 - 66.5
67 - 73 66.5 - 73.5
74 - 80 73.5 - 80.5
How the class limits of the class interval 46 - 52 are converted to class boundaries is shown above.
In the distribution given above, the frequency (f) of the class 46-52 is 08. This means that between 46 and 52, there are 08 entries. But as we do not have the exact values of these 08 entries, we assume that the value of all 08 entries is the middle value or the mid value of the class 46 -52.
Accordingly the mid value of the class 45.5 - 52.5 = = = 49
Accordingly the mid value of the class 45.5 - 52.5 = = = 49
Hence the mid value of the class 32 - 38 is 35, the mid value of the class 39 -45 is 42, the mid value of the class 53 -59 is 56 etc.
1. The class limits of a grouped data distribution is given below
(i) Find the lower boundary of the class interval 60 - 69 (ii) Find the upper boundary of the class interval 60 - 69 (iii) Considering the class limits of the class interval 60 - 69 find the class width(iv) Considering the class boundaries of the interval 60 - 69 find the class width (v) Find the mid value of the class 60 - 69
Mid value using class limits =
45.5 + 52.5
2
98
2
46 + 52
2
98
2
Lower boundary + upper boundary2
2
Exercise 28.3
Class interval 50 - 59 60 - 69 70 - 79 80 - 89 90 - 99Frequency 03 05 10 07 02
45 + 46
2
52 + 53
2«
Lower limit + upper limit
For Free Distribution119

2
Total frequency th
Example 2
28.4 The modal class and the median class and mean of a grouped frequency distribution
the
2. Find the mid value of the following class intervals(i) 5 - 9, 10 - 14, 15 - 19, 20 - 24, 25 - 29, 30 - 34(ii) 3.5 - 8.5, 8.5 - 13.5, 13.5 - 18.5, 18.5 - 23.5, 23.5 - 28.5
3. Rewrite the given frequency table including class boundaries and the mid value of the classes.
In a given grouped frequency distribution, the class corresponding to the maximum value in the frequency column is called the modal class.
(There can even be two or more modal classes in a distribution)
Consider the frequency distribution given below.
The modal class here is the class corresponding to the heighest frequency, which is 20. Hence the modal class is 30-40.
In a grouped frequency distribution, the value corresponding to the value right in the middle of the total frequency is called the median. The class to which this value belongs is the median class.
Let us find the position of the median class of the following frequency distribution.
Start adding the frequencies in the frequency column from the begining and find out how many frequencies you have to add to get the value equal to the value you get by dividing the total frequency, by two. The class interval corresponding to this value will give you the median class.
(A) Modal class
Eg -
(B) Median class
Class interval 10 - 20 20 - 30 30 - 40 40 - 50 50 - 60Frequency 08 15 20 17 06
Class interval 15 - 19 20 - 24 25 - 29 30 - 34 35 - 39 40 - 44Frequency 05 08 18 12 07 04
The median class = The class containing entry
Class intervals Frequency
10 - 20 08
20 - 30 15
30 - 40 20
40 - 50 17
50 - 60 06
66
8+15+10
For Free Distribution120

Quantity of fuel 50 - 60 60 - 70 70 - 80 80 - 90 90 - 100 (in litres)
Number of vehicles 20 25 30 15 10
Example 3
= entry
rd= 33 entry \ median class = 30 - 40
In the previous grade you learnt to find the mean of a frequency distribution by
We use the same formula to find the mean of a grouped frequency distribution. But here we do not have a definite value for x; instead we have a class interval. We take the
mid value of the class interval as x and we calculate the mean using :
Sometimes all the data within a certain class interval will be closer, to the upper limit or to the lower limit. Then the mean obtained by this method will be different from the actual mean of the distribution.
In a survey done regarding the use of fuel per month by 100 private vehicles, the following data was obtained.
(i) What is the modal class of this distribution?
(ii) Find the median class of this distribution
(iii) Find the mean quantity of fuel used by a vehicle in a month.
(i) Modal class = 70 - 80
(ii) Median class = Class containing the entryth
= Class containing the 50 entry= 70 - 80
(C) Mean
2
Total frequency th
Position of the median class = The class contaning the entry
th66
2
S fx
S f
S fx
S f
th100
2
For Free Distribution121

Quantity of fuel in litres
Number of vehicles (f)
Mid value(x)
f ́ x
50 - 60 20 55 20 ́ 55 = 1 10060 - 70 25 65 25 ́ 65 = 1 62570 - 80 30 75 30 ́ 75 = 2 25080 - 90 15 85 15 ́ 85 = 1 27590 - 100 10 95 10 ́ 95 = 950 åf = 100 åf x = 7 200
S fx
S f
7 200
1 00
Marks Mid value (x) Frequency (f) Mid value ´ frequency (x) ´ (f)
1 - 5 3 03 156 - 10 8 06 4811 - 15 13 08 —16 - 20 — 10 18021 - 25 — 15 —26 - 30 — 10 —31 - 35 — 05 —36 - 40 — 03 — Total åf = åfx =
Mean =
=
Mean quantity of fuel used by a vehicle = 72 l
1. The following frequency distribution shows the marks obtained by a group of students out of 40 marks, for a Mathematics test.
Copy this table in your exercise book, and fill in the blanks in the table
(i) How many students are there in the group.(ii) To which class interval does the most number of marks belong?(iii) Find the median class of the distribution.(iv) Find the mean mark of a student.(v) Find the percentage of students who have scored less than 26 marks.
Exercise 28.4
For Free Distribution122

Time in minutes 15-18 19-22 23-26 27-30 31-34 35-38 39-42 43-46 47-50
Number of 03 08 09 11 04 02 05 06 02participants(frequency)
2. Given below is the weight (in grams) of 50 oranges in a container
115 90 184 92 106 129 107 99 186 10776 140 113 81 136 164 131 204 120 82
109 160 171 65 93 107 180 140 84 139123 170 187 119 100 80 95 115 115 118100 110 115 180 208 123 128 98 82 125
(i) Prepare a frequency table with 8 class intervals taken as 60 - 80, 80 - 100, 100 - 120-------- etc.(ii) Which class interval has the most number of oranges?(iii) Find the median class(iv) Calculate the mean weight of an orange
3. for a race in which 50 participated, the time taken by each participant to complete the race is given in the distribution below with in as time intervals, with the number of participants whose time falls in that time interval,
(i) Find the mean time taken by a competitor to complete the race, to the nearest whole number.
(ii) If the competitors who won first, second and third places were given Rs 10 000, Rs 7 000 and Rs 5 000 respectively, and if, all the other competitors who completed the race in 30 minutes or less were given Rs 2 000 each, what is the total amount spent by the organisers for the prize money?
4. It was revealed that the life span of two types of televisions A and B are as follows,
0 - 2 5 22 - 4 16 74 - 6 13 126 - 8 7 19
8 - 10 5 9 10 - 12 4 1
(i) Find the modal class and the median class of the two types separately.(ii) Find the mean life span of the two types separately.(iii) Considering only the mean, which type would you prefer?
Number of televisions Life span (In years) Type A Type B
number of Televisions
For Free Distribution123

5. One day's income of 70 labourers in an institute is given in the following table.
(i) Calculate the approximate income per day of a labourer.(ii) What is the interval in which most of the labourers income received per day
fall?(iii) Calculate the extra cost that the company has to bear if 20% of the mean
salary per day that they receive at present is to be added to the approximate salary.
(iv) If the above proposal is implemented, find the new mean income of a labourer.
6. In a certain school, the number of students in two parallel classes A and B of grade 9 are 35 and 40 respectively. In the 3 term test the average marks obtained for
mathematics in 9A and 9B are 49 and 53 respectively. Find the average mark obtained by a student in grade 9.
7. The table below gives the number of children and their savings in two banks A and B in a school.(i) Calculate the total amount deposited in each bank.(ii) Taking both banks into consideration, find the average amount saved by each
child in this school.
8. Given below is a distribution showing the salaries in two sections A and B of a factory.
Income per dayRs.
Number of labourers
600 - 700 05700 - 800 08800 - 900 14900 - 1000 20
1000 - 1100 12 1100 - 1200 07 1200 - 1300 04
Number of members 600 500The value of a monthly deposit of a child (Rs) 200 250
Bank A Bank B
Salary per day (Rs) Number of workrs Section A Section B500 - 700 10 15700 - 900 26 10900 - 1100 34 17
1100 - 1300 20 30 1300 - 1500 10 18
For Free Distribution124

Weight of the bags Number of bags Mid value fx (kg) (f) (x) kg
10 - 20 08 15 120
20 - 30 10 25 250
30 - 40 15 ..... .....
40 - 50 10 45 450
50 - 60 07 55 .....
åf = åfx =
Class interval 0 - 20 20 - 40 40 - 60 60 - 80 80 - 100Frequency (f) 17 p 32 24 19
(i) Find the mean salary in each section A and B.(ii) Which section pays a better mean salary?(iii) Find the mean salary per day, of a worker taking the factory as a whole.(iv) Estimate the extra cost, if a 10% rise in a day's pay is to be given to all the
workers.9. To transport their rice and vegetables to the sunday fair, a farming community hires
a van which can carry a mass of 1 800 kg. The table below shows the weight of 50 bags that were ready for transport on a certain day.
(i) Fill in the blanks in the table.(ii) What is the total number of bags that were ready for transport?(iii) According to the information given, the driver says that all the bags can be
loaded to the van. What is the reason for him to say so?(iv) Show that there can be instances in which the drivers statement is not true.
10.
The mean of the above distribution is 50
(i) Complete the mid value column and the f x column in terms of p.(ii) Build up an equation in terms of p to find the mean.
For Free Distribution125