Embed Size (px)
Citation preview
ARTICLE IN PRESS
Thin-Walled Structures 48 (2010) 620–628
Contents lists available at ScienceDirect
Thin-Walled Structures
0263-82
doi:10.1
� Corr
E-m
(M. Sha
journal homepage: www.elsevier.com/locate/tws
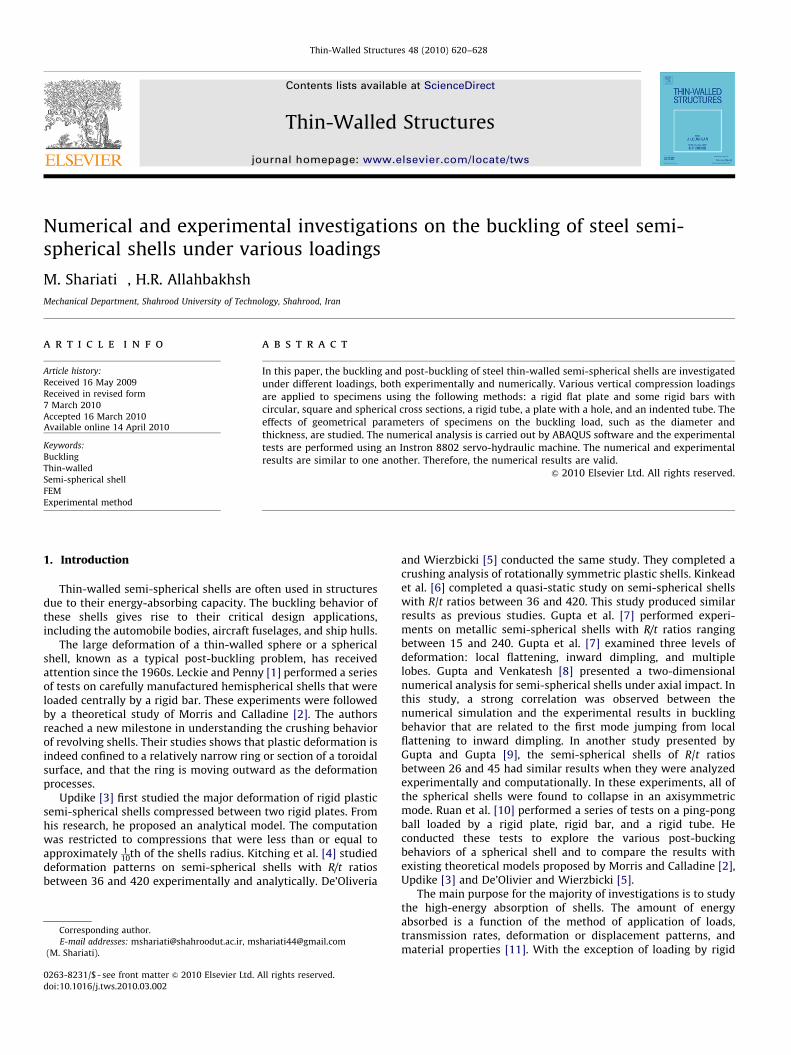
Numerical and experimental investigations on the buckling of steel semi-spherical shells under various loadings
M. Shariati �, H.R. Allahbakhsh
Mechanical Department, Shahrood University of Technology, Shahrood, Iran
a r t i c l e i n f o
Article history:
Received 16 May 2009
Received in revised form
7 March 2010
Accepted 16 March 2010Available online 14 April 2010
Keywords:
Buckling
Thin-walled
Semi-spherical shell
FEM
Experimental method
31/$ - see front matter & 2010 Elsevier Ltd. A
016/j.tws.2010.03.002
esponding author.
ail addresses: [email protected], ms
riati).
a b s t r a c t
In this paper, the buckling and post-buckling of steel thin-walled semi-spherical shells are investigated
under different loadings, both experimentally and numerically. Various vertical compression loadings
are applied to specimens using the following methods: a rigid flat plate and some rigid bars with
circular, square and spherical cross sections, a rigid tube, a plate with a hole, and an indented tube. The
effects of geometrical parameters of specimens on the buckling load, such as the diameter and
thickness, are studied. The numerical analysis is carried out by ABAQUS software and the experimental
tests are performed using an Instron 8802 servo-hydraulic machine. The numerical and experimental
results are similar to one another. Therefore, the numerical results are valid.
& 2010 Elsevier Ltd. All rights reserved.
1. Introduction
Thin-walled semi-spherical shells are often used in structuresdue to their energy-absorbing capacity. The buckling behavior ofthese shells gives rise to their critical design applications,including the automobile bodies, aircraft fuselages, and ship hulls.
The large deformation of a thin-walled sphere or a sphericalshell, known as a typical post-buckling problem, has receivedattention since the 1960s. Leckie and Penny [1] performed a seriesof tests on carefully manufactured hemispherical shells that wereloaded centrally by a rigid bar. These experiments were followedby a theoretical study of Morris and Calladine [2]. The authorsreached a new milestone in understanding the crushing behaviorof revolving shells. Their studies shows that plastic deformation isindeed confined to a relatively narrow ring or section of a toroidalsurface, and that the ring is moving outward as the deformationprocesses.
Updike [3] first studied the major deformation of rigid plasticsemi-spherical shells compressed between two rigid plates. Fromhis research, he proposed an analytical model. The computationwas restricted to compressions that were less than or equal toapproximately 1
10th of the shells radius. Kitching et al. [4] studieddeformation patterns on semi-spherical shells with R/t ratiosbetween 36 and 420 experimentally and analytically. De’Oliveria
ll rights reserved.
and Wierzbicki [5] conducted the same study. They completed acrushing analysis of rotationally symmetric plastic shells. Kinkeadet al. [6] completed a quasi-static study on semi-spherical shellswith R/t ratios between 36 and 420. This study produced similarresults as previous studies. Gupta et al. [7] performed experi-ments on metallic semi-spherical shells with R/t ratios rangingbetween 15 and 240. Gupta et al. [7] examined three levels ofdeformation: local flattening, inward dimpling, and multiplelobes. Gupta and Venkatesh [8] presented a two-dimensionalnumerical analysis for semi-spherical shells under axial impact. Inthis study, a strong correlation was observed between thenumerical simulation and the experimental results in bucklingbehavior that are related to the first mode jumping from localflattening to inward dimpling. In another study presented byGupta and Gupta [9], the semi-spherical shells of R/t ratiosbetween 26 and 45 had similar results when they were analyzedexperimentally and computationally. In these experiments, all ofthe spherical shells were found to collapse in an axisymmetricmode. Ruan et al. [10] performed a series of tests on a ping-pongball loaded by a rigid plate, rigid bar, and a rigid tube. Heconducted these tests to explore the various post-buckingbehaviors of a spherical shell and to compare the results withexisting theoretical models proposed by Morris and Calladine [2],Updike [3] and De’Olivier and Wierzbicki [5].
The main purpose for the majority of investigations is to studythe high-energy absorption of shells. The amount of energyabsorbed is a function of the method of application of loads,transmission rates, deformation or displacement patterns, andmaterial properties [11]. With the exception of loading by rigid

ARTICLE IN PRESS
M. Shariati, H.R. Allahbakhsh / Thin-Walled Structures 48 (2010) 620–628 621
plate, a literature search revealed minimal documentation of theresponse of the buckling and energy absorption of semi-sphericalto various loading. It is noteworthy, that the mean collapse loadcan occur in higher and controllable levels with change of themethod of application of loads. In this paper, a linear and anonlinear analysis were conducted to study the effect of themethod of application of loads on the buckling and post-bucklingbehavior on semi-spherical shells. Various vertical compressionloadings are applied to specimens and the mean collapse load areobtained for each other. The ABAQUS finite element software wasused. Semi-spherical shells with R/t ratios between 22 and 72were analyzed. Several buckling tests were performed using anINSTRON 8802 servo-hydraulic machine. The results werecompared with the results of the finite element method. A strongcorrelation between experiments and numerical simulations wasobserved.
2. Numerical analysis using the finite element method
The numerical simulations were carried out using the finiteelement software ABAQUS 6.7-1.
800 Linear data:
2.1. Geometry and mechanical properties of the shells
In this study, thin-walled semi-spherical shells with threedifferent diameters (L¼102, 77, 53 mm) and four differentthicknesses (t¼0.7, 0.8, 1.0, 1.2 mm) were analyzed. Fig. 1shows the geometry of the specimens. According to Fig. 1,parameters (D, d, t, h) show the upper diameter, lower diameter,thickness, and height of the semi-spherical shells, respectively.
Specimens were nominated as follows: D102–d25–t0.8–h38.The numbers following D, d, t, and h quantify these dimensions forthe specimen.
The semi-spherical shells used for this study were made of amild steel alloy. The mechanical properties of the steel alloy weredetermined according to the ASTM E8 standard [12], using theINSTRON 8802 servo-hydraulic machine. Fig. 2 shows the stress–strain curve. Based on the linear portion of the stress–strain curve,the value of the elasticity module was computed as E¼150 GPaand the value of yield stress was obtained as s¼404 MPa.
Fig. 1. Cut view of specimens.
Furthermore, the value of Poisson’s ratio was assumed to ben¼0.33.
2.2. Boundary conditions
To apply boundary conditions to the bottom edges of the semi-spherical shells, a rigid plate was attached to the bottom edges ofthe semi-spherical shells. To analyze their buckling numerically,the specimens were subjected to an axial load similar to the loadin the experimental tests. In this process, a displacement wasapplied to the center of the upper plate, bar, or tube.
With the exception of the longitudinal axis direction, alldegrees of freedom in the lower plate and in the upper plate, bar,or tube were constrained.
2.3. Element formulation of the specimens
For this analysis, the nonlinear element, S8R5, was an eight-node element with six degrees of freedom per node and wassuitable for the analysis of thin shells. The linear element, S4R,was a four-node element. Both linear and nonlinear elementswere used for the analysis of the shells. These results werecompared with each other. For the rigid plate, bar, or tube, theelement R3D4 was used. A friction coefficient of 0.1 was recorded.The effect of the friction coefficient ranged from 0.08 to 0.12 andaffected results by less than 1% [8].
2.4. Numerical process
In this study, an eigenvalue analysis overestimates the value ofthe buckling load because the plastic properties of the material donot have any role in the analyses procedure [13]. An initialeigenvalue analysis should be conducted for all specimens of abuckling analysis in order to find the mode shapes andcorresponding eigenvalues. The first modes have smaller eigen-values and buckling usually occurs in these mode shapes. For aneigenvalues analysis, the ‘‘buckle’’ step was completed byABAQUS. For all specimens, three first-mode shapes and their
0
200
400
600
0 0.1 0.2 0.3 0.4 0.5Strain (mm/mm)
Stre
ss (M
Pa)
True curve
Engineering curve
Stress(MPa) Strain
0.00 0.0000
160.79 0.0011
253.16 0.0017
301.60 0.0020
361.52 0.0024
Fig. 2. Stress–strain curves.
Fig. 3. Buckling mode shapes for specimen D102–d25–t01–h48: (a) first mode, (b)
second mode, and (c) third mode.

ARTICLE IN PRESS
M. Shariati, H.R. Allahbakhsh / Thin-Walled Structures 48 (2010) 620–628622
corresponding displacements were obtained. The effects of thesemode shapes must be considered in a nonlinear buckling analysis(Static Riks step). Otherwise, the software may choose thebuckling mode in an arbitrary manner and produce unrealisticresults in nonlinear analyses. For the ‘‘buckle’’ step, the subspacesolver method of the software was used. Due to the presence ofcontact constraints between the rigid plates and the shell, theLanczos solver method cannot be used on these specimens [14]. InFig. 3, three primary mode shapes are shown for the specimenD102–d25–t01.0–h48. After completion of the buckle analysis, anonlinear analysis was performed to plot the load–displacementcurve. This step is called ‘‘Static Riks’’ and uses the arc lengthmethod for post-buckling analysis. The nonlinearity of bothmaterial properties and geometry is taken into consideration inthis analysis.
3. Loading by a rigid plate
In this section, the numerical results for D77–d25–h38, D53–d18–h28, and D102–d25–h48 specimens with thicknesses of 1.2,1, 0.8, and 0.7 mm are analyzed. For comparison, the energyabsorption capacity of specimens is a criterion that defines themean collapse load. Mean collapse load is calculated by dividingthe area under the load–displacement curve by the displacementof the upper rigid plate. The collapse is initiated by the formationof an axisymmetric ring at the smaller end during loading by arigid plate. With further compression, the mechanism of collapsechanges. At this stage, its propagation is due to the formation ofan axisymmetric inward dimpling and a rolling plastic hinge
0
10
20
30
40
0
Load
(kN
)
AA=Zone representing formation of an axi-symmetrB=Zone representing formation of an axi-symmetr
Fig. 4. Load-deformation curves of specimen D77–d25–h38 and w
0
5
10
15
20
25
R/t
Mea
n co
llaps
e lo
ad (k
N) D55
D77D102
0 20 40 60 80
Fig. 5. Variation of mean collapse load vs. R/t values, (a) depth of d
circle that is in contact with the top plate. Fig. 4 shows that theslope of the load–deformation curve changes appreciably.
As Fig. 5a and b show, the mean collapse load varies with theradius to thickness ratio for semi-spherical shells. Thisrelationship exists after the shells are compressed 10 mm. Itlasts until the absorber (semi-spherical) is entirely consumed andthe apex of the semi-spherical shell makes contact with the rigidbase plate. Fig. 5a shows that the mean collapse load decreaseswith an increase in the radius to thickness ratio (R/t ratio) of thespherical shell for the specimens of equal radii but of differentthicknesses. The ratio decreases with an increase in the R/t ratiofor specimens of equal thicknesses but of different radii. Fig. 5bshows that the mean collapse load decreases with an increase inthe radius to thickness ratio (R/t ratio) of the spherical shell forthe specimens of equal radius but of different thicknesses.However, the mean collapse load increases with an increase inthe R/t ratio for the specimens of equal thicknesses but ofdifferent radii.
In a comparison of Fig. 5a and b, the best semi-spherical shell(the greatest mean collapse load) to be used in various heightcompression is a spherical shell with the maximum thickness andthe minimum diameter.
4. Loading by different bars
In this section, the effect of loading conditions is considered.Therefore, some semi-spherical shells with a diameter equal tothe small diameter of the spherical shells (d¼25 mm) are loadedby a circular bar. Semi-spherical shells are also loaded by a square
5 10 15Deformation (mm)
t=1.2 (mm)t=1.0 (mm)t=0.8 (mm)t=0.7 (mm)
Bic ring at the smaller endic inward dimpling
all thickness for a semi-spherical with thickness of 0.8 mm.
0
5
10
15
20
25
30
0 20 40 60 80R/t
Mea
n co
llaps
e lo
ad (k
N) D55
D77D102
eformation¼10 mm and (b) maximum depth of deformation.

ARTICLE IN PRESS
Table 1Numerical analysis result for semi-spherical shells in loading by rigid bar with
different cross sections.
M. Shariati, H.R. Allahbakhsh / Thin-Walled Structures 48 (2010) 620–628 623
bar with a side length equal to 22 mm. The cross-sectional area isequivalent to the two methods. Fig. 6 shows that a column with asemi-spherical end loads shells.
Fig. 7 illustrates the load-deformation curves that wereobtained for the specimen D102–d25–t1–h48 with variousloadings. During loading with a circular cross-section, only thefirst mode is observed from the formation of an axisymmetric ringtowards inward dimpling. The formation of stationary plastichinges and an integral number of 4 lobes were observed afterloading with a square cross-section. This event occurred after theformation of an axisymmetric ring. However, formation of inwarddimpling is not observed.
The primary part of the curve in loading by circular and squarecross section bar is linear shown during a comparison of loadingwith a semi-spherical end shells with three other ones (rigidplate, circular column, and square column). Linear behavior is notobserved in this type of loading. While loading with a semi-spherical column, the formation of an axisymmetric ring is notobserved. A mode jump is observed with inward dimpling thatleads to the formation of stationary plastic hinges and an integralnumber of 3 lobes.
Fig. 7 shows loading by a circular bar. The slope of the loaddeformation curve after the linear portion is comparable to thesquare bar. The absorption energy in the mode jump from theformation of an axisymmetric ring to inward dimpling is greaterthan the absorption energy in the mode jump from formation ofan axisymmetric ring to lobe formation. In addition, the load–deformation curve for loading by a rigid bar with a semi-sphericalcross section shows that the absorption energy decreases whenthe formation of an axisymmetric ring is eliminated.
Fig. 6. Loading with various bars, (a) circular cross section (CC), (b) square cross
section (SC), and (c) spherical cross section (SPC).
0
2
4
6
8
10
0 5 1Deforma
Load
(kN
)
a b
Fig. 7. Load-deformation curve for specimen D102–d25–t0.8–h48 and shell thickness in
(c) spherical cross section bar (SPC).
Table 1 presents the results from a numerical analysis with thethree different bars.
5. Loading by a rigid tube
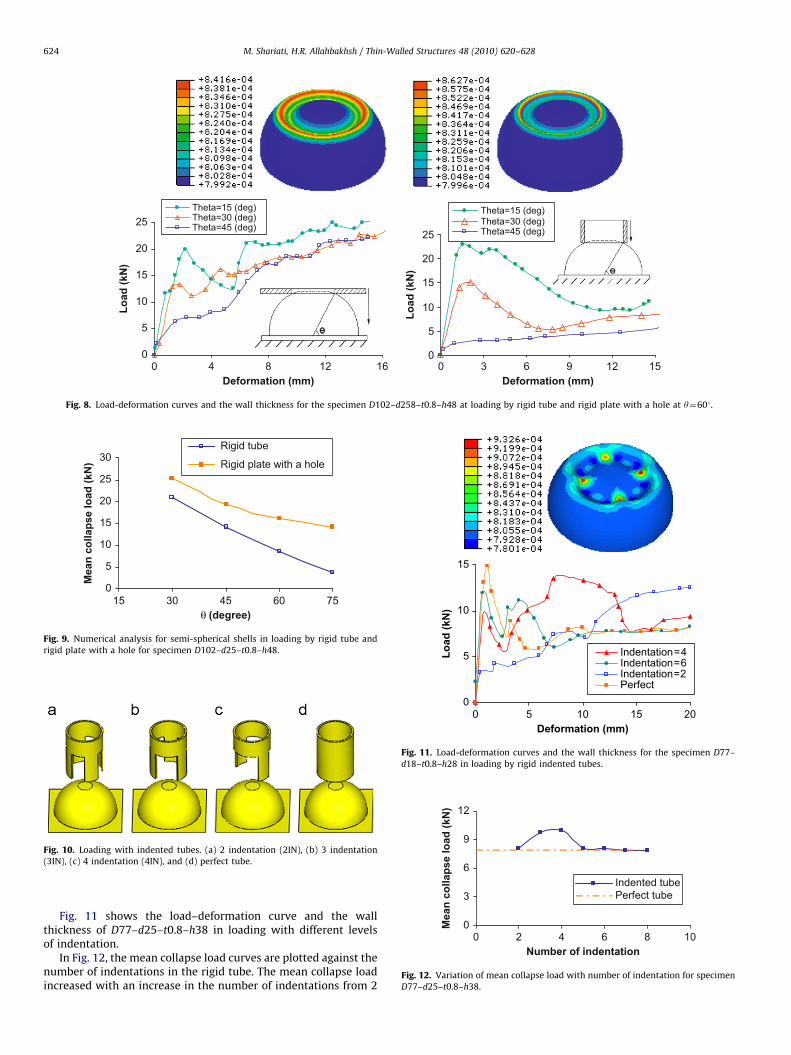
In this section, the loading is carried out by a rigid 5 mm tubeand a rigid plate with a hole. Fig. 8 shows the load–deformationcurve and wall thickness of the specimen D102–d25–t0.8–h48,which has been loaded by the tube and a rigid plate with a holeand multiple y values. A decrease in the value of y corresponds toan increase in the mean collapse load. Fig. 9 shows the meancollapse load for the specimen D102–d25–t0.8–h48, which hasbeen loaded by a rigid plate with a hole and a rigid tube. Incomparison to loading with a rigid tube, Fig. 9 shows that themean collapse load increases in loading by the rigid plate with ahole.
6. Loading by a rigid indentationed tube
In this section, the spherical shells are loaded with an indentedtube. Four tubes with a 50 mm diameter and a thickness of 5 mmare chosen and indented (Fig. 10).
0 15 20tion (mm)
CCSCSPC
c
loading by, (a) circular cross section bar (CC), (b) square cross section bar (SC), and
Specimens specification Deformation height (mm) Mean collapse load (kN)
SPC SC CC
D55–d18–t0.7–h28 25 3.6 4.2 4.2
D55–d18–t0.8–h28 25 4.3 5.1 5.2
D55–d18–t1.0–h28 25 6.0 7.1 7.3
D55–d18–t1.2–h28 25 7.8 9.4 9.8
D77–d25–t0.7–h38 35 4.0 4.7 5.0
D77–d25–t0.8–h38 35 4.9 5.8 6.1
D77–d25–t1.1–h38 35 6.7 8.1 8.5
D77–d25–t1.2–h38 35 8.6 10.4 11.1
D102–d25–t0.7–h48 40 3.8 4.4 4.7
D102–d25–t0.8–h48 40 4.9 5.4 5.7
D102–d25–t1.0–h48 40 6.8 7.8 8.1
D102–d25–t1.2–h48 40 9.1 10.4 10.6
ARTICLE IN PRESS
0
5
10
15
20
25
0 4 8 12 16Deformation (mm)
Load
(kN
)
Theta=15 (deg)Theta=30 (deg)Theta=45 (deg)
0
5
10
15
20
25
0 3 6 9 12 15Deformation (mm)
Load
(kN
)
Theta=15 (deg)Theta=30 (deg)Theta=45 (deg)
Fig. 8. Load-deformation curves and the wall thickness for the specimen D102–d258–t0.8–h48 at loading by rigid tube and rigid plate with a hole at y¼601.
0
5
10
15
20
25
30
15 30 45 60 75θ (degree)
Mea
n co
llaps
e lo
ad (k
N)
Rigid tube
Rigid plate with a hole
Fig. 9. Numerical analysis for semi-spherical shells in loading by rigid tube and
rigid plate with a hole for specimen D102–d25–t0.8–h48.
Fig. 10. Loading with indented tubes. (a) 2 indentation (2IN), (b) 3 indentation
(3IN), (c) 4 indentation (4IN), and (d) perfect tube.
0
5
10
15
0 5 10 15 20Deformation (mm)
Load
(kN
)
Indentation=4Indentation=6Indentation=2Perfect
Fig. 11. Load-deformation curves and the wall thickness for the specimen D77–
d18–t0.8–h28 in loading by rigid indented tubes.
0
3
6
9
12
0 2 4 6 8 10Number of indentation
Mea
n co
llaps
e lo
ad (k
N)
Indented tubePerfect tube
Fig. 12. Variation of mean collapse load with number of indentation for specimen
D77–d25–t0.8–h38.
M. Shariati, H.R. Allahbakhsh / Thin-Walled Structures 48 (2010) 620–628624
Fig. 11 shows the load–deformation curve and the wallthickness of D77–d25–t0.8–h38 in loading with different levelsof indentation.
In Fig. 12, the mean collapse load curves are plotted against thenumber of indentations in the rigid tube. The mean collapse loadincreased with an increase in the number of indentations from 2

ARTICLE IN PRESS
Fig. 13. A serve hydraulic INSTRON 8802 machine in loading on semi-spherical
shell by circular bar.
0
2
4
6
8
0 10 20 30 40Deformation (mm)
Load
(kN
)
FEMEXP
Fig. 14. Comparison of the experimental and numerical results for the specimen D53–d1
rigid plate.
0
3
6
9
0 10 20 30 40Deformation (mm)
Load
(kN
)
FEM EXP
Fig. 15. Comparison of the experimental and numerical results for the specim
0
5
10
15
20
Deformation (mm)
Load
(kN
)
FEMEXP
0 4 8 12 16
Fig. 16. Comparison of the experimental and numerical results for the specimen D
M. Shariati, H.R. Allahbakhsh / Thin-Walled Structures 48 (2010) 620–628 625
to 4. The mean collapse load decreased with an increase in thenumber of indentations from 4 to 5. The collapse is constant withan increase in the number of indentations from 5 to 8. Theseobservations indicate that with an increased number ofindentations, the indented tube acted like a rigid tube.
7. Verification of numerical results with experimental results
Experimental tests were conducted on a large number ofspecimens in order to confirm the numerical results. For thesetests, a servo-hydraulic INSTRON 8802 machine was used(Fig. 13).
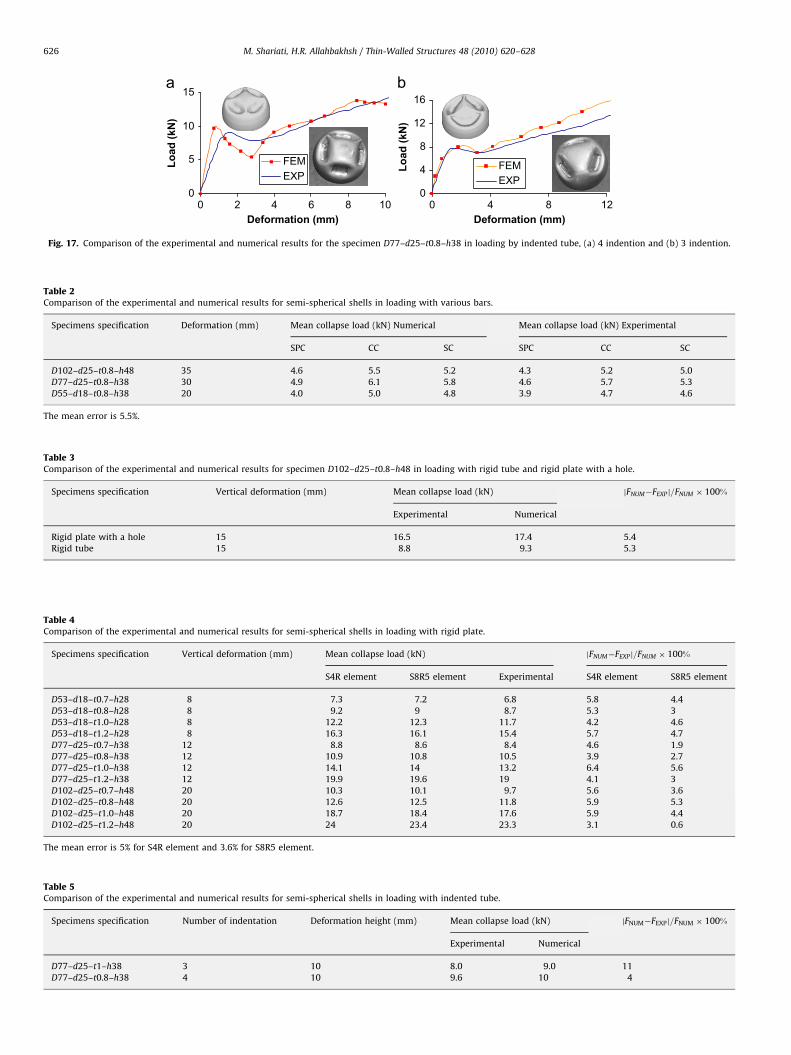
The load deformation curves produced by numerical andexperimental analyses are shown in Figs. 14–17. The meancollapse loads obtained from experimental and numericalstudies are shown in Tables 2–5. Results indicate a minimaldifference between the experimental and numerical results. Forexample, the average discrepancy between the two sets of resultsin Table 4 is 5% for the linear element and 3.6% for the S8R5
0
4
8
12
16
0 2 4 6 8Deformation (mm)
Load
(kN
)
FEM EXP
8–t0.8–h28 in loading with (a) rigid tube with semi-spherical cross section and (b)
0
3
6
9
0 10 20 30 40Deformation (mm)
Load
(kN
)
FEMEXP
en D102–d25–t0.8–h48 in loading by (a) square bar and (b) circular bar.
0
5
10
15
20
25
0 5 10 15Deformation (mm)
Load
(kN
)
FEM EXP
102–d25–t0.8–h48 in loading by (a) rigid tube and (b) rigid plate with a hole.
ARTICLE IN PRESS
0
5
10
15
0 2 4 6 8 10Deformation (mm)
Load
(kN
)FEMEXP
0
4
8
12
16
0 4 8 12Deformation (mm)
Load
(kN
)
FEMEXP
Fig. 17. Comparison of the experimental and numerical results for the specimen D77–d25–t0.8–h38 in loading by indented tube, (a) 4 indention and (b) 3 indention.
Table 2Comparison of the experimental and numerical results for semi-spherical shells in loading with various bars.
Specimens specification Deformation (mm) Mean collapse load (kN) Numerical Mean collapse load (kN) Experimental
SPC CC SC SPC CC SC
D102–d25–t0.8–h48 35 4.6 5.5 5.2 4.3 5.2 5.0
D77–d25–t0.8–h38 30 4.9 6.1 5.8 4.6 5.7 5.3
D55–d18–t0.8–h38 20 4.0 5.0 4.8 3.9 4.7 4.6
The mean error is 5.5%.
Table 3Comparison of the experimental and numerical results for specimen D102–d25–t0.8–h48 in loading with rigid tube and rigid plate with a hole.
Specimens specification Vertical deformation (mm) Mean collapse load (kN) jFNUM�FEXP j=FNUM � 100%
Experimental Numerical
Rigid plate with a hole 15 16.5 17.4 5.4
Rigid tube 15 8.8 9.3 5.3
Table 4Comparison of the experimental and numerical results for semi-spherical shells in loading with rigid plate.
Specimens specification Vertical deformation (mm) Mean collapse load (kN) jFNUM�FEXP j=FNUM � 100%
S4R element S8R5 element Experimental S4R element S8R5 element
D53–d18–t0.7–h28 8 7.3 7.2 6.8 5.8 4.4
D53–d18–t0.8–h28 8 9.2 9 8.7 5.3 3
D53–d18–t1.0–h28 8 12.2 12.3 11.7 4.2 4.6
D53–d18–t1.2–h28 8 16.3 16.1 15.4 5.7 4.7
D77–d25–t0.7–h38 12 8.8 8.6 8.4 4.6 1.9
D77–d25–t0.8–h38 12 10.9 10.8 10.5 3.9 2.7
D77–d25–t1.0–h38 12 14.1 14 13.2 6.4 5.6
D77–d25–t1.2–h38 12 19.9 19.6 19 4.1 3
D102–d25–t0.7–h48 20 10.3 10.1 9.7 5.6 3.6
D102–d25–t0.8–h48 20 12.6 12.5 11.8 5.9 5.3
D102–d25–t1.0–h48 20 18.7 18.4 17.6 5.9 4.4
D102–d25–t1.2–h48 20 24 23.4 23.3 3.1 0.6
The mean error is 5% for S4R element and 3.6% for S8R5 element.
Table 5Comparison of the experimental and numerical results for semi-spherical shells in loading with indented tube.
Specimens specification Number of indentation Deformation height (mm) Mean collapse load (kN) jFNUM�FEXPj=FNUM � 100%
Experimental Numerical
D77–d25–t1–h38 3 10 8.0 9.0 11
D77–d25–t0.8–h38 4 10 9.6 10 4
M. Shariati, H.R. Allahbakhsh / Thin-Walled Structures 48 (2010) 620–628626

ARTICLE IN PRESS
M. Shariati, H.R. Allahbakhsh / Thin-Walled Structures 48 (2010) 620–628 627
nonlinear element. The results for nonlinear elements have fewererrors. The slope of the load vs. end-shortening curves is higher inthe numerical results than in the experimental results before thebuckling. This discrepancy is due to the presence of internaldefects in the material. These defects reduce the stiffness of thespecimens in the experimental method, whereas the numericalanalyses assume the materials perform ideally.
8. Conclusion and discussion
In this paper, the behavior of buckling in thin-walled semi-spherical shells subjected to various loadings was studied. Thebuckling phenomenon plays an essential role in the load carryingcapacity of the specimens. Fig. 18 shows that the energy–compression curves of the steel spherical shells that weresubjected to loading by a rigid bar with a spherical cross section.
In conclusion, Fig. 18 indicates that absorbed energies follow aquadratic function. The difference between the absorbed energyfor thicknesses of 0.7 and 0.8 mm with height compressions of 10,20, 30, and 40 mm are 18.5%, 18.1%, 17.7%, and 18.4%, respec-tively. This result shows that the rate of increase remainsapproximately constant.
Fig. 7 shows a plot of the shell thicknesses in loading by a rigidbar. Loading with different bars shows that a maximum increasein thickness is obtained in stationary hinges; a minimumthickness is reached if it is in the contact zone of semi-sphericalrigid bars.
Fig. 8 shows a contour plot of the shell thickness in loading bya rigid tube and a rigid plate with a hole. The maximum increasein thickness occurred in inner rolling plastic hinges.
The load–deformation and energy–compression curves ob-tained from tests conducted on spherical shells are presented inFigs. 14–17. The shape of the load–deformation curve is an
0
100
200
300
400
0 10 20 30 40Deformation (mm)
Ener
gy (N
.m)
t=1.2 (mm)t=1.0 (mm)t=0.8 (mm)t=0.7 (mm)
Fig. 18. Energy–compression curves of specimens D102–d25–h48 in loading by
rigid bar with spherical cross section.
Δh=10 mm
Δh=5 mm
Δh=5 mm
Fig. 19. Measurement of deform
important characteristic of an energy absorber. An ideal energyabsorber has a square wave load–deformation profile [15,16], i.e.,once the buckling mode starts (at peak loads) the collapsecontinues under the same load until the absorber is entirelyconsumed. The load–deformation curves obtained from theloading by a rigid plate with a hole resemble that of an idealenergy absorber.
In Fig. 19, the experimental and numerical profiles of a semi-spherical tube have been shown after loading by a rigid plate. Theexperimental profiles were measured by filling the semi-sphericalshell with paraffin at different stages of compression and byinterrupting the axial compression of specimens in the INSTRONmachine. As shown in Fig. 19, increases in the compression heightleads to increases in the circumferential strain and a tending outof the semi-spherical shell.
In Table 6, rolling plastic hinges of semi-spherical withthicknesses of 1 and 0.8 mm have listed for specimens D77–d25–d38 and D102–d25–h48. Table 6 shows that a rolling plastichinge increases with an increasing shell thickness and diameter.The difference between rolling plastic hinges in variousthicknesses increases with an increase in the compression height.
The thickness of the shell changed due to the circumferentialand meridional strain. Fig. 20 presented the wall thickness of theshell with a 15 mm compression. According to Fig. 20, the initial(nearly unstrained) flat region of the curve corresponds to theunreformed portion of the semi-spherical shell, which wasminimally reduced. The reduction reached its maximum at theouter rolling plastic hinge due to stretching. The subsequent slopeof the curve increased and reached its maximum at the innerrolling plastic hinge. A peak value, eth¼ .077, was predicted by afinite element analysis. After the peak value, the thickness straindecays because of progressive circumferential and meridionalstretching.
AB= rp1
CD= rp2
rp1 > rp2
ed shapes at various stages.
Table 6Comparison of rolling plastic hinge radius.
Compression
height (mm)
Rolling plastic hinge radius (mm)
D102–d25–h48 D77–d25–h38
t¼0.8 mm t¼1 mm t¼0.8 mm t¼1 mm
3 55.5 55.5 46.5 46.5
6 45 45 35 34.5
9 35.5 36 26 23.5
12 31 32 20 17
15 26.5 27.5 16 12
18 24 25 – –
21 21 23 – –
24 20 22 – –

ARTICLE IN PRESS
-0.02
0
0.02
0.04
0.06
0.08
0 20 40 60 80 100Length (mm)
Thic
knes
s st
rain
(mm
/mm
)
Fig. 20. Distribution of the thickness strain along a cross-section of a semi-
spherical (D102–d25–t0.8–h48).
0 5 10 15 20 25 30
indentioned tube
rigide plate with a hole
rigid tube
circular bar
rigid plate
square bar
rigid bar with spheical cross section
mean collapse load (kN)
Fig. 21. Summary of the results from the different loadings in terms of the mean
collapse load for specimen D77–d25–t0.8–h38 at 10 mm compression.
M. Shariati, H.R. Allahbakhsh / Thin-Walled Structures 48 (2010) 620–628628
Fig. 21 shows a synthesis of the mean collapse load and variousloading. The mean collapse load is a good indicator of the energyabsorption capability. The rigid plate with a hole is the moreefficient solution for energy absorption.
9. Concluding remarks
Semi-spherical shells of different loading were investigatedexperimentally and numerically. The load–deformation projec-tions at different stages of compressions match well with resultsobtained from experiments. The predicted deformed shapes atdifferent stages of compressions and various loadings correspondwell with the actual deformed profiles. The following results werefound in this study:
1.
The mean collapse load is greater with loading by circular barcompared to loading with a square bar or a rigid bar with aspherical cross section. When compared to the two other typesof bars, the mean collapse load is less for loading by a rigid barwith a spherical cross section.2.
The mean collapse load is greater for loading by a rigid platewith a hole than for a loading by a rigid tube. The meancollapse load increases with an increase in the whole diameterof the rigid tube and plate.3.
In loading with an indented tube, the tube with 4 indentationshas the highest mean collapse load value.4.
The thickness of a shell changes during compression. Thethickness strain is greater for stationery plastic hinges whencompared to rolling plastic hinges.5.
Rolling plastic hinges increase with an increase in shellthickness and diameter.6.
The best semi-spherical shell (with a maximum mean collapseload) for various height compressions is one with themaximum thickness and the minimum diameter.7.
The shell can tolerate a greater mean collapse load when it isloaded by a rigid plate with a hole than it can when it is loadedwith a rigid plate, bar, or tube.References
[1] Lekie FA, Penny PK. Plastic instability of a spherical shell. In: Heyman J, LeckieFA, editors. Engineering Plasticity. 1968, p. 401–11.
[2] Morris A, Calladine CR. The local strength of thin spherical shell loadedradially through a rigid boss. In: Berman I, editor. Proceeding of the firstinternational conference on pressure vessel technology. 1969. p. 35–44.
[3] Updike DP. On the large deformation of a rigid plastic spherical shellcompressed by a rigid plate. Journal of Engineering for Industry1972;94:949–55.
[4] Kitching R, Houston R, Johnson W. A theoretical and experimental study ofhemispherical shells subjected to axial loads between flat plates. Interna-tional Journal of Mechanical Sciences 1975;17:693–703.
[5] De’Oliveria JG, Wierzbicki T. Crushing analysis of rotationally symmetricplastic shells. Journal of Strain Analysis 1982;17(4):229–36.
[6] Kinkead AN, Jennings A, Newell J, Leinster JC. Spherical shells in inelasticcollision with a rigid wall tentative analysis and recent quasi-static testing.Journal of Strain Analysis 1994;29(1):17–41.
[7] Gupta NK, Eswara Prasad GL, Gupta SK. Axial compression of metallicspherical shells between rigid plates. International Journal of Thin-WalledStructures 1999;34(1):21–41.
[8] Gupta NK, Venkatesh G. Experimental and numerical studies of dynamic axialcompression of thin walled spherical shells. International Journal of ImpactEngineering 2004;30(8–9):1225–40.
[9] Gupta PK, Gupta NK. A study of axial compression of metallic hemisphericaldomes. Journal of Materials Processing Technology 2009;209:2175–9.
[10] Ruan HH, Gao ZY, Yu TX. Crushing of thin-walled spheres and sphere arrays.International Journal of Mechanical Sciences 2006;48:117–33.
[11] Alghamdi AAA. Collapsible impact energy absorbers: an overview. Thin-Walled Structures 2001;39:189–213.
[12] ASTM A370-05, Standard test methods and definitions for mechanical testingof steel products.
[13] ABAQUS 6.7 PR11 user’s manual.[14] Shariati M, Rokhi MM. Numerical and experimental investigations on
buckling of steel cylindrical shells with elliptical cutout subject to axialcompression. Thin Walled Structures 2008;46(11):1251–61.
[15] Gupta NK, Mohamed Sheriff N, Velmurugan R. Experimental and numericalstudies of buckling of thin spherical shells under axial loads. InternationalJournal of Mechanical Sciences 2008;50:422–32.
[16] Gupta NK, Mohamed Sheriff N, Velmurugan R. Experimental and numericalinvestigations into collapse behavior of thin spherical shells under drophammer impact. International Journal of Solids and Structures2007;44:3136–55.