Embed Size (px)
Citation preview

Working in the NumberSense Companion Workbook
The NumberSense Companion Workbooks address measurement, spatial reasoning (geometry) and data handling.There are 4 NumberSense Companion Workbooks. With the publication of the NumberSense Companion Workbooks we complete the mathematics curriculum coverage for Grades 4 to 7 (one Companion Workbook per grade). It is our hope that the NumberSense Companion Workbooks will provide children with the same challenges and enjoyment that they get from the NumberSense Workbooks helping them to experience mathematics as a meaningful, sense-making, problem solving activity. Please note that these sample pages include references from the Companion Workbook Teacher Guide – the actual workbook will not include the Teacher Guide pages. Teachers will be able to download the Teacher Guides, at no charge, from the NumberSense website. You will, however, need to register on the website to access these resources. To gain optimal benefit from the workbook series it is critical that children are encouraged to reflect on the tasks that they complete. Teachers (and parents) should ask questions such as: Did you notice anything as you completed those activities? What helped you to answer the question? How is this activity similar to or different from activities that you have already completed? Please mail [email protected] for further assistance or information.
NumberSense Companion Workbook Grade 4
Sample Pages (ENGLISH)

Grade 4 NS Companion (English)
18
1. Make a cardboard copy of the shape and complete the two tessellations by tracing around the cardboard shape and covering the entire grid.
Explain what you did with the shape to complete each tessellation.
2. Make a cardboard copy of the shape and complete the two tessellations by tracing around the cardboard shape and covering the entire grid.
Explain what you did with the shape to complete each tessellation.
On this page, children make patterns from shapes with a focus on tiling (tessellation).
Answers and discussion
It is important that children discuss the movement of the shape in terms of sliding, flipping and turning and that they recognise that the properties of the shape are unchanged. It is also important that the children cut out the cardboard shapes and trace around them – rather than simply completing the pattern using the grid – we want them to “feel” the transformations.
1.
2.
Each time a new shape is drawn, it has either been slid (translated) or flipped (reflected).
Each time a new shape has been drawn, it has either been slid (translated) or turned (rotated).
Each time a new shape is drawn, it has either been slid (translated) or turned (rotated).
Each time a new shape is drawn, it has been slid (translated).
When shapes are arranged in a repeating pattern without overlapping in such a way so that there are no gaps, we say that the shapes are tessellated.
For example, a shape can be tessellated like this:
Page 18

Grade 4 NS Companion (English)
32
1. Order these shapes from smallest to largest. Explain how you did it.
2. Order these shapes from smallest to largest. Explain how you did it.
3. Rorisang ordered these shapes from smallest to largest.
Explain to Rorisang what he has done wrong.
4. Explain how you would work out which shape, B or E, is largest.
On this page, children investigate area in order to develop an understanding of square units.
Suggested lesson activities
This page works very well as a classroom activity.
It is essential that children have a meaningful discussion about what is meant by the size of shapes. Ask the children what they understand by “largest” and “smallest”. Guide the discussion again, to a comparison of the amount of space on the page that each shape covers. Children may use the word area although this has not been defined yet.
Answers and discussion
It is not important for children to “get the right answer” in this activity, but more important that they are aware that area can be described in terms of how many identical shapes cover a surface, that different sized shapes will result in different answers and that there needs to be some systematic way to deal with the squares that are only partially covered. In time children will realise that as a convention we use square units, but there is nothing to stop us from using triangles, rectangles or hexagons, or any shape that tessellates the plane.
3. When comparing the size of shapes we need to use the same unit.
4. To compare the sizes of shapes B and E, we would have to cover these shapes with the same unit. This could be done using a transparency or cutting out (square) tiles and counting how many tiles it takes to cover the shape. We cannot compare them using the grids on which they are drawn.
Page 32
G
B C A
I H
D E F
Shape G covers about 7 triangles, Shape H covers about 8 squares and shape I covers about 28 squares – so shape G is the smallest and shape I is the largest!

Grade 4 NS Companion (English)
34
1. Play the SINKING SAND game. Did you win or lose?
2. Play the game at least 20 times. Keep a tally of the number of times that you win and the number of times that you lose.
3. Study the table. Do you think that this is a fair game? Discuss this with your group or class.
4. a. In the table, record how many wins and losses (out of 20 games) nine other
children in your class recorded. In the first column, record how many wins and
losses you had.
b. Out of a total of 200 games, how many games resulted in a win?
c. Study the game and the results again. Can you describe and explain the trend
that you observe?
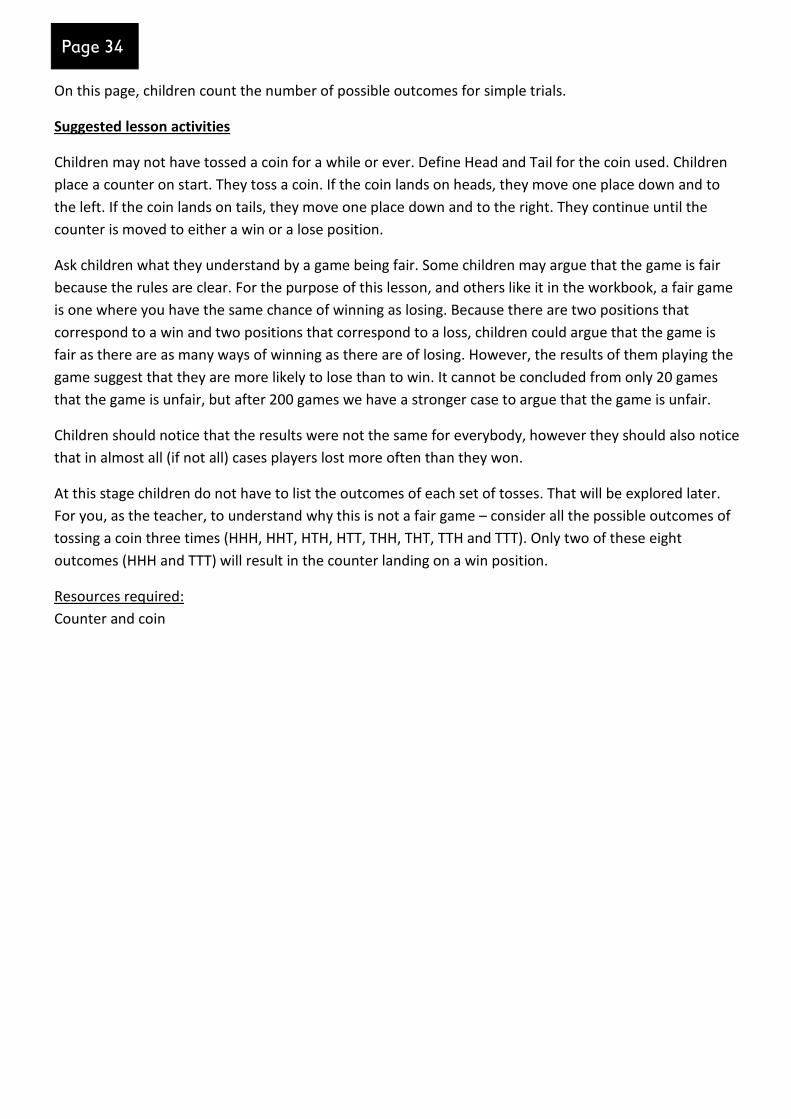
On this page, children count the number of possible outcomes for simple trials.
Suggested lesson activities
Children may not have tossed a coin for a while or ever. Define Head and Tail for the coin used. Children place a counter on start. They toss a coin. If the coin lands on heads, they move one place down and to the left. If the coin lands on tails, they move one place down and to the right. They continue until the counter is moved to either a win or a lose position.
Ask children what they understand by a game being fair. Some children may argue that the game is fair because the rules are clear. For the purpose of this lesson, and others like it in the workbook, a fair game is one where you have the same chance of winning as losing. Because there are two positions that correspond to a win and two positions that correspond to a loss, children could argue that the game is fair as there are as many ways of winning as there are of losing. However, the results of them playing the game suggest that they are more likely to lose than to win. It cannot be concluded from only 20 games that the game is unfair, but after 200 games we have a stronger case to argue that the game is unfair.
Children should notice that the results were not the same for everybody, however they should also notice that in almost all (if not all) cases players lost more often than they won.
At this stage children do not have to list the outcomes of each set of tosses. That will be explored later. For you, as the teacher, to understand why this is not a fair game – consider all the possible outcomes of tossing a coin three times (HHH, HHT, HTH, HTT, THH, THT, TTH and TTT). Only two of these eight outcomes (HHH and TTT) will result in the counter landing on a win position.
Resources required: Counter and coin
Page 34
SINKING SAND
Place a counter on start.
Toss a coin. Heads Tails
HEAD TAIL
Keep tossing the coin until you win or lose.
Tally Number of wins / losses
LOSE
WIN
Child
Wins
Total
Losses
1(Me) 2
4 5 6 2 3 7 8 9 10 Total 2 3
Grade 4 NS Companion (English)
34
1. Play the SINKING SAND game. Did you win or lose?
2. Play the game at least 20 times. Keep a tally of the number of times that you win and the number of times that you lose.
3. Study the table. Do you think that this is a fair game? Discuss this with your group or class.
4. a. In the table, record how many wins and losses (out of 20 games) nine other
children in your class recorded. In the first column, record how many wins and
losses you had.
b. Out of a total of 200 games, how many games resulted in a win?
c. Study the game and the results again. Can you describe and explain the trend
that you observe?
On this page, children count the number of possible outcomes for simple trials.
Suggested lesson activities
Children may not have tossed a coin for a while or ever. Define Head and Tail for the coin used. Children place a counter on start. They toss a coin. If the coin lands on heads, they move one place down and to the left. If the coin lands on tails, they move one place down and to the right. They continue until the counter is moved to either a win or a lose position.
Ask children what they understand by a game being fair. Some children may argue that the game is fair because the rules are clear. For the purpose of this lesson, and others like it in the workbook, a fair game is one where you have the same chance of winning as losing. Because there are two positions that correspond to a win and two positions that correspond to a loss, children could argue that the game is fair as there are as many ways of winning as there are of losing. However, the results of them playing the game suggest that they are more likely to lose than to win. It cannot be concluded from only 20 games that the game is unfair, but after 200 games we have a stronger case to argue that the game is unfair.
Children should notice that the results were not the same for everybody, however they should also notice that in almost all (if not all) cases players lost more often than they won.
At this stage children do not have to list the outcomes of each set of tosses. That will be explored later. For you, as the teacher, to understand why this is not a fair game – consider all the possible outcomes of tossing a coin three times (HHH, HHT, HTH, HTT, THH, THT, TTH and TTT). Only two of these eight outcomes (HHH and TTT) will result in the counter landing on a win position.
Resources required: Counter and coin
Page 34
SINKING SAND
Place a counter on start.
Toss a coin. Heads Tails
HEAD TAIL
Keep tossing the coin until you win or lose.
Tally Number of wins / losses
LOSE
WIN
Child
Wins
Total
Losses
1(Me) 2
4 5 6 2 3 7 8 9 10 Total 2 3