Embed Size (px)
Citation preview

11Number and algebra
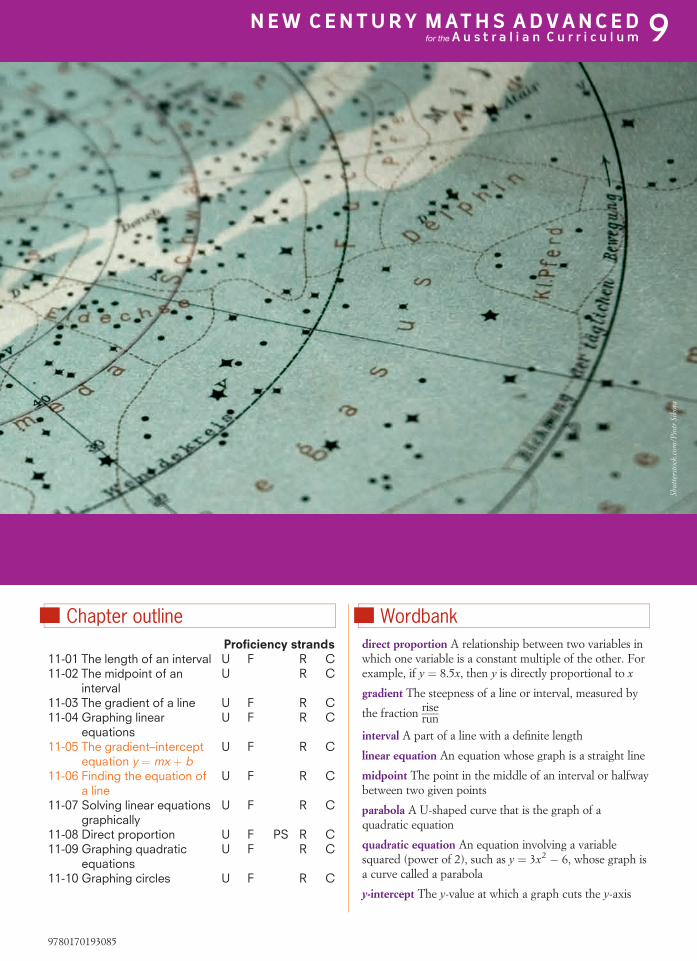
Coordinategeometryand graphsThe use of a coordinate system allows us to monitor thelocation of objects on Earth or in space. Whether readingstreet maps, using global positioning systems or managingroad traffic flow, coordinates provide an accurate methodfor indicating position. Coordinates have importantapplications in many areas including astronomy,architecture, engineering and art design.
n Chapter outlineProficiency strands
11-01 The length of an interval U F R C11-02 The midpoint of an
intervalU R C
11-03 The gradient of a line U F R C11-04 Graphing linear
equationsU F R C
11-05 The gradient–interceptequation y ¼ mx þ b
U F R C
11-06 Finding the equation ofa line
U F R C
11-07 Solving linear equationsgraphically
U F R C
11-08 Direct proportion U F PS R C11-09 Graphing quadratic
equationsU F R C
11-10 Graphing circles U F R C
nWordbankdirect proportion A relationship between two variables inwhich one variable is a constant multiple of the other. Forexample, if y ¼ 8.5x, then y is directly proportional to x
gradient The steepness of a line or interval, measured by
the fraction riserun
interval A part of a line with a definite length
linear equation An equation whose graph is a straight line
midpoint The point in the middle of an interval or halfwaybetween two given points
parabola A U-shaped curve that is the graph of aquadratic equation
quadratic equation An equation involving a variablesquared (power of 2), such as y ¼ 3x2 � 6, whose graph isa curve called a parabola
y-intercept The y-value at which a graph cuts the y-axis
Shut
ters
tock
.com
/Pio
trSi
kora
9780170193085
NEW CENTURY MATHS ADVANCEDfor the A u s t r a l i a n C u r r i c u l um9
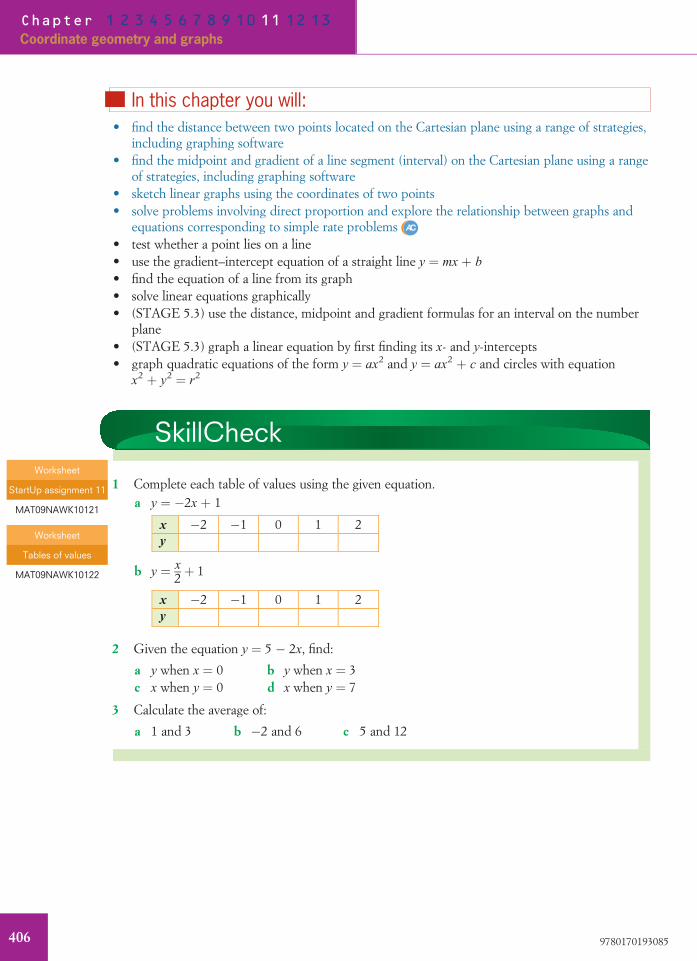
n In this chapter you will:• find the distance between two points located on the Cartesian plane using a range of strategies,
including graphing software• find the midpoint and gradient of a line segment (interval) on the Cartesian plane using a range
of strategies, including graphing software• sketch linear graphs using the coordinates of two points• solve problems involving direct proportion and explore the relationship between graphs and
equations corresponding to simple rate problems• test whether a point lies on a line• use the gradient–intercept equation of a straight line y ¼ mx þ b
• find the equation of a line from its graph• solve linear equations graphically• (STAGE 5.3) use the distance, midpoint and gradient formulas for an interval on the number
plane• (STAGE 5.3) graph a linear equation by first finding its x- and y-intercepts• graph quadratic equations of the form y ¼ ax2 and y ¼ ax2 þ c and circles with equation
x2 þ y2 ¼ r2
SkillCheck
1 Complete each table of values using the given equation.a y ¼ �2x þ 1
x �2 �1 0 1 2y
b y ¼ x2þ 1
x �2 �1 0 1 2y
2 Given the equation y ¼ 5 � 2x, find:
a y when x ¼ 0 b y when x ¼ 3c x when y ¼ 0 d x when y ¼ 7
3 Calculate the average of:
a 1 and 3 b �2 and 6 c 5 and 12
Worksheet
StartUp assignment 11
MAT09NAWK10121
Worksheet
Tables of values
MAT09NAWK10122
9780170193085406
Chapter 1 2 3 4 5 6 7 8 9 10 11 12 13
Coordinate geometry and graphs
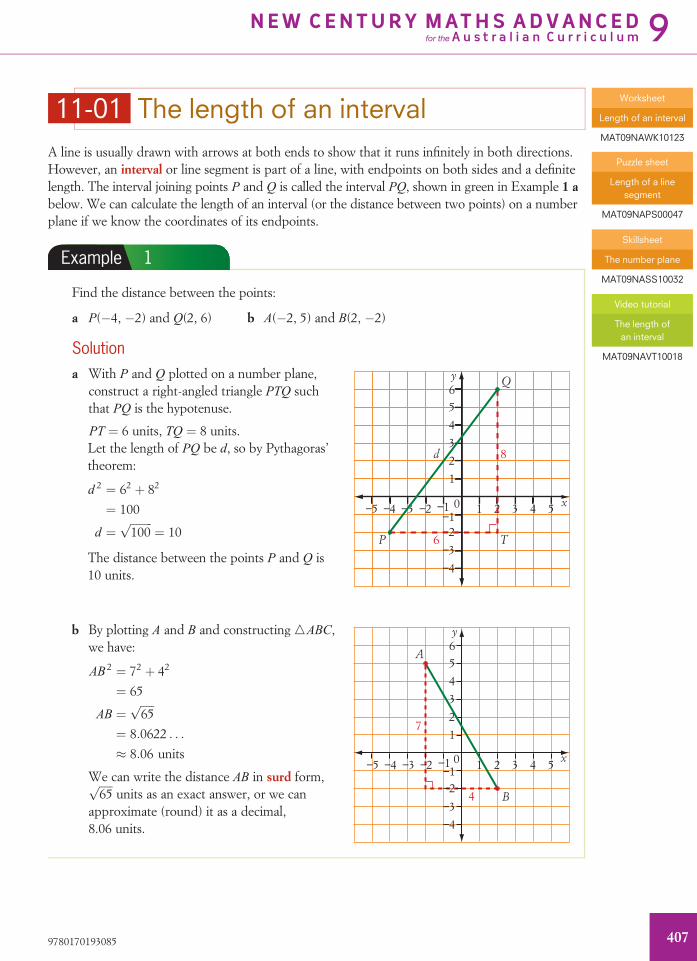
11-01 The length of an intervalA line is usually drawn with arrows at both ends to show that it runs infinitely in both directions.However, an interval or line segment is part of a line, with endpoints on both sides and a definitelength. The interval joining points P and Q is called the interval PQ, shown in green in Example 1 abelow. We can calculate the length of an interval (or the distance between two points) on a numberplane if we know the coordinates of its endpoints.
Example 1
Find the distance between the points:
a P(�4, �2) and Q(2, 6) b A(�2, 5) and B(2, �2)
Solutiona With P and Q plotted on a number plane,
construct a right-angled triangle PTQ suchthat PQ is the hypotenuse.
PT ¼ 6 units, TQ ¼ 8 units.Let the length of PQ be d, so by Pythagoras’theorem:
d 2 ¼ 62 þ 82
¼ 100
d ¼ffiffiffiffiffiffiffiffi
100p
¼ 10
The distance between the points P and Q is10 units.
1 2 3 4 5−1−2−3−4−5
1
0
2
3
4
56
−1−2
−3
−4
P T
Q
d
y
x
6
8
b By plotting A and B and constructing nABC,we have:
AB 2 ¼ 72 þ 42
¼ 65
AB ¼ffiffiffiffiffi
65p
¼ 8:0622 . . .
� 8:06 units
We can write the distance AB in surd form,ffiffiffiffiffi
65p
units as an exact answer, or we canapproximate (round) it as a decimal,8.06 units.
21 3 54
2
1
0
3
5
4
6y
x
A
B
7
4
−2−4−5 −3 −1
−2
−4−3
−1
Worksheet
Length of an interval
MAT09NAWK10123
Puzzle sheet
Length of a linesegment
MAT09NAPS00047
Skillsheet
The number plane
MAT09NASS10032
Video tutorial
The length ofan interval
MAT09NAVT10018
9780170193085 407
NEW CENTURY MATHS ADVANCEDfor the A u s t r a l i a n C u r r i c u l um9
Example 2
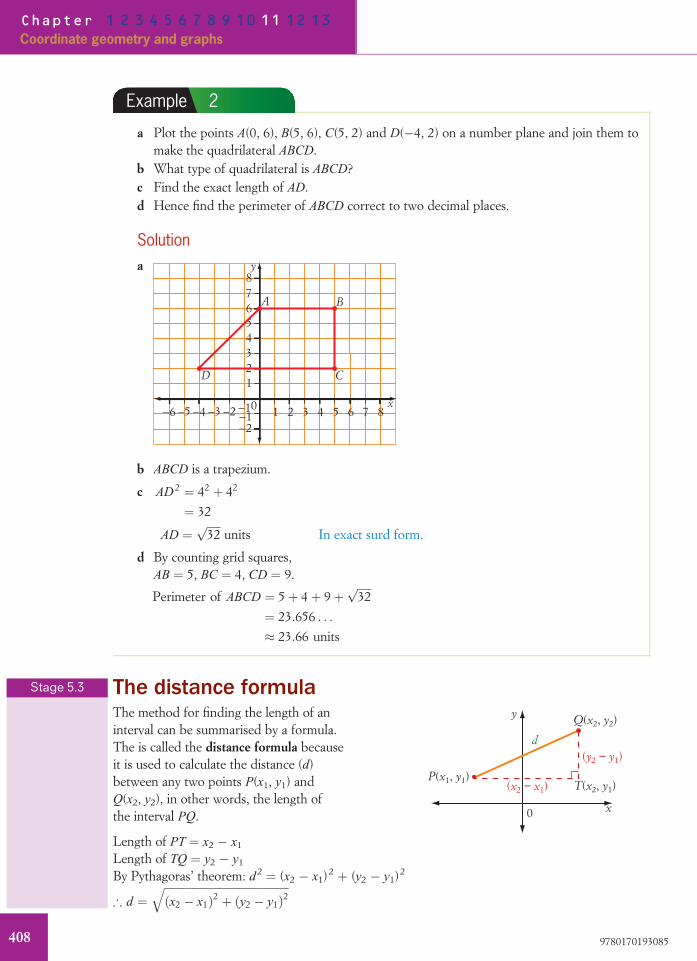
a Plot the points A(0, 6), B(5, 6), C(5, 2) and D(�4, 2) on a number plane and join them tomake the quadrilateral ABCD.
b What type of quadrilateral is ABCD?c Find the exact length of AD.d Hence find the perimeter of ABCD correct to two decimal places.
Solutiona
21 3 54 6 7 8
21
0
43
5678
−4−6 −2−3−5 −1−1−2
y
x
D C
BA
b ABCD is a trapezium.
c AD 2 ¼ 42 þ 42
¼ 32
AD ¼ffiffiffiffiffi
32p
units In exact surd form.
d By counting grid squares,AB ¼ 5, BC ¼ 4, CD ¼ 9.
Perimeter of ABCD ¼ 5þ 4þ 9þffiffiffiffiffi
32p
¼ 23:656 . . .
� 23:66 units
The distance formulaThe method for finding the length of aninterval can be summarised by a formula.The is called the distance formula becauseit is used to calculate the distance (d)between any two points P(x1, y1) andQ(x2, y2), in other words, the length ofthe interval PQ. 0
y
d
x
P(x1, y1)
Q(x2, y2)
T(x2, y1)
(y2 − y1)
(x2 − x1)
Length of PT ¼ x2 � x1
Length of TQ ¼ y2 � y1
By Pythagoras’ theorem: d2 ¼ (x2 � x1)2 þ (y2 � y1)2
) d ¼ffiffiffiffiffiffiffiffiffiffiffiffiffiffiffiffiffiffiffiffiffiffiffiffiffiffiffiffiffiffiffiffiffiffiffiffiffiffiffiffiffiffiffiffiffi
ðx2 � x1Þ2 þ ðy2 � y1Þ2q
Stage 5.3
9780170193085408
Chapter 1 2 3 4 5 6 7 8 9 10 11 12 13
Coordinate geometry and graphs
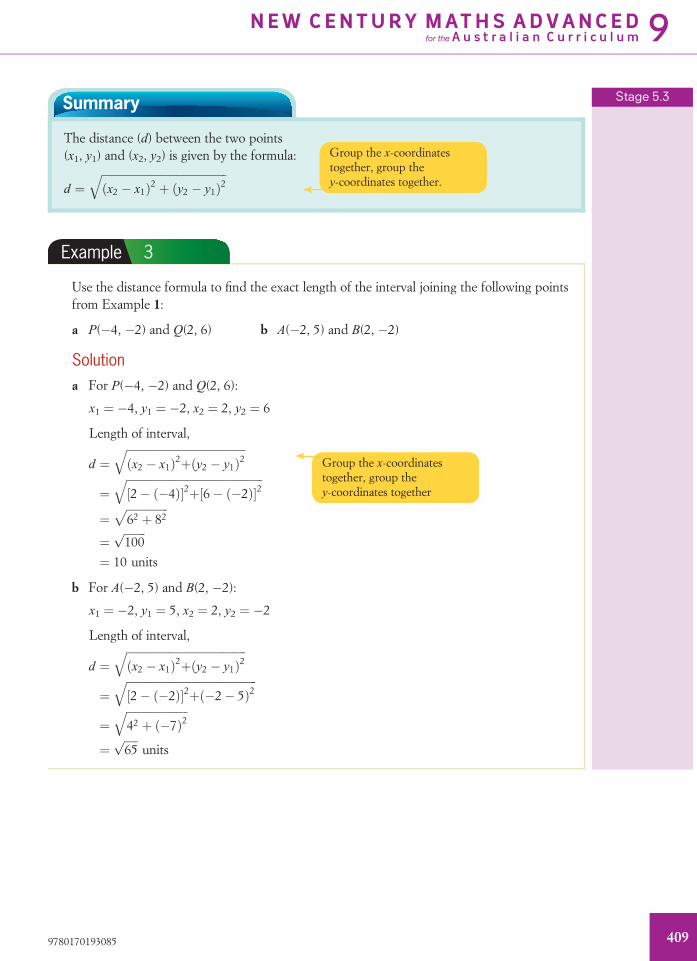
Summary
The distance (d) between the two points(x1, y1) and (x2, y2) is given by the formula:
d ¼ffiffiffiffiffiffiffiffiffiffiffiffiffiffiffiffiffiffiffiffiffiffiffiffiffiffiffiffiffiffiffiffiffiffiffiffiffiffiffiffiffiffiffiffiffi
ðx2 � x1Þ2 þ ðy2 � y1Þ2q
Example 3
Use the distance formula to find the exact length of the interval joining the following pointsfrom Example 1:
a P(�4, �2) and Q(2, 6) b A(�2, 5) and B(2, �2)
Solutiona For P(�4, �2) and Q(2, 6):
x1 ¼ �4, y1 ¼ �2, x2 ¼ 2, y2 ¼ 6
Length of interval,
d ¼ffiffiffiffiffiffiffiffiffiffiffiffiffiffiffiffiffiffiffiffiffiffiffiffiffiffiffiffiffiffiffiffiffiffiffiffiffiffiffiffiffiffiffi
x2 � x1ð Þ2þ y2 � y1ð Þ2q
¼ffiffiffiffiffiffiffiffiffiffiffiffiffiffiffiffiffiffiffiffiffiffiffiffiffiffiffiffiffiffiffiffiffiffiffiffiffiffiffiffiffiffiffiffiffiffiffiffiffi
2� �4ð Þ½ �2þ 6� �2ð Þ½ �2q
¼ffiffiffiffiffiffiffiffiffiffiffiffiffiffiffi
62 þ 82p
¼ffiffiffiffiffiffiffiffi
100p
¼ 10 units
b For A(�2, 5) and B(2, �2):
x1 ¼ �2, y1 ¼ 5, x2 ¼ 2, y2 ¼ �2
Length of interval,
d ¼ffiffiffiffiffiffiffiffiffiffiffiffiffiffiffiffiffiffiffiffiffiffiffiffiffiffiffiffiffiffiffiffiffiffiffiffiffiffiffiffiffiffiffi
x2 � x1ð Þ2þ y2 � y1ð Þ2q
¼ffiffiffiffiffiffiffiffiffiffiffiffiffiffiffiffiffiffiffiffiffiffiffiffiffiffiffiffiffiffiffiffiffiffiffiffiffiffiffiffiffiffiffiffiffiffiffi
2� �2ð Þ½ �2þ �2� 5ð Þ2q
¼ffiffiffiffiffiffiffiffiffiffiffiffiffiffiffiffiffiffiffiffiffiffi
42 þ �7ð Þ2q
¼ffiffiffiffiffi
65p
units
Stage 5.3
Group the x-coordinatestogether, group they-coordinates together.
Group the x-coordinatestogether, group they-coordinates together
9780170193085 409
NEW CENTURY MATHS ADVANCEDfor the A u s t r a l i a n C u r r i c u l um9

Stage 5.3
Exercise 11-01 The length of an interval1 Calculate the length of each interval shown on this number plane. Express your answers
correct to one decimal place, where necessary.
2 4 6 8 12
2
4
6
8
0
10
10–2–4–6–8–10
–2
–4
y
x
a
b
c
d
e
f
2 Plot each pair of points on a number plane and construct a right-angled triangle to find thedistance between the two points. Express your answer:
i as a surd ii correct to one decimal place
a A(7, 6) and B(1, 9) b P(0, �5) and Q(6, 4)c G(9, �2) and H(1, 6) d W(�5, �4) and X(�3, 4)
3 A triangle is formed by joining the points A(5, 2), B(�2, 3) and C(1, 7). Find correct to threedecimal places:
a the length AB b the length BC c the length AC d the perimeter of nABC
4 Use the distance formula to calculate the length of the interval joining each pair of points.Express your answer correct to one decimal place where necessary.
a (6, 3) and (8, 7) b (0, 10) and (10, 6) c (9, 2) and (1, �6)d (�1, �3) and (2, 1) e (6, 8) and (�10, �10) f (0, 0) and (5, 12)g (5, 2) and (�6, �1) h (3, �8) and (5, �10) i (6, 12) and (�8, 2)
5 What is the exact distance between the points Y(6, �3) and Z(�2, 4)? Select A, B, C or D.
Affiffiffiffiffiffiffiffi
113p
units Bffiffiffiffiffi
65p
units Cffiffiffiffiffi
57p
units Dffiffiffiffiffi
15p
units
6 The vertices of triangle RST are R(�1, �1), S(1, 3) and T(3, 1).
a Find the exact length of each side of the triangle.
b What type of triangle is nABC?7 A quadrilateral is formed by joining the points M(�3, 5), N(5, 5), P(8, 1) and T(�3, 1).
a What type of quadrilateral is MNPT?
b Find the perimeter of MNPT.
c Find the area of MNPT.
See Example 1
See Example 2
See Example 3
Worked solutions
The length ofan interval
MAT09NAWS10047
9780170193085410
Chapter 1 2 3 4 5 6 7 8 9 10 11 12 13
Coordinate geometry and graphs

8 The vertices of a quadrilateral are H(1, 6), I(7, 2), J(3, �4) and K(�3, 0).
a What type of quadrilateral is HIJK?
b Find the exact length of each side of the quadrilateral.
c Find its perimeter correct to one decimal place.
d Calculate its area.
Technology The length of an intervalIn this activity you will use GeoGebra to apply Pythagoras’ theorem to find the length of aninterval.
1 a Right-click in the Graphics window and make sure Axes and Grid are enabled. Bypressing ctrl and holding your mouse down anywhere on the grid (except on the axes),you can move the axes. Do this until they approximately show x-values: 0 to 14 andy-values: 0 to 8.
2 Select Options, Point Capturing and Fixed to Grid. This will ensure that you selectcoordinates with whole numbers only.
3 Click New Point and plot the points A(2, 1), B(6, 4) and C(6, 1) on the grid.
Use to join AB, BC and AC.
4 Select to find the lengths of AC and BC.
5 Calculate ACð Þ2þ BCð Þ2 andffiffiffiffiffiffiffiffiffiffiffiffiffiffiffiffiffiffiffiffiffiffiffiffiffiffiffiffi
ACð Þ2þ BCð Þ2q
.
6 Now select Distance or Length to find the length of AB.
7 Compare answer 6 with answer 5. What do you notice?
9780170193085 411
NEW CENTURY MATHS ADVANCEDfor the A u s t r a l i a n C u r r i c u l um9
8 Now move the axes until they are centred in the middle of the screen.[Approx.: x: �10 to 10 and y: �10 to 10]
9 Plot each pair of points and calculate the distance between them by repeating all steps above.
a X(�4, 2) and Y(4, �4) b P(�7, 5) and Q(�2, �7)
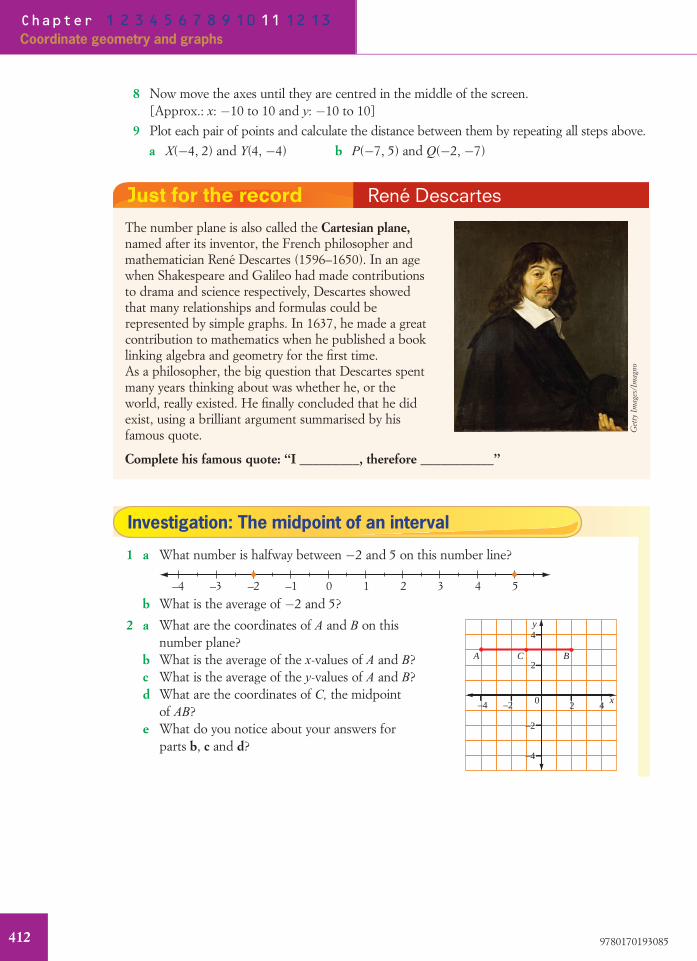
Just for the record Rene Descartes
The number plane is also called the Cartesian plane,named after its inventor, the French philosopher andmathematician Rene Descartes (1596–1650). In an agewhen Shakespeare and Galileo had made contributionsto drama and science respectively, Descartes showedthat many relationships and formulas could berepresented by simple graphs. In 1637, he made a greatcontribution to mathematics when he published a booklinking algebra and geometry for the first time.As a philosopher, the big question that Descartes spentmany years thinking about was whether he, or theworld, really existed. He finally concluded that he didexist, using a brilliant argument summarised by hisfamous quote.
Complete his famous quote: ‘‘I _________, therefore ___________’’
Investigation: The midpoint of an interval
1 a What number is halfway between �2 and 5 on this number line?
–4 –3 –2 –1 0 1 2 3 4 5
b What is the average of �2 and 5?
2 a What are the coordinates of A and B on thisnumber plane?
b What is the average of the x-values of A and B?c What is the average of the y-values of A and B?d What are the coordinates of C, the midpoint
of AB?e What do you notice about your answers for
parts b, c and d?
2 4
2
4
0–2–4
–2
–4
y
x
A C B
Get
tyIm
ages
/Im
agno
9780170193085412
Chapter 1 2 3 4 5 6 7 8 9 10 11 12 13
Coordinate geometry and graphs
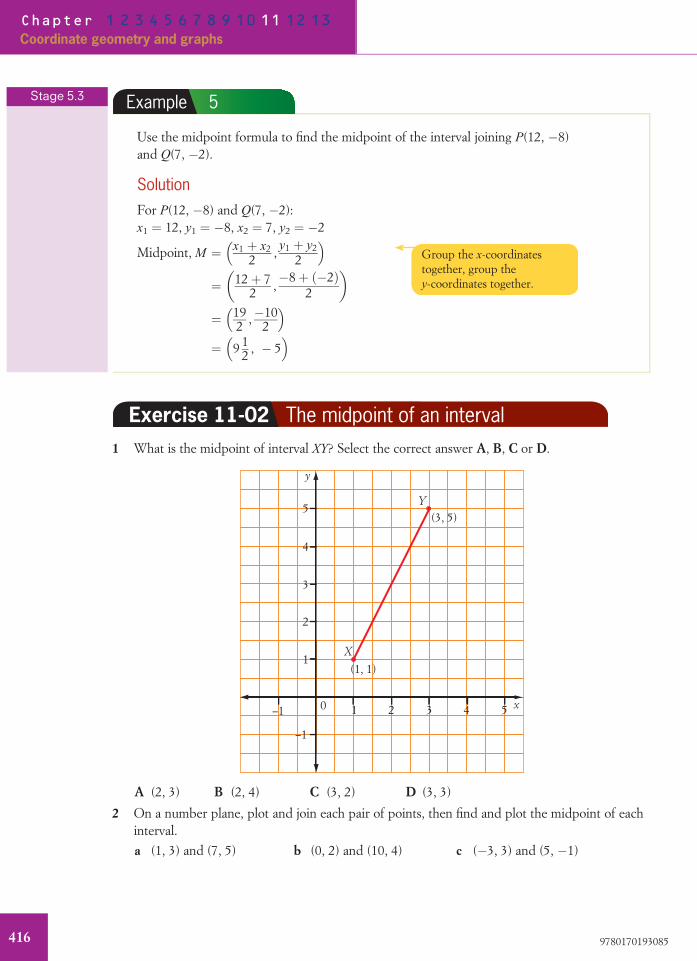
Technology The midpoint of an interval1 In GeoGebra, by pressing ctrl and holding your mouse down anywhere on the grid (except
on the axes), you can move the axes. Do this until the axes show approximately x-values:0 to 14 and y-values: 0 to 8.
2 Select New Point and plot the points A(1, 2), B(5, 6) and C(5, 2) on the grid.
3 Use Interval between Two Points to join AB, BC and AC.
4 What is the average x value on AC?
5 What is the average y value on BC?
6 Label the midpoint of AB, M (as shown below). What are its coordinates?
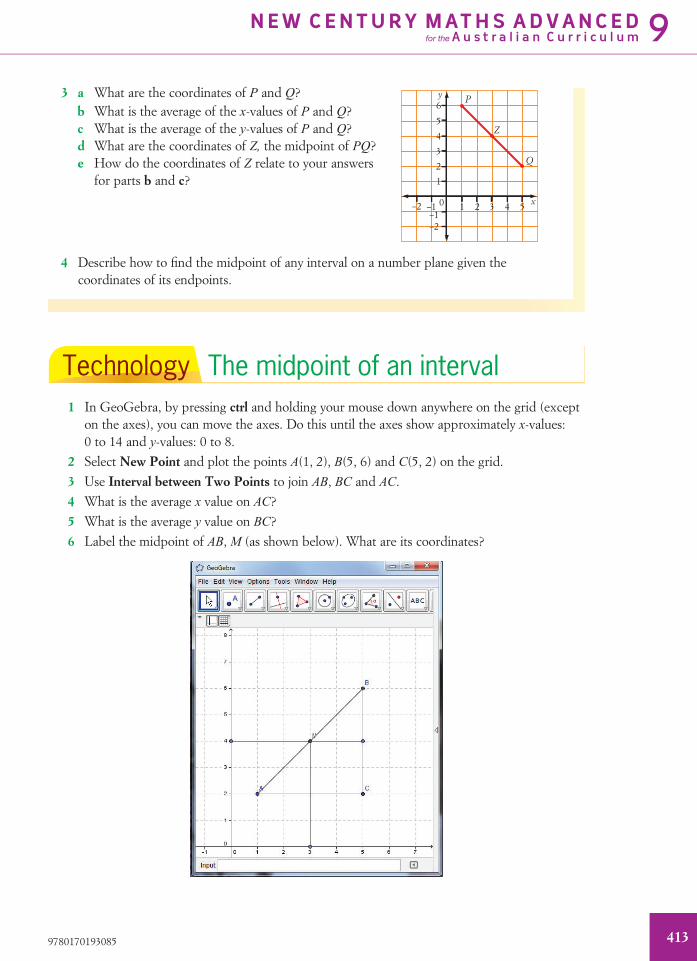
3 a What are the coordinates of P and Q?b What is the average of the x-values of P and Q?c What is the average of the y-values of P and Q?d What are the coordinates of Z, the midpoint of PQ?e How do the coordinates of Z relate to your answers
for parts b and c?
1 2 3 4 5–1
1
2
3
4
5
6
–1–2
0–2
y
x
Q
P
Z
4 Describe how to find the midpoint of any interval on a number plane given thecoordinates of its endpoints.
9780170193085 413
NEW CENTURY MATHS ADVANCEDfor the A u s t r a l i a n C u r r i c u l um9

7 Redraw interval AB. Select . Label the midpoint M. Does it have the
same coordinates as you found in step 6?
11-02 The midpoint of an intervalThe midpoint of an interval is the point in the middle of an interval or halfway between two givenpoints.
Summary
To find the midpoint of an interval joining two pointsA and B:
• calculate the average of the x-coordinates of A and B
• calculate the average of the y-coordinates of A and B
These two values give the coordinates of the midpoint.
y
A
M
B
O x
The midpoint Mof interval AB
Technology
GeoGebra: Slope,distance and midpoint
MAT09NATC00008
Technology worksheet
Excel worksheet:Finding midpoints
MAT09NACT00027
Technology worksheet
Excel spreadsheet:Finding midpoints
MAT09NACT00012
9780170193085414
Chapter 1 2 3 4 5 6 7 8 9 10 11 12 13
Coordinate geometry and graphs

Example 4
Find the midpoint of the interval joining:
a A(5, �2) and B(1, 6) b P(�2, 7) and Q(4, 0)
Solutiona The x-coordinates are 5 and 1. The average of
5 and 1 ¼ 5þ 12 ¼ 3
The y-coordinates are �2 and 6. The average
of �2 and 6 ¼ �2þ 62 ¼ 2
[ The midpoint is the point (3, 2).The diagram shows that this is true.
2 4–2–4
2
4
6
–2
0 x
y
A
B
M
b The x-coordinates are �2 and 4. The average
of �2 and 4 ¼ �2þ 42 ¼ 1
The y-coordinates are 7 and 0. The average of
7 and 0 ¼ 7þ 02 ¼ 3 1
2[ The midpoint is the point 1; 3 1
2
� �
.
The midpoint formulaThe method for finding the midpoint of an interval can be summarised by a formula.
Summary
The midpoint, M, of the interval joining twopoints (x1, y1) and (x2, y2) has coordinates:
Mðx, yÞ ¼ x1 þ x22 ,
y1 þ y22
� �
0
y
x
M(x, y)
(x1, y1)
(x2, y2)
Stage 5.3
9780170193085 415
NEW CENTURY MATHS ADVANCEDfor the A u s t r a l i a n C u r r i c u l um9
Example 5
Use the midpoint formula to find the midpoint of the interval joining P(12, �8)and Q(7, �2).
SolutionFor P(12, �8) and Q(7, �2):x1 ¼ 12, y1 ¼ �8, x2 ¼ 7, y2 ¼ �2
Midpoint, M ¼ x1 þ x22 ,
y1 þ y22
� �
¼ 12þ 72 ,
�8þ �2ð Þ2
� �
¼ 192 ,�10
2
� �
¼ 9 12 , � 5
� �
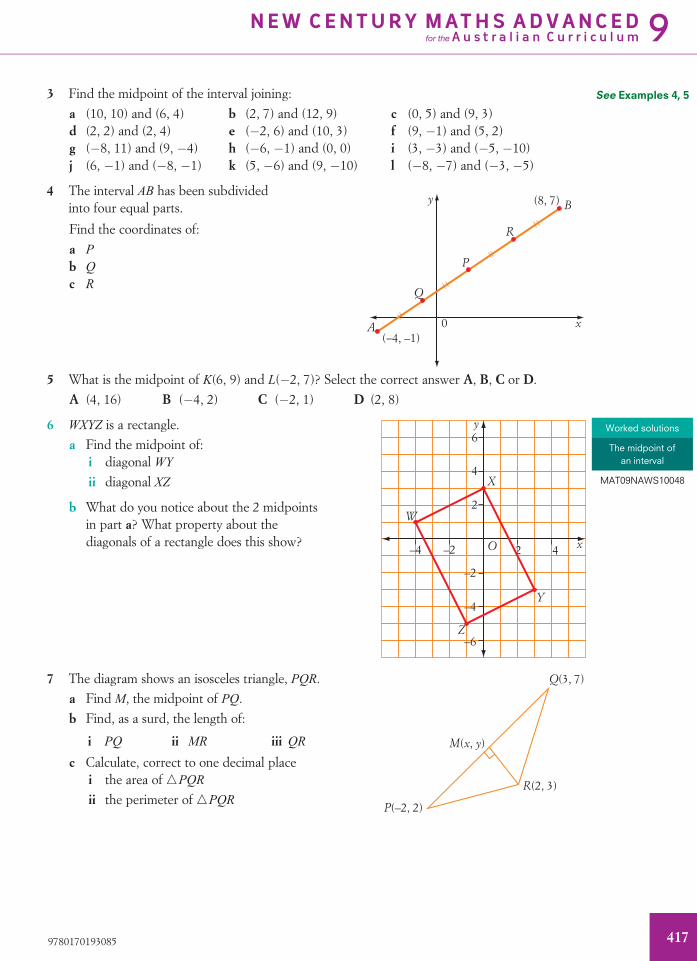
Exercise 11-02 The midpoint of an interval1 What is the midpoint of interval XY? Select the correct answer A, B, C or D.
1 2 3 4 5–1
1
2
3
4
–1
0
5
x
y
X
Y
(1, 1)
(3, 5)
A (2, 3) B (2, 4) C (3, 2) D (3, 3)
2 On a number plane, plot and join each pair of points, then find and plot the midpoint of eachinterval.
a (1, 3) and (7, 5) b (0, 2) and (10, 4) c (�3, 3) and (5, �1)
Stage 5.3
Group the x-coordinatestogether, group they-coordinates together.
9780170193085416
Chapter 1 2 3 4 5 6 7 8 9 10 11 12 13
Coordinate geometry and graphs
3 Find the midpoint of the interval joining:
a (10, 10) and (6, 4) b (2, 7) and (12, 9) c (0, 5) and (9, 3)d (2, 2) and (2, 4) e (�2, 6) and (10, 3) f (9, �1) and (5, 2)g (�8, 11) and (9, �4) h (�6, �1) and (0, 0) i (3, �3) and (�5, �10)j (6, �1) and (�8, �1) k (5, �6) and (9, �10) l (�8, �7) and (�3, �5)
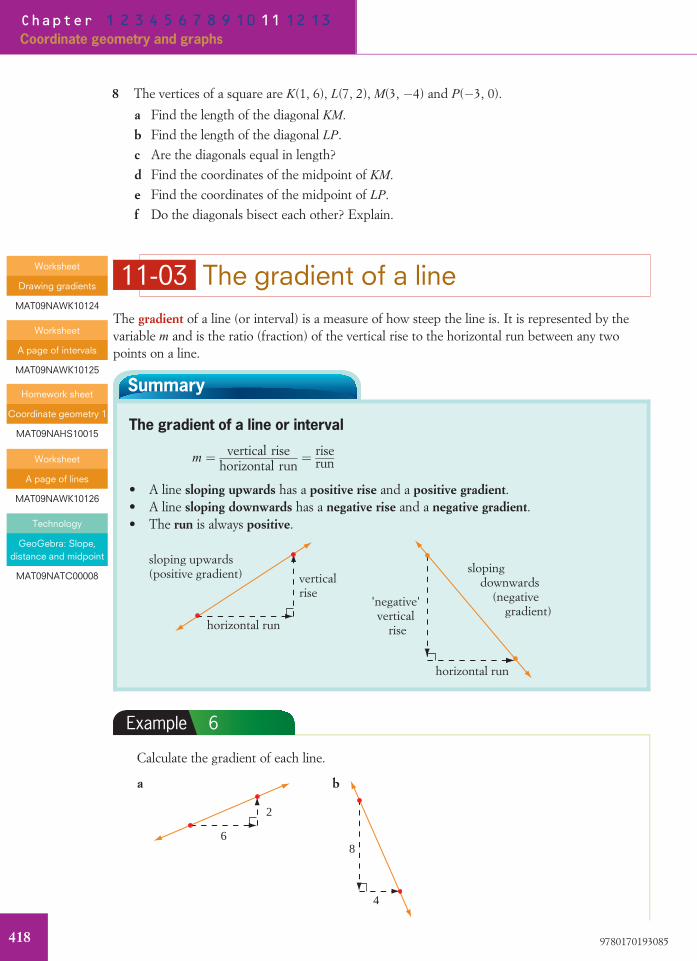
4 The interval AB has been subdividedinto four equal parts.
y
x0A
Q
P
R
B
(–4, –1)
(8, 7)
Find the coordinates of:
a P
b Q
c R
5 What is the midpoint of K(6, 9) and L(�2, 7)? Select the correct answer A, B, C or D.
A (4, 16) B (�4, 2) C (�2, 1) D (2, 8)
6 WXYZ is a rectangle.
2 4
2
4
6
O–2
–2
–4
–4
–6
y
x
X
W
Y
Z
a Find the midpoint of:i diagonal WY
ii diagonal XZ
b What do you notice about the 2 midpointsin part a? What property about thediagonals of a rectangle does this show?
7 The diagram shows an isosceles triangle, PQR.
P(–2, 2)
R(2, 3)
Q(3, 7)
M(x, y)
a Find M, the midpoint of PQ.
b Find, as a surd, the length of:
i PQ ii MR iii QR
c Calculate, correct to one decimal placei the area of nPQR
ii the perimeter of nPQR
See Examples 4, 5
Worked solutions
The midpoint ofan interval
MAT09NAWS10048
9780170193085
NEW CENTURY MATHS ADVANCEDfor the A u s t r a l i a n C u r r i c u l um9
417
8 The vertices of a square are K(1, 6), L(7, 2), M(3, �4) and P(�3, 0).
a Find the length of the diagonal KM.
b Find the length of the diagonal LP.
c Are the diagonals equal in length?
d Find the coordinates of the midpoint of KM.
e Find the coordinates of the midpoint of LP.
f Do the diagonals bisect each other? Explain.
11-03 The gradient of a lineThe gradient of a line (or interval) is a measure of how steep the line is. It is represented by thevariable m and is the ratio (fraction) of the vertical rise to the horizontal run between any twopoints on a line.
Summary
The gradient of a line or interval
m ¼ vertical risehorizontal run
¼ riserun
• A line sloping upwards has a positive rise and a positive gradient.• A line sloping downwards has a negative rise and a negative gradient.• The run is always positive.
horizontal run
'negative'vertical
rise
sloping downwards (negative gradient)
horizontal run
verticalrise
sloping upwards(positive gradient)
Example 6
Calculate the gradient of each line.
a
6
2
b
4
8
Worksheet
Drawing gradients
MAT09NAWK10124
Worksheet
A page of intervals
MAT09NAWK10125
Homework sheet
Coordinate geometry 1
MAT09NAHS10015
Worksheet
A page of lines
MAT09NAWK10126
Technology
GeoGebra: Slope,distance and midpoint
MAT09NATC00008
9780170193085
Chapter 1 2 3 4 5 6 7 8 9 10 11 12 13
Coordinate geometry and graphs
418
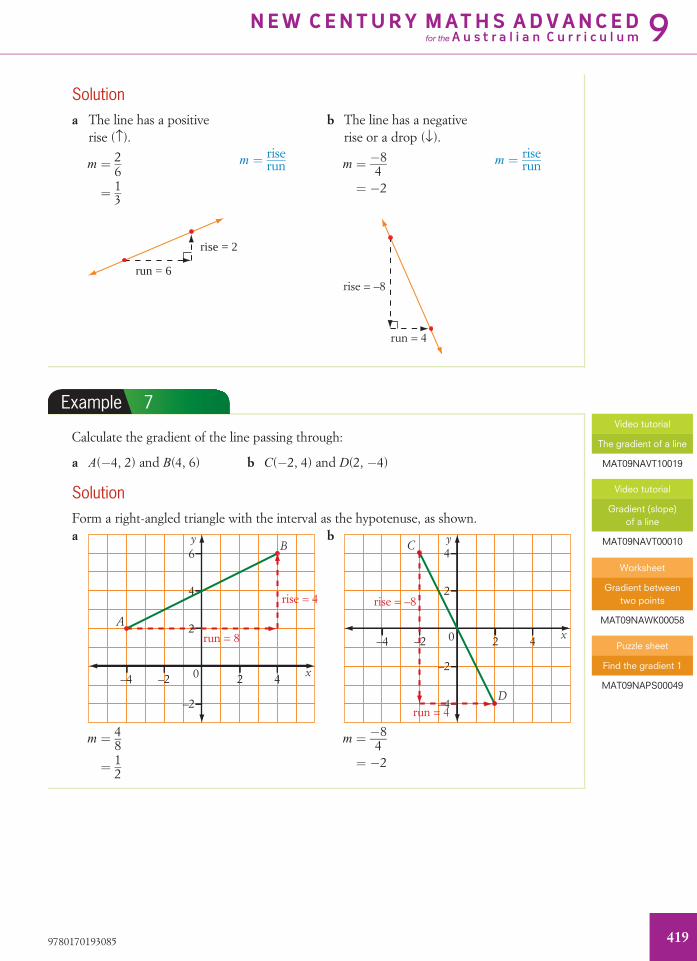
Solutiona The line has a positive
rise (›).b The line has a negative
rise or a drop (fl).
m ¼ 26
¼ 13
m ¼ riserun m ¼ �8
4¼ �2
m ¼ riserun
run = 6
rise = 2
run = 4
rise = –8
Example 7
Calculate the gradient of the line passing through:
a A(�4, 2) and B(4, 6) b C(�2, 4) and D(2, �4)
SolutionForm a right-angled triangle with the interval as the hypotenuse, as shown.a
2 4–2
–2
–4
4
6y
x
A
B
run = 8
rise = 4
2
0
b
–2
–2
–4
–4
2 4
2
0
4y
x
C
D
rise = –8
run = 4
m ¼ 48
¼ 12
m ¼ �84
¼ �2
Video tutorial
The gradient of a line
MAT09NAVT10019
Video tutorial
Gradient (slope)of a line
MAT09NAVT00010
Worksheet
Gradient betweentwo points
MAT09NAWK00058
Puzzle sheet
Find the gradient 1
MAT09NAPS00049
9780170193085
NEW CENTURY MATHS ADVANCEDfor the A u s t r a l i a n C u r r i c u l um9
419

The size and sign of the gradientThe size of the gradient shows how quickly the lineis going up or down: the higher the number, thesteeper the line. The sign of the gradient showswhether the line is sloping upwards (positive) ordownwards (negative) as you look from left toright.A horizontal (flat) line has zero gradient.
y
x0
zerogradient
The gradient formulaThe method for finding the gradient of an intervalcan be summarised by a formula.Consider the line passing through the points(x1, y1) and (x2, y2). (y2 − y1)
(x2 − x1)
0
y
x
P(x1, y1)
Q(x2, y2)
T(x2, y1)Vertical rise ¼ difference in y-coordinates ¼ y2 � y1
Horizontal run ¼ difference in x-coordinates ¼ x2 � x1
Gradient, m ¼ difference in ydifference in x
¼ y2 � y1x2 � x1
Summary
The gradient (m) of a line or interval joining two points (x1, y1) and (x2, y2) is given by theformula:
m ¼ y2 � y1x2 � x1
Example 8
Use the gradient formula to calculate the gradient of the line going through A(�4, 2) andB(4, 6) (from Example 7a).
SolutionFor A(�4, 2) and B(4, 6):
x1 ¼ �4, y1 ¼ 2, x2 ¼ 4, y2 ¼ 6
m ¼ y2 � y1x2 � x1
¼ 6� 24� �4ð Þ
¼ 48
¼ 12
Stage 5.3
Group the y-coordinatestogether on top, group thex-coordinates together below.
9780170193085
Chapter 1 2 3 4 5 6 7 8 9 10 11 12 13
Coordinate geometry and graphs
420

Exercise 11-03 The gradient of a line1 State whether the gradient of each line is positive (þ) or negative (�).
3
4
106 1
2
a b c
2 Calculate the gradient of each line in question 1.
3 Calculate the gradient of each interval.
2 4 6 8–2
–2
–4
–4
–6–8
2
4
6
0
y
x
a
b
g
c
d
e
f
4 Which pair of points form an interval that has a gradient of 2? Select the correct answerA, B, C or D.
A (0, 2) (2, 0) B (�5, 2), (5, 7) C (�2, �2), (1, 4) D (�6, �8), (�2, �6)
5 Calculate the gradient of the interval joining each pair of points, either by plotting the pointson a number plane or by using the gradient formula.
a A(1, 4) and B(3, 6) b Z(4, 7) and T(1, 6) c M(4, �2) and D(3, 3)d A(�2, �1) and P(4, �4) e D(0, �1) and F(3, �1) f H(9, �2) and L(�1, 3)g K(4, 9) and M(�4, �5) h Z(�8, �6) and T(4, 0) i F(0, 4) and B(3, 4)
6 Which pair of points form an interval that has a gradient of �1? Select A, B, C or D.
A (1, 2), (2, 1) B (�5, 6), (6, 7) C (2, 2), (3, �1) D (�5, �10), (4, �11)
See Example 6
See Example 7
See Example 8
9780170193085
NEW CENTURY MATHS ADVANCEDfor the A u s t r a l i a n C u r r i c u l um9
421

7 Find the gradient of the lines labelled k and l.
4 6 8–2
–2
–4–6
2
0
4
6
x
k
l
2
y
8 Which pair of points lies on a line with a gradient of 0? Select A, B, C or D.
A (3, 3) (�3, �3) B (�5, 7), (5, 7) C (1, �6), (1, 4) D (0, 9), (9, 0)
9 PQRS is a quadrilateral.a Find the gradient of each side of PQRS.
b Which sides have the same gradient?What does that mean about those sides?
c What type of quadrilateral is PQRS?
1 2 3 4 5–1–2–3–4–1–2
–3
–4
–5
1
0
2
3
4
–5
5
R
y
x
P
Q
S
10 A triangle is formed by joining P(�8, �2), Q(�2, 10) and R(4, 6). T is the midpoint of PQ,and Z is the midpoint of QR.a Draw a diagram showing all given information.
b Find the coordinates of T and Z.
c Calculate the gradient of the interval TZ and the side PR. What do you notice?
d Calculate the length of the interval TZ and the side PR. What do you notice?
Worked solutions
The gradient of a line
MAT09NAWS10049
9780170193085
Chapter 1 2 3 4 5 6 7 8 9 10 11 12 13
Coordinate geometry and graphs
422
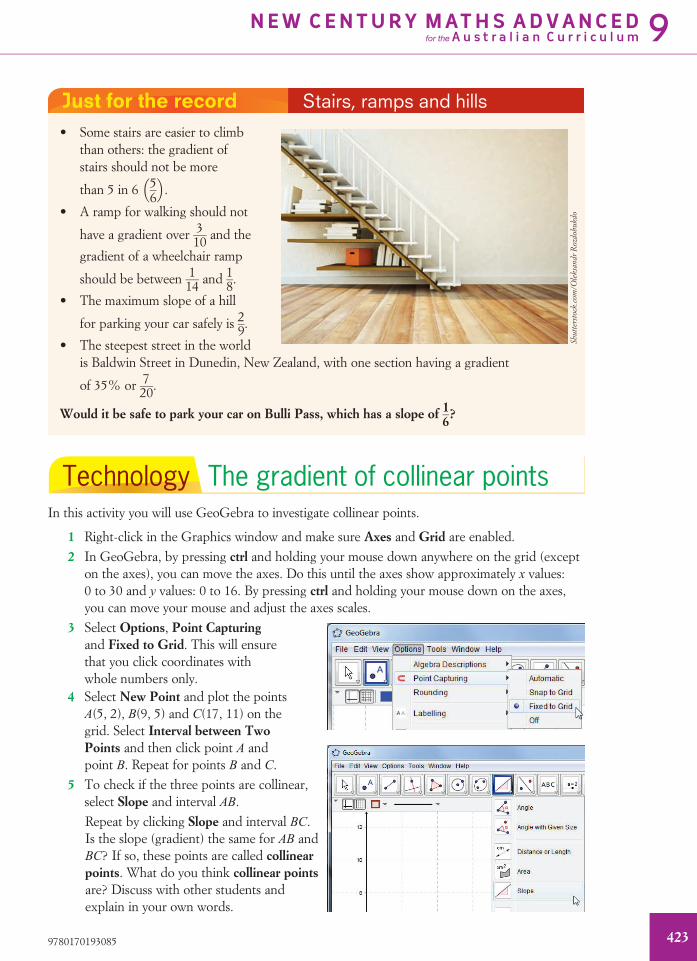
Just for the record Stairs, ramps and hills
• Some stairs are easier to climbthan others: the gradient ofstairs should not be more
than 5 in 6 56
� �
.
• A ramp for walking should not
have a gradient over 310 and the
gradient of a wheelchair ramp
should be between 114 and 1
8.
• The maximum slope of a hill
for parking your car safely is 29.
• The steepest street in the worldis Baldwin Street in Dunedin, New Zealand, with one section having a gradient
of 35% or 720.
Would it be safe to park your car on Bulli Pass, which has a slope of 16?
Technology The gradient of collinear pointsIn this activity you will use GeoGebra to investigate collinear points.
1 Right-click in the Graphics window and make sure Axes and Grid are enabled.
2 In GeoGebra, by pressing ctrl and holding your mouse down anywhere on the grid (excepton the axes), you can move the axes. Do this until the axes show approximately x values:0 to 30 and y values: 0 to 16. By pressing ctrl and holding your mouse down on the axes,you can move your mouse and adjust the axes scales.
3 Select Options, Point Capturingand Fixed to Grid. This will ensurethat you click coordinates withwhole numbers only.
4 Select New Point and plot the pointsA(5, 2), B(9, 5) and C(17, 11) on thegrid. Select Interval between TwoPoints and then click point A andpoint B. Repeat for points B and C.
5 To check if the three points are collinear,select Slope and interval AB.
Repeat by clicking Slope and interval BC.Is the slope (gradient) the same for AB andBC? If so, these points are called collinearpoints. What do you think collinear pointsare? Discuss with other students andexplain in your own words.
Shut
ters
tock
.com
/Ole
ksan
drR
ozdo
bukd
o
9780170193085
NEW CENTURY MATHS ADVANCEDfor the A u s t r a l i a n C u r r i c u l um9
423
6 Now test whether the following sets of points are collinear.a (0, 3), (2, 4) and (6, 6) b (8, 0), (�8, 0) and (�6, �10)c (1, 8), (2, 9) and (4, 10) d (�2, 8), (�1, 6) and (0, 1)e (2, 7), (4, 10), (5, 13) and (6, 17) f (�14, 11), (�8, 9), (1, 6) and (16, 1)
11-04 Graphing linear equationsA relationship between two variables such as x and y whose graph is a straight line is called alinear relationship. The expression of that relationship as an algebraic formula, such as y ¼ x þ 2,is called a linear equation.
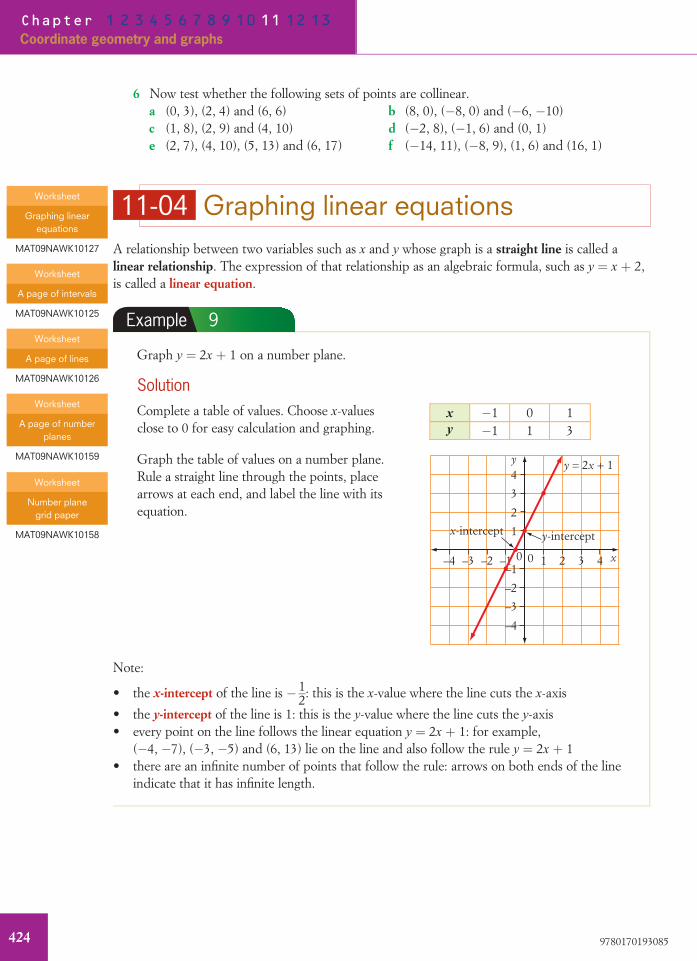
Example 9
Graph y ¼ 2x þ 1 on a number plane.
SolutionComplete a table of values. Choose x-valuesclose to 0 for easy calculation and graphing.
x �1 0 1y �1 1 3
Graph the table of values on a number plane.Rule a straight line through the points, placearrows at each end, and label the line with itsequation.
0
y
x
4
2
3
1
0 2 41 3–2–4 –1–3
–2
–1
–3
–4
y = 2x + 1
x-intercept y-intercept
Note:
• the x-intercept of the line is � 12: this is the x-value where the line cuts the x-axis
• the y-intercept of the line is 1: this is the y-value where the line cuts the y-axis• every point on the line follows the linear equation y ¼ 2x þ 1: for example,
(�4, �7), (�3, �5) and (6, 13) lie on the line and also follow the rule y ¼ 2x þ 1• there are an infinite number of points that follow the rule: arrows on both ends of the line
indicate that it has infinite length.
Worksheet
Graphing linearequations
MAT09NAWK10127
Worksheet
A page of intervals
MAT09NAWK10125
Worksheet
A page of lines
MAT09NAWK10126
Worksheet
A page of numberplanes
MAT09NAWK10159
Worksheet
Number planegrid paper
MAT09NAWK10158
9780170193085
Chapter 1 2 3 4 5 6 7 8 9 10 11 12 13
Coordinate geometry and graphs
424

Using x- and y-intercepts to graph linesWe can also graph a linear equation by finding its x- and y-intercepts first.Since any point on the x-axis has a y-coordinate of 0, we can substitute y ¼ 0 into the equationto find the x-intercept.Similarly, any point on the y-axis has an x-coordinate of 0, so we can substitute x ¼ 0 into theequation to find the y-intercept.
Summary
• To find the x-intercept, substitute y ¼ 0 and solve the equation.• To find the y-intercept, substitute x ¼ 0 and solve the equation.
Example 10
Find the x- and y-intercepts for y ¼ �4x þ 8 to draw its graph.
SolutionFor x-intercept, y ¼ 0:
0 ¼ �4xþ 8
4x ¼ 8
x ¼ 2
The x-intercept is 2.
For y-intercept, x ¼ 0:
y ¼ �4 3 0þ 8
y ¼ 8
The y-intercept is 8.
Plot both intercepts on the axes, draw a line through the two points and labelthe line with its equation.
y
x0−4−5−6 −3 −2 −1−1
1
2
3
4
5
6
7
8 (0, 8)
−2
−3
−4
1 2 3
(2, 0)
4 5 6
y = –4x + 8
Stage 5.3
9780170193085
NEW CENTURY MATHS ADVANCEDfor the A u s t r a l i a n C u r r i c u l um9
425
Testing if a point lies on a line
Summary
A point lies on a line if its (x, y) coordinates satisfy the equation of the line.
Example 11
Test whether each point lies on the line y ¼ 2x þ 3.
a (3, 9) b (8, �4)
Solution• Separate the equation into LHS (left-hand side) and RHS (right-hand side)• Substitute the coordinates of the point into both sides• If LHS ¼ RHS, the point satisfies the equation and lies on the line• If LHS 6¼ RHS, the point does not lie on the line.a Substitute x ¼ 3 and y ¼ 9 into y ¼ 2x þ 3.
LHS ¼ y
¼ 9
RHS ¼ 2xþ 3
¼ 2 3 3þ 3
¼ 9
LHS ¼ RHS so (3, 9) lies on the line.
b Substitute x ¼ 8 and y ¼ �4 into y ¼ 2x þ 3.
LHS ¼ y
¼ �4
RHS ¼ 2xþ 3
¼ 2 3 8þ 3
¼ 19
LHS 6¼ RHS so (8, �4) does not lie on the line.
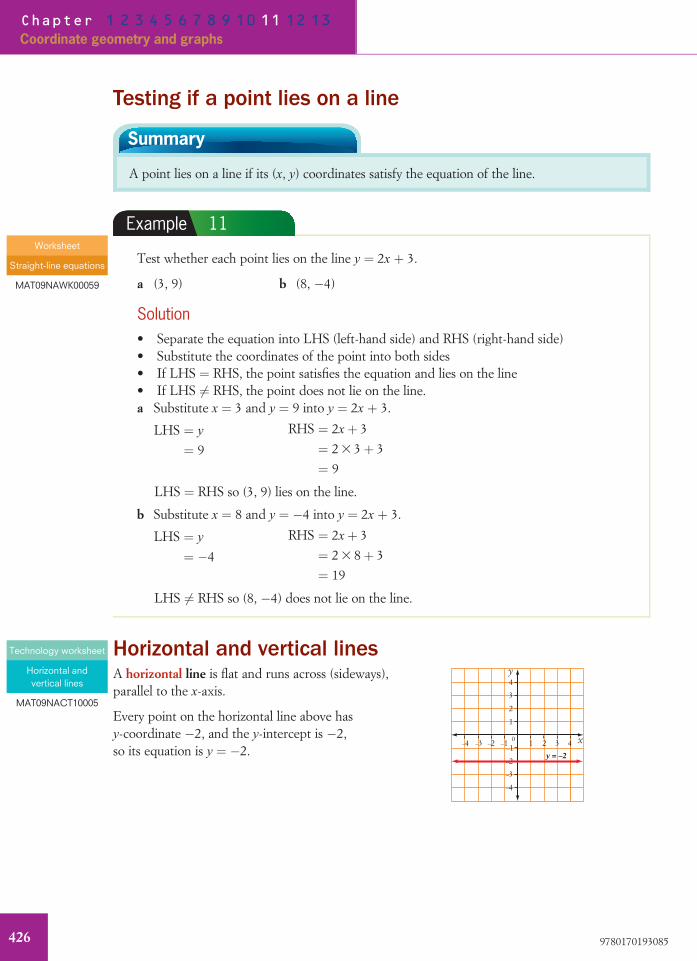
Horizontal and vertical linesA horizontal line is flat and runs across (sideways),parallel to the x-axis.
Every point on the horizontal line above hasy-coordinate �2, and the y-intercept is �2,so its equation is y ¼ �2.
x
2
3
4
1
2
y = –21 3 4–1–2–3–4
–2
–3
–4
–10
y
Worksheet
Straight-line equations
MAT09NAWK00059
Technology worksheet
Horizontal andvertical lines
MAT09NACT10005
9780170193085
Chapter 1 2 3 4 5 6 7 8 9 10 11 12 13
Coordinate geometry and graphs
426
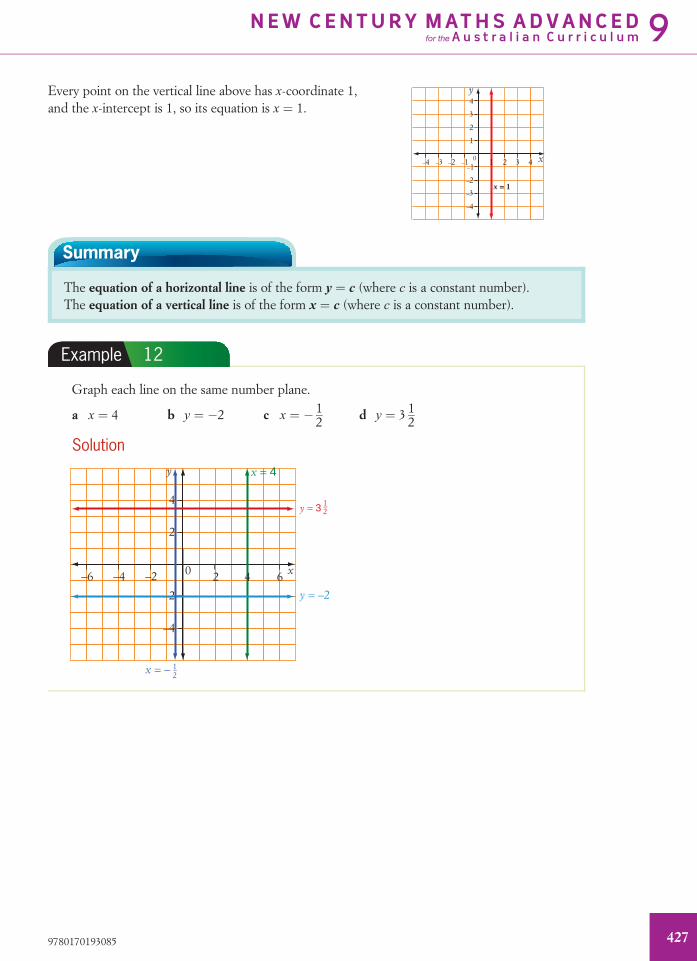
Every point on the vertical line above has x-coordinate 1,and the x-intercept is 1, so its equation is x ¼ 1.
x
2
3
4
1
2 3 4–1–2–3–4
–2
–3
–4
–10
y
1
x = 1
Summary
The equation of a horizontal line is of the form y ¼ c (where c is a constant number).The equation of a vertical line is of the form x ¼ c (where c is a constant number).
Example 12
Graph each line on the same number plane.
a x ¼ 4 b y ¼ �2 c x ¼ � 12 d y ¼ 3 1
2
Solution
–2–4–6
2
4
–2
–4
0
y
x
x = 4
y = 3 1_2
y = –2
x = – 1_2
2 4 6
9780170193085
NEW CENTURY MATHS ADVANCEDfor the A u s t r a l i a n C u r r i c u l um9
427

Example 13
Find the equations of lines A, B, C and D.
21 3 54 7 8 9 10 116–5 –4–6 –3 –2 –1
2
1
0
3
4
5
6
–5
–6
–4
–3
–2
–1
yB C
D
A
P(7, 1)
x
Solution• Line A is horizontal and has a y-intercept of �3, so its equation is y ¼ �3.• Line B is vertical and has an x-intercept of �4, so its equation is x ¼ �4.• Line C is vertical and goes through (7, 1), so its equation is x ¼ 7.• Line D is horizontal and goes through (7, 1), so its equation is y ¼ 1.
Exercise 11-04 Graphing linear equations1 Graph each linear equation on a number plane, and write:
i its x-intercept ii its y-intercept.
a y ¼ x � 3 b y ¼ 2x þ 2 c y ¼ �x þ 5d y ¼ 3x e y ¼ �x f y ¼ 10 � 4x
g y ¼ xþ 22 h y ¼ 2x þ 1 i y ¼ x
3� 2
2 What is the x-intercept of the graph of y ¼ 6 � 3x? Select the correct answer A, B, C or D.
A �3 B 2 C 3 D 6
3 Graph each linear equation after finding its x- and y-intercepts.
a y ¼ 3x � 6 b y ¼ 6� x2 c x þ y ¼ 7
d x � y ¼ 6 e y ¼ 2x3 þ 1 f 3x � 4y ¼ 12
g x þ y ¼ 4 h 2x � y ¼ 5 i x2þ
y3 ¼ 1
See Example 9
Stage 5.3
See Example 10
9780170193085
Chapter 1 2 3 4 5 6 7 8 9 10 11 12 13
Coordinate geometry and graphs
428

4 Test whether the point (3, �1) lies on each line.
a y ¼ 2x � 7 b y ¼ �2x þ 4 c x � y ¼ 4d x þ 2y ¼ 1 e y ¼ �3x þ 8 f x � 3y ¼ 0
5 a Show that the point (3, 2) lies on both the lines x � 2y ¼ �1 and x þ y ¼ 5.
b So at what point do the lines x � 2y ¼ �1 and x þ y ¼ 5 cross?
6 Show that the lines y ¼ �3x þ 6 and y ¼ �2x intersect at the point (6, �12).
7 Which of these points lies on the line x � y ¼ �2? Select the correct answer A, B, C or D.
A (1, 1) B (�1, �1) C (0, 2) D (�2, 4)
8 Graph each set of lines on a number plane.
a x ¼ 2, x ¼ �3 b y ¼ 6, y ¼ �2
c x ¼ 2 12 , x ¼ 0, y ¼ �5 d y ¼ 1:5, y ¼ 3, x ¼ �2
9 Write down the equation of each line shown below.
y
x
a
c
g
e
dfhb
0−4−5−6 −3 −2 −1−1
1
2
3
4
5
6
7
8
−2
−3
−4
−5
−6
−7
−8
1 2 3 4 5 6
10 Find the equation of each line described.a A horizontal line that passes through the y-axis at 6.
b A vertical line that goes through (�5, 2).
c Each point on the line is 2 units above the x-axis.
d Each point on the line is 5 units to the left of the y-axis.
e The line is parallel to the x-axis and passes through the point (0, �2).
f A horizontal line that goes through (4, �1).
g The line goes through the points (�1, 8) and (�1, 2).
11 What is the equation of:
a the y-axis? b the x-axis?
See Example 11
See Example 12
See Example 13
9780170193085
NEW CENTURY MATHS ADVANCEDfor the A u s t r a l i a n C u r r i c u l um9
429
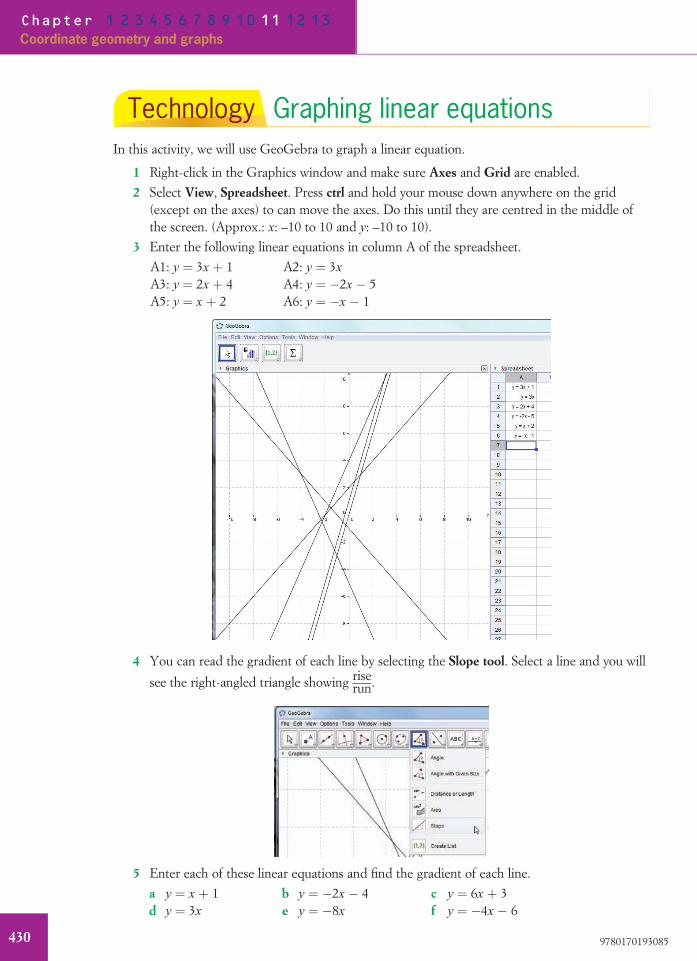
Technology Graphing linear equationsIn this activity, we will use GeoGebra to graph a linear equation.
1 Right-click in the Graphics window and make sure Axes and Grid are enabled.
2 Select View, Spreadsheet. Press ctrl and hold your mouse down anywhere on the grid(except on the axes) to can move the axes. Do this until they are centred in the middle ofthe screen. (Approx.: x: –10 to 10 and y: –10 to 10).
3 Enter the following linear equations in column A of the spreadsheet.
A1: y ¼ 3x þ 1 A2: y ¼ 3x
A3: y ¼ 2x þ 4 A4: y ¼ �2x � 5A5: y ¼ x þ 2 A6: y ¼ �x � 1
4 You can read the gradient of each line by selecting the Slope tool. Select a line and you will
see the right-angled triangle showing riserun.
5 Enter each of these linear equations and find the gradient of each line.
a y ¼ x þ 1 b y ¼ �2x � 4 c y ¼ 6x þ 3d y ¼ 3x e y ¼ �8x f y ¼ �4x � 6
9780170193085
Chapter 1 2 3 4 5 6 7 8 9 10 11 12 13
Coordinate geometry and graphs
430

Mental skills 11 Maths without calculators
Divisibility testsHow can you tell if a number is divisible by 2? Look at its last digit. If that digit is 2, 4, 6, 8or 0, then the number is divisible by 2 (that is, it is even).How can you tell if a number is divisible by 5? If its last digit is 0 or 5, then the number isdivisible by 5.These are examples of divisibility tests—rules for checking whether a number is divisible bya certain number. The table below shows some common divisibility tests.
A number is divisible by: if:2 its last digit is 2, 4, 6, 8 or 03 the sum of its digits is divisible by 34 its last two digits form a number divisible by 45 its last digit is 0 or 56 it is even and the sum of its digits is divisible by 39 the sum of its digits is divisible by 9
10 its last digit is 0
1 Study each example.
a Test whether 748 is divisible by 2, 3 or 4.• Last digit is 8 (even). [ 748 is divisible by 2.• Sum of digits ¼ 7 þ 4 þ 8 ¼ 19, which is not divisible by 3. [ 748 is not divisible
by 3.• 48 is divisible by 4. [ 748 is divisible by 4 (748 4 4 ¼ 187).
b Test whether 261 is divisible by 5 or 9.• Last digit is 1, not 0 or 5. [ 261 is not divisible by 5.• 2 þ 6 þ 1 ¼ 9, which is divisible by 9. [ 261 is divisible by 9 (261 4 9 ¼ 29).
c Test whether 570 is divisible by 4, 6 or 10.• 70 is not divisible by 4. [ 570 is not divisible by 4.• 570 is even and 5 þ 7 þ 0 ¼ 12, which is divisible by 3. [ 570 is divisible by 6
(570 4 6 ¼ 95).• Last digit is 0. [ 570 is divisible by 10 (570 4 10 ¼ 57).
2 Test whether each number is divisible by 2, 3, 5 or 6.
a 250 b 189 c 78 d 465e 1024 f 840 g 715 h 627
3 Test whether each number is divisible by 4, 9 or 10.
a 144 b 280 c 522 d 4170e 936 f 726 g 342 h 5580
9780170193085
NEW CENTURY MATHS ADVANCEDfor the A u s t r a l i a n C u r r i c u l um9
431

Investigation: Comparing gradients and y-intercepts
1 This number plane shows the graphs of four linear equations.
2 4–2
–2
–4
–4
4y
x
y = –2x + 3
y = –2x + 1
y = −2x − 4
y = –2x
2
0
a Copy and complete this table by finding the gradient and y-intercept of each line.
Equation Gradient y-intercepty ¼ �2x � 4 �2 �4y ¼ �2x
y ¼ �2x þ 1y ¼ �2x þ 3
b How are the four lines:i similar? ii different?
2 This number plane shows the graphs of another four linear equations.
2 4–2
–2
–4
2
4
0
y
x
y = x + 2
y = −2x + 2y = 3x + 2
y = x + 21–2–
a Copy and complete this table.
Equation Gradient y-intercepty ¼ 2x þ 2
y ¼ � 12 xþ 2
y ¼ x þ 2
y ¼ 3x þ 2
b How are the four lines:i similar? ii different?
9780170193085
Chapter 1 2 3 4 5 6 7 8 9 10 11 12 13
Coordinate geometry and graphs
432
11-05The gradient–intercept equationy ¼ mx þ b
Summary
The equation of a straight line is y ¼ mx þ b, where m is the gradient and b is they-intercept.For this reason, y ¼ mx þ b is also called the gradient–intercept form of a linear equation.
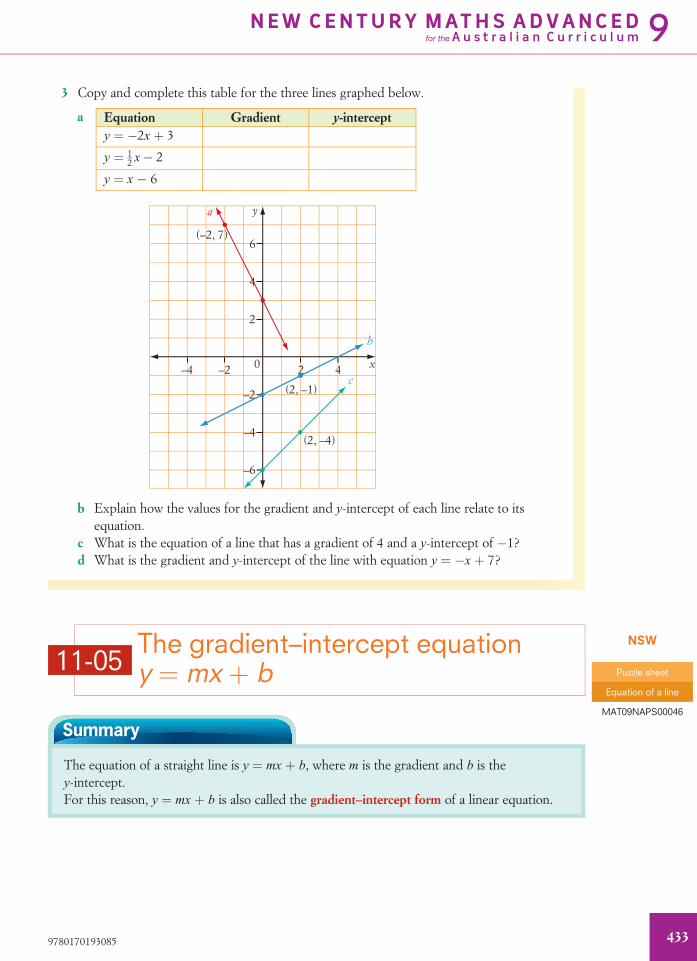
3 Copy and complete this table for the three lines graphed below.
a Equation Gradient y-intercepty ¼ �2x þ 3
y ¼ 12 x� 2
y ¼ x � 6
2 4–2
–2
–4
–4
–6
2
6
4
0
y
x
(–2, 7)
(2, –4)
(2, –1)
a
c
b
b Explain how the values for the gradient and y-intercept of each line relate to itsequation.
c What is the equation of a line that has a gradient of 4 and a y-intercept of �1?d What is the gradient and y-intercept of the line with equation y ¼ �x þ 7?
NSW
Puzzle sheet
Equation of a line
MAT09NAPS00046
9780170193085
NEW CENTURY MATHS ADVANCEDfor the A u s t r a l i a n C u r r i c u l um9
433
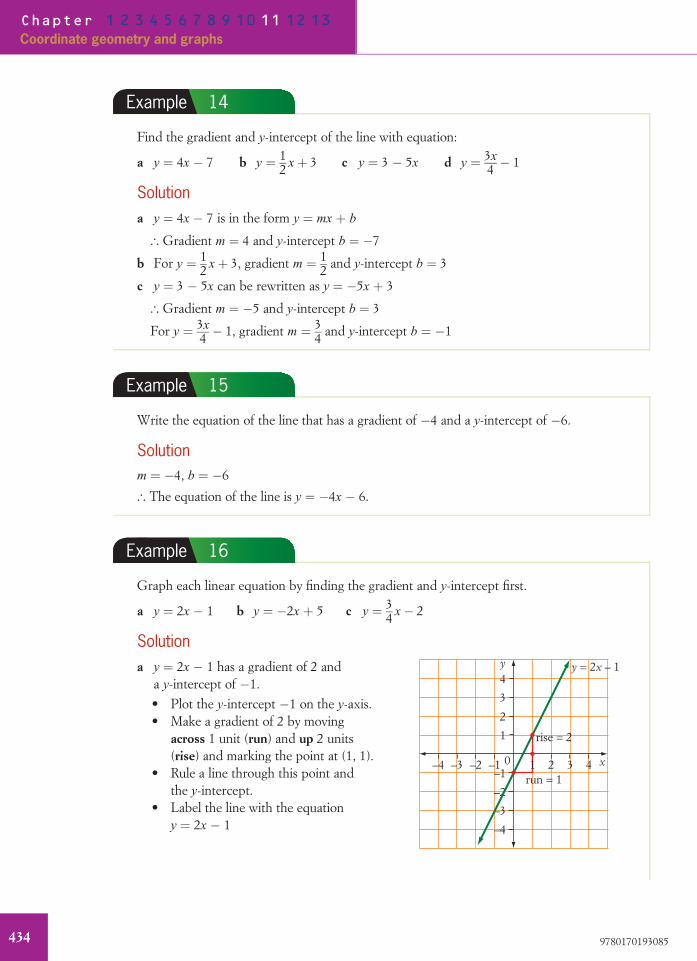
Example 14
Find the gradient and y-intercept of the line with equation:
a y ¼ 4x � 7 b y ¼ 12 xþ 3 c y ¼ 3 � 5x d y ¼ 3x
4 � 1
Solutiona y ¼ 4x � 7 is in the form y ¼ mx þ b
[ Gradient m ¼ 4 and y-intercept b ¼ �7
b For y ¼ 12 xþ 3, gradient m ¼ 1
2 and y-intercept b ¼ 3
c y ¼ 3 � 5x can be rewritten as y ¼ �5x þ 3
[ Gradient m ¼ �5 and y-intercept b ¼ 3
For y ¼ 3x4 � 1, gradient m ¼ 3
4 and y-intercept b ¼ �1
Example 15
Write the equation of the line that has a gradient of �4 and a y-intercept of �6.
Solutionm ¼ �4, b ¼ �6
[ The equation of the line is y ¼ �4x � 6.
Example 16
Graph each linear equation by finding the gradient and y-intercept first.
a y ¼ 2x � 1 b y ¼ �2x þ 5 c y ¼ 34 x� 2
Solutiona y ¼ 2x � 1 has a gradient of 2 and
a y-intercept of �1.
• Plot the y-intercept �1 on the y-axis.• Make a gradient of 2 by moving
across 1 unit (run) and up 2 units(rise) and marking the point at (1, 1).
• Rule a line through this point andthe y-intercept.
• Label the line with the equationy ¼ 2x � 1
0
y
x
4
2
3
1
2
rise = 2
run = 143–2–4 –1–3
–2
–1
–3
–4
y = 2x – 1
1
9780170193085
Chapter 1 2 3 4 5 6 7 8 9 10 11 12 13
Coordinate geometry and graphs
434
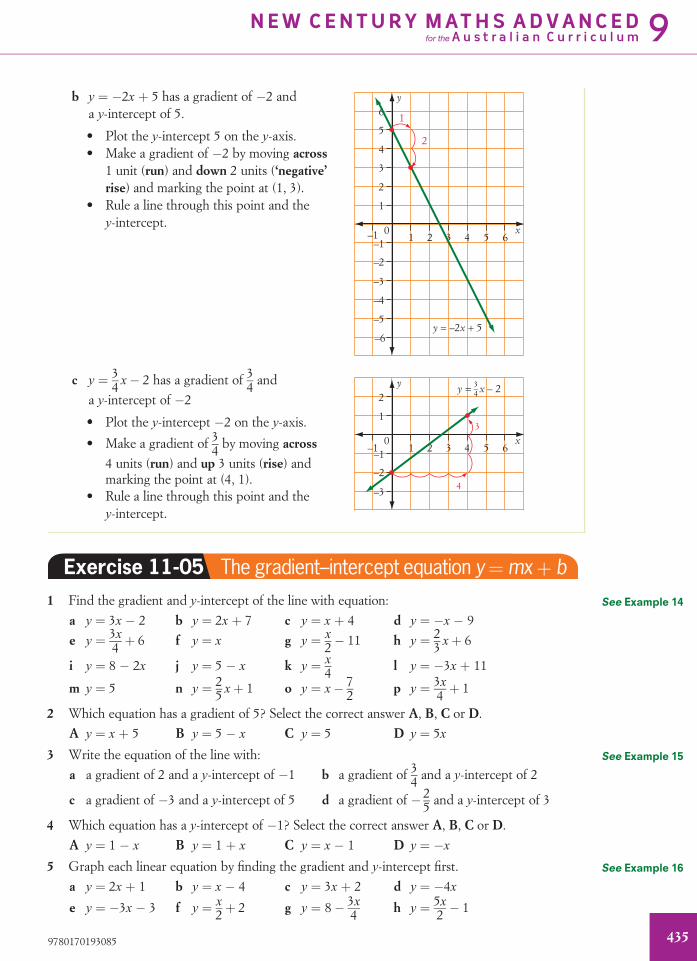
b y ¼ �2x þ 5 has a gradient of �2 anda y-intercept of 5.
• Plot the y-intercept 5 on the y-axis.• Make a gradient of �2 by moving across
1 unit (run) and down 2 units (‘negative’rise) and marking the point at (1, 3).
• Rule a line through this point and they-intercept.
21 3 54 6–1
2
1
3
5
6
4
–6
–2
–4
–5
–3
–10
y
x
y = –2x + 5
1
2
c y ¼ 34 x� 2 has a gradient of 3
4 and
a y-intercept of �2.• Plot the y-intercept �2 on the y-axis.
• Make a gradient of 34 by moving across
4 units (run) and up 3 units (rise) andmarking the point at (4, 1).
• Rule a line through this point and they-intercept.
21 3 54 6–1
2
1
–2
–3
–10
y
x
y = x – 23–4
4
3
Exercise 11-05 The gradient–intercept equation y¼mxþ b
1 Find the gradient and y-intercept of the line with equation:
a y ¼ 3x � 2 b y ¼ 2x þ 7 c y ¼ x þ 4 d y ¼ �x � 9
e y ¼ 3x4 þ 6 f y ¼ x g y ¼ x
2� 11 h y ¼ 23 xþ 6
i y ¼ 8 � 2x j y ¼ 5 � x k y ¼ x4 l y ¼ �3x þ 11
m y ¼ 5 n y ¼ 25 xþ 1 o y ¼ x� 7
2 p y ¼ 3x4 þ 1
2 Which equation has a gradient of 5? Select the correct answer A, B, C or D.
A y ¼ x þ 5 B y ¼ 5 � x C y ¼ 5 D y ¼ 5x
3 Write the equation of the line with:
a a gradient of 2 and a y-intercept of �1 b a gradient of 34 and a y-intercept of 2
c a gradient of �3 and a y-intercept of 5 d a gradient of � 25 and a y-intercept of 3
4 Which equation has a y-intercept of �1? Select the correct answer A, B, C or D.
A y ¼ 1 � x B y ¼ 1 þ x C y ¼ x � 1 D y ¼ �x
5 Graph each linear equation by finding the gradient and y-intercept first.
a y ¼ 2x þ 1 b y ¼ x � 4 c y ¼ 3x þ 2 d y ¼ �4x
e y ¼ �3x � 3 f y ¼ x2þ 2 g y ¼ 8� 3x
4 h y ¼ 5x2 � 1
See Example 14
See Example 15
See Example 16
9780170193085
NEW CENTURY MATHS ADVANCEDfor the A u s t r a l i a n C u r r i c u l um9
435

11-06 Finding the equation of a line
Example 17
Find the equation of each line.
a y
x
3
2
1
4
432–1
–3
–2–1
0 1
–4
b
2
2
y
x0
Solutiona Select two points on the line to find the
gradient, say (0, �3) and (2, 1).
Gradient m ¼ riserun ¼
42 ¼ 2
y
x
3
2
1
4
434
2
2–1
–3
–2–1
0 1
–4
y-intercept b ¼ �3 from graph
[ The equation of the line is y ¼ 2x � 3
We can check that this equation is correct for another point, say (2, 1).
When x ¼ 2, y ¼ 2 3 2 � 3 ¼ 1
y ¼ mx þ b
b Find the gradient of the line passing through (0, 2) and (2, 0).
2
2
y
x0
y-intercept
run = 2
rise = –2
Gradient m ¼ riserun ¼
�22 ¼ �1
y-intercept b ¼ 2 from graph
[ The equation of the line is y ¼ �x þ 2 y ¼ mx þ b
NSW
Video tutorial
Finding the equationof a line
MAT09NAVT10020
Worksheet
Finding the equationof a line
MAT09NAWK10128
Worksheet
A page of intervals
MAT09NAWK10125
Worksheet
A page of lines
MAT09NAWK10126
Puzzle sheet
Straight line equations
MAT09NAPS00045
9780170193085
Chapter 1 2 3 4 5 6 7 8 9 10 11 12 13
Coordinate geometry and graphs
436
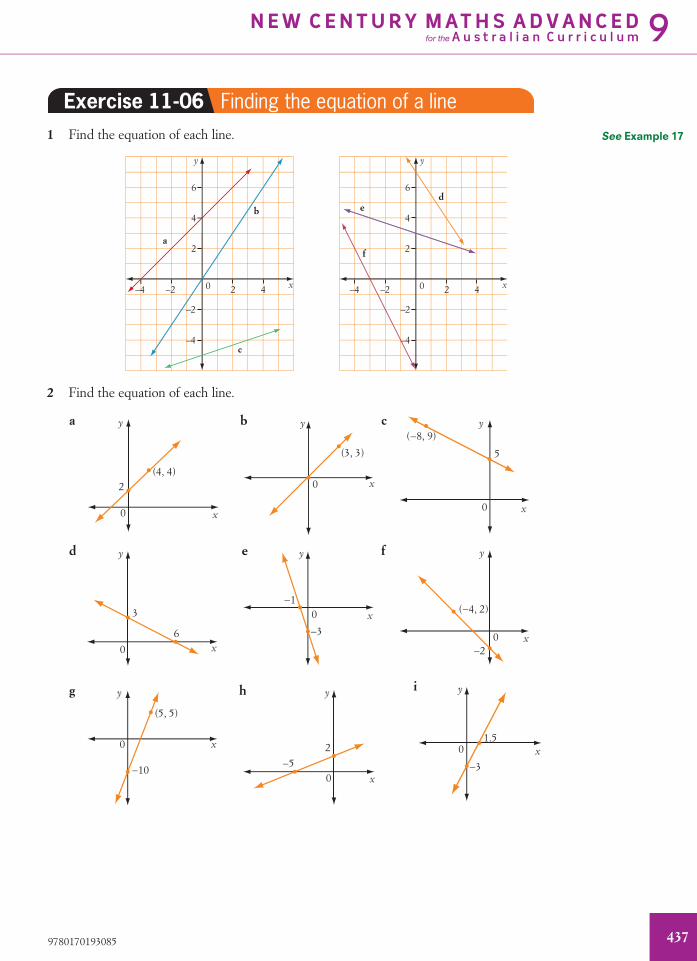
Exercise 11-06 Finding the equation of a line1 Find the equation of each line.
2 4
2
6
4
0
y
x
a
b
c
2 4–2–4
2
6
4
0
–2
–4
–2–4
–2
–4
y
x
ed
f
2 Find the equation of each line.
cba
0
y
x
2(4, 4)
0
y
x
(3, 3)
0
y
x
5
(−8, 9)
fed
x0
y
3
6
0
y
x−1
−3 0
y
x−2
(−4, 2)
i
0
y
x
−3
1.5
hg
0
y
x
−10
(5, 5)
0
y
x−5
2
See Example 17
9780170193085
NEW CENTURY MATHS ADVANCEDfor the A u s t r a l i a n C u r r i c u l um9
437
11-07 Solving linear equations graphicallyIn Chapter 7 Equations, we solved equations algebraically using the balancing and backtrackingmethods. However, we can also solve an equation graphically by first graphing it on the numberplane.
Example 18
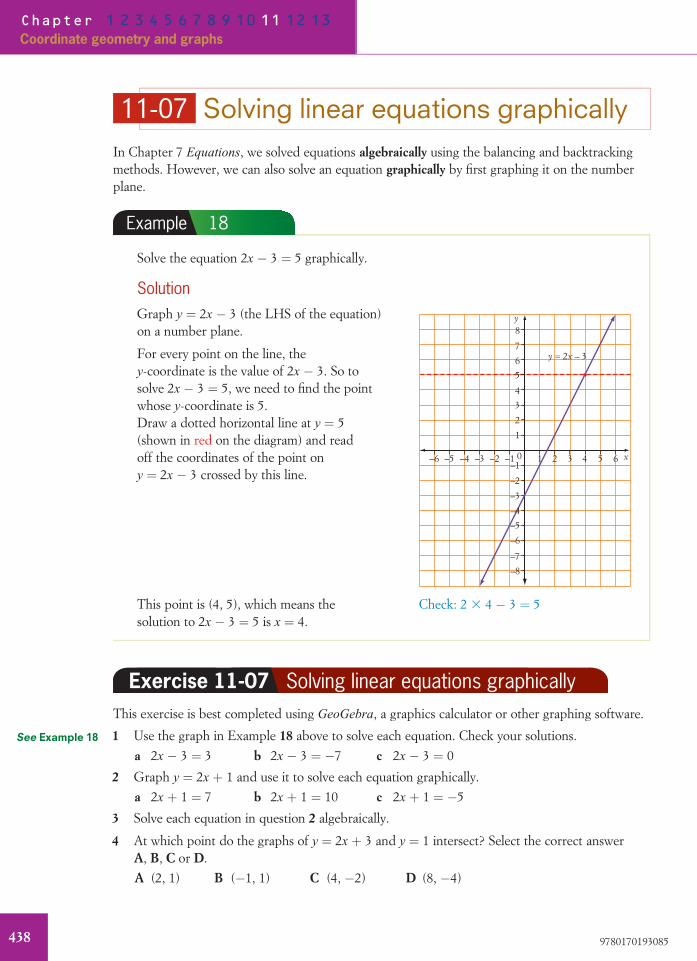
Solve the equation 2x � 3 ¼ 5 graphically.
SolutionGraph y ¼ 2x � 3 (the LHS of the equation)on a number plane.
For every point on the line, they-coordinate is the value of 2x � 3. So tosolve 2x � 3 ¼ 5, we need to find the pointwhose y-coordinate is 5.Draw a dotted horizontal line at y ¼ 5(shown in red on the diagram) and readoff the coordinates of the point ony ¼ 2x � 3 crossed by this line.
y
x
0–4–5–6 –3 –2 –1
1
2
3
4
5
6
7
8
–1
–2
–3
–4
–5
–6
–7
–8
1 2 3 4 5 6
y = 2x – 3
This point is (4, 5), which means thesolution to 2x � 3 ¼ 5 is x ¼ 4.
Check: 2 3 4 � 3 ¼ 5
Exercise 11-07 Solving linear equations graphicallyThis exercise is best completed using GeoGebra, a graphics calculator or other graphing software.
1 Use the graph in Example 18 above to solve each equation. Check your solutions.
a 2x � 3 ¼ 3 b 2x � 3 ¼ �7 c 2x � 3 ¼ 0
2 Graph y ¼ 2x þ 1 and use it to solve each equation graphically.
a 2x þ 1 ¼ 7 b 2x þ 1 ¼ 10 c 2x þ 1 ¼ �5
3 Solve each equation in question 2 algebraically.
4 At which point do the graphs of y ¼ 2x þ 3 and y ¼ 1 intersect? Select the correct answerA, B, C or D.
A (2, 1) B (�1, 1) C (4, �2) D (8, �4)
See Example 18
9780170193085
Chapter 1 2 3 4 5 6 7 8 9 10 11 12 13
Coordinate geometry and graphs
438
5 Graph y ¼ 3x � 2 and use it to solve each equation graphically.
a 3x � 2 ¼ 7 b 3x � 2 ¼ �11 c 3x � 2 ¼ �2
6 Graph y ¼ �x þ 1 and use it to solve each equation graphically.
a �x þ 1 ¼ �3 b �x þ 1 ¼ 4 c �x þ 1 ¼ �1
7 Graph y ¼ �2x � 1 and use it to solve each equation graphically.
a �2x � 1 ¼ �9 b �2x � 1 ¼ 0 c �2x � 1 ¼ 3
8 Graph y ¼ 12 xþ 3 and use it to solve each equation graphically.
a 12 xþ 3 ¼ 5 b 1
2 xþ 3 ¼ 1 c 12 xþ 3 ¼ 2
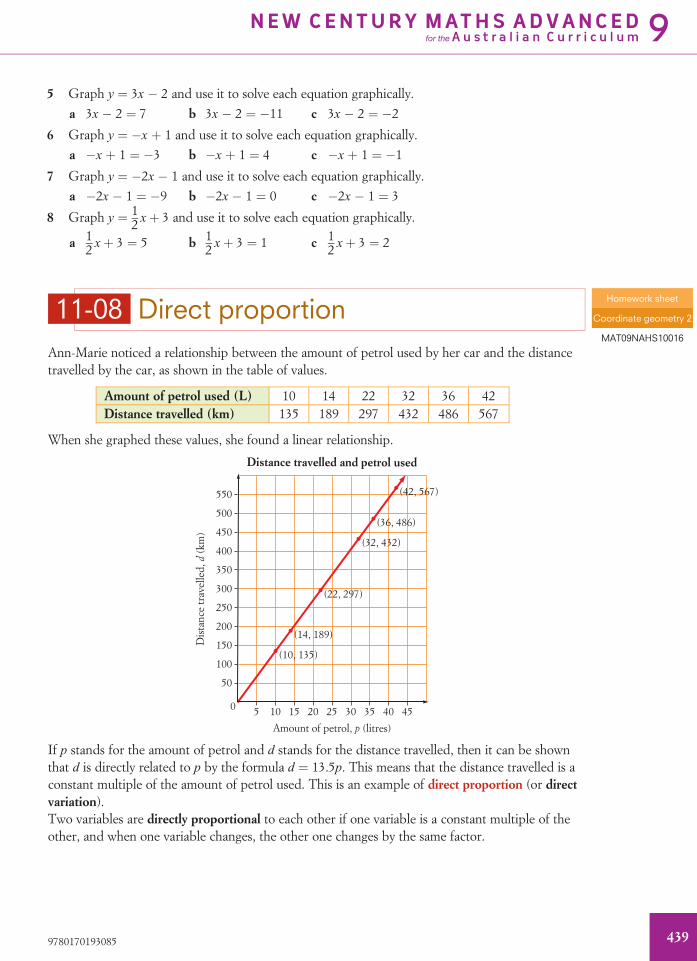
11-08 Direct proportionAnn-Marie noticed a relationship between the amount of petrol used by her car and the distancetravelled by the car, as shown in the table of values.
Amount of petrol used (L) 10 14 22 32 36 42Distance travelled (km) 135 189 297 432 486 567
When she graphed these values, she found a linear relationship.
50
100
150
200
250
300
350
400
450
500
550
50 10 15 20 25 30 35 40 45
Amount of petrol, p (litres)
Distance travelled and petrol used
Dis
tanc
e tr
avel
led,
d (k
m)
(10, 135)
(42, 567)
(22, 297)
(14, 189)
(32, 432)
(36, 486)
If p stands for the amount of petrol and d stands for the distance travelled, then it can be shownthat d is directly related to p by the formula d ¼ 13.5p. This means that the distance travelled is aconstant multiple of the amount of petrol used. This is an example of direct proportion (or directvariation).Two variables are directly proportional to each other if one variable is a constant multiple of theother, and when one variable changes, the other one changes by the same factor.
Homework sheet
Coordinate geometry 2
MAT09NAHS10016
9780170193085
NEW CENTURY MATHS ADVANCEDfor the A u s t r a l i a n C u r r i c u l um9
439

Summary
If y is directly proportional to x, then y ¼ kx where k is a constant (number) called theconstant of proportionality or constant of variation.
• A direct linear relationship exists between x and y.• If x increases (or decreases), y increases (or decreases).• If x is doubled (or halved), y is doubled (or halved).• Another way of saying ‘y is directly proportional to x’ is y varies directly with x’.• The graph of direct proportion is a straight line going through (0, 0) with gradient k.
Example 19
The distance (d) in metres travelled by a car is directly proportional to the number ofrotations (r) of its tyres. After 540 rotations, a distance of 950 m is travelled.a What distance (to the nearest metre) will be travelled after 800 rotations?b How many full rotations will be needed to cover 360 km?
Solutiona d is directly proportional to r.
[ d ¼ kr
To find k, substitute the information given for r and d.
When r ¼ 540 and d ¼ 950,
950 ¼ k 3 540
k ¼ 950540
¼ 1:759 . . .
[ d ¼ 1.759… r
When r ¼ 800,
d ¼ 1:759 . . . 3 800
¼ 1407:4074 . . .
� 1407 m
After 800 rotations, the distance travelled will be 1407 m.
b When d ¼ 360,
360 ¼ 1:759 . . . 3 r
r ¼ 3601:759:::
¼ 204:661 . . .
� 205 rotations
For a distance of 360 km, there will be 205 rotations.
Video tutorial
Direct proportion
MAT09NAVT10021
9780170193085
Chapter 1 2 3 4 5 6 7 8 9 10 11 12 13
Coordinate geometry and graphs
440
Summary
To solve a direct proportion problem:1 identify the two variables (say x and y) and form a proportion equation, y ¼ kx
2 substitute values for x and y to find k, the constant of proportionality3 rewrite y ¼ kx using the value of k
4 substitute a value for x or y into y ¼ kx to solve the problem.
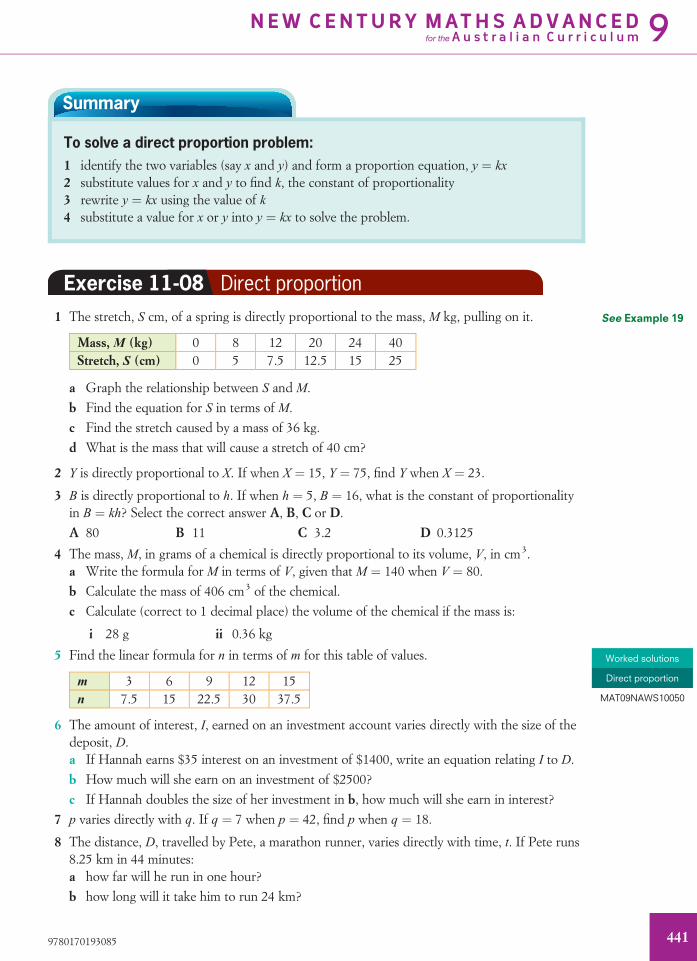
Exercise 11-08 Direct proportion1 The stretch, S cm, of a spring is directly proportional to the mass, M kg, pulling on it.
Mass, M (kg) 0 8 12 20 24 40Stretch, S (cm) 0 5 7.5 12.5 15 25
a Graph the relationship between S and M.
b Find the equation for S in terms of M.
c Find the stretch caused by a mass of 36 kg.
d What is the mass that will cause a stretch of 40 cm?
2 Y is directly proportional to X. If when X ¼ 15, Y ¼ 75, find Y when X ¼ 23.
3 B is directly proportional to h. If when h ¼ 5, B ¼ 16, what is the constant of proportionalityin B ¼ kh? Select the correct answer A, B, C or D.
A 80 B 11 C 3.2 D 0.3125
4 The mass, M, in grams of a chemical is directly proportional to its volume, V, in cm3.a Write the formula for M in terms of V, given that M ¼ 140 when V ¼ 80.
b Calculate the mass of 406 cm3 of the chemical.
c Calculate (correct to 1 decimal place) the volume of the chemical if the mass is:
i 28 g ii 0.36 kg
5 Find the linear formula for n in terms of m for this table of values.
m 3 6 9 12 15n 7.5 15 22.5 30 37.5
6 The amount of interest, I, earned on an investment account varies directly with the size of thedeposit, D.a If Hannah earns $35 interest on an investment of $1400, write an equation relating I to D.
b How much will she earn on an investment of $2500?
c If Hannah doubles the size of her investment in b, how much will she earn in interest?
7 p varies directly with q. If q ¼ 7 when p ¼ 42, find p when q ¼ 18.
8 The distance, D, travelled by Pete, a marathon runner, varies directly with time, t. If Pete runs8.25 km in 44 minutes:a how far will he run in one hour?
b how long will it take him to run 24 km?
See Example 19
Worked solutions
Direct proportion
MAT09NAWS10050
9780170193085
NEW CENTURY MATHS ADVANCEDfor the A u s t r a l i a n C u r r i c u l um9
441
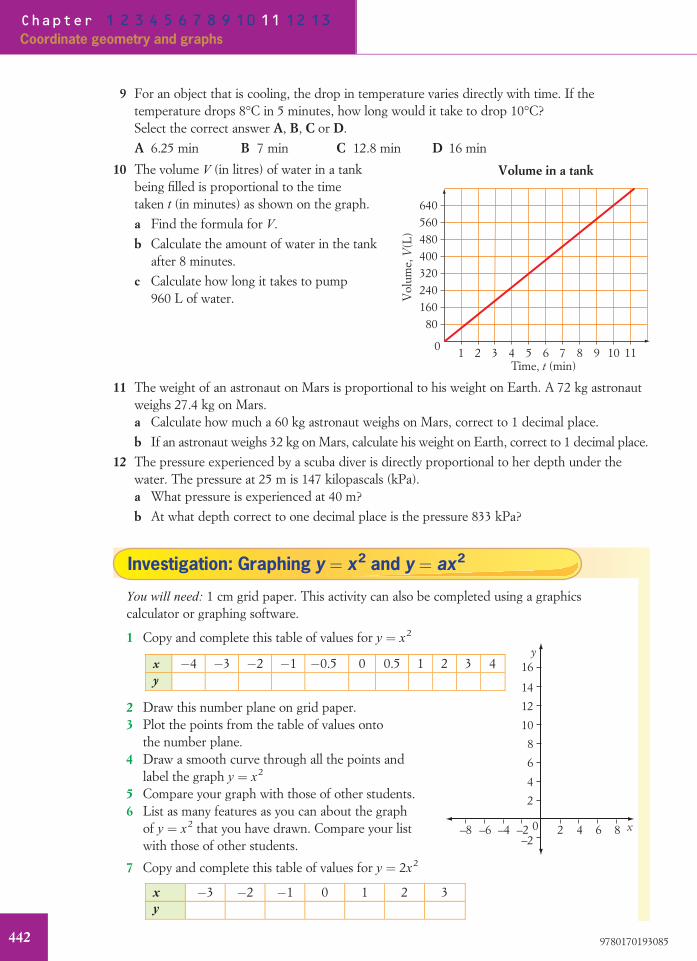
9 For an object that is cooling, the drop in temperature varies directly with time. If thetemperature drops 8�C in 5 minutes, how long would it take to drop 10�C?Select the correct answer A, B, C or D.
A 6.25 min B 7 min C 12.8 min D 16 min
10 The volume V (in litres) of water in a tankbeing filled is proportional to the timetaken t (in minutes) as shown on the graph.
80160240320400480560640
10 2 3 4 5 6
Volume in a tank
7 8 9 10 11Time, t (min)
Vol
ume,
V(L
)
a Find the formula for V.
b Calculate the amount of water in the tankafter 8 minutes.
c Calculate how long it takes to pump960 L of water.
11 The weight of an astronaut on Mars is proportional to his weight on Earth. A 72 kg astronautweighs 27.4 kg on Mars.a Calculate how much a 60 kg astronaut weighs on Mars, correct to 1 decimal place.
b If an astronaut weighs 32 kg on Mars, calculate his weight on Earth, correct to 1 decimal place.
12 The pressure experienced by a scuba diver is directly proportional to her depth under thewater. The pressure at 25 m is 147 kilopascals (kPa).a What pressure is experienced at 40 m?
b At what depth correct to one decimal place is the pressure 833 kPa?
Investigation: Graphing y ¼ x2 and y ¼ ax
2
You will need: 1 cm grid paper. This activity can also be completed using a graphicscalculator or graphing software.
1 Copy and complete this table of values for y ¼ x2
x �4 �3 �2 �1 �0.5 0 0.5 1 2 3 4y
2 Draw this number plane on grid paper.3 Plot the points from the table of values onto
the number plane.4 Draw a smooth curve through all the points and
label the graph y ¼ x2
5 Compare your graph with those of other students.6 List as many features as you can about the graph
of y ¼ x2 that you have drawn. Compare your listwith those of other students.
y
14
16
10
12
8
2
0
4
6
–2x2 4 6 8–8 –6 –4 –2
7 Copy and complete this table of values for y ¼ 2x2
x �3 �2 �1 0 1 2 3y
9780170193085
Chapter 1 2 3 4 5 6 7 8 9 10 11 12 13
Coordinate geometry and graphs
442

Technology Graphing y ¼ ax2
Use graphing software such as Fx-Graph orGeoGebra to compare the graphs of y ¼ ax2
1 Using Fx-Graph, enter y ¼ x2 as y5x2 (as shown below). Then enter the three otherequations y52x2, y55x2 and y59x2
2 The graphs of y ¼ x2 and y ¼ 2x2
are shown. Move the mouse overone of the graphs and its equationshould appear.
3 For the four graphs you did:
a which curve is the widest? b which curve is the narrowest?c which curves had arrows pointing up? d what is their common vertex?e what is their axis of symmetry?
4 Enter y ¼ �x2 as y5�x2. Then enter the three other equations y5�2x2, y5�3x2 andy5�5x2
8 Graph y ¼ 2x2 on the same number plane as y ¼ x2 and label it.9 How is the graph of y ¼ 2x2 different from the graph of y ¼ x2? Give an explanation for
the difference.10 On the same set of axes, draw these graphs:
a y ¼ x2 b y ¼ 12 x 2 c y ¼ 1
3 x 2
11 What do you notice about the graphs you have drawn? Give an explanation.12 Compare your observations and explanation with those of other students.
9780170193085
NEW CENTURY MATHS ADVANCEDfor the A u s t r a l i a n C u r r i c u l um9
443

5 Set the scale as shown. The first two graphs are shown below.
6 For the four graphs you graphed:
a which curve is the widest? b which curve is the narrowest?c are they pointing up or down? d what is their common vertex?e what is their axis of symmetry?
7 Enter y ¼ x2 as y5x2. Then enter the three other equations y5x2þ1, y5x2þ3and y 5 x2þ9
8 Set an appropriate scale.
9 For the four parabolas you graphed:
a which curve is the widest? b which curve is the narrowest?c are they pointing up or down? d what is their vertex?e what is their axis of symmetry?
10 Graph each set of curves.
Investigation: Graphing y ¼ ax2 þ c
You will need: 1 cm grid paper. This activity can also be completed using a graphicscalculator or graphing software.
1 Graph y ¼ x2 on a number plane for values of x from �3 to 3.2 Copy and complete this table of values for y ¼ x2 þ 2
x �3 �2 �1 0 1 2 3y
3 Graph y ¼ x2 þ 2 on the same number plane as y ¼ x2 and label it.4 What do the graphs of y ¼ x2 and y ¼ x2 þ 2 have in common?5 How are the two graphs different?6 Describe how the graph of y ¼ x2 þ 2 could be drawn using the graph of y ¼ x2.
9780170193085
Chapter 1 2 3 4 5 6 7 8 9 10 11 12 13
Coordinate geometry and graphs
444
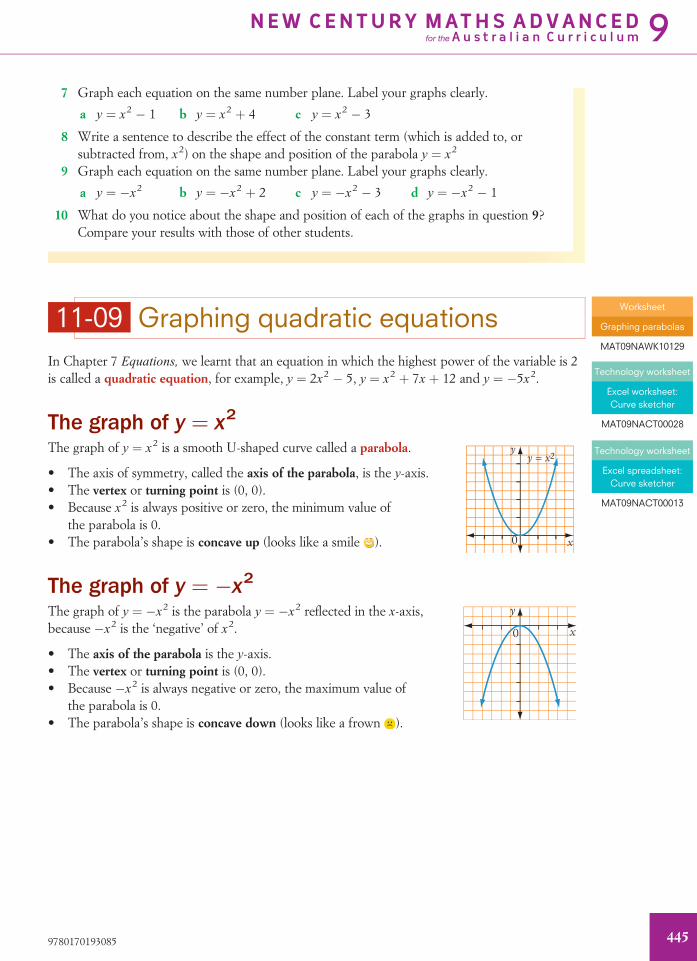
11-09 Graphing quadratic equationsIn Chapter 7 Equations, we learnt that an equation in which the highest power of the variable is 2is called a quadratic equation, for example, y ¼ 2x2 � 5, y ¼ x2 þ 7x þ 12 and y ¼ �5x2.
The graph of y ¼ x2
The graph of y ¼ x2 is a smooth U-shaped curve called a parabola.
• The axis of symmetry, called the axis of the parabola, is the y-axis.• The vertex or turning point is (0, 0).• Because x2 is always positive or zero, the minimum value of
the parabola is 0.• The parabola’s shape is concave up (looks like a smile ). 0
y
x
y = x2
The graph of y ¼ �x2The graph of y ¼ �x2 is the parabola y ¼ �x2 reflected in the x-axis,because �x2 is the ‘negative’ of x2.
• The axis of the parabola is the y-axis.• The vertex or turning point is (0, 0).• Because �x2 is always negative or zero, the maximum value of
the parabola is 0.• The parabola’s shape is concave down (looks like a frown ).
y
x0
7 Graph each equation on the same number plane. Label your graphs clearly.
a y ¼ x2 � 1 b y ¼ x2 þ 4 c y ¼ x2 � 3
8 Write a sentence to describe the effect of the constant term (which is added to, orsubtracted from, x2) on the shape and position of the parabola y ¼ x2
9 Graph each equation on the same number plane. Label your graphs clearly.
a y ¼ �x2 b y ¼ �x2 þ 2 c y ¼ �x2 � 3 d y ¼ �x2 � 1
10 What do you notice about the shape and position of each of the graphs in question 9?Compare your results with those of other students.
Worksheet
Graphing parabolas
MAT09NAWK10129
Technology worksheet
Excel worksheet:Curve sketcher
MAT09NACT00028
Technology worksheet
Excel spreadsheet:Curve sketcher
MAT09NACT00013
9780170193085
NEW CENTURY MATHS ADVANCEDfor the A u s t r a l i a n C u r r i c u l um9
445

The graph of y ¼ ax2
For the graph of a quadratic equation in the form y ¼ ax2, where a is a constant (number), thesize of a affects whether the parabola is ‘wide’ or ‘narrow’.As the size of a increases, the parabola becomes ‘narrower’ and as the size of a decreases, theparabola ‘widens’. If a is negative, then the parabola is concave down.
1 2 3 4 5 6
1
2
3
4
5
6
7
8
9
10
0
y
x
y = – x21_9y = x21_
9
y = x21_4
y = x21_2
y = – x21_4
y = – x21_2y =
–x2
y = x
2y =
2x2
y = 4x
2
y = –2x
2
y = –4x
2
1 2 3 4 5 6–1
1
0–2–3–4–5–6
–1–1
–2–3–4–5–6–10
–9
–8
–7
–6
–5
–4
–3
–2
–1
y
x
Example 20
a Graph y ¼ �x2 and y ¼ �2x2 on the same set of axes.b What is the vertex of each parabola?c Are the parabolas concave up or concave down?d At what point do the two parabolas meet?e Which parabola is ‘wider’?
Solutiona y ¼ �x2
x �3 �2 �1 0 1 2 3
y �9 �4 �1 0 �1 �4 �9
y ¼ �2x2
x �3 �2 �1 0 1 2 3
y �27 �8 �2 0 �2 �8 �27
x–3–4 –2 –1 1 2 3 4
y
–10
–9
–8
–7
–6
–4
–5
–3
–2
–1
y = –2x2 y = –x2
(0, 0)
b The vertex of both parabolas is (0, 0).
c The parabolas are both concave down.
d The parabolas meet at (0, 0).
e The parabola y ¼ �x2 is wider.
9780170193085
Chapter 1 2 3 4 5 6 7 8 9 10 11 12 13
Coordinate geometry and graphs
446
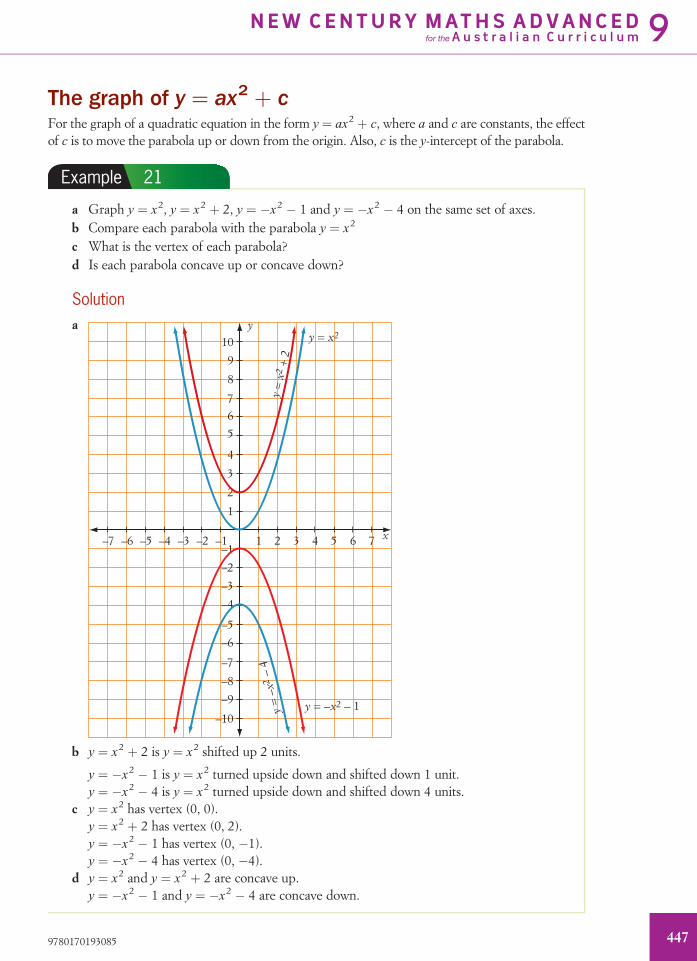
The graph of y ¼ ax2 þ cFor the graph of a quadratic equation in the form y ¼ ax2 þ c, where a and c are constants, the effectof c is to move the parabola up or down from the origin. Also, c is the y-intercept of the parabola.
Example 21
a Graph y ¼ x2, y ¼ x2 þ 2, y ¼ �x2 � 1 and y ¼ �x2 � 4 on the same set of axes.b Compare each parabola with the parabola y ¼ x2
c What is the vertex of each parabola?d Is each parabola concave up or concave down?
Solutiona
21 3 4 5 76–5 –4–7 –6 –3 –2 –1
2
1
3
4
5
67
8
9
10
–5
–6
–7
–8
–9
–10
–4
–3
–2
–1
y
y =
x2 +
2y
= –
x2 –
4
y = –x2 – 1
y = x2
x
b y ¼ x2 þ 2 is y ¼ x2 shifted up 2 units.
y ¼ �x2 � 1 is y ¼ x2 turned upside down and shifted down 1 unit.y ¼ �x2 � 4 is y ¼ x2 turned upside down and shifted down 4 units.
c y ¼ x2 has vertex (0, 0).y ¼ x2 þ 2 has vertex (0, 2).y ¼ �x2 � 1 has vertex (0, �1).y ¼ �x2 � 4 has vertex (0, �4).
d y ¼ x2 and y ¼ x2 þ 2 are concave up.y ¼ �x2 � 1 and y ¼ �x2 � 4 are concave down.
9780170193085
NEW CENTURY MATHS ADVANCEDfor the A u s t r a l i a n C u r r i c u l um9
447

Exercise 11-09 Graphing quadratic equationsThe questions in this exercise may also be completed using a graphics calculator or graphingsoftware.1 a Graph y ¼ 2x2 on a number plane after copying and completing this table of values.
x �2 �1 0 1 2y
b Graph y ¼ 12 x 2 on the same number plane after copying and completing this table of
values.
x �2 �1 0 1 2y
c Compare both parabolas. What features are the same? What is different?
2 Which statement is correct about the parabola for y ¼ x2? Select the correct answerA, B, C or D.
A It has a y-intercept of 1 B It is symmetrical about the x-axisC It is concave down D Its vertex is (0, 0)
3 a Graph y ¼ �3x2 and y ¼ �0.1x2 on the same number plane after copying and completingthis table of values for each equation.
x �2 �1 0 1 2y
b Compare both parabolas. What features are the same? What is different?
4 Graph each pair of parabolas on the same set of axes and state:i the vertex of each parabola
ii whether each parabola is concave up or concave down
iii which parabola is ‘wider’
iv the point at which the two parabolas meet.
a y ¼ x2 and y ¼ 14 x 2 b y ¼ 2x2 and y ¼ �2x2
c y ¼ �3x2 and y ¼ � 12 x 2 d y ¼ 5x2 and y ¼ 0.2x2
5 Which statement is correct about the parabola for y ¼ �6x2? Select A, B, C or D.
A It has a y-intercept of �6. B It passes through (�1, 6).C It is concave down. D Its vertex is (0, �6).
6 Graph each pair of parabolas on the same set of axes and state:i the vertex of each parabola
ii whether each parabola is concave up or concave down
iii which parabola is ‘wider’
iv the y-intercept of each parabola.
a y ¼ x2 þ 1 and y ¼ x2 þ 3 b y ¼ �x2 � 2 and y ¼ 2x2 þ 4c y ¼ �5x2 � 2 and y ¼ �2x2 � 1 d y ¼ �3x2 � 4 and y ¼ 2x2 þ 2
7 Which statement is correct about the parabola for y ¼ x2 þ 2? Select A, B, C or D.
A It has a maximum value of 2. B It is symmetrical about the x-axis.C It is concave up. D Its vertex is (2, 0).
See Example 20
See Example 21
9780170193085
Chapter 1 2 3 4 5 6 7 8 9 10 11 12 13
Coordinate geometry and graphs
448
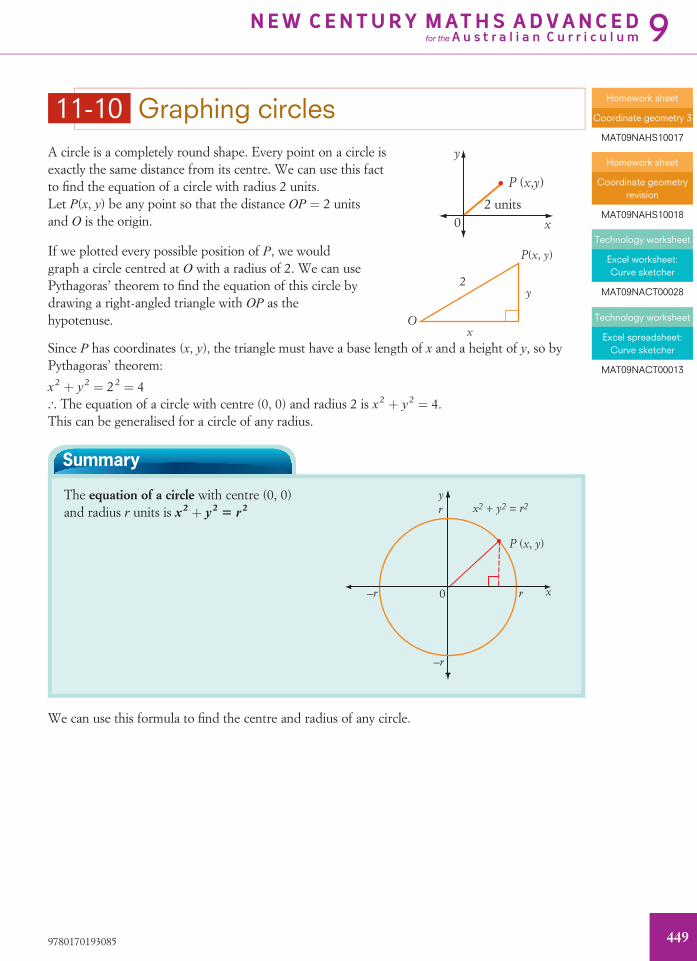
11-10 Graphing circlesA circle is a completely round shape. Every point on a circle isexactly the same distance from its centre. We can use this factto find the equation of a circle with radius 2 units.Let P(x, y) be any point so that the distance OP ¼ 2 unitsand O is the origin.
2 units
P (x,y)
y
x0
If we plotted every possible position of P, we wouldgraph a circle centred at O with a radius of 2. We can usePythagoras’ theorem to find the equation of this circle bydrawing a right-angled triangle with OP as thehypotenuse. O
2
x
y
P(x, y)
Since P has coordinates (x, y), the triangle must have a base length of x and a height of y, so byPythagoras’ theorem:
x2 þ y2 ¼ 22 ¼ 4[ The equation of a circle with centre (0, 0) and radius 2 is x2 þ y2 ¼ 4.This can be generalised for a circle of any radius.
Summary
The equation of a circle with centre (0, 0)and radius r units is x2 þ y2 5 r2
r–r
–r
0
P (x, y)
x2 + y2 = r2ry
x
We can use this formula to find the centre and radius of any circle.
Homework sheet
Coordinate geometry 3
MAT09NAHS10017
Homework sheet
Coordinate geometryrevision
MAT09NAHS10018
Technology worksheet
Excel worksheet:Curve sketcher
MAT09NACT00028
Technology worksheet
Excel spreadsheet:Curve sketcher
MAT09NACT00013
9780170193085
NEW CENTURY MATHS ADVANCEDfor the A u s t r a l i a n C u r r i c u l um9
449
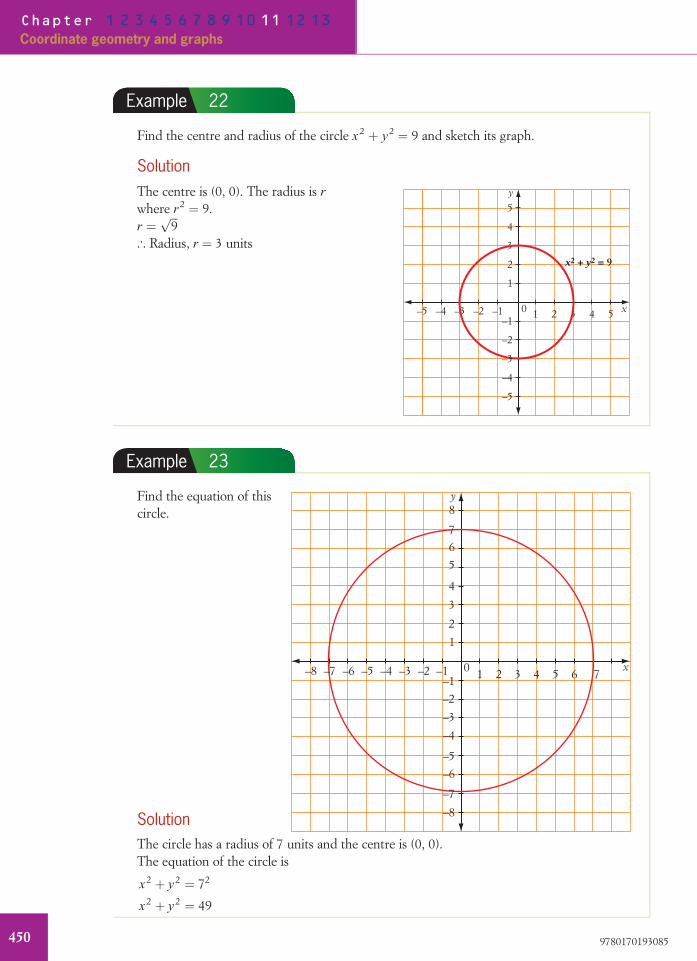
Example 22
Find the centre and radius of the circle x2 þ y2 ¼ 9 and sketch its graph.
SolutionThe centre is (0, 0). The radius is r
where r2 ¼ 9.r ¼
ffiffiffi
9p
[ Radius, r ¼ 3 units
21 3 54–5 –4 –3 –2 –1
2
1
3
4
5
–5
–4
–2
–10
y
x
–3
x2 + y2 = 9
Example 23
Find the equation of thiscircle.
210 3 54 76–5 –4–7–8 –6 –3 –2 –1
2
1
3
4
5
6
8
7
–5
–8
–6
–7
–4
–3
–2–1
y
x
SolutionThe circle has a radius of 7 units and the centre is (0, 0).The equation of the circle is
x 2 þ y 2 ¼ 72
x 2 þ y 2 ¼ 49
9780170193085
Chapter 1 2 3 4 5 6 7 8 9 10 11 12 13
Coordinate geometry and graphs
450

Exercise 11-10 Graphing circlesThe questions in this exercise may also be completed using a graphics calculator or graphingsoftware.1 Find the centre and radius of the circle given by each equation and sketch its graph.
a x 2 þ y 2 ¼ 4 b x 2 þ y 2 ¼ 1 c x 2 þ y 2 ¼ 81
d x 2 þ y 2 ¼ 100 e x 2 þ y 2 ¼ 25 f x 2 þ y 2 ¼ 14
2 What is the equation of a circle with centre (0, 0) and radius 6 units? Select the correct answerA, B, C or D.
A x 2 þ y 2 ¼ 12 B x 2 þ y 2 ¼ 6 C x 2 þ y 2 ¼ 8 D x 2 þ y 2 ¼ 36
3 Find the equation of each circle shown.
a
21 3 54 6–5 –4–6 –3 –2 –1
21
34
56
–5–6
–4–3–2–1
y
x
b
21 3 54 7 8–5 –4–7–8 –6 –3 –2 –1
2
1
3
4
5
6
8
7
–5
–8
–6
–7
–4
–3
–2–1
y
x6
See Example 22
See Example 23
9780170193085
NEW CENTURY MATHS ADVANCEDfor the A u s t r a l i a n C u r r i c u l um9
451

c
21 3 54–5 –4 –3 –2 –1
2
1
3
4
5
–5
–4
–3
–2
–1
y
x
d
1
0.9
2–2 –1
1
2
–2
y
x
–1
4 What is the equation of a circle with centre (0, 0) and radius 1.3 units? Select A, B, C or D.
A x 2 þ y 2 ¼ 2:6 B x 2 þ y 2 ¼ 1:69 C x 2 þ y 2 ¼ 1:72 D x 2 þ y 2 ¼ 3:69
5 What is the radius of a circle with equation x 2 þ y 2 ¼ 144? Select A, B, C or D.
A 12 units B 14 units C 36 units D 72 units
6 What is the equation of a circle with centre (0, 0) and diameter 16 units?
7 What is the radius of a circle with equation x 2 þ y 2 ¼ 94? Select A, B, C or D.
A 2 14 units B 1 1
2 units C 34 units D 7
8 units
8 What is the diameter of the circle whose equation is x 2 þ y 2 ¼ 196?
9 a What is the radius of the circle whose equation is x 2 þ y 2 ¼ 12?
b Sketch the graph of x 2 þ y 2 ¼ 12
Worked solutions
Graphing circles
MAT09NAWS10051
9780170193085
Chapter 1 2 3 4 5 6 7 8 9 10 11 12 13
Coordinate geometry and graphs
452
Power plus
1 ABCD is a parallelogram. The coordinates of A, B and C are (�1, 4), (4, 6) and (2, 7)respectively. Find the coordinates of D.
2 A line drawn through points A(0, �2) and B(3, 0) also goes through point C withx-coordinate 9. Find:
a the equation of the line b the y-coordinate of C.
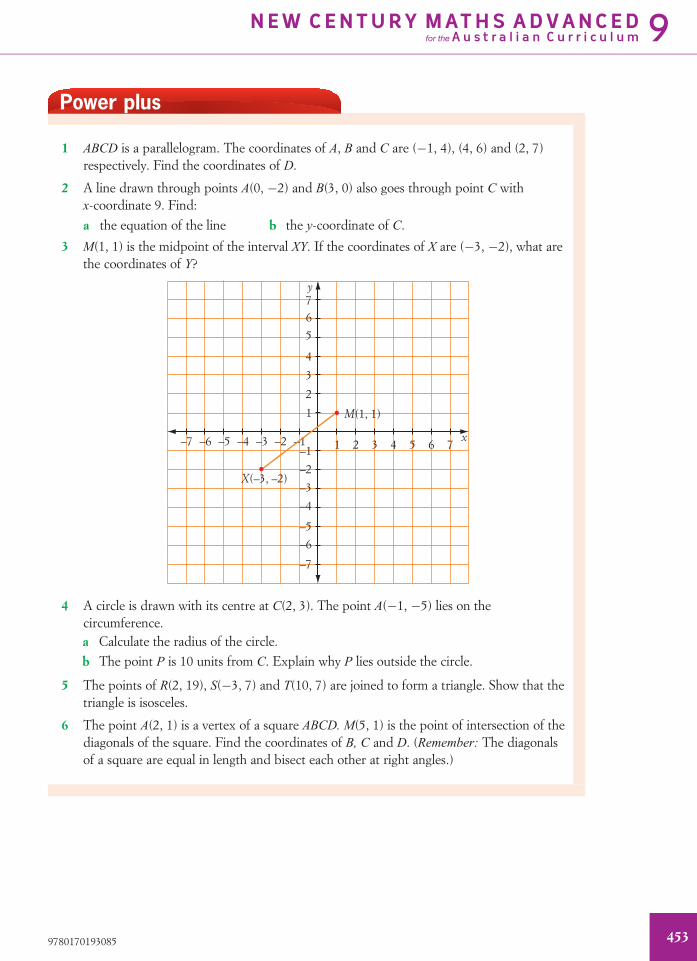
3 M(1, 1) is the midpoint of the interval XY. If the coordinates of X are (�3, �2), what arethe coordinates of Y?
21
M(1, 1)
X(–3, –2)
3 54 76–5 –4–7 –6 –3 –2 –1
2
1
3
4
5
67
–5
–6
–7
–4
–3
–2
–1
y
x
4 A circle is drawn with its centre at C(2, 3). The point A(�1, �5) lies on thecircumference.a Calculate the radius of the circle.
b The point P is 10 units from C. Explain why P lies outside the circle.
5 The points of R(2, 19), S(�3, 7) and T(10, 7) are joined to form a triangle. Show that thetriangle is isosceles.
6 The point A(2, 1) is a vertex of a square ABCD. M(5, 1) is the point of intersection of thediagonals of the square. Find the coordinates of B, C and D. (Remember: The diagonalsof a square are equal in length and bisect each other at right angles.)
9780170193085
NEW CENTURY MATHS ADVANCEDfor the A u s t r a l i a n C u r r i c u l um9
453
Chapter 11 review
n Language of maths
axis/axes constant of proportionality direct proportion distance
exact formula gradient horizontal
interval length linear equation midpoint
number plane parabola quadratic equation radius
rise run surd varies directly
vertex vertical x-intercept y-intercept
1 What is the name given to the graph of:
a a quadratic equation? b a linear equation?
2 Is the line y ¼ 3 horizontal or vertical?
3 What is another name for the steepness of a line?
4 What is the value at which a line crosses the y-axis called?
5 What are the coordinates of the vertex of the parabola with equation y ¼ �x2?
6 If y ¼ kx, what is the constant of proportionality?
7 When the length of an interval needs to be given as an exact length, what does this mean?
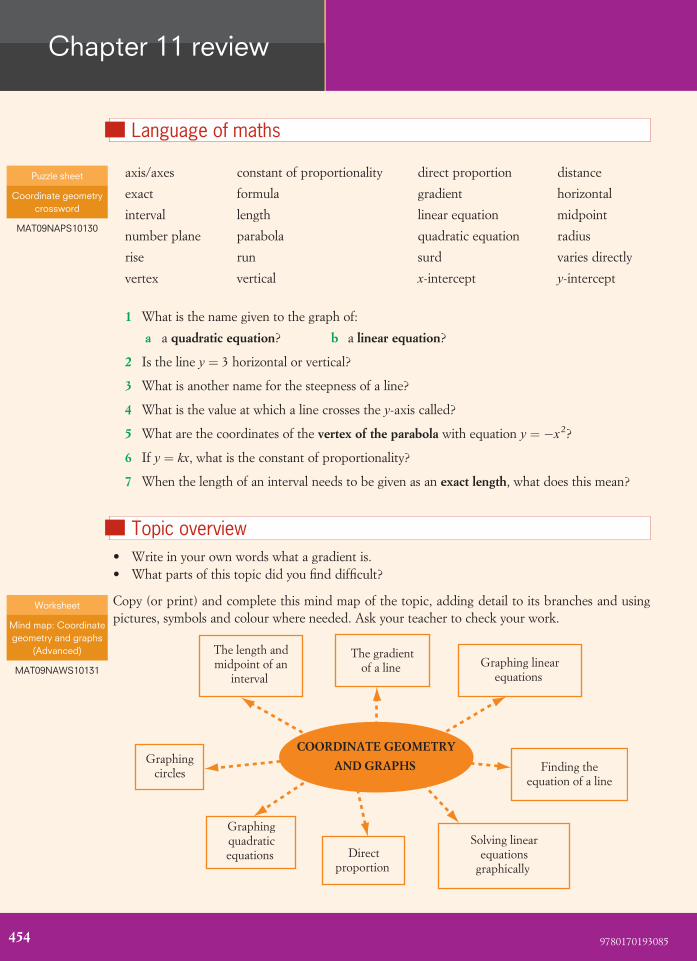
n Topic overview• Write in your own words what a gradient is.• What parts of this topic did you find difficult?
Copy (or print) and complete this mind map of the topic, adding detail to its branches and usingpictures, symbols and colour where needed. Ask your teacher to check your work.
Graphing linearequations
COORDINATE GEOMETRYAND GRAPHS
Graphingquadraticequations
Solving linearequations
graphically
Finding theequation of a line
The gradientof a line
The length andmidpoint of an
interval
Directproportion
Graphingcircles
Puzzle sheet
Coordinate geometrycrossword
MAT09NAPS10130
Worksheet
Mind map: Coordinategeometry and graphs
(Advanced)
MAT09NAWS10131
454 9780170193085
1 Find the length of the interval joining the points H(7, 2) and T(�2, 6). Express your answer:
a as a surd b correct to one decimal place.
2 Find the coordinates of the midpoint of the interval joining:
a (8, 4) and (�2, 10) b (�1, �1) and (�7, 9) c (3, �6) and (�5, 10)
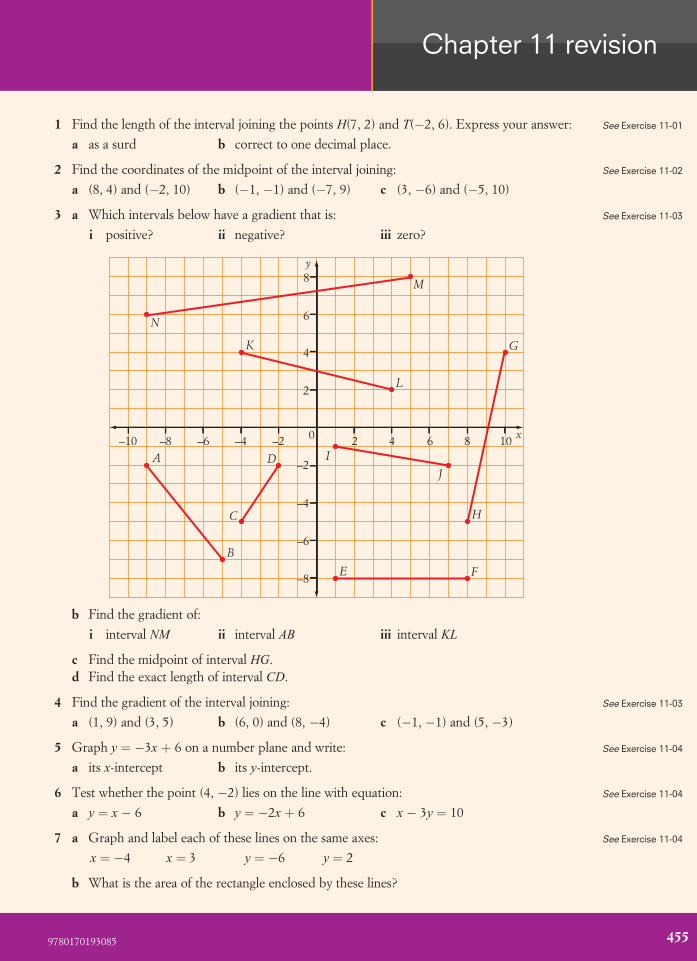
3 a Which intervals below have a gradient that is:
i positive? ii negative? iii zero?
2 4 6 8–2–4–6–8
2
4
6
8
–2
–4
–6
–8
0–10 10
y
x
A
B
C
D
E F
G
H
I
J
K
L
M
N
b Find the gradient of:
i interval NM ii interval AB iii interval KL
c Find the midpoint of interval HG.d Find the exact length of interval CD.
4 Find the gradient of the interval joining:
a (1, 9) and (3, 5) b (6, 0) and (8, �4) c (�1, �1) and (5, �3)
5 Graph y ¼ �3x þ 6 on a number plane and write:
a its x-intercept b its y-intercept.
6 Test whether the point (4, �2) lies on the line with equation:
a y ¼ x � 6 b y ¼ �2x þ 6 c x � 3y ¼ 10
7 a Graph and label each of these lines on the same axes:
x ¼ �4 x ¼ 3 y ¼ �6 y ¼ 2
b What is the area of the rectangle enclosed by these lines?
See Exercise 11-01
See Exercise 11-02
See Exercise 11-03
See Exercise 11-03
See Exercise 11-04
See Exercise 11-04
See Exercise 11-04
4559780170193085
Chapter 11 revision

8 Write the equation of a line which is:a horizontal with a y-intercept of 4b parallel to the y-axis and passes through (�1, 7)c the x-axis
9 Find the gradient and y-intercept of the line with equation:
a y ¼ 3x þ 1 b y ¼ 8 � x c y ¼ x5þ 4 d y ¼ �6x
10 Graph each linear equation by finding the gradient and y-intercept first.
a y ¼ �3x � 1 b y ¼ x2þ 6
11 Find the equation of each line.
a
21 3 54–5 –4 –3 –2 –1
2
1
0
3
4
5
–5
–4
–3
–2
–1
y
x
b
21 3 54–5 –4 –3 –2 –1
2
1
3
4
5
–5
–4
–3
–2
–1
y
x
12 Solve the equation 3x � 4 ¼ 5 graphically.
See Exercise 11-04
See Exercise 11-05
See Exercise 11-05
See Exercise 11-06
See Exercise 11-07
456 9780170193085
Chapter 11 revision

13 During a thunderstorm, the time, T seconds, between seeing lightning and hearing thunderis directly proportional to the distance, d kilometres, of the observer from the centre of thestorm. Thunder is heard 6 seconds after the lightning is seen when a storm is 35 km away.a Find a formula for T in terms of d.b Calculate, correct to the nearest kilometre, the distance of a storm when thunder is heard
10 seconds after the lightning.
14 Graph y ¼ x2 þ 1 and y ¼ �2x2 on the same set of axes and state:a the vertex of each parabolab whether each parabola is concave up or concave downc which parabola is ‘wider’.
15 Which equation below represents a concave up parabola with vertex (0, 0)?Select A, B, C or D.
A y ¼ x2 � 1 B y ¼ 2x2 C y ¼ �x2 D y ¼ 3x2 þ 2
16 Find the centre and radius of the circle with equation x2 þ y2 ¼ 16 and sketch its graph.
See Exercise 11-08
See Exercise 11-09
See Exercise 11-09
See Exercise 11-10
4579780170193085
Chapter 11 revision