Embed Size (px)
Citation preview

A New Research Proposal submitted to JLab PAC30
Nucleon Resonance Studies with CLAS12 in the
Transition from Soft to Partonic Physics
T. S. H. Lee
Argonne National Lab,USA
H. Avakian, V.D. Burkert∗, L. Elouadrhiri, V.I. Mokeev∗,†, S. Stepanyan
Jefferson Lab, Newport News, VA 23606, USA
V.V. Chesnokov, G.V. Fedotov, B.S. Ishkhanov, E.L. Isupov, N.V.Shvedunov
Skobeltsyn Nuclear Physics Institute, Moscow State University, 11989 Moscow, Russia
W. Roberts
Physics Department, Florida State University, Tallahassee, Florida 32306, USA
V. Kubarovsky, P. Stoler∗
Department of Physics, Rensselaer Polytechnic Institute, Troy, NY 12181, USA
K. Joo∗, N. Markov, T. Mineeva, M. Ungaro
University of Connecticut, Storrs, Connecticut 06269, USA
C. Djalali, R.W. Gothe∗,†, J. Langheinrich, K. Park, S. Strauch, D. Tedeschi
Department of Physics and Astronomy, University of South Carolina, Columbia, SC 29208, USA
I. Aznauryan
Yerevan Physics Institute, 375036 Yerevan, Armenia
A. Biselli
Physics Department, Fairfield University, Fairfield, CT 06824, USA
W.J. Briscoe, I. Strakovsky
Center for Nuclear Studies, Department of Physics, The George Washington University,
Washington, D.C. 20052, USA
and the CLAS collaboration
∗Spokesperson†Contact person

Abstract
We plan to measure exclusive single-pion and double-pion electro-production off a protontarget to study the nucleon resonances with the CLAS12 detector and the energy upgradedCEBAF beam. Exclusive final states will be measured including the identification of π0
and η mesons by measuring the two decay photons as well as of charged pions. In theproposed measurements, we expect to obtain electromagnetic transition form factors forwell established excited nucleon states in the unexplored domain of Q2, from 4 to 14 GeV2.The aim of the measurements is to explore the transition from the hadronic to the partonicregime. In parallel, a major coupled-channel approach is under development to extract theresonance electro-couplings from the expected extensive data. This experiment is part ofthe comprehensive program of measurements of exclusive electro-production with CLAS12,in which various channels such as deeply virtual Compton scattering and deeply virtualexclusive meson production, will be measured as well. By providing a high statistics andhigh quality of analysis of the proposed measurements, significant new information on themechanisms of QCD confinement in hadrons with three valence quark will be obtained.

Contents
1 Technical Participation of Research Groups 5
1.1 University of South Carolina . . . . . . . . . . . . . . . . . . . . . . . . . . . 51.2 Moscow State University . . . . . . . . . . . . . . . . . . . . . . . . . . . . . 51.3 Rensselaer Polytechnic Institute . . . . . . . . . . . . . . . . . . . . . . . . . 51.4 University of Connecticut . . . . . . . . . . . . . . . . . . . . . . . . . . . . 6
2 Introduction 7
2.1 Penetrating the meson cloud . . . . . . . . . . . . . . . . . . . . . . . . . . . 92.2 Other directions in N ∗ studies with CLAS12 . . . . . . . . . . . . . . . . . . 12
2.2.1 GPDs and Baryon Transition Form Factors . . . . . . . . . . . . . . . 122.2.2 The Q2 Evolution of N* Structure . . . . . . . . . . . . . . . . . . . . 12
2.3 Expected data base and analysis approaches . . . . . . . . . . . . . . . . . . 13
3 Single Pion Exclusive Channels 15
4 Double Charged Pion Exclusive Channel 19
5 Combined Studies of Various Exclusive Channels 21
5.1 Coupled-Channel Analysis . . . . . . . . . . . . . . . . . . . . . . . . . . . . 235.2 Development of Dynamical Coupled-Channel Analysis at EBAC . . . . . . . 235.3 Fit to πN data . . . . . . . . . . . . . . . . . . . . . . . . . . . . . . . . . . 275.4 Extraction of γN → N ∗ Form Factors . . . . . . . . . . . . . . . . . . . . . . 285.5 Analyses of πN , ηN and ππN production data . . . . . . . . . . . . . . . . . 29
6 Single-Meson Electro-Production Experiment 31
6.1 Cross Section Measurement and Beam Time Estimates . . . . . . . . . . . . 316.2 Data Analysis . . . . . . . . . . . . . . . . . . . . . . . . . . . . . . . . . . . 38
7 Double Charged Pion Data Analysis and Beam Time Estimates 43
7.1 Double charged pion exclusive channel . . . . . . . . . . . . . . . . . . . . . 437.1.1 Experimental studies of 2π photo- electro-production in N ∗ excitation
region . . . . . . . . . . . . . . . . . . . . . . . . . . . . . . . . . . . 437.1.2 Physics analysis of double pion exclusive photo- and electro-production 447.1.3 Essentials of JM05 model and 2π CLAS data analysis . . . . . . . . . 467.1.4 N∗ studies at intermediate photon virtuality within the framework of
JM05 model . . . . . . . . . . . . . . . . . . . . . . . . . . . . . . . . 487.1.5 Feasibility for N ∗ studies in 2π electro-production at high still unex-
plored photon virtualities . . . . . . . . . . . . . . . . . . . . . . . . 517.1.6 Simulation of 2π electro-production with CLAS12. Feasibility to study
2π exclusive channel at Q2 from 5.0 to 10 GeV 2 . . . . . . . . . . . . 53
3

8 Projected N ∗ Electro-Coupling, Expected from Proposed Experiments 61
9 Summary and Beam Time Request 63
Bibliography 64
4
1 Technical Participation of Research Groups
1.1 University of South Carolina
The University of South Carolina group is actively involved in this proposal using CLAS12base equipment. Ralf Gothe is a member of the CLAS12 Steering Committee. Among theCLAS12 baseline equipment, our group has taken responsibility for the design, prototyp-ing, construction and testing of the forward Time-of-Flight detector ToF12. Ralf Gothe iscurrently heading Time-of-Flight technical working group. Three USC faculty members (R.Gothe, S. Strauch, and D. Tedeschi), one post-doc (K. Park), three graduate (L. Graham,H. Lu, and Z.Zhao) and two undergraduate students (E. Phelps and D. Gothe) are alreadyworking on this project. The USC nuclear physics group is committed to carry out thisproject and will continue to be fully involved as needed. The group is currently funded byNSF. The University of South Carolina is providing a detector assembly hall for the dura-tion of the project and has funded $ 60,000 for the initial infrastructural needs. Additionalsources of funding will be sought as appropriate.
Beyond the baseline equipment, the group is also deeply involved in software planningand development for CLAS12. Joern Langheinrich is currently leading the efforts to developa Monte-Carlo simulation for the CLAS12 detector.
1.2 Moscow State University
The Moscow State University Group (MSU) is actively involved in development of CLAS12base equipment needed for proposed experiments.
In particular, the MSU group will participate in development of the simulation (GEANT4)and reconstruction software and trigger and data acquisition. The MSU group takes respon-sibility for the maintenance and development of the special Data Base needed for N* studiesin coupled channel analysis. This Project will be developed jointly with Hall B and EBAC.MSU personnel will also participate in the development of the pre-shower calorimeter, theHTTC and drift chambers under supervision of Hall B staff. At least 4 staff scientist and 5PhD and/or graduate students will be involved in base equipment development.
1.3 Rensselaer Polytechnic Institute
The RPI group is actively involved in this proposal using CLAS12 base equipment. PaulStoler is a member of the CLAS12 Steering Committee. Among the CLAS12 baseline equip-ment, our group has involved in the design, prototyping, construction and testing of the highthreshold and modification of the low threshold Cerenkov detector. Currently, Paul Stoleris serving as a coordinator for the collaboration of groups involved in the effort. ValeryKubarovsky is designing and building the apparatus for testing the prototype components.Two undergraduates Jason Sanchez and Stephanie Tomasulo, are spending the summer atJLab working respectively on prototype mirror fabrication and computer aided optics design
5

and simulation. The group will continue to be fully involved as needed. The group is cur-rently funded by NSF and RPI. Additional sources of funding will be sought as appropriate.
1.4 University of Connecticut
The University of Connecticut (UConn) group is actively involved in this proposal usingCLAS12 baseline equipment.
Among the CLAS 12 baseline equipment, our group has taken responsibility for the de-sign, prototyping, construction and testing of the high threshold Cerenkov counter (HTCC).One faculty member, one post-doc, four graduate students are already or will be workingat least part time on this project in the next few years. The University of ConnecticutResearch Foundation (UCRF) already funded $32,000 for the equipment purchase for theHTCC prototyping project. The University is also providing funding for a half postdoctoralsupport and a half graduate student support for the next two years for the our group’s JLabresearch activities. The group is currently funded by the U.S Department of Energy (DOE).Additional sources of funding will be sought as appropriate.
Beyond the baseline equipment, the group is also deeply involved in software planningand development for CLAS12. The group was recently awarded a DOE SBIR/STTR PhaseI grant with a software company, CyberConnect EZ to develop a software framework toarchive a large scale nuclear physics experiment data base
6

2 Introduction
Nucleons, and baryons in general, have played an important role in the development of thequark model and of QCD. The concept of quarks was first made manifest through the studyof baryon spectroscopy. For many years the properties of the ground state and the excitedstates of baryons had been treated in terms of isobars or constituent quarks. However,currently we are at the threshold of a new era in describing these states in terms of QCDdegrees of freedom. Recent QCD calculations on the lattice[6] show evidence for the ”Y-shape” color flux indicating a genuine 3-body force for baryons with stationary quarks asshown in Fig. 1. A dominant 2-body force would generate ∆-shape color flux. This 3-bodyforce is a unique feature of a 3-quark baryon system in QCD. Lattice simulations[7] also relatethe fundamental QCD Lagrangian to quark confinement potentials. So far ground and firstexcited flux tube potentials are available. These potentials are responsible for the formationof the ground state and a variety of excited nucleon states, and determine the behaviorof N∗ electromagnetic transition form factors as a function of the distance scale. In turn,the resonance transition form factors carry information that is sensitive to the underlyingpotential. In the proposed measurements we expect to obtain electromagnetic transitionform factors for the well established excited nucleon states with significant electromagneticcouplings in a wide range of photon virtualities, Q2.
Studying the nucleon ground state in elastic electron scattering allows us to determinethe charge and magnetic moment distribution in the nucleon. By exciting the nucleon intoresonant states through the transfer of energy and angular momentum and studying theirexcitation strength versus the distance scale we can expect to learn a great deal about theinterquark potential, and how confinement works in hadrons with 3 valence quarks. At this
17.5 20 22.5 25 27.5 30 32.5
6
8
10
12
14
16
18
20
Figure 1: Lattice QCD calculation of the 3D color flux distribution for a baryon. The calculationwas carried out to study the abelian color-flux distribution in a static 3-quark system. The ”Y-shape” configuration is evident, indicating the presence of a genuine 3-body force. The graphshows high density at the quark locations and in the center. The ∆-shaped flux configuration,characteristic of 2-body forces would have a depletion in the center.
7

point lattice simulations may be directly tested against the wealth of phenomenological dataon the internal N ∗ structure.
Nucleon resonances are clearly seen in inelastic inclusive structure functions off nucleonsin the entire kinematic range covered by existing measurements. Moreover, the Q2 evolutionof the non-resonant parts in inclusive structure functions may be described reasonably wellby QCD based approaches, while the evolution of the N ∗ excitation strength with Q2 stronglydepends on the quantum numbers of the excited state [11].
0 2 4 60.2
0.4
0.6
0.8
1
]2/c2 [GeV2Q
D /
3G* M
G
DMTSato-Lee (Bare)Sato-Lee (Dressed)BraunMaid 2003GPD
0 2 4 6
-5
0
(%)
EM
R
DMT
Sato-Lee
Maid 2003
0 2 4 6
-30
-20
-10
0
(%
)S
MR
DMTSato-Lee
Maid 2003
Ji
]2/c2 [GeV2Q
Figure 2: Left panel: The N∆(1232) transition form factor G∗M/3GD [110]. Right panels: The
ratios REM (upper panel) and RSM (lower panel) [110]. The data are from Jlab, Mami and Bates.
The CLAS12 detector, coupled with the unprecedented quality of the upgraded CEBAFbeam, will be the only facility worldwide capable of accessing the N ∗ transition form factorsin the unexplored domain of high Q2, from 4 to 14 GeV2.
In order to study nucleon excitations through the quark core we have to probe the nucleonat short enough distances where the quarks no longer appear “dressed” with qq pairs andact as effective degrees of freedom, or “constituent” quarks. In the language of dynamicalmodels with hadronic degrees of freedom, the quark “dressing” is usually referred to asthe nucleons “meson cloud”. The effect of the meson cloud on the nucleon’s response toelectromagnetic probes makes the interpretation of N∗ excitations in terms of the quarksubstructure ambiguous or model-dependent at best. In the following section we will argue,based on recent dynamical model calculations as well as on Lattice QCD calculations, andbacked up by empirical evidence, that currently available momentum transfers in electronscattering are insufficient to fully penetrate through the meson cloud to the nucleon’s quarkcore, and that the energy and momentum transfer available with the 12 GeV upgrade arerequired to obtain the necessary resolving power.
8
2.1 Penetrating the meson cloud
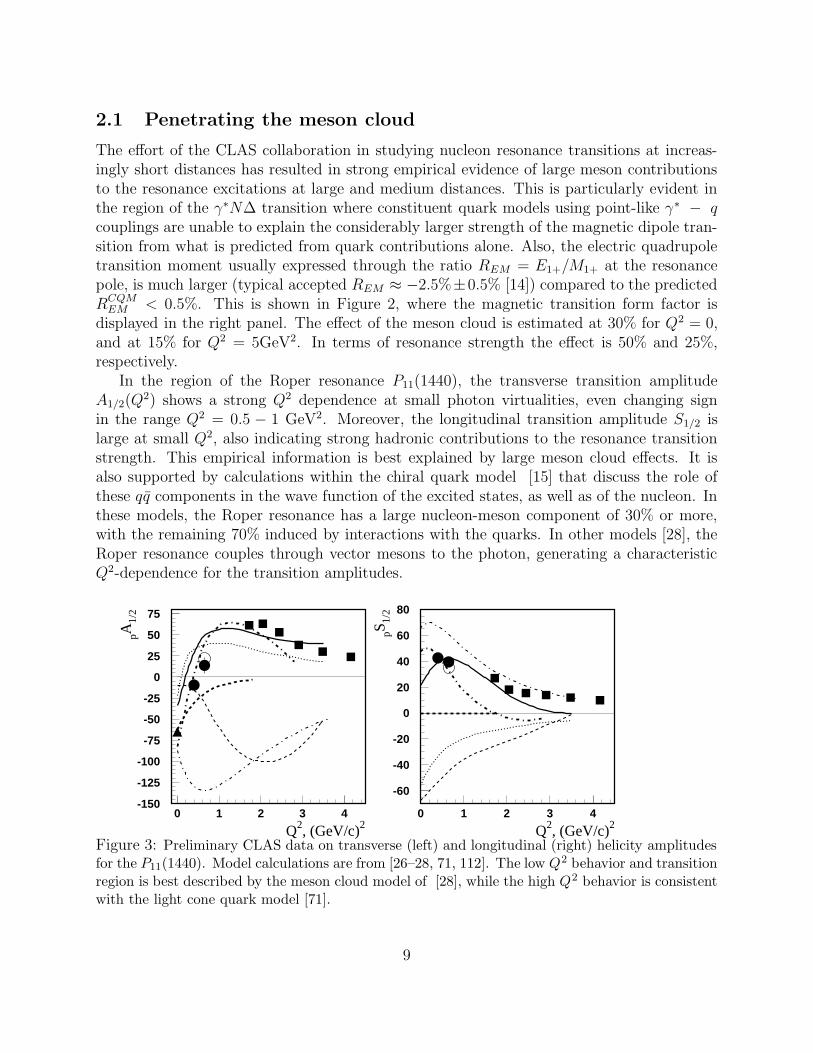
The effort of the CLAS collaboration in studying nucleon resonance transitions at increas-ingly short distances has resulted in strong empirical evidence of large meson contributionsto the resonance excitations at large and medium distances. This is particularly evident inthe region of the γ∗N∆ transition where constituent quark models using point-like γ∗ − qcouplings are unable to explain the considerably larger strength of the magnetic dipole tran-sition from what is predicted from quark contributions alone. Also, the electric quadrupoletransition moment usually expressed through the ratio REM = E1+/M1+ at the resonancepole, is much larger (typical accepted REM ≈ −2.5%±0.5% [14]) compared to the predictedRCQM
EM < 0.5%. This is shown in Figure 2, where the magnetic transition form factor isdisplayed in the right panel. The effect of the meson cloud is estimated at 30% for Q2 = 0,and at 15% for Q2 = 5GeV2. In terms of resonance strength the effect is 50% and 25%,respectively.
In the region of the Roper resonance P11(1440), the transverse transition amplitudeA1/2(Q
2) shows a strong Q2 dependence at small photon virtualities, even changing signin the range Q2 = 0.5 − 1 GeV2. Moreover, the longitudinal transition amplitude S1/2 islarge at small Q2, also indicating strong hadronic contributions to the resonance transitionstrength. This empirical information is best explained by large meson cloud effects. It isalso supported by calculations within the chiral quark model [15] that discuss the role ofthese qq components in the wave function of the excited states, as well as of the nucleon. Inthese models, the Roper resonance has a large nucleon-meson component of 30% or more,with the remaining 70% induced by interactions with the quarks. In other models [28], theRoper resonance couples through vector mesons to the photon, generating a characteristicQ2-dependence for the transition amplitudes.
-150
-125
-100
-75
-50
-25
0
25
50
75
0 1 2 3 4
Q2, (GeV/c)2
pA1/
2
-60
-40
-20
0
20
40
60
80
0 1 2 3 4
Q2, (GeV/c)2
pS1/
2
Figure 3: Preliminary CLAS data on transverse (left) and longitudinal (right) helicity amplitudesfor the P11(1440). Model calculations are from [26–28, 71, 112]. The low Q2 behavior and transitionregion is best described by the meson cloud model of [28], while the high Q2 behavior is consistentwith the light cone quark model [71].
9

The empirical evidence shows that the meson contributions are not only peripheral butextend to rather short distances although with decreasing strength. In the ∆(1232) regiondynamical hadron models that take meson effects into account show that the meson cloud stillplays an important though reduced role even at photon virtualities of Q2 > 5 GeV2 [24, 29].The transition amplitudes for the Roper seem to approach a quark-type behavior only at thehighest Q2 > 3 GeV2 achieved to date. However, even this conclusion is rather uncertain asthe displayed models do not include realistic form factor behavior at short distances. Forexample, there is now evidence that “constituent quarks” have a physical extension and thusrequire inclusion of form factors [16, 17] to explain the Q2 dependence of the photo-couplingamplitudes. Dynamical model calculations [38] for the S11(1650) in Fig. 16 show a strongeffect of the dressing, even changing sign of the amplitude.
Meson contribution, though large in some cases, cannot explain the transition amplitudesfully. Quarks play an essential role even at large distances. There is also no model calcula-tion available that can explain the measured transition form factors using only dynamicallygenerated resonances. Quenched Lattice QCD calculations, on the other hand, clearly showthe existence of excited states. In fact, the lower mass spectrum comes out quite well inthese calculations.
Figure 4: The dressed quark mass vs the momentum transfer from Lattice QCD and the Dyson-Schwinger Equation approach.
In some other cases, e.g. the S11(1535), meson contributions are predicted in the chiralquark model to be much less important than for the ∆(1232) or the Roper P11(1440) [30],and the empirically measured transition form factors show a harder, quark-like behavior,even at lower Q2.
For an experimental program to be able to study resonance transitions through the ex-citation of the quark core, we would need quantitative estimates about the “depth” of themeson cloud, and at what distances the interaction may become dominated by the quarkcore. To get at least a partial answer we look at the recent calculations within various the-oretical frameworks to measure the quark mass MQ at varying momentum transfer. This
10

-200
-100
0
100
200
300
0 0.5 1 1.5 2 2.5 3 3.5 4 4.5Q2 (GeV2)
Figure 5: Helicity amplitudes A1/2(Q2) scaled by Q3/1.0 (GeV 2) for the Roper P11(1440) (tri-
angles), S11(1535) (circles), D13(1520) (squares), and F15(1680) (starts). At the highest Q2 thedependence is consistent with a flat behavior.
quantity is well defined in Lattice QCD as well as in other approaches, e.g. the Dyson-Schwinger Equation (DSE) approach [12], and in the instanton framework [18]. A represen-tative compilation is presented in Figure 4, which shows the mass of a single quark versusthe momentum transfer to that quark. We see that the typical constituent quark mass of300 MeV/c2 is approached at q = 0 momentum transfer. The mass is reduced slowly withincreasing momentum transfer. At q = 0.9 GeV/c the quark mass is still 100 MeV/c2, or1/3 of the fully “dressed” mass at zero momentum transfer.
Note, that we are dealing here with the momentum transfer to a single quark. For a3-quark baryon it would appear that on average about 3 times that momentum transferwill be needed, and measurements in the range of Q2 = 5 − 10GeV2 should enable us tostudy the transition from the ”dressed” hadron to the valence quark interior. This is justoutside the kinematics reach achievable with the current CEBAF machine, but appears tobe ideally accessible with the 12 GeV upgrade and the CLAS12 spectrometer. In Figure 5we show the recent results from the analysis of the CLAS data on ~ep → enπ+ in termsof leading, helicity-conserving helicity A1/2 amplitudes to the excitation of the P11(1440),D13(1520), S11(1535), and F15(1680). The amplitudes are multiplied by Q3, the expecteddependence for a point-like coupling to the quarks in the nucleon. We see that the quantityQ3 · A1/2(Q
2) is consistent with a constant behavior for all resonances and for the highestQ2, an encouraging sign that “asymptotia” for resonance excitations may be reached withthe CEBAF 12 GeV energy upgrade.
11

2.2 Other directions in N ∗ studies with CLAS12
2.2.1 GPDs and Baryon Transition Form Factors
An important breakthrough has been the development of the formalism of generalized partondistributions (GPD) [82, 95, 102], which offers a unified framework for accessing the complexstructure of hadrons through a variety of exclusive reactions, and promises to yield, for thefirst time, a truly three-dimensional description of hadrons. Form factors give essential con-strains for the GPDs and provide different complementary insights into the unified nucleonstructure underlying all exclusive reactions at high momentum transfer in general, and formfactors, including nucleon elastic and transition form factors in particular. The role of GPDsin transition form factors has been discussed in Refs. [22], [23] and [109].
Form factors are related to the first moments of GPDs. For elastic scattering from aproton, with t = −Q2, the Dirac and Pauli form factors are written:
F1p(t) =∫ 1
−1
∑
q
eqHqp(x, ξ, t)dx F2p(t) =
∫ 1
−1
∑
q
eqEqp(x, ξ, t)dx
where q signifies quark flavors, and for brevity the GPDs are denoted H q(x, t) ≡ Hq(x, 0, t),and Eq(x, t) ≡ Eq(x, 0, t). A similar relation holds for neutrons.
Resonance transition form factors access components of the GPDs which are not accessedin elastic scattering. For example, the N → ∆ form factors, in the large Nc limit are relatedto isovector components of the GPDs [23] [22];
2G∗M =
∫
HM(x, t)dx ∝∫
E(IV )M (x, t)dx
Thus, the falloff with Q2 of the N → ∆ form factor F2p [114] is shown [109] to be relatedto the isovector structure of the elastic form factors. This is an area of physics which isundergoing rapid development, and It is expected that analogous GPD relationships can beobtained for the N → S11 and other transitions.
2.2.2 The Q2 Evolution of N* Structure
Comprehensive data on the evolution of N ∗ electrocouplings with Q2 will provide a hostof possibilities to examine the internal structure of the nucleon. For example, it will allowus to access the structure of excited nucleon states in terms of the contributing 3-quarkconfigurations at various distance scales. It is well known that the N ∗ electrocouplings canbe related to transition matrix elements between the ground nucleon state and the 3-quarkconfigurations, contributing to N ∗ wave function as:
A1/2,3/2 =∑
i
αN∗
ii< 3q | T | g.s. >, (1)
where αN∗
i represent relative contributions from various 3-quark configurations. αN∗
i mixingcoefficients may be fitted to the data on N ∗ electrocouplings in a case, if the values oftransition matrix elements in Eq.(1) are available.
12

Analysis of CLAS data on single and double pion electroproduction showed, that withtransition matrix elements estimated within the Single Quark Transition Model (SQTM)approach [132], a reasonable fit of the N ∗ electrocouplings can be achieved. In Fig. 30 wecompare the CLAS data on N ∗ electrocouplings obtained from the analysis of 2π electro-production [142] with the SQTM fit, shown by the area between the red lines.This exampleillustrates the capability to access the structure of excited states in terms of the underlying3q configurations.
The contributions from various 3q configurations are determined by the dynamics of theinteractions, which also causes their mixing. Information on mixing coefficients will allowus to establish the relative importance of the one-gluon-exchange (OGE) contribution, andthe one-pion-exchange (OPE) contribution [138] at various distances. From this we canestablish how mechanisms responsible for quark configuration mixing evolve from the softregime, which may be affected considerably by OPE, to the partonic regime with graduallyincreasing OGE contributions.
The proposed approach to access N ∗ structure is rather flexible and does not rely uponSQTM assumptions. The transition matrix elements in Eq.(1) may be evaluated, usingtransition operator and contributing 3q configurations taken from any quark model. Butthe mixing coefficients will be treated as free parameters and fitted to the measured N ∗
electrocouplings. If a reasonable data description is achieved, the mixing coefficients willgive us information on the internal N ∗ structure. Free variation of mixing coefficients makeour approach different from any quark model, where mixing coefficients are fixed, based onassumptions in the specific Hamiltonian used in the model. Instead, our approach representa phenomenological way to access N ∗ structure from the analysis of the N ∗ electrocouplings,and is not restricted by any particular assumption on the Hamiltonian. The information onN∗ structure derived in phenomenological analysis may be used as input to determine theunderlying Hamiltonian. In particular, it will be most interesting to try to obtain access tothe confinement potential. Since the transition matrix elements in Eq.(1) are determined byparameters of the confinement potential, we may fit them simultaneously with the mixingcoefficients to the N ∗ electrocouplings. The information obtained from these fits may bedirectly confronted with lattice predictions for the confinement potential. In this way wemay check fundamental QCD expectations on the binding mechanisms that is responsiblefor the formation of baryons.
To provide access to the N ∗ Hamiltonian, comprehensive data on N ∗ electrocouplings ina wide Q2 range covered by CLAS12 are needed.
2.3 Expected data base and analysis approaches
This proposal is aims to measure the evolution of the transition form factors to the excitednucleon quantum states over a range of Q2 from 4.0 to 14 GeV 2. We expect that there willbe a contemporaneous evolution in the theoretical tools for describing the evolution fromthe long range to the short range structure of these nucleon quantum states.
We propose to determine Q2-evolution of electrocouplings for N ∗ states with masses less
13

than 3 GeV, including possible new baryon states, from the analysis of two major exclusivechannels: ep → epπ0, ep → enπ+, and ep → epπ+π− (ep → epη will be measured as well).All channels will be measured simultaneously with CLAS12. An extensive data base for N ∗
studies will be created from the proposed measurements.For the π+n and π0p channels the following observables will be measured in each W and
Q2 bin:
• complete azimuthal and polar angular distributions for π+, π0
• polarized beam asymmetries Ae
Data on π−π+p production for each W and Q2 bin will consist of:
• π−π+, π+p, π−p invariant mass distributions
• π+, π−, p cm-angular distributions
• 3 distributions over angles between two planes, composed by two pairs of 3-momentaof the final hadron for 3 various choices of hadron pairs
Overall 18 observables in each bin will be available to evaluate the N ∗ electrocouplings in acombined analysis of single and double pion production.
In the first stage, the N ∗ electrocouplings will be extracted in fits to the 1π and 2πchannels combined, but neglecting their mutual couplings. Phenomenological approacheshave been developed for that purpose [36, 142]. These two approaches will be appliedseparately for the two channels, however all data will be fitted with a common set of N ∗
electrocouplings. Successful fit of all observables in two major exclusive channels will provideinitial information on N ∗ electrocouplings. A final evaluation of N ∗ electrocouplings will becarried out within the framework of the most advanced coupled channel approach, which isnow under development within the Excited Baryon Analysis Center (EBAC) at the JLabTheory Center. This approach is discussed in detail in Sect. 4.2-4.5. From such a procedurewe expect reliable results on N ∗ electrocouplings. Moreover, the result of this analysis willhave strong impact on N ∗ studies in all other exclusive channels. Single and double pionproduction, being major contributors, should affect considerably all other exclusive reactionsthrough channel couplings.
The next three sections describe in more detail the basic motivation for for studying theproperties of baryon resonances over a large range of Q2. Section 2 deals with single mesonelectroproduction, which historically has been the subject of most in-depth work. Section 3then discusses two meson electroproduction, and its potential for augmenting single mesonproduction as an equal partner in the expanded experimental program. Section 4 thenexplores the most vital question of what we will do with this plethera of data forthcomingfrom the experimental program. That is, how we will put it all together in a coupled channelapproach to extract the photo-couplings for the individual N* resonances.
14

3 Single Pion Exclusive Channels
A large portion of the nuclear physics community enthusiastically started to investigatebaryon resonances as new optimized detector systems with large solid angle and momentumcoverage like CLAS and new high-intensity continuous electron beams like at JLab becameavailable. The high versatility of the provided electromagnetic probes that have negligibleinitial state interactions have produced intriguing results ever since. It was realized thatisoscalar or isovector, and the electric, magnetic or longitudinal character of the couplingto hadronic matter probe different aspects of the strong interaction. However, the desiredversatility of the electromagnetic probe comes with the complication that it mixes all thedifferent coupling amplitudes simultaneously into the measured cross sections. A way outhas been successfully demonstrated in the case of the N → ∆(1232) transition, where thesmall resonant electric REM and scalar quadrupole RSM amplitudes could be extracted withrespect to the dominant magnetic dipole amplitude with absolute systematic uncertaintiesof typically 0.5% [13, 80, 84], see Fig. 2 at intermediate momentum transfers 0.2GeV 2 ≤Q2 ≤ 1.0GeV 2. To obtain such precision results for the extraction of isolated resonanceparameters, additional isospin channels and polarization observables had been measured todisentangle the individual resonant and non-resonant coupling amplitudes [77, 86, 89]. Asimilar precision of REM ≈ −2.5% ± 0.5% [14] was achieved in photo-production for aneven more complete set of observables, and the fundamental approach of how to peform acomplete experiments in pseudoscalar photo-production is described in [90].
Several very recent [97, 110] results from e1-6 run period 1 at an electron beam energyof 5.75GeV are reshaping the understanding of nucleons, and nucleon excitations and arepresenting new opportunities in a way that demands an extension of this successful programbased on the experience and knowledge already gained at JLab.
One of these results is the extension of the N → ∆(1232) transition form factors to highermomentum transfers [110], where pQCD predicts in the high Q2 limit, by neglecting highertwist contributions, a REM of +1, a Q2 independent RSM , and a 1/Q4 fall-off of G∗
M . Theexperimental results, now available up to 6GeV 2, as shown in Fig. 2, reveal no indication ofthe predicted behavior in any of the three cases, but rather follow the same overall trend asestablished in the non-perturbative regime. This is particularly striking in the case of themagnetic N → ∆(1232) transition form factor G∗
M , where the simple constituent countingrule would demand the 1/Q4 dipole form; as well as in the case of the REM , that is definedby the helicity conserving amplitude A1/2 and the helicity non-conserving amplitude A3/2,
REM =A 1
2
− 1√3A 3
2
A 1
2
+√
3A 3
2
(2)
where the simple argument of helicity conservation at high momentum transfers demandsA3/2 A1/2, which directly leads to the prediction of REM = +1.
1Proposal E99-107: “N∗ Excitations at High Q2 in the pπ0, pη, and nπ+ Channels”
15
-120
-100
-80
-60
-40
-20
0
20
0 1 2 3 4Q2 (GeV2)
A1/
2 (1
0-3G
eV-1
/2)
D13(1520)-25
0255075
100125150175200
0 1 2 3 4Q2 (GeV2)
A3/
2 (1
0-3G
eV-1
/2)
D13(1520)
-120-100
-80-60-40-20
020406080
0 1 2 3 4Q2 (GeV2)
S 1/2
(10-3
GeV
-1/2
)
D13(1520)-1
-0.75
-0.5
-0.25
0
0.25
0.5
0.75
1
0 1 2 3 4Q2, (GeV/c)2
A_hel
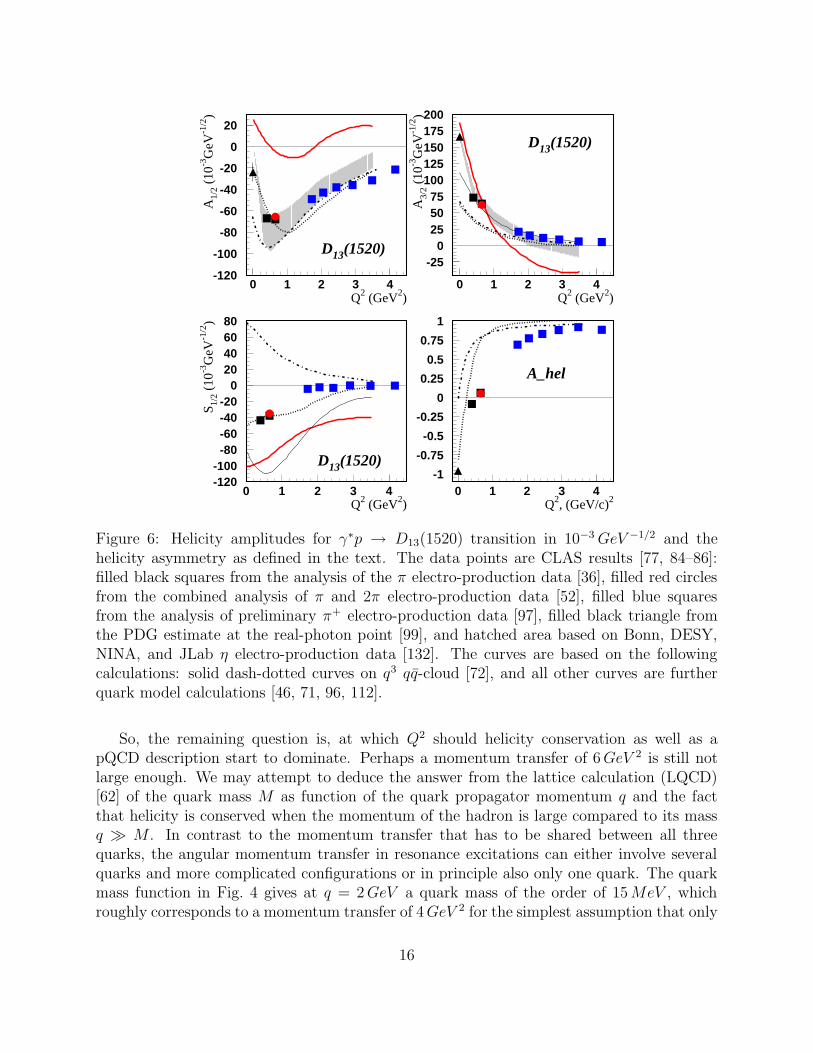
Figure 6: Helicity amplitudes for γ∗p → D13(1520) transition in 10−3GeV −1/2 and thehelicity asymmetry as defined in the text. The data points are CLAS results [77, 84–86]:filled black squares from the analysis of the π electro-production data [36], filled red circlesfrom the combined analysis of π and 2π electro-production data [52], filled blue squaresfrom the analysis of preliminary π+ electro-production data [97], filled black triangle fromthe PDG estimate at the real-photon point [99], and hatched area based on Bonn, DESY,NINA, and JLab η electro-production data [132]. The curves are based on the followingcalculations: solid dash-dotted curves on q3 qq-cloud [72], and all other curves are furtherquark model calculations [46, 71, 96, 112].
So, the remaining question is, at which Q2 should helicity conservation as well as apQCD description start to dominate. Perhaps a momentum transfer of 6GeV 2 is still notlarge enough. We may attempt to deduce the answer from the lattice calculation (LQCD)[62] of the quark mass M as function of the quark propagator momentum q and the factthat helicity is conserved when the momentum of the hadron is large compared to its massq M . In contrast to the momentum transfer that has to be shared between all threequarks, the angular momentum transfer in resonance excitations can either involve severalquarks and more complicated configurations or in principle also only one quark. The quarkmass function in Fig. 4 gives at q = 2GeV a quark mass of the order of 15MeV , whichroughly corresponds to a momentum transfer of 4GeV 2 for the simplest assumption that only
16

a single quark absorbs the angular momentum introduced by the virtual photon. Here thecondition for helicity conservation would definitely be fulfilled, but it would gradually breakdown for q ≤ 1GeV , where quark mass steeply increases with decreasing quark momentum.These arguments lead to the prediction that for resonances that conserve angular momentumon the single quark level the helicity conserving amplitude A1/2 should dominate the helicitynon-conserving amplitude A3/2 at Q2 ≥ 1GeV 2. This predicted behavior is indeed clearlyvisible for the D13(1520) helicity amplitudes and helicity asymmetry
Ahel =A2
1
2
− A23
2
A21
2
+ A23
2
(3)
in Fig. 6 [97]. The tremendous difference between the results for Ahel in the D13(1520) andREM in the ∆(1232), both based on the same fundamental principle of helicity conservation,marks the unexplored range between the simplest and probably most involved momentumtransfer dynamics that can be studied in the proposed experiment.
Interestingly, it has been suggested [98] that the N → ∆ may really not be the easiestplace to search for the onset of pQCD, since there may be an accidental cancellation betweenthe pQCD amplitudes involving the symmetric and antisymmetric part of the proton quarkdistribution amplitude coupling to the purely symmetric distribution amplitude of the ∆.
It is therefore not only important to extend these measurements of the N → ∆(1232)transition form factors to even higher momentum transfers, but also to investigate the Q2
evolution of exclusive transition form factors to other higher lying resonances.The most recent results for the reaction γ∗p→ nπ+ [97], as already referred to in Figs. 3
and 6 have been obtained in an analog procedure to the one proposed here and describedin chapter 6 and 7. Since especially the Roper(1440) resonance parameters have alwaysbeen notoriously hard to extract, the variety of different theoretical approaches to describethem is extensive and includes q3, q3 + qq cloud, and q3 + g hybrid quark models as well asdynamical generating and N+σ molecule models, see Fig. 3. The presented helicity couplingamplitudes for the higher lying resonances P11(1440), S11(1535), D13(1520), and F15(1680),that have been extracted up to 4.5GeV 2, illustrate the quality of the new results and showthat none of the present model calculations is able to describe neither magnitude nor Q2
trend of these helicity amplitudes of all four resonances consistently.Still maybe the most interesting new result is that here, as well as in the two-pion
production channel, many resonances are easier to isolate at higher Q2 than at or closeto the real photon point. Fig. 7 demonstrates how dramatically the resonance behaviorof the real and the imaginary part of the resonant multipole amplitudes are enhanced athigher Q2, where E0+ is the dominating resonant multipole of the S11(1535) and M1− ofthe P11(1440). The shown resonant multipole amplitudes at the real photon point reflectthe difficulties of isolating the Roper resonance, which even does not produce a peak in theinclusive cross section (see Fig. 18), and the S11(1535), which had to be investigated in the ηproduction channel to allow a clean separation from neighboring resonances and backgroundcontributions.
17

-0.5
0
0.5
1
1.5
2
2.5
1.2 1.4 1.6 1.8 2
E0+ nπ+
Q2=0
-0.6
-0.4
-0.2
0
0.2
0.4
0.6
0.8
1.2 1.4 1.6 1.8 2
M1- nπ+
Q2=0
-0.3
-0.2
-0.1
0
0.1
0.2
0.3
0.4
0.5
0.6
1.2 1.4 1.6 1.8 2
E0+ nπ+
Q2=3GeV2
W, GeV
-0.4
-0.35
-0.3
-0.25
-0.2
-0.15
-0.1
-0.05
0
0.05
1.2 1.4 1.6 1.8 2
M1- nπ+
Q2=3GeV2
W, GeV
Figure 7: Pion production multipole amplitude M1− (E0+) that contributes dominantly tothe P11(1440) (S11(1535)) resonance for Q2 = 0 (upper panels) and Q2 = 3GeV 2 (lowerpanels). Black curves: total amplitudes, red curves: background, solid curves: imaginarypart, and dashed curves real part of the amplitudes.
Since many resonances become more visible and easier to investigate at higher Q2, we notonly propose to extend the study of the shown ∆(1232), P11(1440), S11(1535), D13(1520),and F15(1680) resonances up to Q2 = 12GeV 2, but also propose to extend the scope toidentify further resonances to the full invariant mass region 1.0GeV ≤ W ≤ 4.5GeV . Thisexperiment should at least enable us to investigate the peak structure beyond the F15(1680)resonance, as seen in the inclusive cross section data set in Fig. 18, and has the potential tofind further resonances, which as the Roper(1440) do not exhibit any peak structure in anyof the Q2 panels of Fig. 18.
18

4 Double Charged Pion Exclusive Channel
The studies of double pion production by real and virtual photons [115–123, 125–128] clearlydemonstrate the capability of this exclusive channel to provide important information onN∗ electrocouplings and hadronic decay parameters for most excited proton states. Theinformation on N ∗ parameters extracted from 2π electroproduction is complementary tothat obtained in the single pion channel. While the single pion channel is sensitive mostly toN∗ in the mass range less than 1.7 GeV [19], the two-pion channel exhibits the contributionsfrom both low lying (M<1.6 GeV) and high lying (1.6<M<3.0 GeV) N ∗ states. Most ofthe high lying excited proton states have substantial, even dominant two-pion decays [129].Thus, two-pion channel offers a promising way to obtain comprehensive data on Q2-evolutionof electromagnetic form factors for most excited proton states.
The information from double pion exclusive channels is necessary to access electrocou-plings and hadronic parameters of the S31(1620), D13(1700), and D33(1700) states of the[70,1−]-plet and almost all states which belong to the [56,2+]-plet. Various quark modelpredictions [71, 130, 131] are available for the description of N ∗ electrocouplings, includinghigh lying states. They are complemented by general schemes based on underlying driv-ing symmetries, which allow us to relate N ∗ electrocouplings within particular symmetrymultiplets [112, 132, 133]. These approaches provide good bases for developing a physicsanalysis framework for relating new data on N ∗ electrocouplings in an unexplored area of Q2
at distances corresponded to the transition from soft to partonic regimes. In particular wemay study the relative contributions from the meson cloud, quark clusterization (di-quarks)and the 3-quark core at various distance scales[31, 134, 135]. Comprehensive information onN∗ electrocouplings may allow us to investigate the relative contributions from OGE andOPE mechanisms at various distance scales from soft to partonic regimes [138]. Anotherinteresting opportunity may be the possible observation of the leading symmetry evolutionfor quark binding forces. Such evolution is actually required by chiral symmetry restorationfor the entire spectrum of nucleon excitation at some still undetermined high Q2, for whichthe momentum transfer for a single constituent is significantly larger than the basic QCDscale Λ2
QCD [139].Double pion electroproduction offers the most promising way to study N ∗s in the mass
range from 2.0 to 3.0 GeV. According to the data from experiments with hadronic probes[129] as well as quark model expectations [140], these heaviest N ∗ should mostly manifesttheirselves in two-pion exclusive channels. The studies of these particular N ∗s will allow theinvestigation of possible chiral symmetry restoration for highly excited nucleon states, pre-dicted in [139, 141]. Moreover, the quark models dealing with various effective constituents(3-quarks or quark di-quark configurations) [71, 130, 136, 137] predict still unobserved, so-called ”missing”, baryon states. Such resonances are decoupled from the single-pion decaychannel and likely may be observed in two-pion electroproduction.
The heaviest N ∗s, accessible primarily in two-pion electroproduction, have the largestangular momenta and correspond to maximal radial excitations. Therefore, their studieswill shed light on evolution of N ∗ binding forces with orbital momenta and radial quantum
19

numbers.Recent lattice studies of 3-quark confinement potentials [7] show that the energy gap
separating the ground state potential and the potential built on the first excited flux tubestate, is of order 1.0 GeV. This lattice result explained the success of the quark models indescribing the nucleon resonances with excitation energy lower than 1.0 GeV, neglectingglue-gluon degrees of freedom. Constituent quark excitation energies are on the order ofhundreds of MeV, which is much smaller, than the energy corresponding to excitation offlux tubes. On the other hand, the structure of heavy resonances with masses above 2.0GeV may be considerably affected by flux tube excitations. According to Ref. [7] suchhybrid configurations represent collective excitation of all three flux tubes and all threequarks. Such highly collective excitations should posses very peculiar features for theirelectromagnetic form factor behavior. Furthermore, these collective hybrids would likelydecay with multi-pion emission. Therefore, particular features in the electromagnetic formfactor behavior in a wide Q2 involving the two-pion channel offers a promising way to discoverhybrid states at masses above 2 GeV.
20

5 Combined Studies of Various Exclusive Channels
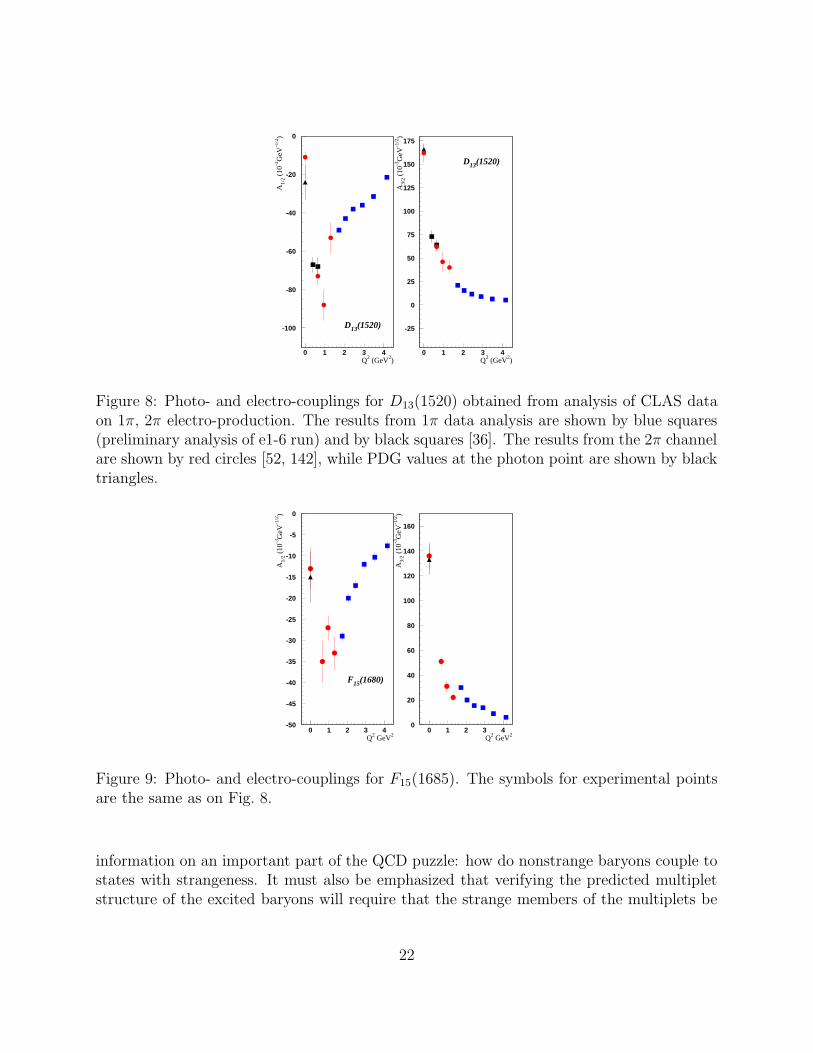
Individual 1π and 2π channel analyses [50, 51, 142] of the CLAS data with a 6.0 GeV beamalready have provided information on the Q2 evolution of N ∗ electrocouplings. For the firsttime data onN ∗ electrocouplings were obtained in an extremely wide range ofQ2 up to about5 GeV 2. Electrocouplings for D13(1520) and F15(1685) states extracted from the CLAS dataare shown on Fig. 8 and Fig. 9. In the short term 2π electro-production cross-sections fromthe e1-6 run will be available in the entire N ∗ excitation region at photon virtualities from1.6 to 5.0 GeV 2.
The CLAS12 detector will offer a unique opportunity to study N ∗ in all exclusive channelssimultaneously at high Q2. Experience in N ∗ studies clearly demonstrates the importanceof the combined analysis of various exclusive channels to obtain reliable information aboutresonance electro-couplings and hadronic decay parameters. In the proposed experimentswe are focusing on combined studies 1π and 2π electro-production off protons.
The combined analysis of 1π and 2π exclusive electro-production off protons is absolutelynecessary for the reliable evaluation of N ∗ electromagnetic form factors. The credible sep-aration between resonant and non-resonant mechanisms represents a challenging problemfor any approach used for extraction of the N ∗ electro-couplings. The current status ofunderstanding strong interactions in the non-perturbative domain, makes it is impossibleto estimated the non-resonant part based on fundamental theory. Also phenomenologicalanalyses, even for the data of the highest quality, do not allow us to disentangle the resonantand non-resonant parts in model a independent way, especially when their contributions arecomparable.
Such a situation is most common in N ∗ analysis at invariant masses of the final hadronicsystem W>1.5 GeV. An effective way to insure credible separation between resonant and non-resonant mechanisms may indeed be the combined analysis of 1π and 2π channels which ac-count for the major part of the total virtual photon cross-section in the N ∗ excitation region.Furthermore, the two channels have entirely different non-resonant mechanisms. Therefore,the successful description of all observables measured in 1π and 2π electro-production offprotons with a common set of N ∗ electro-couplings and hadronic parameters would providereliable separation between the resonant and non-resonant contributions in both exclusivechannels. A successful description of all observables in 1π and 2π channels with a commonset of N∗ electro-couplings and hadronic parameters was achieved in a combined analysisof CLAS data at Q2 = 0.65GeV 2 [52], providing strong support for phenomenological ap-proaches [50, 51, 142] in CLAS data analysis. However, in this combined fit, particularmodels for analysis of 1π and 2π data were applied separately and independently. Currently,an effort coordinated by EBAC is underway, which will be capable of taking into accountinteractions between these two major electro-production channels within the framework ofa rigorous coupled channel formalism (Chapt. 5.2-5.5)
Using electromagnetic beams, a number of channels can and must be explored. Theexcited states of the nucleon and ∆ may be examined in channels such as Nπ, Nππ, Y K,Nη, Nω and Nη′. The final states that include the ground state hyperons and kaons provide
21
-100
-80
-60
-40
-20
0
0 1 2 3 4Q2 (GeV2)
A1/
2 (1
0-3G
eV-1
/2)
D13(1520)
Q2 (GeV2)
A3/
2 (1
0-3G
eV-1
/2)
D13(1520)
-25
0
25
50
75
100
125
150
175
0 1 2 3 4
Figure 8: Photo- and electro-couplings for D13(1520) obtained from analysis of CLAS dataon 1π, 2π electro-production. The results from 1π data analysis are shown by blue squares(preliminary analysis of e1-6 run) and by black squares [36]. The results from the 2π channelare shown by red circles [52, 142], while PDG values at the photon point are shown by blacktriangles.
-50
-45
-40
-35
-30
-25
-20
-15
-10
-5
0
0 1 2 3 4Q2 GeV2
A1/
2 (1
0-3G
eV-1
/2)
F15(1680)
Q2 GeV2
A3/
2 (1
0-3G
eV-1
/2)
0
20
40
60
80
100
120
140
160
0 1 2 3 4
Figure 9: Photo- and electro-couplings for F15(1685). The symbols for experimental pointsare the same as on Fig. 8.
information on an important part of the QCD puzzle: how do nonstrange baryons couple tostates with strangeness. It must also be emphasized that verifying the predicted multipletstructure of the excited baryons will require that the strange members of the multiplets be
22

identified. This means that channels such as NKK, Y Kπ, Y Kη and ΞKK must also beexploited.
The Jlab 12GeV upgrade and CLAS12 are uniquely suited to carry out a cohesive pro-gram of exclusive measurements extending the momentum transfers toward the region wherepQCD effects become visible. In contrast to conventional experiments employing magneticspectrometers that focus on specific excitations at specific kinematics, CLAS12 allows thesimultaneous measurement of angular distributions over a wide range of W and Q2 for manyexclusive channels, including not only single-meson production processes, such as π, η, andK, but also multi-meson final states.
5.1 Coupled-Channel Analysis
One of the primary activities of the N* program at JLab is to develop a sound basis for thereliable extraction of the resonance electro-production amplitudes. The required concertedtheoretical effort has already begun with the formation of the Excited Baryon AnalysisCenter (EBAC). It is well recognized that that this effort will require a coupled channelapproach involving all final state channels, including one and two meson production.
The necessity for performing a coupled-channel analysis of the data obtained from theseand other experiments stems essentially from the unitarity condition. For the specific caseof pion photo-production, the effect of the unitarity condition on the analysis that can becarried is illustrated in Fig. 10. In this figure, the dashed lines are the imaginary part ofthe non-resonant amplitudes obtained if the unitarity condition is ignored, while the solidcurves just above or below the dashed lines result when this condition is properly taken intoaccount.
5.2 Development of Dynamical Coupled-Channel Analysis at EBAC
The Excited Baryon Analysis Center (EBAC) was established at Jefferson Laboratory (JLab)in January, 2006. The objective is to develop theoretical approaches to extract and alsointerpret the nucleon resonance (N ∗) parameters by using the very extensive JLab data ofelectromagnetic production of pseudoscalar mesons, π, η, K, and also two pions.
The team members are Bruno Julia-Diaz (University of Barcelona), T.-S. Harry Lee(Argonne National Laboratory), Akihiko Matsuyama (Shizuoka University), Mark Paris(EBAC), and Toru Sato (Osaka University). Harry Lee, serving as the Leading Investigatorof EBAC, is coordinating the effort. All members of this team have extensive experiences inperforming large-scale numerical calculations, as seen, for example, in their publications[32–35].
The starting point of this effort is the Argonne-Osaka-Shizuoka (AOS) model[31] whichhas been developed in the past three years by three members of this team. Most of thecomputation codes needed for performing dynamical coupled-channel calculations with γN ,πN , ηN , ππN (π∆, ρN , σN) channels have been developed. As illustrated in Fig.11, thecurrent computation codes for the AOS model already can give a reasonable account of the
23
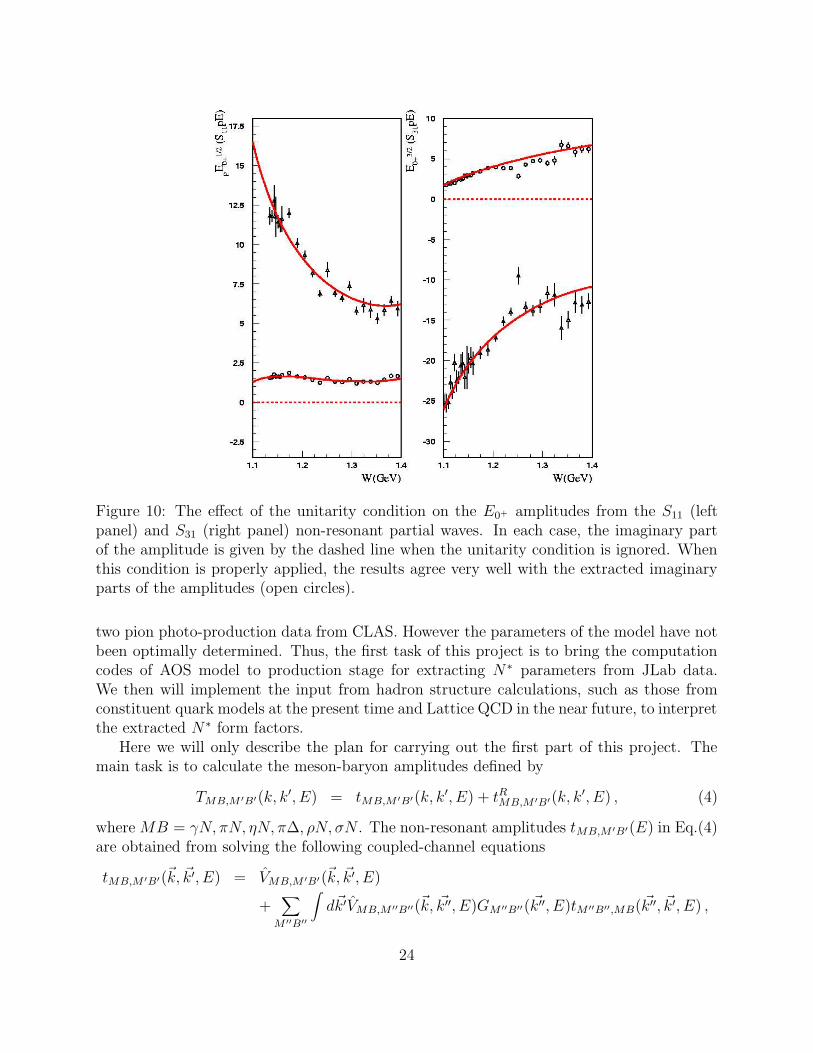
Figure 10: The effect of the unitarity condition on the E0+ amplitudes from the S11 (leftpanel) and S31 (right panel) non-resonant partial waves. In each case, the imaginary partof the amplitude is given by the dashed line when the unitarity condition is ignored. Whenthis condition is properly applied, the results agree very well with the extracted imaginaryparts of the amplitudes (open circles).
two pion photo-production data from CLAS. However the parameters of the model have notbeen optimally determined. Thus, the first task of this project is to bring the computationcodes of AOS model to production stage for extracting N ∗ parameters from JLab data.We then will implement the input from hadron structure calculations, such as those fromconstituent quark models at the present time and Lattice QCD in the near future, to interpretthe extracted N ∗ form factors.
Here we will only describe the plan for carrying out the first part of this project. Themain task is to calculate the meson-baryon amplitudes defined by
TMB,M ′B′(k, k′, E) = tMB,M ′B′(k, k′, E) + tRMB,M ′B′(k, k′, E) , (4)
where MB = γN, πN, ηN, π∆, ρN, σN . The non-resonant amplitudes tMB,M ′B′(E) in Eq.(4)are obtained from solving the following coupled-channel equations
tMB,M ′B′(~k, ~k′, E) = VMB,M ′B′(~k, ~k′, E)
+∑
M ′′B′′
∫
d~k′VMB,M ′′B′′(~k, ~k′′, E)GM ′′B′′( ~k′′, E)tM ′′B′′,MB( ~k′′, ~k′, E) ,
24

1 1.2 1.4 1.6 1.8 2Mπ+ p
(GeV)
0
50
100
150
200
250
300
dσ/d
Mπ+
p (µb
/GeV
)
W =1.88 GeV
0.2 0.4 0.6 0.8 1Mπ+ π− (GeV)
0
50
100
150
200
dσ/d
Mπ+
π− (µ
b/G
eV)
W = 1.88 GeV
1 1.2 1.4 1.6 1.8 2Mπ−p
(GeV)
0
50
100
150
200
dσ/d
Mπ−
p (µb
/GeV
)
W = 1.88 GeV
Figure 11: The differential cross sections of of γp → π+π−p reaction with respect to theinvariant mass Mπ+p (left), Mπ+π− (center), and Mπ−p (right) at W=1.88 GeV. The dataare from CLAS.
(5)
where GMB(k, E) is the meson-baryon propagator, and the driving term is
VMB,M ′B′(~k, ~k′, E) = vMB,M ′B′(~k, ~k′) + Z(E)MB,M ′B′(~k, ~k′, E) . (6)
The matrix elements vMB,M ′B′(~k, ~k′) of the non-resonant interactions, defined by the meson-exchange mechanisms, are finite and integrable. The complication in solving Eq.(5) is
from the one-particle-exchange term Z(E)MB,M ′B′(~k, ~k′, E) which diverges logarithmically in the
moon-shape regions illustrated in left side of Fig.12. The rapidly varying structure of theirmatrix elements, as illustrated in the right side of Fig.12, needs to be carefully accountedfor in solving Eq.(5). In particular, its imaginary part (dashed line) has a discontinuousstructure and is non-zero only in a narrow region.
0
200
400
600
0 200 400 600
p’[M
eV]
p[MeV]
W=1.88GeV
π∆ − π∆
ρ Ν − π∆
N
π
∆
ρ,σ
∆
πp’
p- p’
- p
-0.2
-0.1
0
0.1
0.2
0 200 400 600 800
Z
p[MeV]
p’=300MeV
ReIm
Figure 12: Left side : Singularity structure of the driving terms Z(E)π∆,π∆ and Z
(E)ρN,π∆ at
W=1.88 GeV. Right side: The half-off-shell matrix element of Z(E)π∆,π∆(p, p′,W ) with p′ =
300 MeV/c and W=1.88 GeV.
25

Hadronic dressing for N ∗ electromagnetic verticies and propagators, due to interactionwith open MB channels are schematically presented in Fig. 13, Fig. 14.
+ ΣM, B
M
B
M
B
M
B
B*N
N*M
/
/ /N*
~*NMB
Γ ΓMB N*
ΓM B *N
/ /
/
Figure 13: N ∗ electromagnetic verticies: bare (points) and dressed due to coupled channeleffects (blobs).
ΣD M,B B
M,BM,BGG
δij N
M
−1 0(E−M )*
Figure 14: N ∗ propagators: bare (thin lines) and dressed due to coupled channel effects(thick lines).
The resonant term of Eq.(4) is
tRMB,M ′B′(k, k′E) =∑
N∗
i,N∗
j
ΓMB→N∗
i(k′, E)[D(E)]i,jΓN∗
j→M ′B′(k, E) , (7)
with the dressed vertex interaction defined by
ΓMB→N∗(E, k) = ΓMB→N∗(k) +∑
M ′B′
∫
d~k′tMB,M ′B′(~k, ~k′, E)GMB(k′, E)ΓM ′B′→N∗(k′) , (8)
and the N∗ propagator by
[D(E)−1]i,j = (E −M0N∗
i)δi,j −
∑
MB
∫
k2dkΓN∗
i→MB(k)GMB(k, E)ΓMB→N∗
j(E, k) . (9)
where M0N∗ and ΓM ′B′→N∗(k) are the bare mass and bare vertex the N ∗ state, respectively.
Once the MB → M ′B′ amplitudes are obtained, we can calculate the matrix elementsof the two-pion photo- and electro-production
TππN,γN(E) = vππN,γN + [vππN,πNGπN(E)TπN,γN ]
+Γ†∆→πNGπ∆(E)Tπ∆,γN(E)
+h†ρ→ππGρN(E)TρN,γN
+h†σ→ππGσN (E)TσN,γN (10)
26

where vππN,πN and vππN,γN are the direct non-resonant production amplitudes. vππN,πN ,vππN,γN are calculated from tree-diagrams of effective Lagrangians.
The computer programs for calculating the above equations have been developed inRef.[31]. In particular, a numerical method based on a spline-function expansion for dealingwith the two-pion channels has been developed and well tested. The unique capability of thismethod is demonstrated in Fig.15 where the effects due to ππN cuts, which are neglectedin all recent calculations, are shown to be important in interpreting the two-pion photo-production data.
To proceed, we need to first determine the parameters associated with the non-resonantamplitude tMB,M ′B′ of Eq.(4) such that the N ∗ parameters of the resonant term tRMB,M ′B′ canbe extracted from fitting the data of meson production reaction. In the following sections,we describe how we will carry out this research project.
0
0.5
1
1.5
2
-3 -2 -1 0 1 2 3
dσ/d
Mπ−
p/dΩ
p/dΩ
q
φ
W=1.88 GeV, Mπ−p=1.23GeV
0
0.5
1
1.5
2
-3 -2 -1 0 1 2 3
dσ/d
Mπ−
p/dΩ
p/dΩ
q
φ
W=1.88 GeV, Mπ−p=1.23GeV
Figure 15: Differential cross sections of γp → π+π−p at W=1.88 GeV. The dotted curvesare obtained when ππN cut effects in Z(E)MB,M ′B′ of Eq. 6 are neglected. The outgoingπ+ momentum, is ~p and the relative momentum between π− and p is ~q. φ is the azimuthalangle of ~q. The results are for Mπ−p = 1.23 GeV, cosθp = 0.183, φp = −3.1 rad. The left(right) panel is for cosθq = −0.96(−0.525)
5.3 Fit to πN data
The first step is to determine the parameters of the hadronic non-resonant interactionvMB,M ′B′ of Eq.(6), with MB = πN, ηN, π∆, ρN, σN . This will be done by fitting theπN elastic scattering data.
We will perform the fits in three stages. In the first stage, the resonant amplitude tRπN,πN
of Eq.(4) will be generated from the resonance parameters listed by Particle Data Group(PDG) using the procedures explained in Ref.[31]. Furthermore the one-particle-exchange
term V(E)MB,M ′B′ can be neglected in solving coupled-channel equation Eq.(5) since its effects
27

on πN → πN elastic scattering amplitudes are known[31] to be weak. Even with thesetwo simplifications, the χ2-fit to πN data requires fast and efficient calculations of Eq.(5).Casting the codes of Ref.[31] into a form suitable for parallel computations is essential. Thenecessary starting computation resource has already been obtained from NERSC of U.S.Department of Energy. An application to Spain’s Barcelona Supercomputing Center will besubmitted to get additional computation power.
Once the parameters, coupling constants and ranges of form factors, of vMB,M ′B′ aredetermined, our procedure in the next stage is to allow the resonance parameters to vary inthe fits. Here we will work with Richard Arndt, the leading expert in πN amplitude analyses,to narrow down the dressed N ∗ parameters associated with the strong decay channels. Inparticular, we need to clarify the questions concerning the decomposition of ππN into quasi-two particle channels π∆, ρN, σN in their empirical partial-wave analyses.
In the third stage, we need to include the particle-exchange term Z(E)MB,M ′B′ of Eq.(6)
in the fits to tune the parameters. Here we will use the code based on the spline-functionexpansion, which has also been developed and well tested in Ref.[31].
We expect to complete the fits to πN data by the end of 2006.
5.4 Extraction of γN → N ∗ Form Factors
Once the πN data are fitted, most of the strong verticies in the non-resonant γN → MBinteraction vγN,MB and the N∗ →MB verticies of Eq.(8) have been determined. In addition,most of the the electromagnetic form factors associated with vγN,MB can be taken fromprevious works. Thus the γN → N ∗ form factors will be the main unknown which will bedetermined by fitting the meson electro-production data.
Our first task is to find reasonable starting parameterization of the bare γN → N ∗ formfactors of Eq.(8). Instead of using the still not well-developed theoretical calculations ofN∗ form factors, we will proceed phenomenologically. First we note that with the strongverticies fixed by the fit to πN data, we can use Eq.(8) to calculate the meson cloud effectson γN → N∗ by calculating
δmesonN∗ (Q2) = ΓN∗→γN(Q2) − ΓN∗→γN(Q2)
=∑
MB
∫
k2dkΓN∗→MB(k, ER)GMB(k, ER)vMB,γN(k, q) , (11)
where ER is the resonance position. Assuming that the dressed form factor ΓN∗→γN(Q2) issimilar to the empirical form factors recently extracted by the CLAS collaboration[36] wecan find some parameterizations of the bare form factor, such as the form used[33] in thestudy of ∆(1232) resonance
ΓN∗→γN(Q2) = (a + be−cQ2
)F (Q2) , (12)
where F (Q2) is the usual dipole form factor
F (Q2) =1
(1 +Q2/Λ2N∗)2
. (13)
28

The resulting parameters a, b, c, and ΛN∗ will be the initial parameters which will be adjustedalong with the not well-determined form factors associated with the non-resonant interactionvMB,γN in the χ2−fit to the meson production data.
Because of the large amount of the data we need to fit, we are proceeding with twoseparated but closely related efforts.
5.5 Analyses of πN , ηN and ππN production data
With the initial parameters of the electromagnetic form factors chosen by the proceduresdescribed above, we then use our full computation codes defined by Eqs.(4) -(10) to fitthe data of photo- and electro-production of π, η and ππ. The resulting dressed formfactor ΓN∗→γN(Q2) can be compared with the values from the K-matrix model analysis ofCLAS collaboration. The determined bare form factor ΓN∗→γN (Q2) can be compared withthe predictions from hadron structure calculations which do not include the coupling withmeson-baryon scattering states.
In this process, the K-matrix model fits by the CLAS collaboration will provide informa-tion in locating the ranges of our initial parameters, as explained above. Thus it is importantthat their analyses can include as much as coupled-channel effects which can be generatedfrom our Eq.(5). A collaboration has been started between EBAC team and I. Aznauryan,V. Mokeev of CLAS collaboration to make progress in this direction. A project has beenstarted to extend the combined analysis of 1π and 2π CLAS collaboration data to includeexplicit coupled-channel effects generated from a meson-exchange calculation at EBAC. Thisis aimed at improving the phenomenological aspects of the combined analyses of the CLAScollaboration and imposing more theoretical constraints in extracting the N ∗ parametersfrom the JLAB data. The results from the improved combined analyses will provide infor-mation for identifying the ranges of the bare N ∗ parameters, associated with the quark corewave function ψ(qcqcqc). We expect to perform this improved K-matrix model analysis bythe end of 2006.
A good fit to the ππN production data is crucial in this dynamical coupled-channelanalysis mainly because ππN is the dominant channel in the N ∗ region and can have largeeffects on all other production cross sections. This part of the computation program is mostcomplex because it needs accurate calculations of the logarithmically divergent one-particle-exchange term Z
(E)MB,M ′B′ which has very large effects on two-pion production cross sections,
as illustrated in Fig.15. At the present time, we are continuing the effort of Ref.[31] toperform detailed checks of this crucial part of the computation program. The fits to π, η,and ππ production data are expected to begin in the spring of 2007.
The results from the improved combined analyses will provide information for identifyingthe ranges of the bare N ∗ parameters, associated with the quark core wave function ψ(qcqcqc),in performing the dynamical coupled-channel analyses of all of the meson production datafrom CLAS by 2009. Therefore, by 2009 we will have coupled channel approach ready forcombined analysis of the data on 1π and 2π electro-production from proposed experiments.Analysis of these two major exclusive channels in N ∗ excitation region will create most
29

reliable data on Q2-evolution of resonance electro-couplings.Capability of coupled channel approach to access bare N ∗ parameters will allow us to
study in details transition from meson cloud to quark core as relevant degrees of freedom inN∗ structure. We will examine the extent to which the γN → N ∗ transition form factorsextracted by the CLAS collaboration are consistent with the wave function composed by aquark core and meson cloud, and how high Q2 the quark core wave function ψ(qcqcqc) canbe described by the constituent quark models. In the first calculation for γN → N ∗(S11)at the photon point, significant meson cloud effects have been identified, as illustrated inFig.16 from Ref.[35]. Complete coupled-channel calculations[37] for examining the mesoncloud effects on the γN → N ∗ form factors extracted by the CLAS collaboration will soonbe completed.
1.75 2 2.250
5
10
15
20
|E0+
| [
mF]
BareDressed
1.75 2 2.250
5
10
15
S11
(1535) S11
(1650)
Figure 16: Meson cloud effect on γN → N ∗(S11) transition at Q2=0. The results from [38]
Undoubtedly, the analyses of the data from the experiments proposed above will becomplex and non-trivial. With the joint effort being made by EBAC and CLAS collaboration,the necessary coupled-channel analyses of the forthcoming data will be ready by the time 12GeV upgrade is completed.
30

6 Single-Meson Electro-Production Experiment
6.1 Cross Section Measurement and Beam Time Estimates
We propose to extend the measurements of experiment E99-107 to 11GeV electron beamenergy. In the conventional resonance region (W ≤ 2GeV ) the covered Q2 range will extendbeyond 12GeV 2 (see Fig. 17). The differential cross section will be measured with a polarizedelectron beam as a function of the invariant mass W , the azimuthal hadronic angle φπ, andthe polar hadronic angle θπ of the pion nucleon final-state 2. In the one-photon-exchangeapproximation the fivefold differential cross section factorizes into the hadronic and theleptonic part 3
d5σv
dk20dΩedΩπ
= Γv ·d2σv
dΩπ
. (14)
The virtual photon flux can be written as
Γv =α
2π2
k20k10
kγQ2
1
1 − ε(15)
with the four momentum transfer Kµ = Kµ1 −Kµ
2 , the corresponding squared four momentumtransfer −KµK
µ = Q2, and the incoming Kµ1 = k10, ~k1 and outgoing Kµ
2 = k20, ~k2electron four momenta, the equivalent photon energy
kγ =s−m2
2m=W 2 −m2
2m(16)
and finally the degree of transverse polarization
ε =
1 + 2|~k|2Q2
tan2 θe
2
−1
. (17)
In out-of-plane measurements the specific φπ-dependences of the twofold hadronic crosssection
d2σv
dΩπ= σT + εσL + εσTT cos 2φπ +
√
ε(ε + 1)/2 σTL cosφπ + (18)
Pe
√
ε(1 − ε)/2 σTL′ sin θπ sinφπ
can be utilized to separate the four response functions, σT + εσL, σTT , σTL, and σTL′ . Aseparation of σT and σL is not required for this proposal as the resonance couplings are knownto be mostly transverse, thus the longitudinal amplitudes can be extracted with greatersensitivity from the interference terms σTL and σTL′ than from the total cross section. Thespecific θπ-dependences of these four response functions on the other hand determine in thecovered kinematic region the W and Q2 evolution of the Legendre moments, which are thebasis of the single-pion multipole or helicity amplitude analysis as described in chapter 6.2
31

5
10
15
0.5 1 1.5 2 2.5
10
10 2
10 3
10 4
10 5
10 6
W[GeV]
Q2 [G
eV2 ]
5
10
15
0.5 1 1.5 2 2.51
10
10 2
10 3
10 4
10 5
W[GeV]
Q2 [G
eV2 ]
5
10
15
0.5 1 1.5 2 2.510
10 2
10 3
10 4
10 5
10 6
W[GeV]
Q2 [G
eV2 ]
5
10
15
0.5 1 1.5 2 2.51
10
10 2
10 3
10 4
10 5
10 6
W[GeV]
Q2 [G
eV2 ]
0
5
10
2 3 4
10 2
10 3
W[GeV]
Q2 [G
eV2 ]
0
5
10
2 3 41
10
10 2
W[GeV]
Q2 [G
eV2 ]
Figure 17: Kinematic coverage of CLAS12 in the resonance region for the exclusive one pionelectro-production at 11GeV electron beam energy when e′ and π+ (upper and lower rightpanels) or e′ and p (middle right panel) are detected in the CLAS12 fastmc simulation basedon the Genova-EG (in the resonance region) or DIS (beyond the resonance region) eventgenerator, and the corresponding Genova-EG (upper and middle left panels) and DIS (lowerleft panel) event generator data itself.
The beam time estimate for the γ∗p→ π+(n)(π0p, ηp) reaction channel is not only basedon the Genova-EG event generator [164] and the CLAS12 fastmc detector simulation, but also
2The described cross section decomposition applies more generally to any single-meson nucleon final-state.3Variables in the lab frame (LAB) are marked with diamonds and all unmarked variables are in the
center-of-mass frame (CM).
32

Figure 18: The structure function νW2 versus ω′ inclusive inelastic scattering in the resonanceregion for various values of nominal Q2, where ω′ ≡ 1 +W 2/Q2 [60, 65, 66, 100, 104]. Thesolid curves are fits to the data that include only ∆(1232), S11(1535), and F15(1680) resonancecontributions [108]. The dashed curves are fits to the data in the scaling region extrapolateddown to the resonance region.
on the measured exclusive [97] and inclusive [108] cross sections. An overview of the inclusiveinelastic scattering in the resonance region, as in Fig. 18, demonstrates that at all Q2 evenup to 21GeV 2 resonance structures are visible and that the νW2 structure function result atQ2 = 3GeV 2 agrees with the recent total inclusive cross section at Q2 = 2.915GeV 2 [97]. Inaddition the peak strength in the second resonance region attributed to the S11(1535) and inthe third resonance region attributed to the F15(1680) scale like the dipole form factor givenby Gdip = µp(1 +Q2/0.71)−2 [108]. This experimental result justifies the use of the Genova-
33
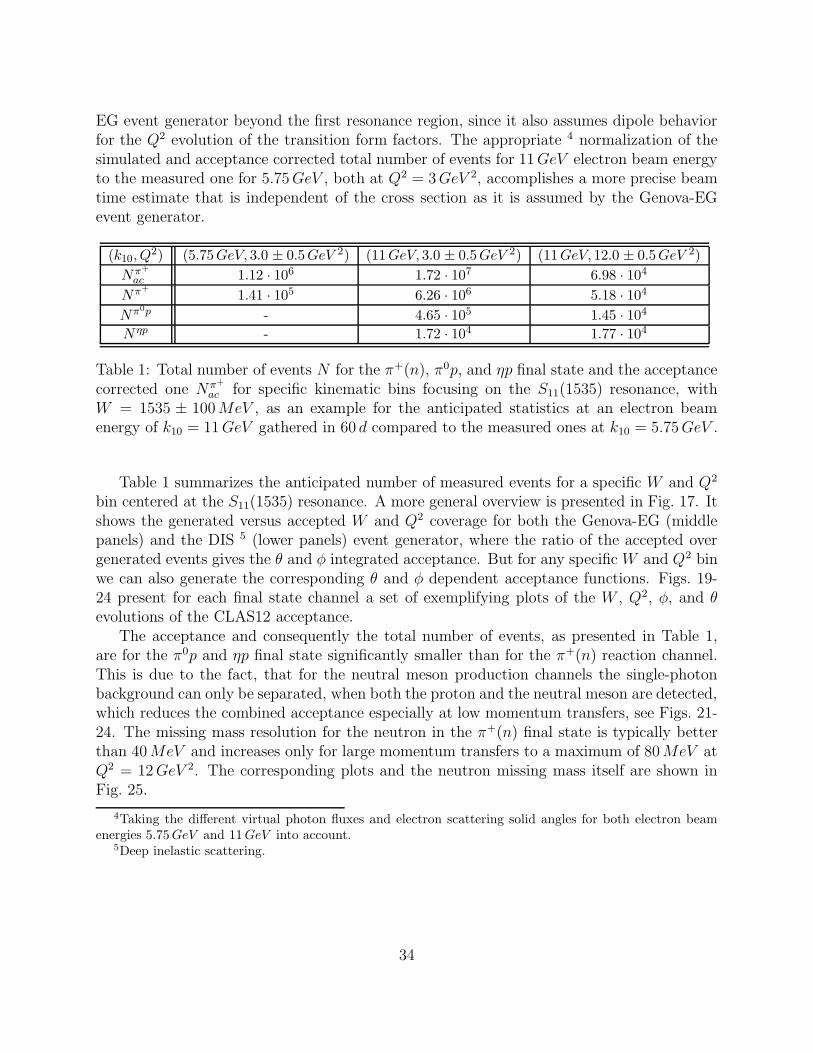
EG event generator beyond the first resonance region, since it also assumes dipole behaviorfor the Q2 evolution of the transition form factors. The appropriate 4 normalization of thesimulated and acceptance corrected total number of events for 11GeV electron beam energyto the measured one for 5.75GeV , both at Q2 = 3GeV 2, accomplishes a more precise beamtime estimate that is independent of the cross section as it is assumed by the Genova-EGevent generator.
(k10, Q2) (5.75GeV, 3.0 ± 0.5GeV 2) (11GeV, 3.0 ± 0.5GeV 2) (11GeV, 12.0 ± 0.5GeV 2)
Nπ+
ac 1.12 · 106 1.72 · 107 6.98 · 104
Nπ+
1.41 · 105 6.26 · 106 5.18 · 104
Nπ0p - 4.65 · 105 1.45 · 104
Nηp - 1.72 · 104 1.77 · 104
Table 1: Total number of events N for the π+(n), π0p, and ηp final state and the acceptancecorrected one Nπ+
ac for specific kinematic bins focusing on the S11(1535) resonance, withW = 1535 ± 100MeV , as an example for the anticipated statistics at an electron beamenergy of k10 = 11GeV gathered in 60 d compared to the measured ones at k10 = 5.75GeV .
Table 1 summarizes the anticipated number of measured events for a specific W and Q2
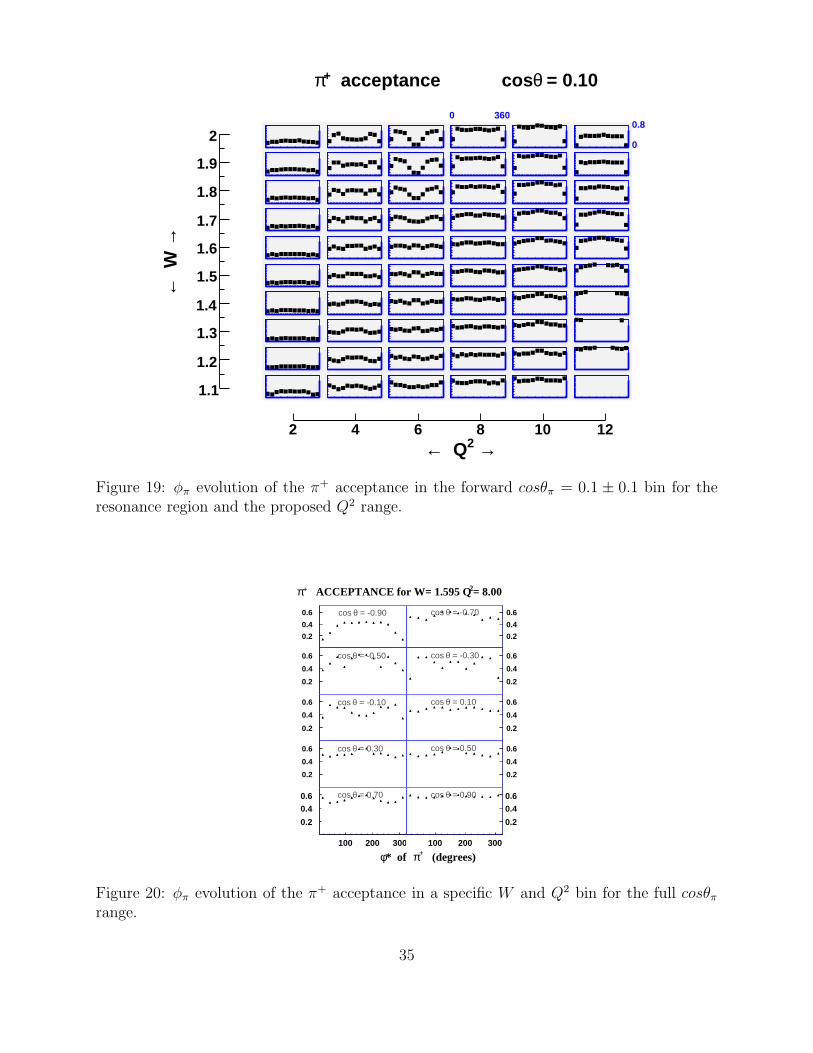
bin centered at the S11(1535) resonance. A more general overview is presented in Fig. 17. Itshows the generated versus accepted W and Q2 coverage for both the Genova-EG (middlepanels) and the DIS 5 (lower panels) event generator, where the ratio of the accepted overgenerated events gives the θ and φ integrated acceptance. But for any specific W and Q2 binwe can also generate the corresponding θ and φ dependent acceptance functions. Figs. 19-24 present for each final state channel a set of exemplifying plots of the W , Q2, φ, and θevolutions of the CLAS12 acceptance.
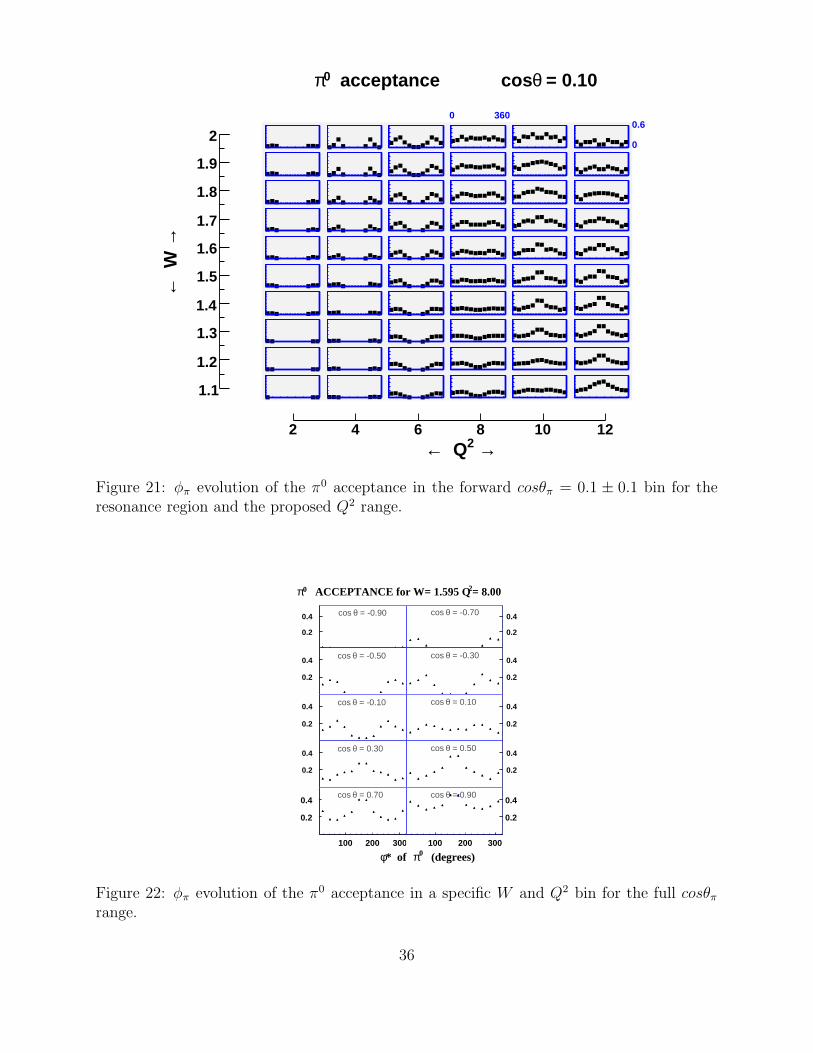
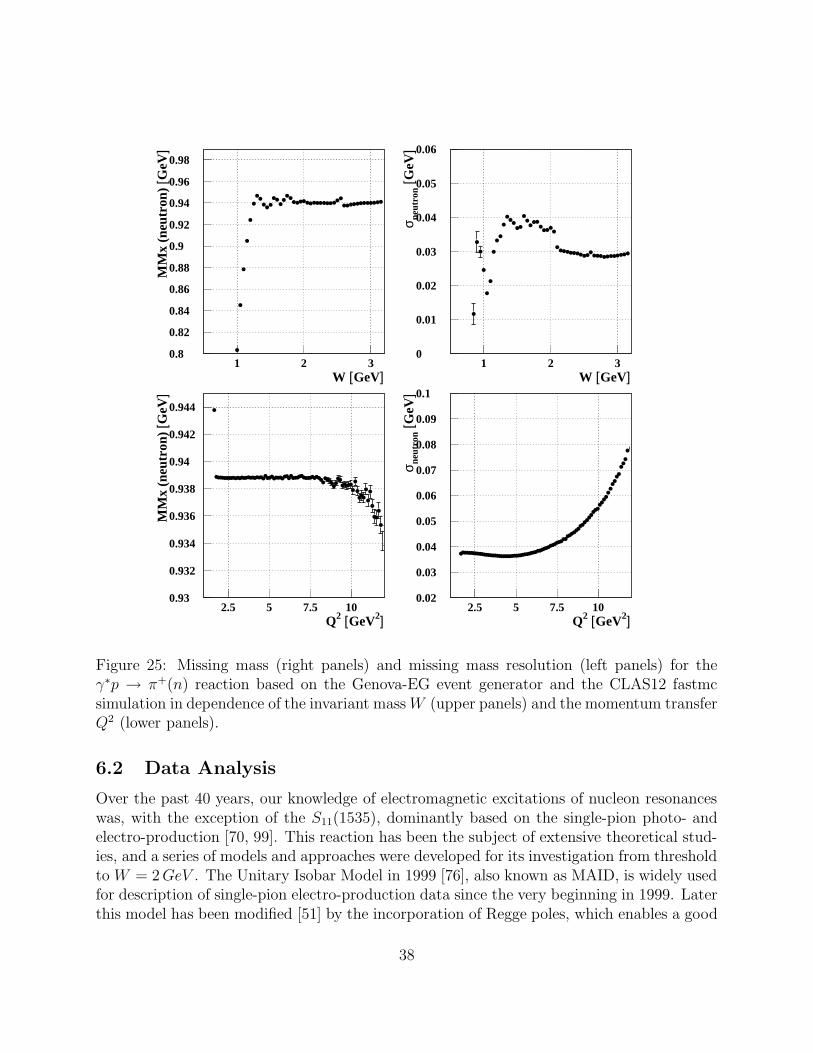
The acceptance and consequently the total number of events, as presented in Table 1,are for the π0p and ηp final state significantly smaller than for the π+(n) reaction channel.This is due to the fact, that for the neutral meson production channels the single-photonbackground can only be separated, when both the proton and the neutral meson are detected,which reduces the combined acceptance especially at low momentum transfers, see Figs. 21-24. The missing mass resolution for the neutron in the π+(n) final state is typically betterthan 40MeV and increases only for large momentum transfers to a maximum of 80MeV atQ2 = 12GeV 2. The corresponding plots and the neutron missing mass itself are shown inFig. 25.
4Taking the different virtual photon fluxes and electron scattering solid angles for both electron beamenergies 5.75 GeV and 11 GeV into account.
5Deep inelastic scattering.
34
2 4 6 8 10 12
1.1
1.2
1.3
1.4
1.5
1.6
1.7
1.8
1.9
2
= 0.10θ acceptance cos+π
→ 2 Q←
→ W
←
0
0.80 360
Figure 19: φπ evolution of the π+ acceptance in the forward cosθπ = 0.1 ± 0.1 bin for theresonance region and the proposed Q2 range.
0.2
0.4
0.6 = -0.90θcos
0.2
0.4
0.6 = -0.70θcos
0.2
0.4
0.6 = -0.50θcos
0.2
0.4
0.6 = -0.30θcos
0.2
0.4
0.6 = -0.10θcos
0.2
0.4
0.6 = 0.10θcos
0.2
0.4
0.6 = 0.30θcos
0.2
0.4
0.6 = 0.50θcos
100 200 300
0.2
0.4
0.6 = 0.70θcos
100 200 300
0.2
0.4
0.6 = 0.90θcos
= 8.002 ACCEPTANCE for W= 1.595 Q+π
(degrees)+π* of φ
Figure 20: φπ evolution of the π+ acceptance in a specific W and Q2 bin for the full cosθπ
range.
35
2 4 6 8 10 12
1.1
1.2
1.3
1.4
1.5
1.6
1.7
1.8
1.9
2
= 0.10θ acceptance cos0π
→ 2 Q←
→ W
←
0
0.60 360
Figure 21: φπ evolution of the π0 acceptance in the forward cosθπ = 0.1 ± 0.1 bin for theresonance region and the proposed Q2 range.
0.2
0.4 = -0.90θcos
0.2
0.4 = -0.70θcos
0.2
0.4 = -0.50θcos
0.2
0.4 = -0.30θcos
0.2
0.4 = -0.10θcos
0.2
0.4 = 0.10θcos
0.2
0.4 = 0.30θcos
0.2
0.4 = 0.50θcos
100 200 300
0.2
0.4 = 0.70θcos
100 200 300
0.2
0.4 = 0.90θcos
= 8.002 ACCEPTANCE for W= 1.595 Q0π
(degrees)0π* of φ
Figure 22: φπ evolution of the π0 acceptance in a specific W and Q2 bin for the full cosθπ
range.
36

2 4 6 8 10 12
1.1
1.2
1.3
1.4
1.5
1.6
1.7
1.8
1.9
2
= 0.10θ acceptance cosη
→ 2 Q←
→ W
←
0
0.60 360
Figure 23: φη evolution of the η acceptance in the forward cosθη = 0.1 ± 0.1 bin for theresonance region and the proposed Q2 range.
0.2
0.4 = -0.90θcos
0.2
0.4 = -0.70θcos
0.2
0.4 = -0.50θcos
0.2
0.4 = -0.30θcos
0.2
0.4 = -0.10θcos
0.2
0.4 = 0.10θcos
0.2
0.4 = 0.30θcos
0.2
0.4 = 0.50θcos
100 200 300
0.2
0.4 = 0.70θcos
100 200 300
0.2
0.4 = 0.90θcos
= 8.002 ACCEPTANCE for W= 1.595 Qη
(degrees)η* of φ
Figure 24: φη evolution of the η acceptance in a specific W and Q2 bin for the full cosθη
range.
37
0.8
0.82
0.84
0.86
0.88
0.9
0.92
0.94
0.96
0.98
1 2 3W [GeV]
MM
x (n
eutr
on)
[GeV
]
0
0.01
0.02
0.03
0.04
0.05
0.06
1 2 3W [GeV]
σ neut
ron
[GeV
]
0.93
0.932
0.934
0.936
0.938
0.94
0.942
0.944
2.5 5 7.5 10Q2 [GeV2]
MM
x (n
eutr
on)
[GeV
]
0.02
0.03
0.04
0.05
0.06
0.07
0.08
0.09
0.1
2.5 5 7.5 10Q2 [GeV2]
σ neut
ron
[GeV
]
Figure 25: Missing mass (right panels) and missing mass resolution (left panels) for theγ∗p → π+(n) reaction based on the Genova-EG event generator and the CLAS12 fastmcsimulation in dependence of the invariant massW (upper panels) and the momentum transferQ2 (lower panels).
6.2 Data Analysis
Over the past 40 years, our knowledge of electromagnetic excitations of nucleon resonanceswas, with the exception of the S11(1535), dominantly based on the single-pion photo- andelectro-production [70, 99]. This reaction has been the subject of extensive theoretical stud-ies, and a series of models and approaches were developed for its investigation from thresholdto W = 2GeV . The Unitary Isobar Model in 1999 [76], also known as MAID, is widely usedfor description of single-pion electro-production data since the very beginning in 1999. Laterthis model has been modified [51] by the incorporation of Regge poles, which enables a good
38

description of all photo-production multipole amplitudes with l ≤ 3 up to W = 2GeVusing a unified Breit-Wigner parametrization of the resonance contributions in the form asproposed by Walker [111]. The Unitary Isobar Model (UIM) [51] has been successfully usedfor the analysis [36, 52, 53] of the CLAS [77, 84–86, 97] and the world data on the crosssections and longitudinally polarized electron beam asymmetries for the reactions p(~e, e′p)π0
and p(~e, e′n)π+ in the first, second, and third resonance region. The quality of the obtaineddescriptions are characterized by the following χ2 values: χ2 < 1.6 atQ2 = 0.4 and 0.65GeV 2
and χ2 < 2.5 at 1.72 < Q2 < 4.16GeV 2. In the analyses [36, 52, 53], the Q2 evolution of allresonances with M < 1.75GeV has been established up to a Q2 of 4.5GeV 2.
-80-60
-40-20
020
4060
80100
0 1 2 3 4Q2 (GeV2)
A1/
2 (1
0-3G
eV-1
/2)
P11(1440)
05
101520253035404550
0 1 2 3 4Q2 (GeV2)
S 1/2
(10-3
GeV
-1/2
)
P11(1440)
Figure 26: Helicity amplitudes for the P11(1440) electro-excitation on the proton found inour analyses [36, 52, 53]: filled black squares are from analysis [36] of CLAS data [77, 84–86], filled red circles are obtained from the combined analysis [52] of the CLAS π and 2πelectro-production data, filled blue squares are obtained in the analysis [53] of CLAS π+
electro-production data [97], and the filled black triangle at Q2 = 0 is the RPP estimate[99]. The open black circles are the results at Q2 ≥ 1.72GeV 2 multiplied by Q2/1.6 tolinearize the Q2 dependence of the helicity amplitudes at large Q2.
Figure 26 shows the results for P11(1440)resonances in the second and third resonanceregion obtained in our analyses [36, 52, 53]. In order to extrapolate the results to higher Q2,we tried to linearize the shape of the Q2 evolution of the γp → N ∗ helicity amplitudes atQ2 ≥ 1.72GeV 2. The open circles in Figs. 26 represent the helicity amplitudes multiplied by(Q2/1.6)a. It turns out that this product of the helicity amplitudes with (Q2/1.6)a revealsapproximately constant behavior, if a ' 1 (1.5) is chosen in case of the 1
2(3
2) amplitudes. A
similar behavior is also revealed by the 12
transverse amplitudes of the resonances P33(1600),S31(1620), S11(1650), D13(1700), D33(1700), and P13(1720).
The background of the Unitary Isobar Models [51, 76] consists of the Born term, nucleonexchanges in the s- and u-channels and π exchange in the t-channel, as well as ρ and ωexchanges. The Born term contributions are constricted by the proton and neutron magneticand electric form factors, as well as the pion form factor. The estimations of the background
39

contributions at higher Q2, is based on the experimental results and is carried out accordingto the following six steps.
-0.4
-0.2
0
0.2
0.4
1.2 1.4 1.6 1.8 2
M1- pπ0
Q2=0.
-0.5
0
0.5
1.2 1.4 1.6 1.8 2
M1- nπ+
-0.3
-0.2
-0.1
0
1.2 1.4 1.6 1.8 2
M1- pπ0
Q2=3.
-0.4
-0.3
-0.2
-0.1
0
1.2 1.4 1.6 1.8 2
M1- nπ+
-0.1
-0.075
-0.05
-0.025
0
1.2 1.4 1.6 1.8 2
M1- pπ0
Q2=6.
W, GeV
-0.1
-0.05
0
1.2 1.4 1.6 1.8 2
M1- nπ+
W, GeV
Figure 27: The M1− multipole amplitude for the reactions γ∗p→ pπ0 (left) and nπ+ (right)at Q2 = 0, 3, and 6GeV 2. Black curves are the total amplitudes, red curves represent thebackground, and solid (dashed) curves are the imaginary (real) parts of the amplitudes.
1) Measurements of the proton magnetic form factor GMp(Q2) have been carried out over
the last 50 years [47, 54, 55, 91, 101, 107, 113]. They show up to a Q2 of 10GeV 2,that GMp
(Q2) follows the dipole form
GMp(Q2)
µp= Gd(Q
2) =1
(1 + Q2
0.71GeV 2 )2. (19)
40

There are slight deviations from this behavior of 3% − 4%, which are reproduced bythe parametrization [61] of existing the data.
2) The ratio of the electric and magnetic proton form factors has been recently measuredat Jefferson Lab up to Q2 = 5.6GeV 2 [41, 79]. These measurements show that a
straight line fit can be applied to the ratio µpGEp(Q2)
GMp(Q2)in the range of 0.5GeV 2 < Q2 <
5.6GeV 2.
µp
GEp(Q2)
GMp(Q2)
= 1 − 0.13(Q2 − 0.04) (20)
The experimental error of this ratio increases 11%, 14%, 31% with increasing Q2 =3.97, 4.75, 5.54GeV 2, respectively.
3) The neutron magnetic form factor GMn(Q2) is measured up to Q2 = 10GeV 2 [93, 103].
In this Q2 range, the ratio GMn (Q2)µn
is close to the dipole form with the tendency to fall
faster than Gd(Q2) starting at Q2 = 3GeV 2
GMn(Q2)
µnGd(Q2)= 0.967 ± 0.031 ± 0.052, Q2 = 3.25GeV 2 [93],
= 0.923 ± 0.048 ± 0.065, Q2 = 4GeV 2 [93], (21)
= 0.91 ± 0.05, Q2 = 6GeV 2 [103],
= 0.71 ± 0.12, Q2 = 8GeV 2 [103].
4) The neutron electric form factor GEn(Q2) is measured up to Q2 = 1.5GeV 2 and
reviewed in [75]. Taking into account the results of these measurements and the falloffof GEn
(Q2) predicted by theoretical models [75], we have parametrized this form factorin two ways:
GEn(Q2) =
0.06
Q2/0.5or
0.06√
Q2/0.5for Q2 > 0.5 GeV 2. (22)
5) The pion form factor Gπ(Q2) has been studied for Q2 values from 0.4 to 9.8GeV 2 atCEA/Cornell [56, 57] and more recently at JLab at Q2 = 0.6−1.6GeV 2 [40]. All thesemeasurements show that the Q2 dependence of Gπ(Q2) can be described by the simplemonopole form
Gπ(Q2) ∼= Gm(Q2),
Gm(Q2) =1
1 +Q2/0.46[56, 57], (23)
Gm(Q2) =1
1 +Q2/0.54[40].
41

6) There are no measurements of the form factors Gρ(ω)→πγ(Q2), which determine t-
channel ρ and ω exchanges. However, investigations made using both QCD sum rules[78] and quark models [49] predict that the Q2 dependence of these form factors followsclosely the dipole form. Therefore our corresponding background estimations proceedsfrom the assumption that
Gρ(ω)→πγ(Q2) ∼= Gd(Q2). (24)
Figure. 27 shows the M1− multipole amplitudes for the reactions γ∗p→ pπ0 and nπ+ atQ2 = 0, 3, and 6GeV 2. The results atQ2 = 0 and 3GeV 2 correspond to our analyses [51, 53].The results at Q2 = 6GeV 2 are based on our extrapolations of the resonance contributionsas found at Q2 = 1.72 − 4.16GeV 2 in the analysis [53] of CLAS γ∗p → nπ+ data [97]. Thebackground at Q2 = 6GeV 2 is built using the information on the form factors as listedabove. All the uncertainties in the form factors have been taken into account, including a50% uncertainty for Gρ(ω)→πγ(Q2) in 6). All these uncertainties practically do not affect M1−multipole amplitude and have very small influence on the background of E0+.
From the results presented in Fig. 27 we can draw the interesting and encouraging con-clusion that with increasing Q2 the resonance signals become much stronger in comparisonto the background. Such behavior of the relative resonances-to-background contributions isconnected to the fact that the Q2 dependence of the background is mainly determined by theproton form factors, which fall as (or stronger than) the dipole form factor, whereas most ofresonance amplitudes in the second and third resonance region seem to fall as 1/Q2. So thatthe proposed Q2 region presents a unique and new opportunity to distinguish resonance frombackground contributions and to investigate the Q2 evolution of the N ∗ electro-excitationamplitudes.
42

7 Double Charged Pion Data Analysis and Beam Time
Estimates
7.1 Double charged pion exclusive channel
7.1.1 Experimental studies of 2π photo- electro-production in N ∗ excitation
region
Data on 2π production by real and virtual photons already provided considerable amountof information for the evaluation of N ∗ electro-couplings at photon virtualities Q2 below 1.5GeV 2. Available data consist of old bubble chamber measurements [143] at the photon pointand recent real photon data collected at Bonn, GRAAL, MAMI [120–123, 125–128]. Mostdetailed 2π electro-production data were obtained with the CLAS detector [115, 119] Thesedata cover the kinematics range in W from 1.3 GeV to 1.9 GeV and for photon virtualitiesQ2 from 0.2 GeV 2 to 1.5 GeV 2. Fully integrated 2π electro-production cross section datameasured with CLAS are shown on Fig. 29.
e−
A
/p
γ
+π
e
−
e
−
−
z
θ
ϕ
π
p
π
zn
x
−
y π
e
/
−
scattering plane
β
γ
+pπα+π/
p
γ
B
A
π/
e
−
−
ee−
p
Figure 28: Angular variables used in analysis of the CLAS data on 2π production.
The description of the π−π+p final states requires five kinematic variables, which maybe chosen to be two invariant masses of the final hadrons, the solid angle describing themomentum of one of the hadrons, and the angle between two planes. The three-momentaof two pairs of the final hadrons are chosen to define these two planes. The choice of thefive variables is not unique. The angular variables used in the CLAS analysis are shown onFig. 28. In each (W&Q2) bin covered the following single differential cross-sections integratedover 4 other variables were obtained:
• π−π+, π+p, π−p mass distributions
• π+, π−, p CM-angular distributions
• 3 distributions over angles between two planes, composed by two pairs of 3-momentaof the final hadron for 3 various choices of hadron pairs: dσ
dα. The angle α is shown on
Fig. 28..
43

0
5
10
15
20
25
30
1.3 1.4 1.5 1.6 1.7 1.8 1.9 2 2.1
Figure 29: Total double charged pion virtual photon cross-sections. Fit of CLAS data [115]within the framework of JM05 model [142] is shown by solid lines. Dashed lines correspondto JM05 calculation with 3/2+(1720) candidate state taken out.
A detailed set of measurements of unpolarized observables is available for the first timefrom the CLAS detector, with acceptance close to 4π. A similar set of measurements can beexpected with CLAS12. It is a considerable advantage for analyzing the π+π−p final state tohave 9 single differential cross-sections in each W&Q2 bin. The large variety of unpolarizedobservables from the 2π data makes it possible to establish the main contributing mechanismsfrom a combined fit to cross sections and to isolate the resonant part. A phenomenologicalapproach, referred below as JM05 model, was developed in collaboration between Hall B atJefferson Lab and the Nuclear Physics Institute at Moscow Sate University [142, 144–148],which allowed us to access N ∗ parameters from a global fit to all available 2π observables.
7.1.2 Physics analysis of double pion exclusive photo- and electro-production
Analysis of the 2π exclusive channel with the goal of extracting the N ∗ parameters representsa challenging task. The signals from nucleon resonances are embedded in considerable non-resonant mechanisms, which have even dominant contributions at low Q2. Attempts to ana-lyze 2π photo- and electro-production, using model independent partial wave decomposition[116, 149] face considerable difficulties. Analysis of preliminary CLAS 2π photo-production
44
data within the framework of partial wave decomposition [116] showed, that even using avery restricted angular momentum basis with total angular momentum up to 5/2, we needto involve several tens of partial waves to get a reasonable data description at W<2.0 GeV.The search for new states requires extension of the W-coverage up to 3.0 GeV making thepure partial wave approach an even more challenging task. The more limited statistic makesthe partial wave analysis difficult to apply to electro-production 2π data, especially at highQ2. Moreover, even if a successful separation among all partial waves would be achieved, westill need to isolate resonant and non-resonant mechanisms in each partial wave to access N ∗
electromagnetic and/or hadronic parameters. There is no model independent way to disen-tangle comparable resonant/non-resonant contributions. This is the most common situationfor 2π photo- and electro-production amplitudes at W>1.6 GeV. Therefore, reaction modelshave to be used in the analysis of 2π electro-production data, particularly at high W and Q2
Several model approaches [151–158] were developed for the description of 2π photo-and electro-production following the pioneering paper of Luke and Soding [150]. Theseapproaches used tree level meson-baryon diagrams with various parametrization of electro-magnetic/hadronic vertex functions, and meson and baryon propagators. Most of themwere developed for N ∗ studies in the mass range below 1.6 GeV. The contributions fromexcited states of higher masses were limited to just a few particular states. None of theseapproaches includes contributions from all well established proton excitations with observedtwo pion hadronic decays. Most detailed and sophisticated treatment of the non-resonantmechanisms in 2π photo- and electro-production at W<1.6 GeV was achieved in the workof the Valencia group [155–157]. This approach was successfully employed in the descriptionof a limited set of world data [123, 125–128] available before the CLAS measurements atlow W. Another approach [152] was successfully used in the description of GRAAL data on2π0 photo-production [122]. However, none of these approaches were applied in the analysisof entire set of hadronic unpolarized observables for the 2πp final state, described in theSection 7.1.1. Therefore, the capability of these models to describe entire sets of the singledifferential cross-sections in 2π electro-production is an open question. On the other hand,the successful description of all single differential cross-sections combined is critical for acredible isolation of the resonant parts in double pion production amplitudes. Moreover, asW increases more mechanisms may contribute to 2π production. Also the interaction withopen inelastic channels in the initial and final states (ISI&FSI) become more important. Itis difficult to see that approaches, based on analysis of a limited set of observables at low W,with absent [155–157] or oversimplified ISI&FSI treatment [150, 152] would allow a credibleseparation of resonant and non-resonant mechanisms at W>1.6 GeV, which is needed forthe studies of high lying nucleon excitations.
To facilitate phenomenological studies of nucleon resonances in the entire N ∗ excitationregion, especially at masses above 1.6 GeV, the JM05 model was developed [142].
45

Q2 GeV2
(A2 1/
2 +S2 1/
2 )(1
/2) *1
000
Q2 GeV2
A32
*100
0 G
eV−1
/2
-175
-150
-125
-100
-75
-50
-25
0
0 0.5 1 1.50
20
40
60
80
100
120
140
160
180
200
0 0.5 1 1.5Q2 GeV2
(A2 1/
2 +S2 1/
2 )(1
/2) *1
000
GeV
−1/2
Q2 GeV2
A3/
2*10
00 G
eV−1
/2
0
50
100
150
200
250
0 0.5 1 1.5
-40
-20
0
20
40
60
80
100
120
0 0.5 1 1.5
Figure 30: Photo- and electro-couplings for D13(1500) and D33(1700): extracted from CLAS2π data within the framework of JM05 [142] are shown by filled squares with error bars,while world data from 1π exclusive channel are shown by open circles with error bars. Arearestricted by lines represents values of N ∗ electromagnetic form factors, obtained in the fitwithin the framework of the SQTM approach [132]
.
7.1.3 Essentials of JM05 model and 2π CLAS data analysis
We developed a phenomenological approach, capable to establish all relevant mechanismscontributing to the 2π photo- and electro-production from the combined analysis of all mea-sured observables. We implemented particular meson-baryon mechanisms, based on theirmanifestation in observables as slopes in angular distributions or visible structures in invari-ant mass distributions. We described these mechanisms by the simplest amplitudes com-patible with the data taking into account Lorentz invariance, P,C,T symmetries. Exchangeprocesses that were observed in the data were described either by Reggetiezed propagators orby an exponential parametrization. We also used restrictions, imposed by gauge invariancefor meson baryon diagrams in π∆ isobar channels.
The complexity of 2π production mechanisms was described by superposition of thefollowing isobar channels:
γp→ π−∆++ → π−π+p, (25)
γp→ π+∆0 → π+π−p, (26)
γp→ ρ0p→ π+π−p, (27)
γp→ π+D013(1520) → π+π−p, (28)
γp→ π+F 015(1685) → π+π−p, (29)
46

N∗,∆∗ M, Γtot BFπ∆ BFρp
GeV GeV % %P11(1440) 1.440 0.350 22. 0.D13(1520) 1.520 var. var. var.S31(1620) 1.620 0.150 62. 29.P33(1600) var var. var. var.S11(1650) 1.650 0.167 2. 3.D15(1675) 1.675 0.160 53. 0.F15(1680) 1.680 0.130 22. 7.D13(1700) var. var. var. var.D33(1700) 1.700 0.300 78. 8.P13(1720) var. var. var. var.
3/2+(1720)cand. var. var. var. var.F35(1905) var. var. var. var.P33(1920) var. var. var. var.F37(1950) var. var. var. var.
Table 2: List of resonances included to JM05 and theirs hadronic properties: total decaywidths Γtot, branching fractions (BF) to π∆ and ρp final states. The quoted values are takenfrom RPP [129]. The quantities labeled as ”var.” were fitted to the CLAS 2π data.
γp→ π−P++33 (1600) → π−π+p. (30)
Manifestation of all these isobar channels were clearly seen in observables [142, 144–148]Quasi-two-body processes in the channels (25),(26),(27) were described as superposition ofN∗ excitation in s-channel and non-resonant mechanisms.
The resonant parts in these channels (25),(26),(27) were evaluated using a Breit-Wigneransatz, described in [144, 145]. We included all well established excited states of 4 star PDGstatus plus 3 star states listed in the Table 2
N∗ hadronic decay amplitudes were estimated from the data on partial decay width avail-able from the analysis of experiments with hadronic probes. However, for high lying nucleonexcitations these hadronic data are too uncertain and we adjusted hadronic parameters forsuch states to the CLAS data (see Table 2). N ∗ electromagnetic form factors were treatedas free parameters and fitted to the data.
Analysis of CLAS 2π electro-production data [115] revealed signals from a possible new3/2+(1720) state. Dashed lines on Fig. 29 represent best data fit without the contribu-tions from this state. Assuming the contributions from conventional states only,a reasonabledescription of all observables was achieved [115] except in the area around 1.7 GeV. Imple-mentation of a new baryon state candidate with electromagnetic and hadronic parametersderived from the data fit allowed us to reproduce the data reasonably well in the entirekinematics covered by the measurement. The 3/2+(1720) candidate state was included inall further CLAS data analysis.
47
Non-resonant mechanisms of various isobar channels are described in [145],[147], [142],[161].
In addition to the isobar channels (25),(26),(27), (28),(29),(30) the JM05 model includesremaining direct 2π production mechanisms, when π−π+p final state is produced withoutthe formation of unstable intermediate particles. Phenomenological analysis of the entireset of single differential cross-section measured with CLAS [115, 119] allowed us to accessthe dynamics of the remaining mechanisms. Parametrization for their amplitudes is givenin [142].
The JM05 model provided reasonable description of all available CLAS/world data on2π photo- and electro-production at W< 1.9 GeV and at photon virtualities Q2<1.5 GeV 2.χ2perd.p. < 3.0 was achieved in the fit of all single differential cross-section, averaged overall W bins in each Q2 interval separately. Since data uncertainties were estimated basedon statistics errors only, such values of χ2perd.p. look quite reasonable. Total π−π+p cross-sections calculated with the framework of JM05 model [142] in comparison with CLAS data[115, 119] is shown on Fig. 29.
Successful description of all CLAS/world data on unpolarized observables was achievedwithin the framework of JM05 without any need for additional processes of unknown dy-namics. The contributions from additional processes on top of implemented to JM05 wasconsistent with zero in entire N ∗ excitation region covered by CLAS/world measurements.Therefore, for the first time we developed phenomenological approach for description of 2πelectro-production in N ∗ excitation region with most complete accounting for all relevantnon-resonant mechanisms.
Important feature of JM05 is capability to pin down contributing mechanisms from thedata fit. We expect, that this approach being applied to the data at high Q2 will allowus to establish new, still unknown mechanisms, contributed to the 2π electro-productionat high photon virtualities 5<Q2<10GeV 2. Therefore, we are suggesting JM05 model asgeneral framework for physics analysis of 2π electro-production data from CLAS12 with agoal to determine Q2-evolution of N ∗ electro-couplings. Critical requirement for experimentis capability to obtain entire set of single differential cross-sections for π−π+p final state.
Information on cross-sections and/or amplitudes of isobar channels (25),(26),(27), (28),(29),(30, which will be obtained within the framework JM05, is of particular interest forother parts of CLAS12 Program as target fragmentation studies [162].
7.1.4 N∗ studies at intermediate photon virtuality within the framework of
JM05 model
Combined analysis of 2π single differential cross-sections within the framework of JM05allowed us to isolate resonant part of cross-sections. Manifestation of resonant and non-resonant mechanisms in single differential cross-sections are shown in Fig. 31. The curvesrepresent best data fit with minimal χ2. Both resonant and non-resonant mechanisms havevery different manifestations in various observables, which are highly correlated by reactiondynamics. Moreover, resonant/non-resonant part behavior look very different in π− angular
48

and π−π+, π−p mass distributions and quite different in π+p mass distributions. Combinedfit of all these observables provided reliable isolation of resonance mechanisms. Dashed andsolid lines in Fig. 31 correspond to two different ways for modeling of additional non-resonantcontributions to π∆ isobar channels [163]. For both ways of non-resonant mechanisms mod-eling we achieved almost identical and reasonable data description with the same values ofN∗ electro-couplings. It proves reasonable parametrization of phenomenological terms inJM05 as well as credibility of resonant/non-resonant mechanism separation.
Moreover, N ∗ electro-couplings, determined in the CLAS 2π data fit, also provide rea-sonable description of all observables measured with CLAS in 1π electro-production atQ2 = 0.65GeV 2 [52]. Since 1π and 2π exclusive channels are major contributors in N ∗
excitation region with completely different non-resonant mechanisms, it is most compellingevidence for reliable isolation of resonant contributions, achieved in JM05.
W=1.74 GeV, Q2=0.65 GeV**2
Figure 31: Separation between resonant and non-resonant parts of cross-sections. Resonantand non-resonant contributions are shown by magenta and blue lines respectively. Dashedand solid lines correspond to two different ways for modeling of complementary non-resonantcontributions to π∆ isobar channels, described in [163]
Resonance structures are clearly seen in 2π electro-production data in entire Q2 area
49

Contributing factors Range for variationEffective Reggeon coupling αR [144] 15%
The magnitudefor diffractive 15%
ρ-production amplitudeThe magnitudes of mechanisms
contributed 10%to direct 2π production [142]
N∗ electro-couplings 10-50%N∗ π∆ and ρp hadrons decay width 100-400% for the states lebeled
”var” in Table 2
Table 3: Major contributors to uncertainties of N ∗ electro-couplings, determined from 2πexclusive channel.
covered by CLAS measurements Fig. 29. The particular feature, observed in CLAS 2π data,is growth of resonant over non-resonant mechanism ratio as photon virtuality increases.Inleading order, Q2-evolution of non-resonance mechanisms may be described by monopole fit.Such behavior reflects driving contribution from pion-in-flight Born term to non-resonantmechanisms at the intermediate Q2<1.5 GeV 2. From CLAS data analysis we found thatQ2 evolution of A1/2 N
∗ electromagnetic form factors is smoother for most excited protonstates. Therefore, relative N ∗ signal becomes more pronounced at higher Q2. In makes N∗
studies at high photon virtualities very attractive. To compensate cross-sections fall-off withphoton virtuality we need higher luminosity of CLAS12.
JM05 model was applied successfully for N ∗ studies from CLAS data. We determinedN∗ electrocouplings at photon virtualities Q2<1.5 GeV 2 for almost all N ∗ of 4 and 3 starPDG status, with masses less than 2.0 GeV, from combined analysis of all available 2πunpolarized cross-sections. All these data combined were fitted within the framework ofJM05. N∗ electro-couplings obtained from CLAS data analysis are shown on Fig. 30. incomparison with previous world data. World data come from 1π electro-production analysis.For the states with major 1π decays, which were extensively studied previously as D13(1520),F15(1685), N ∗ electro-couplings, extracted in our analysis, coincide with world data. It isfurther evidence for capability of JM05 approach to access N ∗ electro-couplings. For mosthigh lying (M>1.65 GeV) states reliable electro-couplings were obtained for the first time.Single pion exclusive channel just has not enough sensitivity to most high lying N ∗ withmajor 2π hadronic decays. This is a reason for large uncertainties in previous world dataon high lying state electro-couplings. So, comprehensive studies of 2π exclusive channel arecritically important to get reliable data on electro-couplings for high lying proton excitations.
The major contributors to uncertainties of N ∗ electro-couplings estimated within theframework of JM05 model are summarized in Table 3.
We developed special procedure to determine range of N ∗ electro-couplings as well as
50

non-resonant mechanism parameters of the Table 3 compatible to the measured observables.N∗ electromagnetic form factors were fluctuated around theirs expected values, obtainedin previous analysis[159]. We applied normal sampling for N ∗ electro-couplings with σparameter equal to 30% from expected electro-coupling values for most electromagnetic formfactors. However for well studied states as D13(1520), F15(1685) this range was reduced to10 %, while for small and/or poorly known electromagnetic couplings fluctuation range wasextended up to 50 %. Poorly known hadronic parameters for N ∗, labeled in the Table 2,as ”var” were also varied. Range of N ∗ π∆ and ρp hadronic coupling fluctuation was wideand causes total hadronic decay widths floating from 40 to 600 MeV. Simultaneously wefluctuated the parameters of non resonance mechanisms within the ranges listed in theTable 3. Areas adopted for fluctuation of non-resonant parameters were chosen at theirupper limits compatible to measured differential cross-sections. For each trial set of JM05parameters all single differential cross-sections were calculated. From comparison betweenmeasured and calculated single differential cross-sections χ2/d.p. were estimated separatelyin each Q2 bin and averaged over all available W-bins. We selected calculated cross-sectionswith χ2/d.p. below some predetermined value, for which all calculated differential cross-sections are mostly inside the data uncertainties. N ∗ electro-couplings for selected in thisway calculated cross-sections were averaged. Their mean value were assigned to electro-couplings extracted from the data fit, while dispersions of their distributions were treated aselectro-couplings uncertainties.
We found that from available CLAS 2π data we are able to determine N ∗ electromagneticform factors with accuracy 10 % or even better for largest amplitudes, while for intermediateelectro-coupling values uncertainties range from 10 to 30 %.
JM05 model will be used to determine N ∗ electro-couplings from data on 2π electro-production at high Q2, accessible with 11 GeV beam. It will be first step of analysis witha goal to determine ranges for N ∗ electro-couplings. This information will be used as inputfor final evaluation of N ∗ electromagnetic form factors and hadronic parameters within theframework of coupled channel approach, described in Sections 5.2-5.5.
Based upon capability of JM05 model to extract electro-couplings for most excited protonstate from the available CLAS 2π data, we expect, that at photon virtualities covered by 11GeV beam we will be able to determine N ∗ electro-couplings if:
• collected statistic will be comparable with achieved in analyzed CLAS data;
• ratio resonance over non-resonance contributions will be comparable or better than inalready studied area of Q2.
7.1.5 Feasibility for N ∗ studies in 2π electro-production at high still unexplored
photon virtualities
To evaluate feasibility of extracting N ∗ electro-couplings, first we estimated ratio resonantover non-resonant contributions at photon virtualities above covered by available CLAS 2πmeasurements. within the framework of JM03 version [147, 148]. These calculations were
51
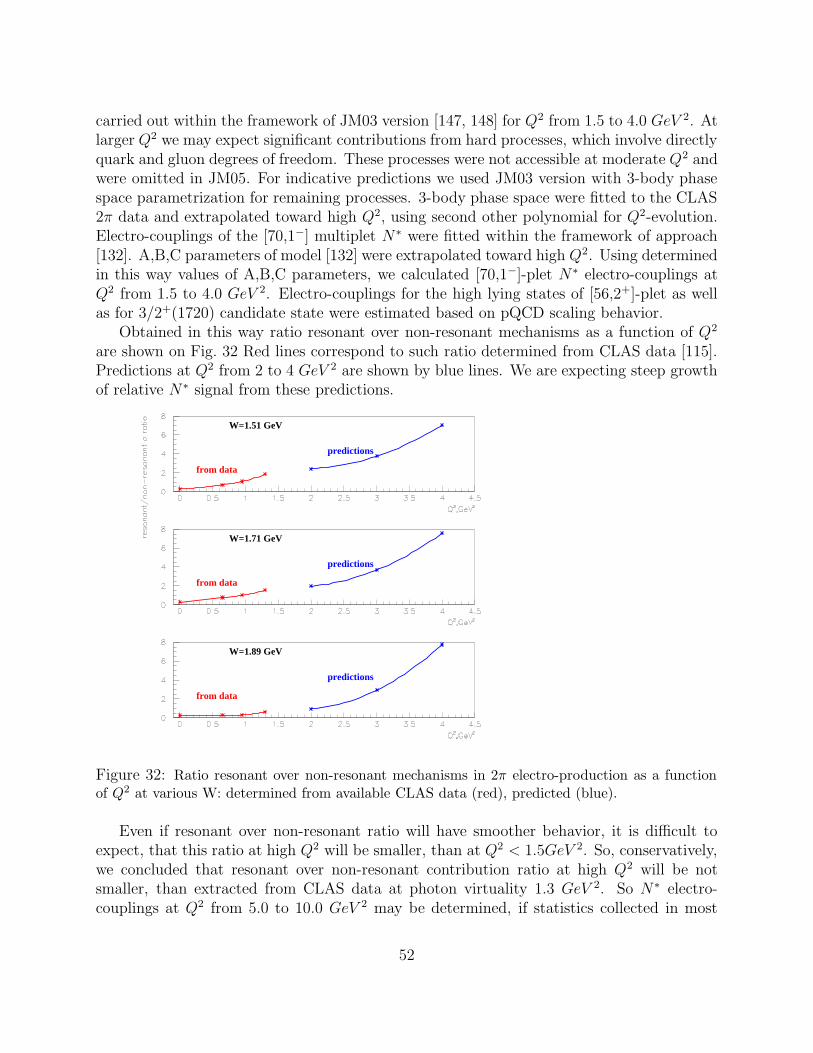
carried out within the framework of JM03 version [147, 148] for Q2 from 1.5 to 4.0 GeV 2. Atlarger Q2 we may expect significant contributions from hard processes, which involve directlyquark and gluon degrees of freedom. These processes were not accessible at moderate Q2 andwere omitted in JM05. For indicative predictions we used JM03 version with 3-body phasespace parametrization for remaining processes. 3-body phase space were fitted to the CLAS2π data and extrapolated toward high Q2, using second other polynomial for Q2-evolution.Electro-couplings of the [70,1−] multiplet N∗ were fitted within the framework of approach[132]. A,B,C parameters of model [132] were extrapolated toward high Q2. Using determinedin this way values of A,B,C parameters, we calculated [70,1−]-plet N∗ electro-couplings atQ2 from 1.5 to 4.0 GeV 2. Electro-couplings for the high lying states of [56,2+]-plet as wellas for 3/2+(1720) candidate state were estimated based on pQCD scaling behavior.
Obtained in this way ratio resonant over non-resonant mechanisms as a function of Q2
are shown on Fig. 32 Red lines correspond to such ratio determined from CLAS data [115].Predictions at Q2 from 2 to 4 GeV 2 are shown by blue lines. We are expecting steep growthof relative N ∗ signal from these predictions.
from data
predictions
W=1.51 GeV
from data
predictions
W=1.71 GeV
from data
predictions
W=1.89 GeV
Figure 32: Ratio resonant over non-resonant mechanisms in 2π electro-production as a functionof Q2 at various W: determined from available CLAS data (red), predicted (blue).
Even if resonant over non-resonant ratio will have smoother behavior, it is difficult toexpect, that this ratio at high Q2 will be smaller, than at Q2 < 1.5GeV 2. So, conservatively,we concluded that resonant over non-resonant contribution ratio at high Q2 will be notsmaller, than extracted from CLAS data at photon virtuality 1.3 GeV 2. So N∗ electro-couplings at Q2 from 5.0 to 10.0 GeV 2 may be determined, if statistics collected in most
52

W&Q2 bins, covered by measurements with CLAS12 will be comparable or larger, than itwas achieved in available CLAS 2π data [115],[119].
7.1.6 Simulation of 2π electro-production with CLAS12. Feasibility to study
2π exclusive channel at Q2 from 5.0 to 10 GeV 2
We carried out the studies of resolution and acceptance of CLAS12 detector with a goal toevaluate our capabilities to obtain double charged pion electro-production cross-sections inQ2 area from 5.0 to 10 GeV 2. In simulation we used Genova event generator [164]. For11 GeV electron beam we simulated 2 pion and 3 pion electro-production channels. CLASFast MC package [165] were applied to generated events for simulation of CLAS12 response.Simulated and accepted events were studied in kinematics area over W from 1.2 to 3.5 GeVand for the photon virtualities from 5.0 to 10.0 GeV 2. For accepted 2π events we appliedselection procedures and kinematics cuts similar to already used in analysis of availableCLAS 2π data.
Fist, we studied capability to isolate sample with 2π events in multi pion electro-production,Distribution over M 2
π+pX missing mass squared for 2 pion and 3 pion events are shown onFig. 33, accounting all momentum smearing expected for CLAS12.
Figure 33: Distributions over M 2π+pX for detected 2π events (black) and 3π events (red) curves.
Applying cut M2π+pX < 0.07 GeV 2, we will achieve reasonable isolation of 2π events with
few percents multi pion contamination. Quality of multi pion background rejection maybe further improved, if we restrict W range by area below 2.0 GeV, which corresponds to
53

major part of conventional N ∗. Another way to improve multi pion rejection is to exploitcorrelation between missing mass squared M 2
π+π−pX and missing energies for π−π+p finalhadronic system. Of course, to apply this method we need to detected all 3 final hadrons.M2
π+π−pX vs missing energy correlations are shown on Fig. 34 for 2 and 3 pion events. 2πevents are situated in the spot around zero, which size is determined by mass and energyresolution. 3 pion events create strip in vertical missing energy direction. 2π event separationis pretty good, however this technique causes efficiency reduction.
Figure 34: Separation of 2π events from multi pion background, using correlations missing energyvs M2
pπ+π−X . Spot around zero are 2π events. Strip in vertical dimension is created by 3 pionevents.
We carried out efficiency evaluation for measurements of 2π events with CLAS12. Esti-mated in MC simulation efficiency for detection of 2π events, when all three final hadronsare detected is shown on Fig. 35. Efficiency is rather uniform in (Q2& W) plane with averagevalue 20 %. This value of efficiency was used in evaluation of counting rate.
On Fig. 36 and Fig. 37 we show efficiency for various π+π−p final state kinematicsvariables. All these efficiencies were averaged over other 4 kinematics variable for π−π+pfinal state. Efficiencies were estimated in W interval from 1.5 to 1.7 GeV and averaged overphoton virtualities from 5.0 to 10.0 GeV 2. Top and middle rows on Fig. 36 and Fig. 37 aregenerated and accepted events respectively, while efficiencies are shown at the bottom rows.
Efficiencies for various final state hadronic variables are rather flat. So, even simplestevent generators may be used to estimate efficiencies in real data analysis.
Momentum resolution for final hadron are shown on Fig. 38, Fig. 39 and Fig. 40. The(prec − pgen)/pgen distributions at various particle momenta are shown. Here prec and pgen
54

Figure 35: Efficiency for detection of 2π events with CLAS12 in (Q2&W) plane for π+π−p detected
Figure 36: Efficiency for various mass distributions in 2π production at W from 1.5 to 1.7 GeV,averaged over 4 other kinematics variables and Q2 from 5.0 to 10.0 GeV 2
55

Figure 37: Efficiency for various angular distributions in 2π production at W from 1.5 to 1.7 GeV,averaged over 4 other kinematics variables and Q2 from 5.0 to 10.0 GeV 2.
stand for momenta of reconstructed and generated hadrons respectively. Momentum res-olution ranges within several percents for FWHM and rather independent from particlemomenta.
Figure 38: Momentum resolution for π−. prec, pgen are momenta for reconstructed and generatedparticle respectively.
56

Figure 39: Momentum resolution for π+. prec, pgen are momenta for reconstructed and generatedparticle respectively.
Figure 40: Momentum resolution for protons. prec, pgen are momenta for reconstructed and gen-erated particle respectively.
Using expected final particle momentum smearing for CLAS12, we estimated W-resolution,averaged over W from 1.3 to 2.0 GeV and Q2 from 5.0 to 10 GeV 2. Calculations were car-ried out for two possible ways to determine W from data. First, W may be estimated fromelectron scattering kinematics. W resolution achieved in this way is shown on Fig. 41 asselected 2π event distribution over value (Wrec −Wgen)/Wgen. Here Wrec and Wgen stand forW of reconstructed and generated events respectively.
W resolution at W range from 1.5 to 2.0 GeV is 1.5% σ value or 3.3% FWHM. This
57

Figure 41: Resolution over W , averaged over W from 1.5 to 2.0GeV nd over photon virtualitiesfrom 5.0 to 10GeV 2. Invariant mass of the final hadronic system were determined from electronscattering kinematics.
Figure 42: The same as on Fig. 41. Invariant masses of the final hadronic system were determinedfrom the final hadron momenta.
resolution improves as W increases. However for W=1.7 GeV 3.3% FWHM corresponds toalmost 60 MeV absolute value for resolution. It is comparable with total hadronic decaywidth of N∗ in this mass range. So we tried to figure out a way to improve W resolution.We studied another possibility to determine W from four-momenta of the final hadrons.Absolute value of the final hadron momenta are defined by W. So, at W < 2.0 GeV absolute
58
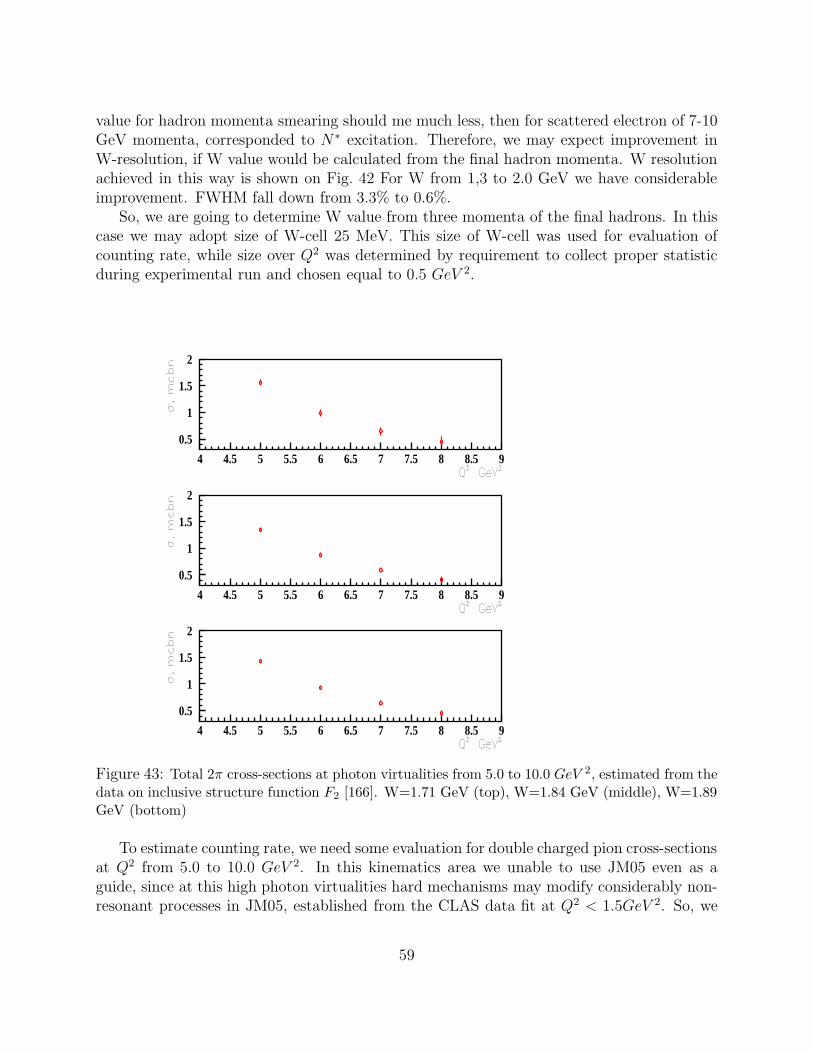
value for hadron momenta smearing should me much less, then for scattered electron of 7-10GeV momenta, corresponded to N ∗ excitation. Therefore, we may expect improvement inW-resolution, if W value would be calculated from the final hadron momenta. W resolutionachieved in this way is shown on Fig. 42 For W from 1,3 to 2.0 GeV we have considerableimprovement. FWHM fall down from 3.3% to 0.6%.
So, we are going to determine W value from three momenta of the final hadrons. In thiscase we may adopt size of W-cell 25 MeV. This size of W-cell was used for evaluation ofcounting rate, while size over Q2 was determined by requirement to collect proper statisticduring experimental run and chosen equal to 0.5 GeV 2.
0.5
1
1.5
2
4 4.5 5 5.5 6 6.5 7 7.5 8 8.5 9
0.5
1
1.5
2
4 4.5 5 5.5 6 6.5 7 7.5 8 8.5 9
0.5
1
1.5
2
4 4.5 5 5.5 6 6.5 7 7.5 8 8.5 9
Figure 43: Total 2π cross-sections at photon virtualities from 5.0 to 10.0 GeV 2, estimated from thedata on inclusive structure function F2 [166]. W=1.71 GeV (top), W=1.84 GeV (middle), W=1.89GeV (bottom)
To estimate counting rate, we need some evaluation for double charged pion cross-sectionsat Q2 from 5.0 to 10.0 GeV 2. In this kinematics area we unable to use JM05 even as aguide, since at this high photon virtualities hard mechanisms may modify considerably non-resonant processes in JM05, established from the CLAS data fit at Q2 < 1.5GeV 2. So, we
59

accepted another approach for indicative estimates of total 2π cross-sections. As a startingpoint we used fit of inclusive structure function proposed in [166]. This fit works prettygood at Q2<10.0 GeV 2 in N∗ excitation region. From this fit we estimated total inclusivecross-section under virtual photons. To obtain 2π total cross-sections, we used ratio 2πcross-section over inclusive virtual photon cross-section. This ratio was taken from CLASdata at Q2 < 1.5GeV 2 and extrapolated to the Q2 area from 5.0 to 10.0 GeV 2. Estimatedin this way total 2π cross-sections at several W values are shown on Fig. 43.
We used average efficiency value for detection of 2π events 20%, estimated with CLAS12Fast MC.
The number of collected events as described above (Q2&W ) cells is shown on Fig. 44 for60 days run time.
Figure 44: Number of collected 2π events in N ∗ excitation region with CLAS12. 60 days run time.1035 cm−2s−1 luminosity.
In analysis of available CLAS 2π data [115, 119] we needed statistic above 10000 eventsfor most (Q2&W ) cells, to obtain entire set of 2π single differential cross-sections, describedin Section 7.1.1. As it follow from Fig. 44, counting rate for 2π events with CLAS12 will besufficient to produce cell population >10000 2π events in W area from 1.7 to 1.9 GeV andlikely in overall N ∗ excitation region, based on available data both on W-dependence of 2πintegrated cross-sections and inclusive structure functions.
60
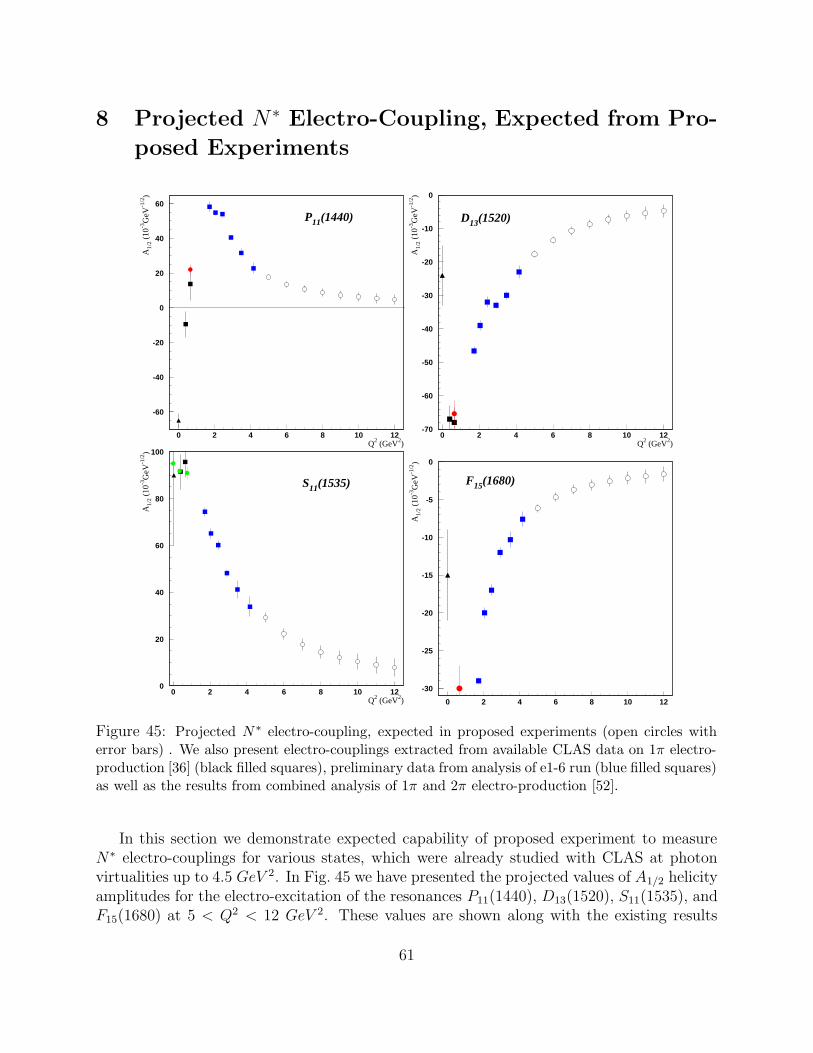
8 Projected N ∗ Electro-Coupling, Expected from Pro-
posed Experiments
-60
-40
-20
0
20
40
60
0 2 4 6 8 10 12Q2 (GeV2)
A1/
2 (1
0-3G
eV-1
/2)
P11(1440)
-70
-60
-50
-40
-30
-20
-10
0
0 2 4 6 8 10 12Q2 (GeV2)
A1/
2 (1
0-3G
eV-1
/2)
D13(1520)
0
20
40
60
80
100
0 2 4 6 8 10 12Q2 (GeV2)
A1/
2 (1
0-3G
eV-1
/2)
S11(1535)
-30
-25
-20
-15
-10
-5
0
0 2 4 6 8 10 12
A1/
2 (1
0-3G
eV-1
/2)
F15(1680)
Figure 45: Projected N ∗ electro-coupling, expected in proposed experiments (open circles witherror bars) . We also present electro-couplings extracted from available CLAS data on 1π electro-production [36] (black filled squares), preliminary data from analysis of e1-6 run (blue filled squares)as well as the results from combined analysis of 1π and 2π electro-production [52].
In this section we demonstrate expected capability of proposed experiment to measureN∗ electro-couplings for various states, which were already studied with CLAS at photonvirtualities up to 4.5 GeV 2. In Fig. 45 we have presented the projected values of A1/2 helicityamplitudes for the electro-excitation of the resonances P11(1440), D13(1520), S11(1535), andF15(1680) at 5 < Q2 < 12 GeV 2. These values are shown along with the existing results
61

at smaller Q2. The projected values of helicity amplitudes are obtained via continuationof the results at Q2 = 2.91 − 4.16 GeV 2 according to pQCD behavior A1/2 ∼ Q3. Asit was demonstrated in Fig. 5 such assumption can be applied to the helicity amplitudesof the P11(1440), D13(1520), S11(1535), and F15(1680). The presented errors of projectedamplitudes are obtained supposing that the relative errors and amount of data will be closeto those obtained in the CLAS experiments for π+ electro-production at Q2 from 1.72 to4.16 GeV 2.
62

9 Summary and Beam Time Request
In recent years the CLAS Collaboration has succeeded to determine the Q2 evolution ofbaryon resonance electro-coupling amplitudes from unpolarized single- and double-pion electro-production data. Consistent results for both channels have been extracted by three differentmodels, the Unitary Isobar Model (UIM) [51, 53], a dispersion theoretical approach [51, 53],and the JLab-MSU isobar model (JM05) [142]. Most of these results are still preliminary,but in the final stage of analysis, which undoubtedly shows that we are able to extract reso-nance parameters with unprecedented accuracy for many excited states in the mass and fourmomentum transfer region below W < 1.7GeV and Q2 < 4.5GeV 2 for single-pion (e1-6 runperiod) and below W < 2.0GeV and Q2 < 1.5GeV 2 for double-pion final states (e1 runperiod).
Within the total requested beam time of 60 days at 11GeV electron beam energy withthe highest possible electron beam polarization, the estimated collected statistics in most ofthe Q2 and W bins will be higher and for the highest Q2 bins comparable to the statisticsaccumulated in the previous e1 and e1-6 run periods. Furthermore the new results showthat the overall resonance to background ratio increases with increasing Q2. Therefore weare confident that we will be able to extract the resonance electro-coupling amplitudes upto typically 12GeV 2 by using the established model approaches applied to the same numberof measured observables, which has been shown to be sufficient for this analysis.
Beam Time Request Beam Beam Energy Luminosity Target Detector
60 days polarized e− 11GeV 1035 cm−2s−1 LH2 base equipment
63

Bibliography
[1] M. Gell-Mann, Phys. Lett. 8, 214 (1964)
[2] G. Zweig, CERN Report 8182/TH-412 (1964) (unpublished).
[3] H.L. Anderson, E. Fermi, E. A. Long, D.E. Nagle, Phys. Rev. 85, 936 (1952).
[4] O. W. Greenberg, Phys. Rev. Lett. 13, 598 (1964).
[5] S. Eidelmann et al. [Review of Particle Properties], Phys. Lett. B592 (2004).
[6] H. Ichie, V. Bornyakov, T. Steuer, G. Schierholz, hep-lat/0212024 (2002).
[7] T. T. Takahashi, H.Suganuma, Phys.Rev.,D70:074506 (2004).
[8] G. S. Bali, et. al., Phys.Rev.,D71:114513 (2005).
[9] A. D. Martin, et. al., Eur.Phys.J.C35, 325 (2004).
[10] E. Leader, et. al., Eur.Phys.J.C23, 479 (2002).
[11] W. Melnitchouk, R. Ent and C. Keppel, Phys. Rept. 406, 127 (2005).
[12] H. Iida, et. al., Nucl.Phys.Proc.Suppl. 141,191 (2005).
[13] G. Laveissiere et al., Phys. Rev. C 69 045203 (2004).
[14] R.A. Arndt et al., nucl-th/9708006 (1997) and Phys. Rev. C 66, 055213 (2002).
[15] Q.B. Li, D.O. Riska, nucl-th/0605076
[16] R. Petronzio, et. al., Phys.Rev.,D67:094004 (2003).
[17] A.V. Sidorov, C. Weiss, Phys.Rev.,D73:074016 (2006).
[18] D. Diakonov, V. Petrov, Phys. Lett. B147, 351 (1984).
[19] V. D. Burkert and T.S. Lee, Int. J. Mod. Phys. E13, 1035 (2004), nucl-ex/0407020.
[20] C. Alexandrou et al., Phys.Rev.D69:114506 (2004).
[21] C. Alexandrou et al., hep-lat/0409122.
[22] K. Goeke, M. V. Polyakov and M. Vanderhaeghen, Prog. Part. Nucl. Phys. 47, 401(2001) [arXiv:hep-ph/0106012].
[23] L. L. Frankfurt, M. V. Polyakov, M. Strikman and M. Vanderghehgan. Phys. Rev.Lett. 84, 2589 (2000)
64

[24] S. S. Kamalov and S.N. Yang, Workshop N*2000, World Scientific (2001).
[25] C. Mertz et al., Phys. Rev. Lett. 86, 2963 (2001).
[26] E. Pace, G. Salme, and S. Simula, Few Body Syst. Suppl. 10:407 (1999).
[27] M. Aiello, M.M. Giannini, and E. Santopinto, J. Phys. G24, 753 (1998).
[28] F. Cano and P. Gonzales, Phys. Lett. B431:270 (1998).
[29] T. Sato and T.S. Lee, Phys. Rev. C63:055201, 2001.
[30] D. O. Riska, Talk at MENU2004, Beijing (2004).
[31] A. Matsuyama, T. Sato, and T.-S. H Lee, to be submitted to Phys. Report (2006)
[32] A. Matsuyama, Phys. Lett. B152, 42 (1985)
[33] T. Sato and T.-S. H. Lee, Phys. Rev. C54, 2660 (1996); C63, 055201 (2001)
[34] M. Paris, Phys. Rev. Lett. 95, 202002 (2005)
[35] B. Julia-Diaz, B. Saghai, T.-S. H. Lee, and F. Tabakin, Phys. Rev. C73, 055204 (2006)
[36] I.G.Aznauryan et al., Phys.Rev. C71, 015201 (2005)
[37] B. Julia-Diaz, T.-S. H. Lee, A. Matsuyama, M. Paris, and T. Sato, in progress
[38] K. Nakayama et al., in progress
[39] V.V. Frolov et al., Phys. Rev. Lett. 82 (1999) 45.
[40] J. Volmer et al., Phys. Rev. Lett. 86 (2001) 1713.
[41] M.K. Jones et al., Phys. Rev. Lett. 84 (2000) 1398.
[42] O. Gayou et al., Phys. Rev. Lett. 88 092301 (2002).
[43] D.J. Hamilton et al., Phys. Rev. Lett. 94 242001 (2005).
[44] N. Isgur, S. Jeschonnek, W. Melnitchouk and J. W. Van Orden, Phys. Rev. D 64,054005 (2001).
[45] F. E. Close and W. Melnitchouk, Phys. Rev. C 68, 035210 (2003).
[46] M. Aiello et al., J. Phys. G 24 (1998) 753.
[47] L. Andivahis et al., Phys. Rev. D 50 (1994) 5491.
[48] R.G. Arnold et al., Phys. Rev. Lett 57 (1986) 174.
65

[49] I.G. Aznauryan and K. Oganessyan, Phys. Lett. B 249 (1990) 309.
[50] I.G. Aznauryan, Phys. Rev. C 68 065204 (2003).
[51] I.G. Aznauryan, Phys. Rev. C 67 015209 (2003).
[52] I.G. Aznauryan et al., Phys. Rev. C 72 045201 (2005).
[53] I.G. Aznauryan, in preparation (2006).
[54] W. Bartel et al., Nucl. Phys. B 58 (1973) 429.
[55] Ch. Berger et al., Phys. Lett. B 35 (1971) 87.
[56] C. J. Bebek et al., Phys. Rev. D 13 (1976) 25.
[57] C. J. Bebek et al., Phys. Rev. D 17 (1978) 1693.
[58] R. Beck et al., Phys. Lett. C 61 035204 (2000).
[59] E.D. Bloom et al., Phys. Rev. Lett 23 (1969) 930.
[60] A. Bodek et al., Phys. Rev. D 20 (1979) 1471.
[61] P. Bosted et al., Phys. Rev. C 51 (1995) 718.
[62] P.O. Bowman et al., Phys. Lett. D 66 014505 (2002) and arXiv:hep-lat/0209129 (2002).
[63] M. Breidenbach et al., Phys. Rev. Lett 23 (1969) 935.
[64] F. W. Brasse et al., DESY 76/11 (1976).
[65] F. W. Brasse et al., Nucl. Phys. B 110 (1976) 410.
[66] F. W. Brasse et al., Z. Phys. C 22 (1984) 33.
[67] S.J. Brodsky and G.P. Lepage, Phys. Lett. B 87 (1979) 359.
[68] S.J. Brodsky and G.P. Lepage, Phys. Rev. D 22 (1980) 2157.
[69] V.M. Braun et al., Phys. Lett. D 73 034020 (2006).
[70] V. D. Burkert, T.-S.H. Lee, Int. J. Mod. Phys. E 13 (2004) 1035.
[71] S. Capstick and B.D. Keister, Phys. Rev. D 51 (1995) 3598.
[72] F. Cano and P. Gonzalez, Phys. Lett. B 431 (1998) 270.
[73] V.L. Chernyak and A.R. Zhitnitsky, JETP Lett. 25 (1977) 510; V.L. Chernyak, A.R.Zhitnitsky and V.G. Serbo, JETP Lett. 26 (1977) 594.
66

[74] J.C. Collins et al., Phys. Rev. D. 56 (1997) 2982.
[75] D. Day, arXiv:nucl-ex/0502003.
[76] D. Drechsel et al., Nucl. Phys. A 645 (1999) 145.
[77] H. K. Egiyan et al., Phys. Rev. C 73 025204 (2006).
[78] V. Eletski and Ya. Kogan, Yad. Fiz. 39 (1984) 138.
[79] O. Gayou et al., Phys. Rev. C 64 038202 (2001).
[80] R.W. Gothe et al., Proc. NSTAR 2002, Pittsburgh, PA, World Scientific (2003) 220.
[81] R. Hofstadter and R.W. McAllister, Phys. Rev. 98 (1955) 183 and Phys. Rev. 102
(1956) 851.
[82] X. Ji, Phys. Rev. Lett. 78 (1997) 610 and Phys. Rev. D. 55 (1997) 7114.
[83] X. Ji et al., Phys. Rev. Lett. 90 241601 (2003).
[84] K. Joo et al., Phys. Rev. Lett. 88 122001 (2002).
[85] K. Joo et al., Phys. Rev. C 68 032201 (2003).
[86] K. Joo et al., Phys. Rev. C 70 042201 (2004).
[87] S.S. Kamalov et al., Phys. Lett. C 64 032201 (2003).
[88] C. Keppel, Ph. D thesis, American University, Washington, DC (1994).
[89] J.J. Kelly et al., Phys. Rev. Lett. 95 102001 (2005).
[90] I.S. Barker, A. Donnachie and J.K. Storrow, Nucl. Phys. B 95 (1975) 347.
[91] J. Litt et al., Phys. Lett. B 31 (1970) 40.
[92] Z. Li and V. Burkert, Phys. Rev. D 46 (1992) 70.
[93] A. Lung et al., Phys. Rev. Lett. 70 (1993) 718.
[94] C. Mertz et al., Phys. Rev. Lett. 86 (2001) 2963.
[95] D. Mueller et al., Fortschritte der Physik 42 (1994) 101.
[96] E. Pace et al., Few Body Syst. Suppl. 10 (1999) 407.
[97] K. Park et al., to be submitted to Phys. Rev. C (2006).
[98] C.E.Carlson and J. Poor, Phys. Rev. D 38, (1988) 2758.
67

[99] S. Eidelman et al., Phys. Lett. B 592, (2004) 1.
[100] S. Poucher et al., Phys. Rev. Lett. 32, (1974) 118.
[101] L. E. Price et al., Phys. Rev. D 4 (1971) 45.
[102] A.V. Radyushkin, Phys. Rev. B 380 (1997) 417.
[103] S. Rock et al., Phys. Rev. Lett. 49 (1982) 1139.
[104] S. Rock et al., Phys. Rev. D 46 (1992) 24.
[105] T. Sato and T.S.H. Lee, Phys. Lett. C 54 (1996) 2660.
[106] M.A. Shifman, A.I. Vainshtein, V.I. Zakharov, Nucl. Phys. B147 (1979) 385.
[107] A. F. Still et al., Phys. Rev. D 48 (1993) 29.
[108] P. Stoler, Phys. Rep. 226 (1993) 103.
[109] P. Stoler, Phys. Rev. Lett. 91 172303 (2003).
[110] M. Ungaro et al., CLAS, to be submitted to Phys. Rev. Lett. (2006).
[111] R. L. Walker, Phys. Rev. 182 (1969) 1729.
[112] M. Warns et al., Z. Phys. C 45 (1990) 627.
[113] R. C. Walker et al., Phys. Rev. D 49 (1994) 5671.
[114] M.K. Jones et al. Phys. Rev. Lett. 84,1398 (2000); O. Gayou et al. Phys. Rev.
C64,038202 (2001).
[115] M. Ripani, et. al., Phys. Rev. Lett. 91, 022002 (2003).
[116] M.Bellis, et.al. (CLAS Collaboration), Proceedings of NSTAR2004 workshop , March24-27, 2004, Grenoble, France, World Scientific, ed. by J.-P. Bocquet, V. Kuznetsov,D. Rebreyend, 139.
[117] M. Battaglieri, et. al. Phys. Rev. Lett. 87, 172002 (2001).
[118] S. Strauch, et. al.,Phys. Rev. Lett., accepted, hep-ex/0508002.
[119] G. Fedotov, et. al., CLAS Analysis Note, June2006
[120] U. Thoma, Int. J. Mod. Phys. A20, 280 (2005).
[121] C. Wu, et. al. Eur. Phys. J A23, 317 (2005).
[122] Y. Assafiri, et. al., Phys. Rev. Lett. 90, 222001 (2003).
68

[123] J. Ahrens, et. al., Phys. Lett. B624, 173 (2005).
[124] J. Ahrens, et. al., Phys. Lett. B551, 49 (2003).
[125] M. Kotulla, et. al., Phys. Lett. B578, 63 (2004).
[126] W. Langgartner, et. al., Phys. Rev. Lett. 87, 052001-1 (2001).
[127] F. Harter, et. al., Phys. Lett. B401, 229 (1997).
[128] A. Braghieri, et. al., Phys. Lett. B363, 46 (1995).
[129] Review of Particle Physics, S. Eidelman et al., Phys. Lett. B592, 1 (2004).
[130] L. Tiator, et. al., Eur. Phys. J A19, 55 (2004).
[131] D. Merten, et. al., Eur. Phys. J A14, 477 (2002).
[132] V. D. Burkert, et. al., Phys. Rev. C67, 035204 (2003).
[133] I. G. Aznauryan, et. al., Yad. Fiz. 41, 249 (1985).
[134] R. Jaffe, F. Wilczek., Phys. Rev. Lett. 91, 232003 (2003).
[135] F. Wilczek, arXiv:hep-ph/0406168.
[136] Q. Zhao, F.E.Close, arXiv:hep-ph/0605336.
[137] M. M. Giannini, et. al., Phys. Rev. C72, 0220201(R) (2005).
[138] J. Chizma, G. Karl, Phys. Rev.D68, 054007 (2003).
[139] L. Glozman, Nucl. Phys, A755, 17 (2005).
[140] S. Capstick, W. Roberts., Prog. Part. Nucl. Phys. 45, S241 (2000).
[141] L. Glozman, Int. J. Mod. Phys. A21, 475 (2006).
[142] V. Mokeev, et. al., arXiv:hep-ph/0512164.
[143] Cambridge Bubble Chamber Group, Phys. Rev. 155, 1477(1967); ABBHHM Collabo-ration, Phys. Rev. 175, 1669 (1968).
[144] M. Ripani et. al., Nucl. Phys, A672, 220 (2000).
[145] M. Ripani et. al., Phys, of Atom. Nucl. 63, 1943 (2000).
[146] V. Mokeev et. al., Phys, of Atom. Nucl. 64, 1292 (2001).
[147] V. Mokeev et. al., Phys, of Atom. Nucl. 66, 1322 (2003).
69

[148] V. Burkert et. al., Phys, of Atom. Nucl. 66, 2149 (2003).
[149] A. Anisovich, et. al., Eur. Phys. J A24, 111 (2005).
[150] D. Luke and P. Soding, Springer Tracts in Mod. Phys. 59 (1971).
[151] A. Bartl, W. Majerotto, D. Schildknecht, Nuovo Cimento 12A, 703(1972).
[152] L.Y. Murphy, J.M. Laget, DAPNIA-SPHN-96-10, Mar. 1996.
[153] W. Roberts, JLAB-THY-97-01, (1997).
[154] W. Roberts, T. Oed, Phys. Rev., C 71, 055201 (2005).
[155] J.A. Gomez-Tejedor and E. Oset, Nucl.Phys. A571, 667(1994); J.A. Gomez-Tejedorand E. Oset, Nucl.Phys. A600(1996).
[156] J.C Nacher et. al., Nucl. Phys, A695, 295 (2001).
[157] J.C Nacher et. al., Nucl. Phys, A697, 372 (2002).
[158] K. Ochi, M. Hirata, T. Takahi, Phys. Rev., C56, 1472(1997).
[159] V.D. Burkert, et. al., Proc. of the 17 International UPAP Conference on Few-BodyProblems in Physics, Durham. NC, USA, 5-10 June 2003, Elsevier, 2004, ed.by W. G.Glockle, W. Tornow, S231.
[160] D.G. Cassel, et. al., Phys. Rev. D24 2787 (1981).
[161] N.V. Shvedunov, et. al., accepted by Physics of Atomic Nuclei
[162] H.Avakyan, et. al, CLAS12 Proposal
[163] V.I. Mokeev, presentation at CLAS Collaboration Meeting, http://www.jlab.org/ mo-keev/CLAS030206.ppt
[164] M. Ripani and E.N. Golovach based on P. Corvisiero et al., NIM A 346, (1994) 433.
[165] CLAS12 Fast MC
[166] L. W. Witlow, et. al., Phys. Lett. B282 475 (1992).
70