Embed Size (px)
Citation preview

Nucleation Behavior of
Polypropylene with a Nan-O-Sil
Additive
Dr. Previn Shah, Rheoplast
Associates
James Browne
Applications Scientist
TA Instruments
159 Lukens Drive
New Castle, DE 19720
(302) 427-4015
email: [email protected]
Associates

Samples and Request
� 3 Samples of Polypropylene
� 1) Neat PP
� 2) Nan-O-Sil Powder
� 3) Nan-O-Sil Master Batch
Request is to determine nucleation effect of added Nan-O-Sil on
polypropylene specifically in nucleation geometry and effect on
activation energy. activation energy.

Experimental: Method
� Nucleation effect will be evaluated with isothermal differential scanning
calorimetry.
� Sample is heated significantly higher than the equilibrium melting
temperature and cooled rapidly to a temperature where crystallization
occurs. Area under the curve is evaluated as fraction crystallized as a
function of time. Experiment is repeated at temperatures so that 5
repetitions approximately 10 oC apart are obtained.
� Equation 1
� Equation 1 describes the volume fraction crystallized as a function of
time.
C
t
t
C
H
dtdt
dH
tX∆
=∫∞
0)(

Experimental: Method
� The resultant curve represented by X(t) is evaluated using two
mathematical models:
� 1) Avrami
)tk(X(t) an
a−−= exp1
tnktX aa loglog))(1ln(log( +=−−
� Equation 2 and 3
� Equations 2 and 3 are the Avrami and linearized Avrami equations
� The Avrami parameter n is related to the nucleation geometry
� n=1 – rod like growth, single dimension
� n=2 – planar growth, two dimensions
� n=3 – spherical growth, 3 dimensions
� k = Avrami rate constant
tnktX aa loglog))(1ln(log( +=−−

Experimental: Method
� 2) Malkin Model
� Equation 4 – Malkin Equation
� Malkin parameter C is related to nucleation growth – it is the
))exp(
11)(
10
0
tCC
CtX
+
+−=
� Malkin parameter C0 is related to nucleation growth – it is the
proportional to the ratio of secondary nucleation growth (propagation)
to primary growth
� Malkin Parameter C1 is a rate constant that is proportional to total
nucleation.

Experimental: Method
� 3) Malkin relation to Avrami parameters k and n
where
tCC
CtX
00
0 ))exp(
11)(
+
+−=
n
knC
nC
where
/1
1
0
)2ln()24ln(
44
−=
−=

Experimental: Method
� Data calculated from Avrami parameters:
� Equation 5 t1/2
n
kt
/1
2/1
2ln
=
1� Equation 6 tau
2/1
1
t=τ

Experimental: Method
� 4) Calculation of Activation Energy – Effect of nucleation can be
measured by comparing activation energy of non-nucleated samples
to nucleated samples.
� The general equation used to calculate Activation energy is:
)/exp(0 RTEcT
∆−Ψ=Ψ• Equation 7
• where Ψ can be
– k
– k1/n
– C1– τ– dX(t)/ dt
0cT
• ∆E = Crystallization Activation Energy
• T = Temperature (K)
• R = Gas Constant

Experimental: Method
� Polypropylene containing a nucleator will show some unique
characteristics including:
� Increased crystallization temperature upon dynamic cooling
� Avrami geometric exponent (n) of around 2
� Decreased Malkin C0 constant – Malkin C0 is directly proportional to
the ratio of secondary nucleation to primary nucleation.
� Lower crystallization activation energy� Lower crystallization activation energy
� Higher rate constants, lower values of t1/2 (higher τ)
� Obvious differences in heat flow and fraction crystallized with respect
to time

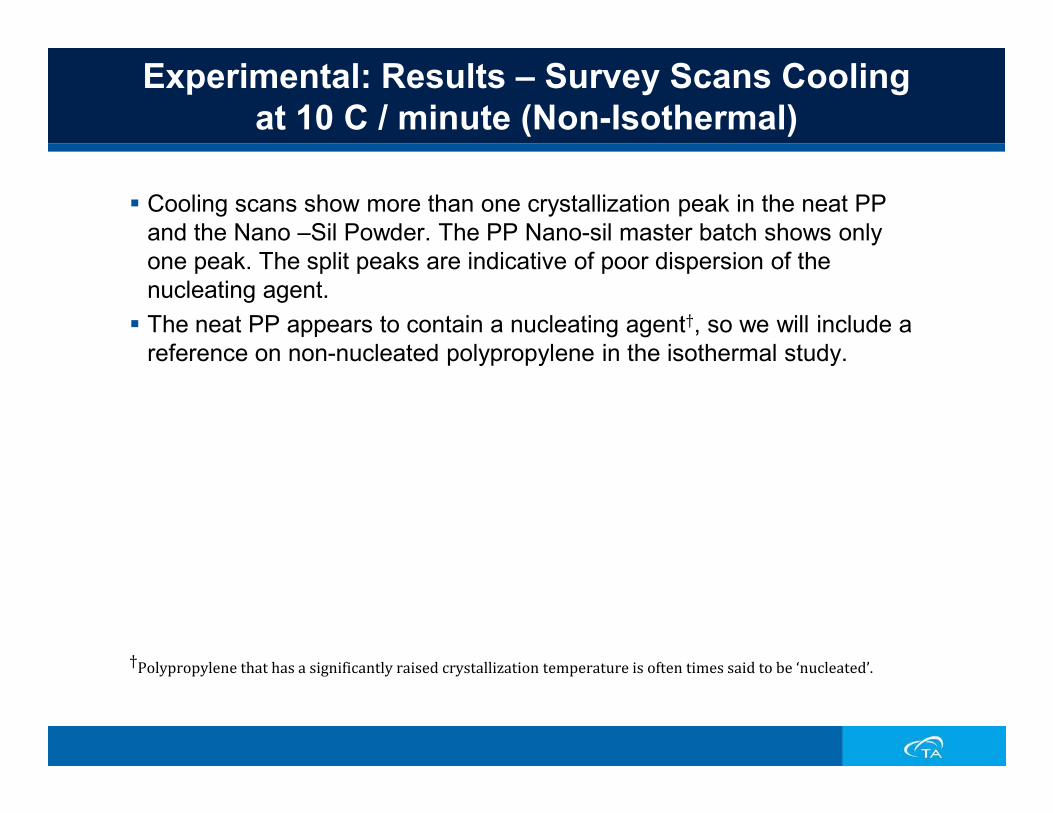
Experimental: Results – Survey Scans Cooling
at 10 C / minute (Non-Isothermal)
112.90°C
120.71°C
127.78°C
117.71°C
2
3
4
Heat Flow (W/g)
PP Control HCHNeat PPPP Nano-Sil PowderPP Nano-Sil MB
120.71°C
-1
0
1Heat Flow (W/g)
80 100 120 140 160
Temperature (°C)Exo Up Universal V4.7A TA Instruments
Experimental: Results – Survey Scans Cooling
at 10 C / minute (Non-Isothermal)
� Cooling scans show more than one crystallization peak in the neat PP
and the Nano –Sil Powder. The PP Nano-sil master batch shows only
one peak. The split peaks are indicative of poor dispersion of the
nucleating agent.
� The neat PP appears to contain a nucleating agent†, so we will include a
reference on non-nucleated polypropylene in the isothermal study.
†Polypropylene that has a significantly raised crystallization temperature is often times said to be ‘nucleated’.

Experimental
� Isothermal Crystallization at 132 and 134 oC
� Data will be fit using the Malkin and Avrami models
� Activation energy will be determined by running the samples at 5 heating
rates so that the temperature range is ~ 10 K apart.

Comparison of Isotherms at 132 C
0.5
1.0
1.5
Heat Flow (W/g)
PP Nano powder T=132PP Control T=132PP MB T=132PP Neat T=132
-0.5
0.0
0.5
Heat Flow (W/g)
0 5 10 15 20 25 30
Time (min)Exo Up Universal V4.7A TA Instruments

Example of Malkin Curve Fit
Nano Sil Master Batch - Malkin Curve FitRank 1 Eqn 8001 Malkin (a,b)
r2=0.99906114 DF Adj r2=0.99905249 FitStdErr=0.011592265 Fstat=231979.2
C0=31.910083
C1=0.4789522
0.7
0.8
0.9
1
0.7
0.8
0.9
1
0 5 10 15 20 25
Time (min)
0
0.1
0.2
0.3
0.4
0.5
0.6
X(t)
0
0.1
0.2
0.3
0.4
0.5
0.6
X(t)

Example of Avrami Fit
Nano Sil Master Batch - Avrami Curve FitRank 2 Eqn 8009 Avrami (a,b)
r2=0.99962964 DF Adj r2=0.99962622 FitStdErr=0.0072808716 Fstat=588390.94
k=0.0054127313
n=2.4387019
0.7
0.8
0.9
1
0.7
0.8
0.9
1
0 5 10 15 20 25
Time (min)
0
0.1
0.2
0.3
0.4
0.5
0.6
X(t)
0
0.1
0.2
0.3
0.4
0.5
0.6
X(t)

Results: Isothermal Comparison at 132 C
Sample Neat Control Master batch Powder
∆H (J/g) 43.51 99.71 99.55 54.85
t1/2 from DSC 0.66 10.23 6.28 0.064
1/T (K-1) 0.00246889 0.0024689 0.0024689 0.0024689
Malkin Fit
C0 7.359 35.867 31.910 23.732
C1 2.460 0.334 0.479 4.324
n 1.753 2.659 2.583 2.397n 1.753 2.659 2.583 2.397
k 0.819 0.001 0.004 1.376
t1/2 (min) 0.909 10.872 7.357 0.751
ττττ (s-1) 1.100 0.092 0.136 1.331
1/n ln(k) -0.114 -2.524 -2.138 0.133
Avrami Fit
n 1.736 2.511 2.439 2.259
k 0.837 0.002 0.005 1.346
t1/2 (min) 0.897 10.813 7.314 0.745
ττττ (s-1) 1.114 0.092 0.137 1.342
1/n ln(k) -0.103 -2.527 -2.140 0.132

Comparison of Isotherms at 134 C
0.4
0.6
0.8
Heat Flow (W/g)
PP Nano powder T=134PP Control T=134PP MB T=134PP Neat T=134
-0.2
0.0
0.2Heat Flow (W/g)
0 10 20 30 40 50 60 70
Time (min)Exo Up Universal V4.7A TA Instruments

Results: Isothermal Comparison at 134 C
Sample Neat Control Master batch Powder
∆H (J/g) 54.89 133.8 133.8 133.8
t1/2 from DSC 1.38 103.2 111.5 55.78
1/T (K-1) 0.0024572 0.0024572 0.0024572 0.0024572
Malkin Fit
C0 4.933 36.573 40.549 11.013
C1 0.942 0.157 0.244 2.149
n 1.580 2.671 2.739 1.954n 1.580 2.671 2.739 1.954
k 0.222 0.000 0.000 0.490
t1/2 (min) 2.055 23.309 15.366 1.194
ττττ (s-1) 0.487 0.043 0.065 0.837
1/n ln(k) -0.952 -3.286 -2.866 -0.365
Avrami Fit
n 1.593 2.537 2.578 1.896
k 0.225 0.000 0.001 0.506
t1/2 (min) 2.028 23.187 15.297 1.180
ττττ (s-1) 0.493 0.043 0.065 0.847
1/n ln(k) -0.937 -3.288 -2.870 -0.359
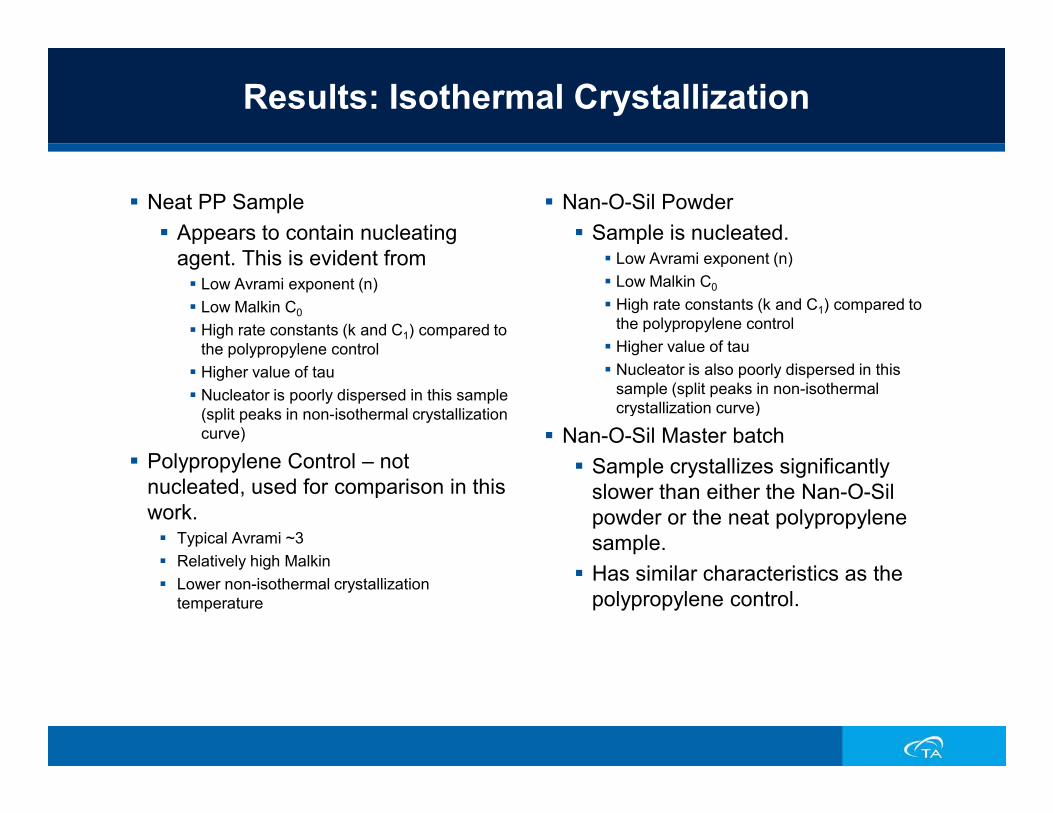
Results: Isothermal Crystallization
� Neat PP Sample
� Appears to contain nucleating
agent. This is evident from � Low Avrami exponent (n)
� Low Malkin C0
� High rate constants (k and C1) compared to
the polypropylene control
� Higher value of tau
� Nucleator is poorly dispersed in this sample
(split peaks in non-isothermal crystallization
� Nan-O-Sil Powder
� Sample is nucleated.� Low Avrami exponent (n)
� Low Malkin C0
� High rate constants (k and C1) compared to
the polypropylene control
� Higher value of tau
� Nucleator is also poorly dispersed in this
sample (split peaks in non-isothermal
crystallization curve)(split peaks in non-isothermal crystallization
curve)
� Polypropylene Control – not
nucleated, used for comparison in this
work.� Typical Avrami ~3
� Relatively high Malkin
� Lower non-isothermal crystallization
temperature
crystallization curve)
� Nan-O-Sil Master batch
� Sample crystallizes significantly
slower than either the Nan-O-Sil
powder or the neat polypropylene
sample.
� Has similar characteristics as the
polypropylene control.

Experimental: Comparison of Isothermal
Crystallization Runs at 134 oC
0.4
0.5
0.6
0.7
0.8
0.9
0.6
0.8
1
1.2
Heat Flow W/g
X(t)
Nano Powder
Control
Neat PP
Nano MB
Nano Powder
0
0.1
0.2
0.3
0.4
0
0.2
0.4
0 5 10 15 20 25 30 35 40 45 50
Heat Flow W/g
Time (min)
Nano Powder
Control
Neat PP
Nano MB

Experimental: Isothermal Crystallization Runs to Determine ΔE (Activation Energy)
�Isothermal crystallization experiments are
carried out at 4-5 different temperatures that
span about 10 K if possible. This ensures that the calculation of ΔE is from a reasonably linear
area of the functions described in Equation 7. area of the functions described in Equation 7.
�For calculations of ΔE, ψ = 1/n ln k.
�For the isoconversional method, ψ = dX(t) / dt

Experimental: Results Isothermal Crystallization
– Neat PP
0.25
0.3
0.35
0.4
Heat Flow (W/g)
Heat Flow as a Function of Time Under Isothermal Conditions
132.8 136.6
138.6 140.5
142.52
-0.05
0
0.05
0.1
0.15
0.2
0 10 20 30 40 50 60 70
Heat Flow (W/g)
Time (Minutes)

Experimental: Results Isothermal Crystallization
– Nan-O-Sil Master Batch
0.25
0.3
0.35
0.4
0.45
Heat Flow (W/g)
Heat Flow as a Function of Time Under Isothermal Conditions
127.8 130.8
133.7 135.6
137.59
-0.05
0
0.05
0.1
0.15
0.2
0.25
0 20 40 60 80 100 120
Heat Flow (W/g)
Time (Minutes)

Experimental: Results Isothermal Crystallization
– Nan-O-Sil Powder
1
1.2
1.4
1.6
1.8
Heat Flow (W/g)
Heat Flow as a Function of Time Under Isothermal Conditions
132.1 131.7
136.7 139.6
141.52
-0.2
0
0.2
0.4
0.6
0.8
1
0 5 10 15 20 25 30 35 40 45
Heat Flow (W/g)
Time (Minutes)

Experimental: Results Isothermal Crystallization
– Polypropylene Control
0.5
0.6
0.7
0.8
Heat Flow (W/g)
Heat Flow as a Function of Time Under Isothermal Conditions
121.9 124.9 126.8
129.7 131.7
-0.1
0
0.1
0.2
0.3
0.4
0 5 10 15 20 25 30
Heat Flow (W/g)
Time (Minutes)

Results: Kinetic Data for Neat PP Sample
T °°°°C 132.8 136.6 138.6 140.5 142.52
∆H (J/g) 50.42 62.03 75.7 66.46 52.99
t1/2 from DSC 1.5 2.43 4.57 12.4 19.11
1/T (K-1) 0.00246366 0.0024403 0.002429 0.0024173 0.002405755
Malkin Fit
C0 7.101 8.134 2.206 8.004 29.320
C1 1.029 0.690 0.190 0.127 0.151
n 1.736 1.800 1.317 1.793 2.529n 1.736 1.800 1.317 1.793 2.529
k 0.184 0.078 0.048 0.004 0.000
t1/2 (min) 2.146 3.355 7.566 18.093 22.852
ττττ (s-1) 0.466 0.298 0.132 0.055 0.044
1/n ln(k) -0.975 -1.414 -2.302 -3.100 -3.274
Avrami Fit
n 1.727 1.771 1.366 1.770 2.389
k 0.190 0.083 0.044 0.004 0.000
t1/2 (min) 2.118 3.313 7.499 17.859 22.710
ττττ (s-1) 0.472 0.302 0.133 0.056 0.044
1/n ln(k) -0.962 -1.405 -2.283 -3.090 -3.276
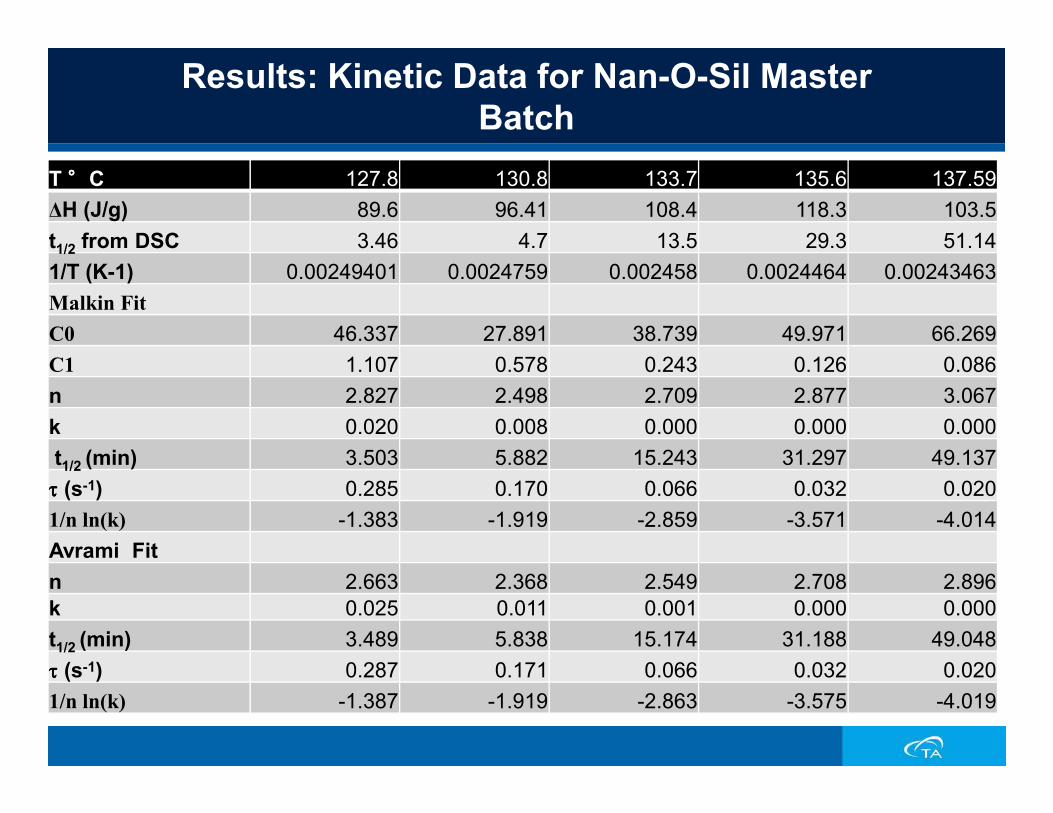
Results: Kinetic Data for Nan-O-Sil Master
Batch
T °°°°C 127.8 130.8 133.7 135.6 137.59
∆H (J/g) 89.6 96.41 108.4 118.3 103.5
t1/2 from DSC 3.46 4.7 13.5 29.3 51.14
1/T (K-1) 0.00249401 0.0024759 0.002458 0.0024464 0.00243463
Malkin Fit
C0 46.337 27.891 38.739 49.971 66.269
C1 1.107 0.578 0.243 0.126 0.086
n 2.827 2.498 2.709 2.877 3.067n 2.827 2.498 2.709 2.877 3.067
k 0.020 0.008 0.000 0.000 0.000
t1/2 (min) 3.503 5.882 15.243 31.297 49.137
ττττ (s-1) 0.285 0.170 0.066 0.032 0.020
1/n ln(k) -1.383 -1.919 -2.859 -3.571 -4.014
Avrami Fit
n 2.663 2.368 2.549 2.708 2.896
k 0.025 0.011 0.001 0.000 0.000
t1/2 (min) 3.489 5.838 15.174 31.188 49.048
ττττ (s-1) 0.287 0.171 0.066 0.032 0.020
1/n ln(k) -1.387 -1.919 -2.863 -3.575 -4.019

Results: Kinetic Data for Nan-O-Sil Powder
T °°°°C 132.1 131.7 136.7 139.6 141.52
∆H (J/g) 59.22 63.01 66.85 71.5 68.98
t1/2 from DSC 0.61 1.36 2.46 7.85 11.05
1/T (K-1) 0.00246792 0.0024701 0.0024402 0.002423 0.002411556
Malkin Fit
C0 30.749 13.185 9.265 10.743 23.989
C1 5.037 1.650 0.765 0.229 0.241
n 2.559 2.052 1.865 1.941 2.403n 2.559 2.052 1.865 1.941 2.403
k 1.774 0.249 0.081 0.006 0.001
t1/2 (min) 0.693 1.648 3.164 11.097 13.497
ττττ (s-1) 1.444 0.607 0.316 0.090 0.074
1/n ln(k) 0.224 -0.678 -1.348 -2.596 -2.755
Avrami Fit
n 2.406 1.968 1.819 1.881 2.258
k 1.702 0.265 0.087 0.008 0.002
t1/2 (min) 0.688 1.631 3.125 10.971 13.402
ττττ (s-1) 1.453 0.613 0.320 0.091 0.075
1/n ln(k) 0.221 -0.675 -1.341 -2.590 -2.758

Results: Kinetic Data for PP Control
T °°°°C 121.9 124.9 126.8 129.7 131.7
∆H (J/g) 66.09 74.15 82.7 83.5 83.49
t1/2 from DSC 1.69 2.89 5.56 8.01 11.16
1/T (K-1) 0.00253139 0.0025125 0.0025003 0.0024823 0.002470051
Malkin Fit
C0 38.756 39.867 42.438 42.260 46.352
C1 2.271 1.286 0.652 0.456 0.344
n 2.709 2.728 2.769 2.766 2.827n 2.709 2.728 2.769 2.766 2.827
k 0.184 0.038 0.005 0.002 0.001
t1/2 (min) 1.633 2.904 5.818 8.313 11.262
ττττ (s-1) 0.612 0.344 0.172 0.120 0.089
1/n ln(k) -0.626 -1.201 -1.893 -2.250 -2.551
Avrami Fit
n 2.567 2.579 2.613 2.601 2.669
k 0.194 0.045 0.007 0.003 0.001
t1/2 (min) 1.642 2.892 5.793 8.276 11.218
ττττ (s-1) 0.609 0.346 0.173 0.121 0.089
1/n ln(k) -0.638 -1.204 -1.897 -2.254 -2.555

Crystallization Activation Energy Summary
Neat PP PP_Nano_MB PP_Nano_Powder Polypropylene
ΔE kJ mol-1 ΔE kJ mol-1 ΔE kJ mol-1
Malkin -364.8 -385.2 -388.1 -265.8
Avrami Non Linear -366.3 -385.6 -382.0 -264.8
Isoconversional
X(t)
0.01 -406.75 -372.0 -386.1 -243.3
0.02 -414.01 -413.4 -387.0 -196.2
0.03 -403.30 -406.2 -374.6 -229.2
0.04 -400.31 -429.9 -368.4 -254.10.04 -400.31 -429.9 -368.4 -254.1
0.05 -395.51 -426.8 -367.9 -237.0
0.06 -392.86 -420.9 -372.3 -258.5
0.07 -390.69 -404.9 -364.4 -243.7
0.08 -392.74 -408.7 -363.7 -235.5
0.09 -392.75 -412.9 -371.2 -255.2
0.1 -381.95 -412.7 -361.8 -245.4
0.2 -368.07 -387.5 -363.9 -254.1
0.3 -356.67 -375.9 -369.7 -253.3
0.4 -360.00 -376.3 -376.5 -255.2
0.5 -349.54 -377.6 -386.2 -257.9
0.6 -341.78 -368.0 -392.3 -264.3
0.7 -323.04 -375.3 -403.8 -270.4
0.8 -310.77 -367.3 -403.8 -273.5
0.9 -392.14 -358.2 -454.7 -312.8

Comparison of Activation Energy –
Isoconversional Method
-250.0
-200.0
-150.0
-100.0
-50.0
0.0
E (kJ / mol)
Neat PP
PP_Nano_MB
-500.0
-450.0
-400.0
-350.0
-300.0
0.01 0.02 0.03 0.04 0.05 0.06 0.07 0.08 0.09 0.1 0.2 0.3 0.4 0.5 0.6 0.7 0.8 0.9
ΔE (kJ / mol)
X(t) Fraction Converted
PP_Nano_MB
PP_Nano_Powder
Polypropylene
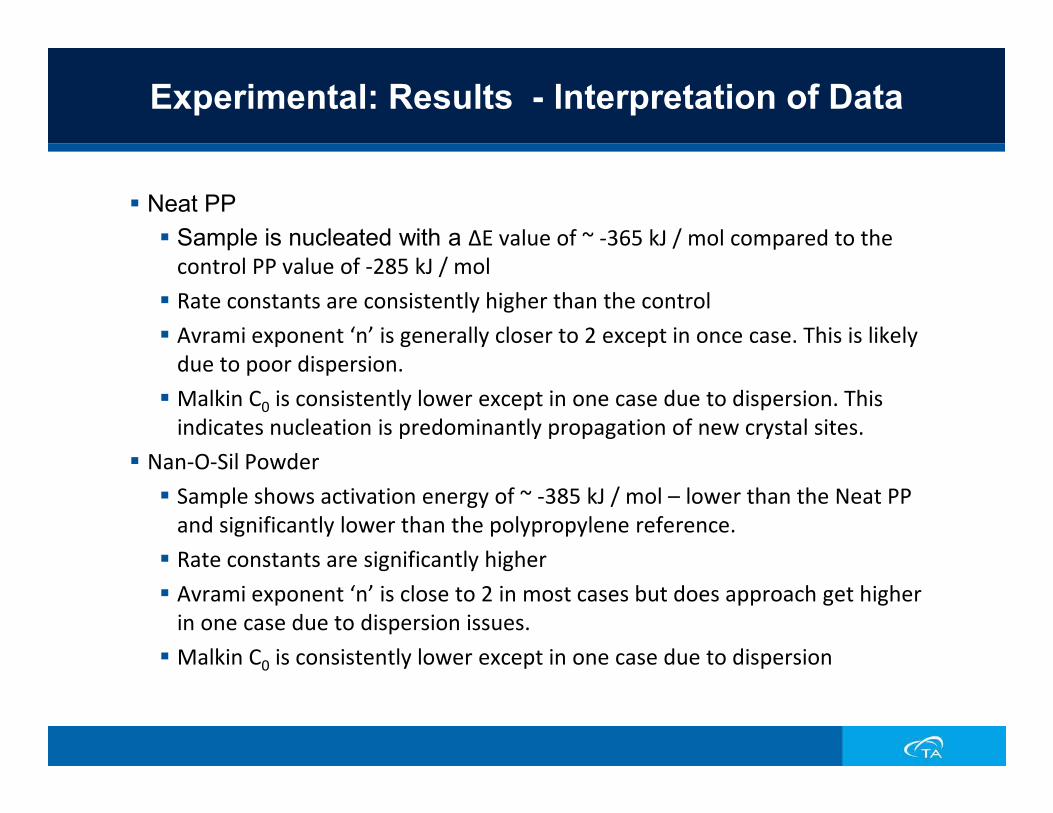
Experimental: Results - lnterpretation of Data
� Neat PP
� Sample is nucleated with a ΔE value of ~ -365 kJ / mol compared to the
control PP value of -285 kJ / mol
� Rate constants are consistently higher than the control
� Avrami exponent ‘n’ is generally closer to 2 except in once case. This is likely
due to poor dispersion.
� Malkin C0 is consistently lower except in one case due to dispersion. This � Malkin C0 is consistently lower except in one case due to dispersion. This
indicates nucleation is predominantly propagation of new crystal sites.
� Nan-O-Sil Powder
� Sample shows activation energy of ~ -385 kJ / mol – lower than the Neat PP
and significantly lower than the polypropylene reference.
� Rate constants are significantly higher
� Avrami exponent ‘n’ is close to 2 in most cases but does approach get higher
in one case due to dispersion issues.
� Malkin C0 is consistently lower except in one case due to dispersion

Experimental: Results - lnterpretation of Data
� Control Polypropylene
� Typical behavior of polypropylene with a Avrami exponent ‘n’ of ~ 3
and relatively high Malkin C0 constant.
� ΔE in typical range ~ -280 kJ / mol for non-nucleated PP
� Nan-O-Sil Master batch
� Sample shows activation energy of ~ -385 kJ / mol which represent a
significant lowering of activation energysignificant lowering of activation energy
� Despite the low ΔE, the rate constants are lower. This is due to a Avrami
exponent ‘n’ value of ~ 3. Nucleation efficiency in PP seems to be optimal at
‘n’ = 2.
� Malkin C0 is relatively high indicating the predominant nucleation
mechanism is propagation of existing crystal domains
� Master batch behaves like some mineral fillers (talc for example) giving a
lower activation energy and some improvement in cycle time, but with a
spherical geometry.
� Typically nucleators will have optimal concentrations levels.

Conclusions
� The Q 2000 DSC is the optimal tool for assessing nucleator performance
in polypropylene and other plastics. This is due to several factors
including:
� Tzero baseline performance – a flat baseline is critical in isothermal
studies, and the baseline performance is superior.
� Reliable autosampler
� Ease of calibration
� The Nan-O-Sil additive has a significant nucleation effect on
polypropylene as indicated by the lowering of activation energy, improved
rate constants, change in Avrami geometric exponent ‘n’ and lower value
of Malkin C0.
� All of this should result in improved cycle times in processing PP.

Thank You