Embed Size (px)
Citation preview

Nuclear Plant Safety Risks i
Failing the Grade
Nuclear Plant Risk Studies
DAVID LOCHBAUM
August 2000Union of Concerned Scientists

ii Union of Concerned Scientists
Printed on recycled paper
© 2000 Union of Concerned Scientists
All rights reserved
AcknowledgmentsThe author wishes to acknowledge Anita Spiess, UCS editor, forher invaluable suggestions on reorganizing this report.
David Lochbaum is nuclear safety engineer at the Union ofConcerned Scientists.
The Union of Concerned Scientists is a partnership of citizens andscientists working to preserve our health, protect our safety, andenhance our quality of life. Since 1969, we’ve used rigorous scien-tific analysis, innovative policy development, and tenacious citizenadvocacy to advance practical solutions for the environment.
In our work on nuclear power safety we expose unsafe nuclear plantconditions and practices and seek to enhance nuclear safety perfor-mance industrywide. We monitor and assess plant performance,ensure regulatory compliance, and champion safety concerns ofnuclear professionals in order to maintain nuclear safety.
More information about UCS and its work on nuclear power safetyis available at the UCS site on the World Wide Web, atwww.ucsusa.org/energy.
The full text of this report is available on the UCS website(www.ucsusa.org) or may be obtained from
UCS PublicationsTwo Brattle SquareCambridge, MA 02238-9105
Or email [email protected] or call 617-547-5552.

Nuclear Plant Safety Risks iii
Contents
Executive Summary ........................................................................................... v
Section 1: Introduction ...................................................................................... 1
Section 2: Risk Assessment Basics ...................................................................... 3
Section 3: Nuclear Plant Risk Assessment........................................................... 4
Section 4: Unrealistic Assumptions .................................................................... 7
Section 5: Missing Quality Standards ............................................................... 13
Section 6: Consequences of a Nuclear Accident ............................................... 18
Section 7: Conclusions .................................................................................... 21
Section 8: Recommendations........................................................................... 24

iv Union of Concerned Scientists
Figures and Tables
Figure 1. BWR Class B Small-Break Loss-of-Coolant Accident ............................. 4
Figure 2. “Bathtub” Curve of Failure Rate .......................................................... 9
Table 1. Number of Violations Reported to NRC................................................. 7
Table 2. Number of Safety Problems Caused by Design, Construction,Installation, and Fabrication Errors Reported to NRC ..................................... 8
Table 3. Operating Nuclear Plant Accident Consequences................................ 19

Nuclear Plant Safety Risks v
Nuclear Plant Risk StudiesFailing the Grade
An accident at a US nuclear power plant couldkill more people than were killed by the atomicbomb dropped on Nagasaki.1 The financial re-percussions could also be catastrophic. The 1986accident at the Chernobyl nuclear plant cost theformer Soviet Union more than three times theeconomical benefits accrued from the operationof every other Soviet nuclear power plant oper-ated between 1954 and 1990.2
But consequences alone do not define risk. Theprobability of an accident is equally important.When consequences are very high, as they arefrom nuclear plant accidents, prudent risk man-agement dictates that probabilities be kept verylow. The Nuclear Regulatory Commission(NRC) attempts to limit the risk to the publicfrom nuclear plant operation to less than 1 per-cent of the risk the public faces from otheraccidents.
The Union of Concerned Scientists (UCS)examined how nuclear plant risk assessments areperformed and how their results are used. Weconcluded that the risk assessments are seriouslyflawed and their results are being used inappro-priately to increase—not reduce—the threat tothe American public.
Nuclear plant risk assessments are really not riskassessments because potential accident conse-quences are not evaluated. They merely exam-ine accident probabilities—only half of the riskequation. Moreover, the accident probabilitycalculations are seriously flawed. They rely onassumptions that contradict actual operatingexperience:
• The risk assessments assume nuclear plantsalways conform with safety requirements,yet each year more than a thousand viola-tions are reported.
• Plants are assumed to have no design prob-lems even though hundreds are reportedevery year.
• Aging is assumed to result in no damage,despite evidence that aging materials killedfour workers.
• Reactor pressure vessels are assumed to befail-proof, even though embrittlement forcedthe Yankee Rowe nuclear plant to shut down.
• The risk assessments assume that plant work-ers are far less likely to make mistakes thanactual operating experience demonstrates.
Executive Summary
1. US House of Representatives, Committee on Interior and Insular Affairs Subcommittee on Oversight &Investigations, “Calculation of Reactor Accident Consequences (CRAC2) for US Nuclear Power Plants (HealthEffects and Costs) Conditional on an ‘SST1’ Release,” November 1, 1982; and Nuclear Regulatory Commission,“A Safety and Regulatory Assessment of Generic BWR and PWR Permanently Shutdown Nuclear Power Plants,”NUREG/CR-6451, Washington, D.C., August 1997.
2. Richard L. Hudson, “Cost of Chernobyl Nuclear Disaster Soars in New Study,” Wall Street Journal, March 29,1990.

vi Union of Concerned Scientists
• The risk assessments consider only the threatfrom damage to the reactor core despite thefact that irradiated fuel in the spent fuelpools represents a serious health hazard.
The results from these unrealistic calculationsare therefore overly optimistic.
Furthermore, the NRC requires plant ownersto perform the calculations, but fails to estab-lish minimum standards for the accident prob-ability calculations. Thus, the reported probabili-ties vary widely for virtually identical plantdesigns. Four case studies clearly illustrate theproblem:
• The Wolf Creek plant in Kansas and theCallaway plant in Missouri were built as iden-tical twins, sharing the same standardizedWestinghouse design. But some events atCallaway are reported to be 10 to 20 timesmore likely to lead to reactor core damagethan the same events at Wolf Creek.
• The Indian Point 2 and 3 plants share thesame Westinghouse design and sit side by sidein New York, but are operated by differentowners. On paper, Indian Point 3 is morethan 25 percent more likely to experience anaccident than her sister plant.
• The Sequoyah and Watts Bar nuclear plantsin Tennessee share the same Westinghousedesign. Both are operated by the same owner.The newer plant, Watts Bar, was originallycalculated to be about 13 times more likelyto have an accident than her sister plant. Aftersome recalculations, Watts Bar is now onlytwice as likely to have an accident.
• Nuclear plants designed by General Electricare equipped with a backup system to shutdown the reactor in case the normal systemof control rods fails. On paper, that backupsystem is highly reliable. Actual experience,however, shows that it has not been nearly asreliable as the risk assessments claim.
To make matters worse, the NRC is allowingplant owners to further increase risks by cuttingback on tests and inspections of safety equip-ment. The NRC approves these reductions basedon the results from incomplete and inaccurateaccident probability assessments.
UCS recommends that the NRC immediatelystop cutting safety margins and postpone anyfurther cuts until the faults in the probabilityassessments are corrected. The US Congressmust provide the NRC with the budget it needsto restore the safety margins at America’s nuclearpower plants.
Nuclear Plant Safety Risks 1
Nuclear Plant Risk StudiesFailing the Grade
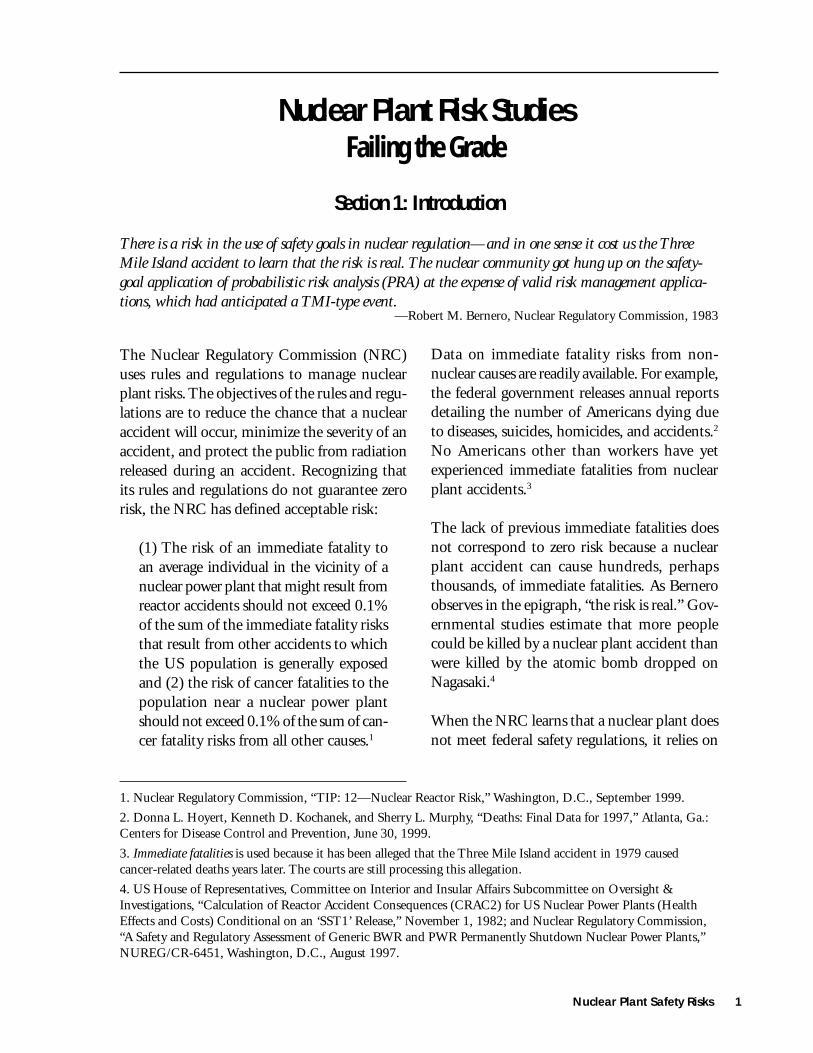
The Nuclear Regulatory Commission (NRC)uses rules and regulations to manage nuclearplant risks. The objectives of the rules and regu-lations are to reduce the chance that a nuclearaccident will occur, minimize the severity of anaccident, and protect the public from radiationreleased during an accident. Recognizing thatits rules and regulations do not guarantee zerorisk, the NRC has defined acceptable risk:
(1) The risk of an immediate fatality toan average individual in the vicinity of anuclear power plant that might result fromreactor accidents should not exceed 0.1%of the sum of the immediate fatality risksthat result from other accidents to whichthe US population is generally exposedand (2) the risk of cancer fatalities to thepopulation near a nuclear power plantshould not exceed 0.1% of the sum of can-cer fatality risks from all other causes.1
Section 1: Introduction
There is a risk in the use of safety goals in nuclear regulation—and in one sense it cost us the ThreeMile Island accident to learn that the risk is real. The nuclear community got hung up on the safety-goal application of probabilistic risk analysis (PRA) at the expense of valid risk management applica-tions, which had anticipated a TMI-type event.
Data on immediate fatality risks from non-nuclear causes are readily available. For example,the federal government releases annual reportsdetailing the number of Americans dying dueto diseases, suicides, homicides, and accidents.2
No Americans other than workers have yetexperienced immediate fatalities from nuclearplant accidents.3
The lack of previous immediate fatalities doesnot correspond to zero risk because a nuclearplant accident can cause hundreds, perhapsthousands, of immediate fatalities. As Berneroobserves in the epigraph, “the risk is real.” Gov-ernmental studies estimate that more peoplecould be killed by a nuclear plant accident thanwere killed by the atomic bomb dropped onNagasaki.4
When the NRC learns that a nuclear plant doesnot meet federal safety regulations, it relies on
1. Nuclear Regulatory Commission, “TIP: 12—Nuclear Reactor Risk,” Washington, D.C., September 1999.
2. Donna L. Hoyert, Kenneth D. Kochanek, and Sherry L. Murphy, “Deaths: Final Data for 1997,” Atlanta, Ga.:Centers for Disease Control and Prevention, June 30, 1999.
3. Immediate fatalities is used because it has been alleged that the Three Mile Island accident in 1979 causedcancer-related deaths years later. The courts are still processing this allegation.
4. US House of Representatives, Committee on Interior and Insular Affairs Subcommittee on Oversight &Investigations, “Calculation of Reactor Accident Consequences (CRAC2) for US Nuclear Power Plants (HealthEffects and Costs) Conditional on an ‘SST1’ Release,” November 1, 1982; and Nuclear Regulatory Commission,“A Safety and Regulatory Assessment of Generic BWR and PWR Permanently Shutdown Nuclear Power Plants,”NUREG/CR-6451, Washington, D.C., August 1997.
—Robert M. Bernero, Nuclear Regulatory Commission, 1983

2 Union of Concerned Scientists
the calculated accident probabilities to assessthe risk. The NRC’s risk assessment couldconclude that the plant must be immediatelyshut down for repairs. Most often, the NRCdecides that the risk is not great enough torequire immediate shutdown, so the plant owneris allowed to wait until the next scheduledopportunity to make the necessary repairs. Inaddition, the NRC—under constant pressurefrom the nuclear industry—has recently accepteda concept of “risk-informed regulation,” inwhich many safety regulations are eliminatedand the scope of other regulations is significantlyreduced based on the results of risk assessments.A critical question, then, is whether risk assess-ments are accurate enough to rely on for thesepurposes.
This report examines nuclear power plant riskassessments and how their results are being used.Section 2 provides background on risk anddescribes the relationship of the key factors—probability and consequences—used in risk
assessments. Section 3 discusses the safety studiesthe NRC required each plant owner to prepareand explains why these studies are probability,and not risk, assessments. Section 4 highlightsflawed assumptions used in the probabilityassessments that make their results inaccurate.Case studies, presented in section 5, illustratehow the defective assessment process can leadto grossly inaccurate results. Section 6 outlinesthe material that has been neglected in the so-called risk assessments; namely, the consequencesof nuclear plant accidents. This section also de-tails how, because consequences are neglected,the accident probabilities are not low enough tomeet the level of acceptable risk set by the NRC.Section 7 synthesizes this information andexplains when the NRC’s assessments can, andmore importantly cannot, be used to makedecisions about public health. The final sectionrecommends actions the NRC should take toimprove the quality of plant safety assessmentsand measures the US Congress should adopt topermit the NRC to efficiently do what is needed.

Nuclear Plant Safety Risks 3
Risk is defined as “the potential for realizationof unwanted, adverse consequences to humanlife, health, property, or the environment; esti-mation of risk is usually based on the expectedvalue of the conditional probability of the eventoccurring times the consequences of the eventgiven that it has occurred.”5 To put some fleshon the bones of this definition, consider an eventthat occurs, on average, once a decade andinjures 40 people when it happens. Consideranother event that happens every other year, butinjures only 8 people each time.
Let’s say that you could spend a million dollarsand totally eliminate the chance of one of theseevents occurring again. Faced with this decision,you want to spend the money where it will dothe most good. Would you eliminate the firstevent because it injures 40 people as opposed tojust 8 people? Or would you eliminate the sec-ond event because it happens more often?
In this case, you can’t lose. The elimination ofeither event prevents it from injuring an aver-age of 4 people each year:
• 1 event every 10 years injuring 40 people perevent averages 4 injuries per year
• 1 event every 2 years injuring 8 people perevent averages 4 injuries per year
Section 2: Risk Assessment Basics
The values to society of risks and benefits, as perceived by the people in that society, are not the sums ofthe values to the individuals affected. The catastrophe that kills 1000 people at a whack is perceived asfar more threatening—that is, it has far larger negative value—than 1000 single-fatality auto wrecks.
—Stephen H. Hanauer, Nuclear Regulatory Commission, 1975
These two events have exactly the same risk eventhough they have different probabilities anddifferent consequences. But what if the secondevent injured 10 people each time it happenedinstead of only 8?
• 1 event every 2 years injuring 10 people perevent averages 5 injuries per year
It might be tempting to spend the money onthe first event because it causes 40 injuries, butit would now be wiser to eliminate the secondevent because it ultimately injures more peopleand thus poses greater risk. This exercise showshow critical it is, when evaluating risk, toconsider both the probability of an event andthe consequences from that event.
But as the epigraph points out, society demandsextra protection when it comes to events withhigh consequences. The airline industry mustconstantly seek to minimize the probabilities ofcrashes even though air travel is—on paper—safer than automobile travel. And few techno-logical disasters have higher consequences thana nuclear power plant accident. The next sec-tion describes how the nuclear industry deter-mines the probabilities for these accidents.
5. Society for Risk Analysis, “Glossary of Risk Analysis Terms,” McLean, Va. Available online at www.sra.org/gloss3.htm.

4 Union of Concerned Scientists
Section 3: Nuclear Plant Risk Assessment
The only people I know who are enthusiastic about quantitative risk assessment are people who wantto gain permission to expose other humans to dangerous chemicals so someone can make money. Riskassessment has proven to be an effective way to gain the necessary permissions.
—Peter Montague, Environmental Research Foundation, 1991
In 1988, the Nuclear Regulatory Commissionrequired all nuclear plant owners to developIndividual Plant Examinations (IPEs). An IPEwas to be an evaluation of each plant for acci-dent vulnerabilities. All plant owners opted toperform probabilistic risk assessments (PRAs)to satisfy the NRC’s request.6 The NRC com-piled the risk assessment information for all theplants and summarized it in a 1996 report.7
Probabilistic risk assessment is an analytical tech-nique for evaluating potential accidents. The firstlevel of assessment, Level I, examines events thatcan cause reactor core damage, such as a pipebreak or power failure. Each event is thenassessed using a fault-tree, which examines thepossible responses to an event. The final prod-uct resembles a family tree chart, as the samplein figure 1 illustrates.
6. Tim Leahy and Alan Kolaczkowski, “PRA for Technical Managers P-107,” Washington, D.C.: Nuclear Regula-tory Commission, December 1–3, 1998.
7. Nuclear Regulatory Commission, “Individual Plant Examination Program: Perspectives on Reactor Safety andPlant Performance,” NUREG-1560, Vols. 1 and 2, Washington, D.C., November 1996.
Figure 1. BWR Class B Small-Break Loss-of-Coolant Accident
LOCARx
SHUTDOWN
HPCI SRVs/ADS
LPCS LPCI SDCLPCI(OC
MODE)
FIREWTR&
OTHER
ORNL-DWG 90-3909 ETD
SEQNO
ENDSTATE
71
72
73
74
75767796
OKOKCORE DAMAGEOKOKCORE DAMAGEOKOKCORE DAMAGEOKCORE DAMAGEOKCORE DAMAGECORE DAMAGECORE DAMAGEATWS

Nuclear Plant Safety Risks 5
The sample chart shows the fault-tree for a breakof a small pipe connected to the reactor pres-sure vessel of a nuclear plant with a boiling waterreactor. That event is termed a small-break loss-of-coolant accident (LOCA). The fault-treemoves from left to right asking a series of ques-tions. When the answer is yes, the pathwaymoves upward. Otherwise, the pathway movesdownward. For example, the first question iswhether the reactor (Rx) can be shut downfollowing the pipe break. If the answer is no,the fault-tree moves to the extreme right forATWS (Anticipated Transient Without Scram).The ATWS event, which involves the failure ofthe normal control rod system to shut down thenuclear chain reaction, has its own fault-treeanalysis. When the reactor can be shut down,the fault-tree progresses to the second ques-tion—can the high-pressure coolant injection(HPCI) system add enough water to compen-sate for the water being lost through the brokenpipe? The right column shows the condition ofthe reactor core for each of the fault-tree paths.Some pathways result in core damage, whileothers do not.
The P in PRA enters into the picture by assign-ing probabilities for the answers in a fault-tree.The probability that a specific pathway in a fault-tree will occur is determined by multiplying eachof the individual probabilities along the way.
A variety of events besides the pipe break illus-trated above can lead to core damage. Otherexamples include the break of a large pipe con-nected to the reactor pressure vessel, the inter-ruption of cooling water flow to the reactor core,the loss of normal electricity supply to plantequipment, and flooding of plant areas. ThePRA includes fault-trees for each event.
The final step in Level I is to calculate the coredamage frequency (CDF), i.e., the probability,per reactor year, of an accident leading to coredamage.8 This is done by adding up all the path-ways resulting in core damage from all of thefault trees. The CDF is frequently expressed inmathematical form like 5x10⁻⁵ or 5E-05. In plainEnglish, such a CDF value means 5 accidentsin 100,000 reactor years (or 1 accident in 20,000reactor years).
The second level of the probabilistic risk assess-ment, Level II, explores the ability of the plant’scontainment systems to cope with a core dam-age accident. This part of the assessment assumesthat the reactor core is damaged and examinesthe pathways that lead to radioactive materialbeing released to the environment. The fault-tree approach is the same as for Level I, exceptthat the initiating event on the left side of thefault-tree is reactor core damage and the ques-tions probe the plant’s ability to deal with it.
Level III examines the impact on public healthand the environment from a core damage acci-dent with containment failure. This assessmentassumes that reactor core damage has occurredand that radioactive material has been releasedto the environment. It then examines the path-ways that lead to human health consequences.Two major factors in a Level III assessment areweather conditions and how close people live tothe plant.
Plant owners submitted the Individual PlantExaminations (IPEs) to the NRC in the early1990s. These documents are readily availablefrom the NRC’s Public Document Room. Butthey have not been updated to reflect newinformation and physical changes to the plants.
8. NRC, “Individual Plant Examination Program,” Vol. 1, Part 1, p. G-3.

6 Union of Concerned Scientists
When plants are modified, the owners preparea second type of document, the Plant SafetyAssessment (PSA) to reflect the plant’s new con-figuration. Like the IPEs, the PSAs includeprobabilistic risk assessments. However, fewplant owners have submitted PSAs for theirplants to the NRC, so the public has access onlyto the outdated IPEs.
Furthermore, most plant owners have submittedonly Level I and II probabilistic risk assessments(PRAs). Level III assessments have been preparedand submitted for only a small handful of plants.Thus the IPEs for most plants do not containtrue risk assessments. Because risk dependson both the probability of an event and its
consequences, failure to include Level IIIevaluations provides an incomplete picture ofthe risk. At best, the Level I and II PRAs areonly probability assessments because their resultsindicate how often an event is likely to occurwithout providing any clue about the conse-quences of that event.
In addition to presenting incomplete riskprofiles, fundamental flaws in the Level I and IIPRAs provide an inaccurate picture of the prob-abilities of nuclear plant accidents. The nextsection describes some of the major flaws in thePRAs. Section 5 explains how the flawed PRAshappened and vividly demonstrates the grossinaccuracy of their results.

Nuclear Plant Safety Risks 7
Section 4: Unrealistic Assumptions
You can make probabilistic numbers prove anything, by which I mean that probabilistic numbers“prove” nothing.
All probability analyses make assumptions. Forexample, when you calculate that the probabil-ity of getting heads upon a single flip of a quar-ter is 50 percent, you are assuming that the coinwill not land on its edge. Nuclear plant proba-bilistic risk assessments (PRAs) rely on numer-ous assumptions, such as the following: 9
• The plants are operating within technicalspecifications and other regulatory require-ments.
• Plant design and construction are completelyadequate.
• Plant aging does not occur; that is, equip-ment fails at a constant rate.
• The reactor pressure vessels never fail.
• Plant workers make few serious mistakes.
• Risk is limited to reactor core damage.
History shows there is a greater probability of aflipped coin landing on its edge than of theseassumptions being realistic. Unrealistic assump-tions in the PRAs make their results equallyunrealistic. In computer programming parlance,“garbage in, garbage out.” The unrealistic assump-tions of nuclear plant PRAs are examined below.
Unrealistic Assumption #1—Plants AlwaysConform with All Regulatory RequirementsThe technical specifications and regulatoryrequirements are essentially the rules of the road
that plant owners are supposed to follow. Whenthey do not, they must report violations to theNRC. As table 1 illustrates, more than a thou-sand violations are reported every year.
While some comfort might be taken from see-ing that fewer reports were submitted at the endof the decade than at its beginning, that com-fort dissipates when one remembers that the riskassessments assume that there are zero violations.
Nine nuclear reactors were shut down through-out the entire year of 1997 while their ownersrepaired safety equipment. Those reactors wereMillstone Units 1, 2, and 3 in Connecticut;Salem Unit 1 in New Jersey; Crystal River 3 in
9. NRC, “Individual Plant Examination,” Vol. 2, Parts 2–5, p. 14-3.
—Stephen H. Hanauer, Nuclear Regulatory Commission, 1975
a. Nuclear Regulatory Commission, “Office for Analysisand Evaluation of Operational Data 1997 Annual ReportReactors,” NUREG-1272, Vol. 2, No. 1, Table 5.1,Washington, D.C., November 1998.
Table 1Number of Violations Reported to NRCa
1987 2,8951988 2,4791989 2,3561990 2,1281991 1,8581992 1,7741993 1,4001994 1,2791995 1,1781996 1,2741997 1,473

8 Union of Concerned Scientists
Florida; and Clinton, LaSalle Units 1 and 2, andZion Unit 2 in Illinois.10 The PRAs for each ofthese reactors, which had been submitted to theNRC before January 1, 1997, assumed that thereactors met all technical specifications and otherregulatory requirements. Their year-plus outagesdemonstrate the fallacy of those assumptions.
As a result of this unrealistic assumption, thecore damage frequencies (CDFs) calculated inthe PRAs are too low. As section 3 explains,CDFs are determined from fault-trees for eventsthat can lead to core damage. The fault-treesexamine the plant’s ability to respond to thoseevents. By assuming that emergency equipmentmeets safety requirements when in fact it doesnot, the PRAs calculate better response capa-bilities than are supported by reality. In otherwords, the core damage frequencies are reallyhigher than reported by the PRAs.
Unrealistic Assumption #2—Plant Design IsCompletely SatisfactoryThe assumption about plants’ design and con-struction being adequate also defies reality, astable 2 illustrates.
The risk assessments assume that there are zerodesign and construction problems when hun-dreds of problems are discovered every year.The NRC’s Office for Analysis and Evaluationof Operational Data documented 3,540 designerrors reported between 1985 and 1994.11 Thatmeans a design error was discovered at a nuclearpower plant in the United States almost everysingle day for an entire decade.
Last year, Public Citizen’s Critical Mass EnergyProject documented more than 500 design prob-lems found in US nuclear power plants betweenOctober 1996 and May 1999.12 Topping the listwas the Vermont Yankee nuclear plant with42 design problems found during the 31-monthperiod. Many of the design problems had existedsince the nuclear plants began operating decadesago.
Moreover, according to the NRC, “Almost everyplant-specific PRA has identified design oroperational deficiencies.”13 Thus, even thoughpreparation of the risk assessments revealeddesign problems, the assessments continued toassume that no design problems exist.
10. Nuclear Regulatory Commission, “Plant Status Report for January 2, 1998,” Washington, D.C. Availableonline at www.nrc.gov/NRR/DAILY/980102pr.htm.
11. Sadanandan V. Pullani, “Design Errors in Nuclear Power Plants,” AEOD/T97-01, Washington, D.C.: NRCOffice for Analysis and Evaluation of Operational Data, January 1997.
12. James P. Riccio, “Amnesty Irrational: How the Nuclear Regulatory Commission Fails to Hold Nuclear ReactorsAccountable for Violations of Its Own Safety Regulations,” Washington, D.C.: Public Citizen, August 1999.
13. Nuclear Regulatory Commission, “Probabilistic Risk Assessment (PRA) Reference Document,” NUREG-1050, p. 47, Washington, D.C., September 1984.
Table 2Number of Safety Problems Caused byDesign, Construction, Installation, andFabrication Errors Reported to NRCa
4th quarter 1995 861st quarter 1996 1072nd quarter 1996 1163rd quarter 1996 1014th quarter 1996 1431st quarter 1997 1772nd quarter 1997 1373rd quarter 1997 38
a. Nuclear Regulatory Commission, “Office for Analysisand Evaluation of Operational Data 1997 Annual ReportReactors,” NUREG-1272, Vol. II, No. 1, Table A-1.14,Washington, D.C., November 1998.

Nuclear Plant Safety Risks 9
The NRC knows that nuclear plants had designproblems that were not reflected in their riskassessments. In January 1999, UCS presentedits views on risk-informed regulation to theNRC. During that presentation, NRC Chair-man Shirley Ann Jackson interrupted UCS’sDavid Lochbaum to ask a question of AshokThadani, Director of the NRC’s Office of Re-search:
Mr. Lochbaum: There is no feedback [tochange the risk assessments to account]for design failures, just active componentfailures.
Chairman Jackson: There is no feedbackfor design failures, just for active compo-nents?
Mr. Thadani: For design failures that iscorrect. That is an area that is not dealtwith in the risk assessments. That’s a rec-ognized weakness.
Chairman Jackson: So how do you handlethat? What do you do about that?
Mr. Thadani: Design failure is like—pardon me for using this language—ablunder in my view. It’s not really a randomissue. At a plant there is or is not a designproblem. It is not the sort of thing youcan deal with in a probabilistic manner.14
So design blunders at nuclear plants are inten-tionally being ignored in the weakened PRAseven though design failure data are readily avail-able. A nuclear widget needed to prevent ormitigate an accident may fail to perform this
vital function if it is broken, if it is mistakenlydisabled by plant workers, or if is improperlydesigned. The PRAs account for the breaksand mistakes, but not for the abundant designblunders.
Unrealistic Assumption #3—Like Dorian Gray,Nuclear Plants Do Not AgeAnother incredible assumption is that nuclearplants and their equipment are getting older butnot showing any signs of aging. Again theassumption is made in the face of clear evidenceto the contrary. The NRC has issued more thanone hundred technical reports about the degra-dation of valves, pipes, motors, cables, concrete,switches, and tanks at nuclear plants caused byaging.15 These reports demonstrate that parts innuclear plants follow the “bathtub curve” agingprocess illustrated in figure 2 above. Region A isthe break-in phase, Region C is the wear-outphase, and Region B is the peak-health phase.The PRAs assume equipment failure rates fromthe flat portion (Region B) of the “bathtubcurve,” where the chance of failure is the low-est. And the NRC knows it. During a three-day training course in December 1998, NRCsupervisors and managers were informed: “MostPRAs assume constant failure rates—in the
14. Nuclear Regulatory Commission, “Briefing on Risk-Informed Initiatives,” transcript, Washington, D.C.,January 11, 1999.
15. Nuclear Regulatory Commission, “NRC Research Program on Plant Aging: Listing and Summaries of ReportsIssued Through September 1993,” NUREG-1377, Rev. 4, Washington, D.C., December 1993.
Figure 2. “Bathtub” Curve of Failure Rate
FailureRate, λ
Time, τ
CBA

10 Union of Concerned Scientists
16. Leahy and Kolaczkowski, “PRA for Technical Managers P-107.”
17. Brian Jordan, “NRC Finds Surry Accident Has ‘High Degree’ of Safety Significance,” Inside NRC, Washington,D.C.: McGraw-Hill, January 5, 1987.
18. Robert Pollard, “US Nuclear Power Plants—Showing Their Age—Case Study: Reactor Pressure VesselEmbrittlement,” Cambridge, Mass.: Union of Concerned Scientists, December 1995.
19. Joseph W. Shea, Project Manager, Nuclear Regulatory Commission, to David A. Lochbaum and Donald C.Prevatte, “Susquehanna Steam Electric Station, Units 1 and 2, Draft Safety Evaluation Regarding Spent Fuel PoolCooling Issues,” October 25, 1994. Available from the NRC Public Document Room, Washington, D.C.
‘flat’ portion of bathtub curve. This impliesaging of components is not modeled in mostPRAs.”16
A telling demonstration of the effects of ageoccurred in 1986. Four workers were killed ata nuclear power plant in Virginia because asection of pipe eroded away with time until itbroke and scalded them with steam.17 Yet mostPRAs assume no aging effects.
Unrealistic Assumption #4—Reactor PressureVessels Can Never FailThe assumption about the reactor pressurevessel never failing is based on necessity, notscience. The reactor pressure vessel is a large,metal “pot” containing the reactor core. Themajority of a plant’s emergency systems areintended to prevent water from leaking out ofthis pot or to quickly refill the pot if it leaks.The pot must remain filled with water to keepthe reactor core from overheating. If the metalpot were to break open, water would pour outfaster than all of the emergency pumps togethercould replenish. This would result in a reactorcore meltdown and the release of huge amountsof radiation. Because there is no backup to thereactor pressure vessel and because the plant’semergency systems cannot prevent meltdownif it breaks, the risk assessments convenientlyassume that it cannot fail—ever—under anycircumstances.
Experience has shown that this assumption hasas many cracks and flaws as the reactor pressure
vessels themselves. In 1995, UCS issued a reporton the fragile condition of reactor pressure vesselsat nuclear power plants.18 For example, theYankee Rowe plant in Massachusetts closed in1992 because its reactor pressure vessel hadbecome brittle over time. Brittle metal can shat-ter, much like hot glass, when placed in coldwater. Despite the closure of the Yankee Roweplant and documented embrittlement at manyother nuclear plants, the risk studies continueto assume a zero chance of reactor pressure vesselfailure.
Unrealistic Assumption #5—Plant Workers WillNot Make Serious MistakesPRAs make bold assumptions about humanperformance during the periods of high stressand information overload associated with acci-dents and near-misses. Sometimes, the assump-tions are totally unjustified. For example, theNRC commissioned a risk analysis of the spentfuel pool when engineers working on theSusquehanna nuclear plant raised concernsabout its safety. That PRA assumed that work-ers immediately begin taking actions to restorecooling when the spent fuel pool temperaturereaches 125 degrees Fahrenheit (ºF).19 When theengineers challenged that assumption, the NRCreported that plant’s operating license requiredthe spent fuel pool temperature to remain below125ºF and that workers were trained to conformto the rules of the operating license. Even afterthe engineers pointed out that the plant did noteven have temperature instruments for the work-ers to use, the NRC retained this blatantly false

Nuclear Plant Safety Risks 11
assumption.20 This had the effect of loweringthe calculated probability by a factor of at least10 and maybe 100.
A report issued in February 2000 by the IdahoNational Engineering and Environmental Labo-ratory (INEEL) demonstrates that unjustifiedassumptions about worker behavior continue tobe a problem. Researchers at INEEL examined20 recent operating events at nuclear powerplants and concluded:
Most of the significant contributinghuman performance factors found in thisanalysis of operating events are missingfrom the current generation of probabi-listic risk assessments (PRAs), includingthe individual plant examinations (IPEs).The current generation of PRAs does notaddress well the kinds of latent errors,multiple failures, or the type of errorsdetermined by analysis to be importantin these operating events.
In the PRAs, human performance accountsfor 5–8% of risk (i.e., contributes to lessthan 10% of core damage frequencyestimates). … In the 20 operating eventsanalyzed to date using qualitative andquantitative SPAR [standardized plantanalysis risk] methods, the average con-tribution of human performance to theevent importance was over 90%. … Innearly all cases, plant risk more thandoubled as a result of the operating
event—and in some cases increased byseveral orders of magnitude over thebaseline risk presented in the PRA. Thisincrease was due, in large part, to humanperformance.21
PRAs assume that workers will make fewermistakes when responding to accidents than isjustified by actual experience.
Unrealistic Assumption #6—Nuclear Plant RiskIs Limited Exclusively to Reactor Core DamageEven if nuclear plant PRAs properly accountedfor violations of regulatory requirements, designand construction errors, equipment aging, po-tential failure of the reactor pressure vessel, andactual human performance capabilities,they would still be flawed. The PRAs only de-termine the probabilities of events leading toreactor core damage. They do not calculate theprobabilities of other events that could lead toreleases of radiation, such as fuel going criticalin the spent fuel pool or rupture of a large tankfilled with radioactive gases. Some of theseoverlooked events can have serious conse-quences. For example, researchers at the Brook-haven National Laboratory estimated that aspent fuel pool accident could release enoughradioactive material to kill tens of thousands ofAmericans.22
Thus, even the best nuclear plant PRA is in-complete because it neglects events that canrelease significant amounts of radiation. Theeffect of this incompleteness is to introduce
20. David A. Lochbaum and Donald C. Prevatte to Chairman Ivan Selin, Nuclear Regulatory Commission,“Susquehanna Steam Electric Station Units 1 and 2 / Comment on Draft Safety Evaluation Regarding Spent FuelPool Cooling Issues,” November 29, 1994. Available from the NRC Public Document Room, Washington, D.C.
21. Jack E. Rosenthal to John T. Larkins, “Meeting with the Advisory Committee on Reactor Safeguards HumanFactors Subcommittee, March 15, 2000, on SECY-00-0053, NRC Program on Human Performance in NuclearPower Plant Safety,” Washington, D.C.: Nuclear Regulatory Commission, March 6, 2000.
22. Nuclear Regulatory Commission, “A Safety and Regulatory Assessment of Generic BWR and PWR Perma-nently Shutdown Nuclear Power Plants,” NUREG/CR-6451, Washington, D.C., August 1997.

12 Union of Concerned Scientists
additional uncertainty into the results of thePRAs:
Completeness is not in itself an uncer-tainty, but a reflection of scope limitations.The result is, however, an uncertaintyabout where the true risk lies. The prob-lem with completeness uncertainty is that,because it reflects an unanalyzed contri-bution, it is difficult (if not impossible)to estimate its magnitude.23
23. Nuclear Regulatory Commission, “An Approach for Using Probabilistic Risk Assessment in Risk-InformedDecisions on Plant-Specific Changes to the Licensing Basis,” Regulatory Guide 1.174, p. 1.174-13, Washington,D.C., July 1998.
SummaryEach of the unrealistic assumptions covered inthis section causes the probabilistic risk assess-ments to underestimate the chances of a nuclearplant accident. In some cases, the accident prob-abilities are falsely lowered by a factor of 100.But the full extent of the underestimation isunknown.
The next section uses case studies to illustratehow unrealistic assumptions, along with lack ofquality standards for the risk assessments, causegrossly inaccurate results.

Nuclear Plant Safety Risks 13
Section 5: Missing Quality Standards
The results of the Oak Ridge-SAI work and the INPO [Institute for Nuclear Power Operations]review of the Oak Ridge effort show clearly the reason why PRAs are not good measures of safetyadequacy. So much subjective judgement is involved in the probability evaluation that the resultscannot be trusted for absolute risk measurement.
Probabilistic risk assessments (PRAs) determinethe probability of nuclear plant accidents result-ing in reactor core damage as described in sec-tion 3. The nuclear industry uses this calculatedcore damage frequency (CDF) to rank safetythreats—the larger the CDF, the greater thethreat.
The whole purpose of the PRA is to calculatethe CDF. The CDF is used extensively as a plantsafety gauge. In reviewing the PRAs submittedby plant owners in their Individual PlantExaminations (IPEs), the NRC learned that
One factor that can influence both thesuccess criteria and the accident progres-sion is the definition of core damage,which varied substantially in the IPEsfrom definitions involving vessel level todefinitions involving fuel cladding tem-perature or oxidation.24
In other words, one plant owner could definecore damage one way while another plant ownercould define core damage in a completely dif-ferent manner. How could something so vitallyimportant to a PRA as the definition of coredamage be left to such subjective interpretation?In the NRC’s own words: “The NRC has notdeveloped its own formal standard nor endorsedan industry standard for a PRA.”25
The lack of a PRA standard gives plant ownersfree rein. That freedom manifests itself in PRAresults for virtually identical nuclear plants beingcompletely different. It also allows PRA resultsto be significantly more optimistic than reality.UCS prepared the following case studies todemonstrate these points:
• Wolf Creek and Callaway• Indian Point Units 2 and 3• Sequoyah and Watts Bar• Standby Liquid Control Systems
These case studies are presented below.
Case Study #1—Wolf Creek and CallawayDecades ago, the Westinghouse Electric Corpo-ration designed what it called the StandardizedNuclear Unit Power Plant System (SNUPPS).Westinghouse sought to reduce costs, and thusmake its reactors more saleable, by developing aplant design that could be replicated again andagain. The Wolf Creek plant in Kansas and theCallaway plant in Missouri are the only twoSNUPPS orders that were completed.26 Theplants were built using the exact same blueprintsand materials. Callaway was licensed to operateby the NRC in October 1984, while Wolf Creekwas licensed in June 1985.27
24. NRC, “Individual Plant Examination Program,” Vol. 2, Parts 2–5, p. 15-3.
25. NRC, “An Approach for Using Probabilistic Risk Assessment,” p. 1.174-10.
26. One of the two reactors ordered at Callaway was canceled during its construction.
27. Nuclear Regulatory Commission, “Information Digest,” NUREG-1350, Vol. 10, Washington, D.C., Novem-ber 1998. Available online at www.nrc.gov/NRC/NUREGS/SR1350/V10/index.html.
—Myer Bender, Nuclear Regulatory Commission, 1983

14 Union of Concerned Scientists
Both plant owners provided the NRC with riskassessments of postulated internal events, suchas pipe breaks and valve failures, that could leadto reactor core damage. The risk assessments forcore damage caused by external events, such astornadoes and floods, are expected to vary be-cause the plants are located in different states.But the internal event risk should be similarbecause Callaway and Wolf Creek were inten-tionally built to be identical twins.
In this case, however, the identical twins seemas different as Dr. Jekyll and Mr. Hyde. The mostprobable event leading to reactor core damageat Callaway is identified as a pipe break thatcauses Room 3101 to be flooded. Room 3101contains electrical equipment that doesn’t workwell when submerged. Wolf Creek also has aRoom 3101 housing plenty of electrical equip-ment. But when Wolf Creek’s Room 3101 isflooded, it is reportedly 10 times less likely toresult in reactor core damage.28
The fifth most likely event leading to reactorcore damage at Callaway is a small-break loss-of-coolant accident, in which a small diameterpipe connected to the reactor pressure vesselbreaks, leading to inadequate core cooling. WolfCreek also has small diameter piping that canbreak and lead to reactor core damage. But thesmall-break loss-of-coolant accident at WolfCreek is supposedly 20 times less likely to resultin core damage and is estimated to be the eigh-teenth most likely event.29
The numbers make it look like Wolf Creek isthe good twin and Callaway the bad twin. Inreality, these risk assessments cannot be used todecide this sibling rivalry. They were developedusing different methods and different assump-tions. It is therefore no surprise that their resultsdiffer so radically. The data do not allow thesafety levels of these identical plants to be evalu-ated, even on a relative basis.
This case study demonstrates a deeper problem:plant-specific risk assessments provide no mean-ingful insight into relative risks within a plant.Callaway and Wolf Creek have identical designs.Yet the Achilles’ heel on Callaway seems no morethan the funny bone on Wolf Creek. The inputassumptions for the risk assessment at eitherplant could be tweaked and cause the numbersto flip-flop. The actual risks at the plants wouldbe unchanged, but the perceived risks wouldchange significantly.
Case Study #2—Indian PointIndian Point Unit 2 (IP2) and Indian Point Unit3 (IP3) are pressurized water reactors designedby the Westinghouse Electric Corporation.These plants are located side by side along theHudson River in Buchanan, New York, about35 miles north of New York City. The NRCissued operating licenses on September 28, 1973,for IP2 and on April 5, 1976, for IP3.30 Theindividual plant examinations (IPEs) were com-pleted in August 1992 for IP231 and in June 1994for IP3.32
28. Wolf Creek Nuclear Operating Corporation, “Wolf Creek Generating Station Individual Plant ExaminationSummary Report,” September 1992; and Union Electric Company, “Individual Plant Examination,” October 9,1992. Both documents are available from the NRC Public Document Room, Washington, D.C.
29. Wolf Creek Nuclear Operating Corporation, “Wolf Creek Generating Station”; and Union Electric Company,“Individual Plant Examination.”
30. NRC, “Information Digest.”
31. Consolidated Edison Company of New York, Inc., “Individual Plant Examination for Indian Point Unit No. 2Nuclear Generating Station,” August 1992. Available from the NRC Public Document Room, Washington, D.C.
32. New York Power Authority, “Indian Point 3 Nuclear Power Plant Individual Plant Examination,” June 1994.Available from the NRC Public Document Room, Washington, D.C.

Nuclear Plant Safety Risks 15
These two nuclear plants were designed by thesame company and built in the same geographiclocation in the same era. One would expect thesenuclear “sisters” would have comparable risks.That expectation appears incorrect, if onebelieves the risk numbers, which were bothpublished at about the same time.
The overall chance of events leading to reactorcore damage was calculated to be 27.3 percenthigher for IP3 than for IP2. The disparity waseven wider for individual events. One suchevent—the interfacing system loss-of-coolantaccident—was calculated to be 89 percent morelikely to occur at IP3 than at IP2.33
According to IP3’s owner:
A detailed comparison of the IPEs per-formed on IP2 and IP3 is made difficultby the difference in the methodologiesused. The IPE prepared for IP3 employedthe small event-tree/large fault-treemethodology used in the NUREG-1150studies, considerable effort being devotedto the delineation of accident sequences.In contrast, the IPE prepared for IP2used a large event-tree/small fault-treemethodology.34
IP3’s owner concluded—paradoxically—thatdespite the different methodologies employed,“the core damage frequencies predicted for IP3
and IP2 are basically similar though significantdifferences do exist.”35
Case Study #3—Sequoyah and Watts BarThe two case studies above compare risk assess-ment results for nuclear plants that are verysimilar to each other. In each case, the nuclearplants were operated by different owners. Thedisparities in the results might be attributed todifferent approaches taken by the owners. How-ever, analysis of two other plants suggests anotherexplanation.
This case study looks at the risk assessments forthe Sequoyah and Watts Bar nuclear powerplants. Sequoyah and Watts Bar are sister plants.Each is a four-loop pressurized water reactordesigned by Westinghouse with an ice-condensercontainment. The two reactors at Sequoyah werelicensed to operate by the NRC in 1980 and1981.36 The NRC issued TVA an operatinglicense for Watts Bar in 1996.37
The Tennessee Valley Authority (TVA) operatesboth of these plants and prepared their riskassessments. Sequoyah has a core damage fre-quency of 1 in 26,525 years.38 The original coredamage frequency that TVA calculated for WattsBar was 1 in 3,030 per year.39 These numberssuggest that the newer plant, which TVA builtusing the lessons learned from Sequoyah, wasnearly 10 times more likely to have a nuclearaccident. One would hope that the passage of
33. NY Power Authority, “Indian Point 3,” Table 1.5.1.1, p. 1-10.
34. NY Power Authority, “Indian Point 3,” p. 1-23.
35. NY Power Authority, “Indian Point 3,” p. 1-23.
36. NRC, “Information Digest.”
37. NRC, “Information Digest.”
38. Tennessee Valley Authority, “Sequoyah Nuclear Plant Units 1,2 Probabilistic Safety Assessment IndividualPlant Examination,” Vol. 1, February 20, 1998. Available from the NRC Public Document Room, Washington,D.C.
39. Tennessee Valley Authority, “Watts Bar Nuclear Plant Unit 1 Probabilistic Risk Assessment Individual PlantExamination Update, ” Vol. 5, May 2, 1994. Available from the NRC Public Document Room, Washington, D.C.

16 Union of Concerned Scientists
15 years would have enabled TVA to make safetyimprovements or at least maintain the samesafety levels as had been found at Sequoyah.
TVA later recalculated the core damage frequencyfor Watts Bar. By tweaking here and adjustingthere, TVA reduced the core damage frequencyfor Watts Bar to 1 in 12,500 years.40 Watts Bar isnow only twice as unsafe as Sequoyah.
The saga of Sequoyah and Watts Bar clearlyexposes the problem with probabilistic riskassessments (PRAs) performed by the nuclearindustry. TVA, unsatisfied with Watts Bar’s riskbeing 300 percent higher than the NRC’s safetygoal, waved its magic wand (in this case, it closelyresembled a pencil eraser) until Watts Bar’s riskdropped lower than the safety goal.
Case Study #4: Standby Liquid Control SystemsOur final case study explains just how the PRAwizards are able to dial in any risk number theywant. The fault-trees have many branches. Thebranches represent the performance of emer-gency equipment and plant workers in responseto the potential events.
The standby liquid control (SLC) system is abackup system in boiling water reactors designedby the General Electric (GE) Company, whichis designed to stop the nuclear reaction if thecontrol rods fail to do so. The SLC system iskept in standby mode when the nuclear plant isrunning. It consists of a large storage tank, two
pumps, piping, and valves. Only one pump isrequired for the SLC system to fulfill its intendedfunction—the second pump serves as a fullyredundant backup. The system can be manu-ally initiated by the operator to shut down thereactor when the normal reactivity-controlsystem, the control rod drive system, fails. TheSLC system injects a solution into the reactorvessel to absorb neutrons and end the fissionchain reaction. The NRC ranked the SLC systemas the eighth most important out of 30 safetysystems it evaluated.41
Pennsylvania Power & Light, a nuclear plantowner with two boiling water reactors, calcu-lated the chances that the SLC system would beunable to perform its vital safety function to be1 in 16,666.42 That means the system is expectedto function properly 16,665 times out of 16,666tries. Such high reliability for an important safetysystem would be comforting, if it were true. Itis neither true nor comforting.
There are 35 boiling water reactors operating inthe United States. If the SLC systems at thesenuclear plants were tested every day and thereported system reliability were accurate, therewould be one SLC system failure every 1.3 years.But the SLC systems are not tested every day.According to the NRC, the SLC system is routinelytested on a quarterly basis and nonroutinelytested following system maintenance.43 The aver-age frequency of SLC system testing at USnuclear plants falls between once per month and
40. TVA, “Watts Bar.”
41. Nuclear Regulatory Commission, “Aging Assessment of BWR Standby Liquid Control Systems,” NUREG/CR-6001, Washington, D.C., August 1992.
42. Harold W. Keiser, Senior Vice President—Nuclear, Pennsylvania Power & Light Company, to C. L. Miller,Project Manager, Nuclear Regulatory Commission, “Susquehanna Steam Electric Station—Submittal of the IPEReport,” December 13, 1991. Available from the NRC Public Document Room, Washington, D.C.
43. Nuclear Regulatory Commission, “Standard Technical Specifications for General Electric Boiling WaterReactor 4, Section 3.1.7 and Bases Section 3.1.7, Standby Liquid Control System,” NUREG-1433 Rev. 1,Washington, D.C., April 1995.

Nuclear Plant Safety Risks 17
once per quarter. Thus, for the entire fleet ofUS boiling water reactors, there will be one SLCsystem failure reported every 39.7 to 119.0 years,if the SLC system reliability is as high as reported.
A cursory check of the NRC’s Public DocumentRoom revealed these reports:
• In August 1998, the owner of the Big RockPoint nuclear plant informed the NRC thatits SLC system had been totally incapacitatedfor the past 13 to 18 years.44
• In January 1998, the owner of SusquehannaUnit 1 (i.e., the same entity that reported theextremely reliable SLC system) informed theNRC that both pumps of the SLC systemwere inoperable.45
• In December 1996, the owner of theFitzPatrick boiling water reactor informedthe NRC that both pumps of the SLC system were inoperable.46
Thus, the SLC system is not as reliable as claimedin the plant risk assessments. Consequently, theactual risks from nuclear power plant operationare higher than reported in the risk assessments.Many branches of the fault-trees are similarlyafflicted, rendering the results of the risk assess-ments virtually useless.
SummaryThese case studies showed how the lack ofquality standards for the risk assessments—particularly regarding the unrealistic assump-tions described in section 4—enables thenuclear industry to subjectively “calculate”lower core damage frequencies. Decisions onpublic health must not be based on falselyoptimistic accident probabilities. The conse-quences from a nuclear plant accident, asdescribed in the next section, are potentiallycatastrophic.
44. Kenneth P. Powers, Site General Manager, Consumers Energy, to Nuclear Regulatory Commission, “Docket50-155—License DPR-6—Big Rock Point Plant—Licensee Event Report 98-0001: Liquid Poison Tank DischargePipe Found Severed During Facility Decommissioning,” August 6, 1998. Available from the NRC Public Docu-ment Room, Washington, D.C.
45. Pennsylvania Power & Light Company to Nuclear Regulatory Commission, “Licensee Event Report No. 50-387/97-025-00, Loss of Both Trains of Standby Liquid Control,” January 2, 1998. Available from the NRC PublicDocument Room, Washington, D.C.
46. Michael J. Colomb, Plant Manager, New York Power Authority, to Nuclear Regulatory Commission, “LicenseeEvent Report: LER-96-011—Both Standby Liquid Control Subsystems Inoperable Due to Inoperable PumpDischarge Pressure Relief Valves,” December 2, 1996. Available from the NRC Public Document Room, Washing-ton, D.C.
18 Union of Concerned Scientists
Section 6: Consequences of a Nuclear Accident
Nuclear power is a business that can lose $2 billion in half an hour.
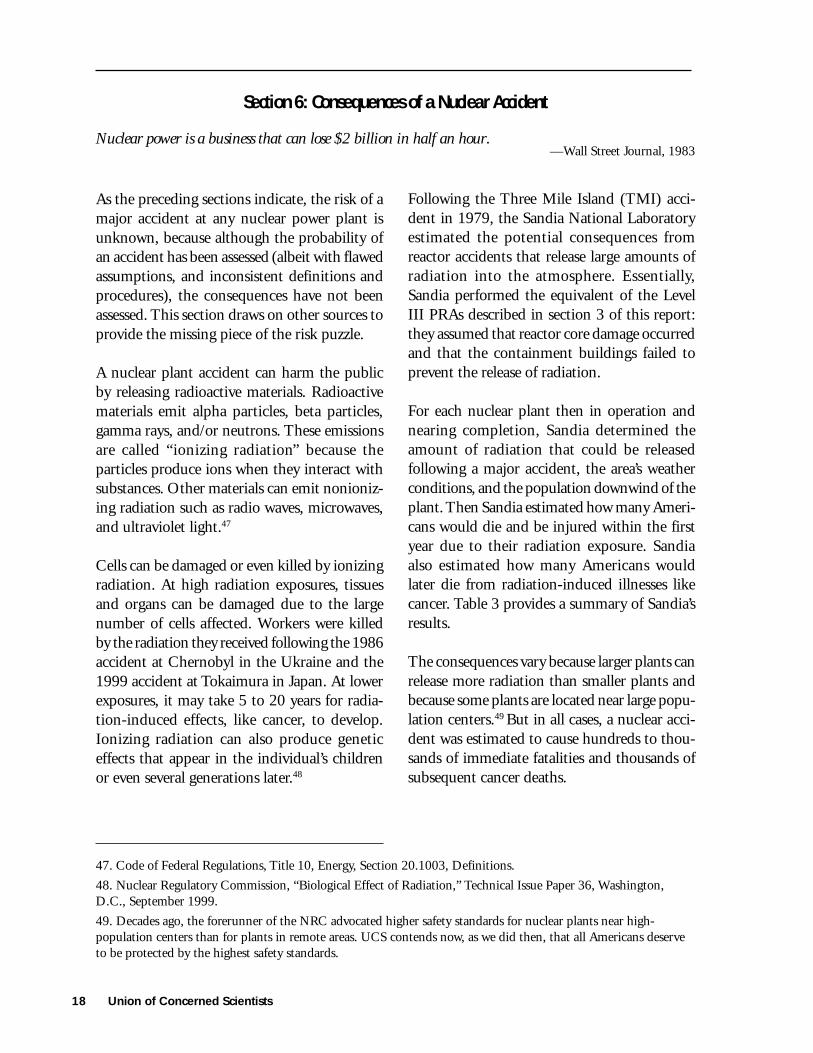
As the preceding sections indicate, the risk of amajor accident at any nuclear power plant isunknown, because although the probability ofan accident has been assessed (albeit with flawedassumptions, and inconsistent definitions andprocedures), the consequences have not beenassessed. This section draws on other sources toprovide the missing piece of the risk puzzle.
A nuclear plant accident can harm the publicby releasing radioactive materials. Radioactivematerials emit alpha particles, beta particles,gamma rays, and/or neutrons. These emissionsare called “ionizing radiation” because theparticles produce ions when they interact withsubstances. Other materials can emit nonioniz-ing radiation such as radio waves, microwaves,and ultraviolet light.47
Cells can be damaged or even killed by ionizingradiation. At high radiation exposures, tissuesand organs can be damaged due to the largenumber of cells affected. Workers were killedby the radiation they received following the 1986accident at Chernobyl in the Ukraine and the1999 accident at Tokaimura in Japan. At lowerexposures, it may take 5 to 20 years for radia-tion-induced effects, like cancer, to develop.Ionizing radiation can also produce geneticeffects that appear in the individual’s childrenor even several generations later.48
Following the Three Mile Island (TMI) acci-dent in 1979, the Sandia National Laboratoryestimated the potential consequences fromreactor accidents that release large amounts ofradiation into the atmosphere. Essentially,Sandia performed the equivalent of the LevelIII PRAs described in section 3 of this report:they assumed that reactor core damage occurredand that the containment buildings failed toprevent the release of radiation.
For each nuclear plant then in operation andnearing completion, Sandia determined theamount of radiation that could be releasedfollowing a major accident, the area’s weatherconditions, and the population downwind of theplant. Then Sandia estimated how many Ameri-cans would die and be injured within the firstyear due to their radiation exposure. Sandiaalso estimated how many Americans wouldlater die from radiation-induced illnesses likecancer. Table 3 provides a summary of Sandia’sresults.
The consequences vary because larger plants canrelease more radiation than smaller plants andbecause some plants are located near large popu-lation centers.49 But in all cases, a nuclear acci-dent was estimated to cause hundreds to thou-sands of immediate fatalities and thousands ofsubsequent cancer deaths.
47. Code of Federal Regulations, Title 10, Energy, Section 20.1003, Definitions.
48. Nuclear Regulatory Commission, “Biological Effect of Radiation,” Technical Issue Paper 36, Washington,D.C., September 1999.
49. Decades ago, the forerunner of the NRC advocated higher safety standards for nuclear plants near high-population centers than for plants in remote areas. UCS contends now, as we did then, that all Americans deserveto be protected by the highest safety standards.
—Wall Street Journal, 1983

Nuclear Plant Safety Risks 19
Table 3Operating Nuclear Plant Accident Consequencesa
*For comparison, the atomic bomb dropped on Hiroshima killed 140,000 people,and the one dropped on Nagasaki killed 70,000 people.b
a. US House of Representatives, Committee on Interior and Insular Affairs Subcommittee onOversight & Investigations, “Calculation of Reactor Accident Consequences (CRAC2) for USNuclear Power Plants (Health Effects and Costs) Conditional on an ‘SST1’ Release,” November 1,1982.
b. Richard Rhodes, The Making of the Atomic Bomb, New York: Simon & Schuster, pp. 734 and 740,1986.
Plant / Location Early Fatalities Injuries Cancer Deaths
Beaver Valley / Shippingport, Penn. 19,000 156,000 24,000Browns Ferry / Decatur, Ala. 18,000 42,000 3,800Byron / Rockford, Ill. 9,050 79,300 15,300Callaway / Callaway, Mo. 11,500 32,000 9,600Calvert Cliffs / Lusby, Md. 5,600 15,000 23,000D C Cook / Bridgman, Mich. 1,950 84,000 13,000Fermi / Laguna Beach, Mich. 8,000 340,000 13,000Harris / Apex, N.C. 11,000 31,000 6,000Hatch / Baxley, Ga. 700 4,000 3,000Indian Point 3 / Buchanan, N.Y. 50,000 167,000 14,000Limerick / Montgomery, Penn. 74,000 610,000 34,000Millstone 3 / Waterford, Conn. 23,000 30,000 38,000Nine Mile Point 2 / Oswego, N.Y. 1,400 26,000 20,000Perry / Painesville, Ohio 5,500 180,000 14,000Pilgrim / Plymouth, Mass. 3,000 30,000 23,000Salem / Salem, N.J. 100,000 70,000 40,000Susquehanna / Berwick, Penn. 67,000 47,000 28,000Vermont Yankee / Vernon, Vt. 7,000 3,000 17,000
*
*
**
*
*
*
50. NRC, “TIP: 12.”
51. Center for Disease Control and Prevention, “Fastats: Accidents/Unintentional Injuries,” Atlanta, Ga., August31, 1999. Available online at www.cdc.gov/nchs/fastats/acc-inj.htm.
How do these estimates relate to the NRC’spolicy of limiting the risk from a nuclear plantaccident to less than 0.1 percent of the risk fromother accidents?50 During 1997, accidentsclaimed the lives of 95,644 Americans.51 An
accident at the Salem nuclear plant in New Jerseycould—by itself—kill more than that manyAmericans. Yet the NRC’s policy is to limit thenumber of deaths from nuclear plant accidentsto less than 95 each year on average.
20 Union of Concerned Scientists
As discussed in section 2, risk depends on boththe probability and the consequences of an event.The NRC’s risk goal can only be met if theprobability of an accident is very, very low. Howlow? An accident causing 100,000 deaths musthave a probability of less than 1 in 1,045 yearsto meet the NRC’s risk goal of no more than95 deaths from nuclear plant accidents.
In other words, nuclear power plants are accept-ably safe under the NRC’s goal so long as theykill no more than about 100 people per year, or1,000 people every decade. A 50 percent chanceof a nuclear accident killing 10,000 people everycentury would be acceptable. And the NRC’sgoal would accept a nuclear accident killing100,000 people, provided that, on average,there would be no more than one accident permillennium.
This nuclear safety goal, of course, has never beenexplicitly approved by the American people or theirrepresentatives, the US Congress. As observed insection 2, society regards potential accidents withhigh consequences more seriously than the sameconsequences spread out over a long period oftime. And few, if any, other technological disas-ters, whether dam breaks, airline crashes, bridgecollapses, or train derailments, can result in suchhigh consequences as a nuclear plant accident.
As the previous sections have shown, the PRAscannot be relied upon to estimate the true prob-ability of a nuclear accident. There are simplytoo many factors they do not consider and toomany discrepancies that are not explained. Asdiscussed in the next section, proper risk man-agement strategies are neglected when accidentprobabilities are not well understood.
Nuclear Plant Safety Risks 21
Section 7: Conclusions
There is no scientific or mathematical formula that can adequately measure risk.—John H. Gibbons, Office of Technology Assessment, 1980
The risk from any event depends upon the prob-ability of it occurring and the consequences if itwere to occur. As explained in section 2 of thisreport, looking at only probability or only con-sequences results in an incorrect understandingof risk.
However, it is possible to properly manage riskwithout knowing much about the probabilityand/or consequences of an event. When everypossible measure is implemented to prevent anevent from occurring and every possible steptaken to minimize the consequences should itoccur, then the risk is as low as possible. But it isnot possible to properly manage risk when onlyreasonable—instead of all possible—measures aretaken to prevent and mitigate events unless theprobabilities and consequences are accuratelyknown.
The NRC required nuclear plant owners toprepare risk assessments in the early 1990s. Butas section 3 reveals, these assessments merelyevaluate the probability of reactor accidents. Theplant-specific accident consequences have notbeen updated since a study done in 1982 using1980 population information. Thus, the NRChas limited insight into nuclear plant risks.
The value of the NRC’s partial insight is furtherdiminished by the poor quality of the probabil-ity assessments. The probability assessment cal-culations rely on several assumptions that simplydo not reflect reality, as documented in section4. Thus, accident probabilities are higher thanreported by the plant owners, and yet the NRCrelies on them.
In large part, the probability assessments yieldbogus results because the NRC never establishedminimum standards that plant owners had tomeet. As the case studies in section 5 indicate,the lack of standard definitions and proceduresfor preparing probability assessments resulted inwidely varying accident probabilities for virtu-ally identical plants.
That a nuclear plant accident can have disas-trous consequences may be known intuitively,but section 6 details the potential body counts.More people could be killed by a nuclear plantaccident than were killed by the atomic bombdropped on Nagasaki. The NRC attempts tomanage this awesome risk by limiting the prob-ability of an accident. But accident probabili-ties are not known with sufficient certainty topermit only reasonable instead of all possiblesafety precautions to be taken.
If this were just a historical observation, it wouldbe bad enough. Unfortunately, the sad story getsworse.
The nuclear industry and the NRC are slashingsafety regulations at a frenetic pace in an effortto make nuclear power plants more economicalto operate. Nuclear plants must generate elec-tricity at competitive prices if they are to survivein a deregulated electricity marketplace. In thepast decade, plant owners made numerouschanges to increase productivity (i.e., profitabil-ity). Refueling outages are an example. Nuclearpower plants shut down every 18 to 24 monthsto load fresh fuel into the reactor core. Refuel-ing outages that averaged 101 days in 1990 were
22 Union of Concerned Scientists
performed in only 51.1 days in 1998.52 Conse-quently, the average output from nuclear plantsrose from about 67 percent of capacity in 1990to 79.5 percent in 1998.53
The remaining option for additional cost-savingsis simply to do less. Plant owners are downsizingstaff sizes by eliminating work. Fewer tests andinspections are performed at nuclear plants todaythan five years ago. For example, the NRCrecently approved a request by the owner of theDuane Arnold nuclear plant in Iowa to testvalves that limit the release of radioactive liquidevery ten years instead every two years.54 TheNRC also allowed the owner of the San Onofrenuclear plant in California to relax the mainte-nance check on the valves that protect the mainsteam lines from bursting from too muchpressure.55 As a direct result, fewer problems arefound and fewer repairs are needed. Plant ownerssave lots of money by reducing staffing levelsand repair bills.
The NRC is approving these cost-cuttingmeasures based on evaluations purporting toshow that the reduced number of inspectionsdoes not increase the probability of accidents.But the incomplete and inaccurate probabilityassessments cannot identify the true risk ofnuclear plant operation, nor can they provide aclue as to how far the results are from reality.How can that be possible? Imagine balancing a
checkbook without having all of the deposit slipsor all of the check amounts written against theaccount. You can calculate a balance, but it tellsyou nothing about how much money is in theaccount. And you can only guess if the numberis higher or lower than the actual balance. Like-wise, the NRC is guessing when it makes safetydecisions using the results from incomplete andinaccurate probabilistic assessments.
The NRC is now proposing to move to so-calledrisk-informed regulation. This is the NRC’s termfor allowing plant owners to cut back on inspec-tions and tests of safety equipment when riskassessment “shows” that such cutbacks wouldnot increase risk. For example, the NRC hasapproved changing a test interval for a piece ofequipment from once per month to once perquarter when risk information gathered andsubmitted by the plant’s owner suggested thatthe equipment’s failure will not significantlyincrease the probability of reactor core damage.
The NRC conceded that it cannot demonstratethe move to risk-informed regulation is neces-sary or will improve safety, the two criterianecessary to justify its use:
More fundamentally, it may be very diffi-cult to show that the risk informed changes,in any form, either: (i) will result in a sub-stantial increase in overall protection of the
52. Nuclear Energy Institute, “Refueling Outages at US Nuclear Plants (Average Duration),” Washington, D.C.,1999. Available online at www.nei.org.
53. Nuclear Energy Institute, “US Nuclear Power Plant Average Capacity Factors 1980–1998,” Washington, D.C.,1999. Available online at www.nei.org.
54. Brenda L. Mozafari, Project Manager, Nuclear Regulatory Commission, to Eliot Protsch, President, IESUtilities, Inc., “Duane Arnold Energy Center—Issuance of Amendment Re: Revised Excess Flow Check ValveSurveillance Requirements,” Washington, D.C., December 29, 1999.
55. L. Raghavan, Senior Project Manager, Nuclear Regulatory Commission, to Harold B. Ray, Executive VicePresident, Southern California Edison Company, “San Onofre Nuclear Generating Station, Units 2 and 3—Issuance of Amendments on Small Break Loss-of-Coolant Accident Charging Flow and Main Steam Safety ValveSetpoints,” Washington, D.C., February 22, 2000.

Nuclear Plant Safety Risks 23
public health and safety or commondefense and security, the initial backfitthreshold finding; or (ii) are necessaryfor adequate protection.56 [emphasis inoriginal]
Yet the NRC continues to apply considerableresources to the move simply because it may save
56. William D. Travers, Executive Director for Operations, Nuclear Regulatory Commission, to Commissioners,Nuclear Regulatory Commission, “Options for Risk-Informed Revisions to 10 CFR Part 50—Domestic Licensingof Production and Utilization Facilities,” SECY-98-300, Washington, D.C., December 23, 1998.
plant owners a few dollars. The public wouldbe better served if these resources were appliedto restoring safety margins at nuclear powerplants. For example, the NRC could use thesefunds for additional inspections at nuclearpower plants to seek out and correct more ofthe design blunders described in section 4 ofthis report.

24 Union of Concerned Scientists
Section 8: Recommendations
The TMI accident revealed that perhaps reactors were not “safe enough,” that the regulatory system hassome significant problems (as cited in both the Kemeny and Rogovin investigations), that the probabil-ity of serious accident was not vanishingly small, and that new approaches were needed.
—Nuclear Regulatory Commission, 1984
The incomplete and inaccurate state of nuclearplant risk assessments does not provide a solidfoundation for the NRC to move towards risk-informed regulation. Before the NRC takesanother step towards risk-informed regulation,the NRC must complete the following tasks:
1. Establish a minimum standard for plant riskassessments that includes proper methods for
a) handling the fact that nuclear plantsmay not conform with all technical speci-fication and regulatory requirements
b) handling the fact that nuclear plantsmay have design, fabrication, and con-struction errors
c) handling equipment aging
d) treating the probability of reactorpressure vessel failure
e) handling human performance
f ) handling events other than reactor coredamage in which plant workers and mem-bers of the public may be exposed toradioactive materials (e.g., spent fuel poolaccidents and radwaste system tankruptures)
g) handling nuclear plant accident conse-quences to plant workers and membersof the public
h) justifying the assumptions used in therisk assessments
i) updating the risk assessments whenassumptions change
2. Require all plant owners to develop risk—not probability—assessments that meet orexceed the minimum standard.
3. Require all plant owners to periodically updatethe risk assessments to reflect changes to theplant and/or plant procedures.
4. Require all plant owners to make the riskassessments publicly available.
5. Conduct inspections at all nuclear plants tovalidate that the risk assessments meet or exceedthe minimum standards.
6. Disallow any use of risk assessment results todefine a line between acceptable and unaccept-able performance until all of the steps listedabove are completed.
It will take considerable effort on the part of theNRC to implement these recommendations.Unfortunately, the NRC may be unable to takethese safety steps because it is under attack fromthe US Congress to reduce its budget. Why? TheNRC is a fee-based agency. Most of the NRC’sbudget is paid not by taxpayers but by the plants’owners. These plant owners lobbied Congressto slash the NRC’s budget. Congress listened

Nuclear Plant Safety Risks 25
and slashed. In 1987, the NRC had 850 regionaland 790 headquarters staff members. Ten yearslater, chronic budget cuts had reduced the NRCto 679 regional and 651 headquarters staffmembers.57 During a decade that began with101 licensed nuclear power plants and endedwith 109 plants, the NRC lost 20 percent of itssafety inspectors.58
The US Congress must provide the NuclearRegulatory Commission with the budget andresources necessary to implement the recom-mended safety steps.
This course of action was first advocated byHenry Kendall 25 years ago:
Safety in the nuclear program must stemfrom a full understanding of potential
mishaps and from the greatest diligencein applying that knowledge to design,construction, operation, maintenance andsafeguarding of nuclear materials and fa-cilities. With such care it might provepossible to protect against damaging ac-cidents, arising from error and irrespon-sibility, equipment malfunctions, acts ofGod, and acts of intentional ill-will. Publicacceptance of nuclear power depends notonly on meeting the above requirementsbut also, in an important addition, on in-suring that public concerns are abated byforthright disclosure of all safety issuestogether with convincing evidence of theirfull resolution.59
The old adage of “better late than never” certainlyapplies in this case.
57. NRC Office of Nuclear Reactor Regulation, “Regulatory Trends,” Washington, D.C., April 1997.
58. Sadanandan V. Pullani, “Design Errors in Nuclear Power Plants.”
59. Henry W. Kendall, “Public Safety and Nuclear Power,” testimony before the US House Committee on Interiorand Insular Affairs Subcommittee on Energy and the Environment, April 29, 1975. Available from the Union ofConcerned Scientists, Cambridge, Mass.