Embed Size (px)
Citation preview

1
NUCLEAR ENERGY Issues Associated with its Future Utilization
Dr. Pete Lyons The Institute of Energy Economics, Japan
January 2016
IEEJ:January 2016 © IEEJ2016

2
Issues Associated with the Future of Nuclear Power
• Public Understanding of the Importance of
Limiting Carbon Emissions and the Vital Role of Nuclear Power • Public Trust and Appreciation of Safety • Nuclear Waste Management • Competitiveness of Nuclear Power in
Deregulated Electric Markets
IEEJ:January 2016 © IEEJ2016
3
0.000
0.100
0.200
0.300
0.400
0.500
0.600
0.700
0.800
0.900
1.000
0 5,000 10,000 15,000 20,000 25,000
Hum
an D
evel
opm
ent I
ndex
Australia U.S.
Germany
Hum
an D
evel
opm
ent I
ndex
Australia U.S.
Germany
Hum
an D
evel
opm
ent I
ndex
Australia U.S.
Germany
Russia
China
Sudan
Zimbabwe
Pakistan
Per Capita Electricity Consumption (kWh)
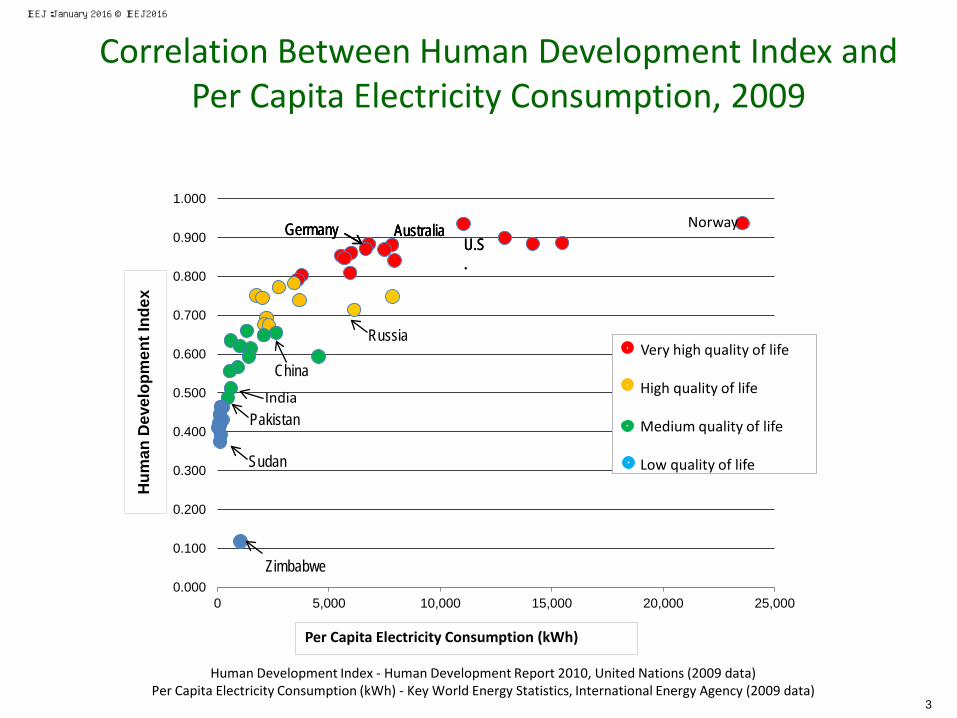
Very high quality of life High quality of life Medium quality of life Low quality of life
Human Development Index - Human Development Report 2010, United Nations (2009 data) Per Capita Electricity Consumption (kWh) - Key World Energy Statistics, International Energy Agency (2009 data)
Norway
India
Correlation Between Human Development Index and Per Capita Electricity Consumption, 2009
IEEJ:January 2016 © IEEJ2016

4
1.6 billion people have no access to electricity, 80% of them in South Asia and sub–Saharan Africa. 2.4 billion people burn wood and manure as their main energy source. 3 billion more people will be born by 2040
Source: 2005 Kay Chernush for the U.S. Department of State
Map of Global Energy Poverty
Conca, ANS Nov 2015
Source: United Nations; McFarlane 2006
Millions of people without electricity
Millions of people relying on biomass
56 96
28 20
18 570
801
815
530 509
221
332
3,000 Millions of people to be born by 2040
Source: United Nations; McFarlane 2006
Millions of people without electricity
Millions of people relying on biomass
56 96
28 20
18 570
801
815
530 509
221
332
3,000 Millions of people to be born by 2040
IEEJ:January 2016 © IEEJ2016

5
Each New Decade is the Warmest (from Somerville, November ANS Meeting)
IEEJ:January 2016 © IEEJ2016

6
Arctic Sea Ice Declined Dramatically (from Somervile, November ANS meeting)
IEEJ:January 2016 © IEEJ2016

7
Percent who think Global Climate Change is Happening, 2014. Average 63%.
(Yale Project on Climate change Communication; Nov., 2015)
IEEJ:January 2016 © IEEJ2016

8
Percent who think climate change will harm future generations, 2014. Average: 61%
(Yale Project on Climate change Communication; Nov., 2015)
IEEJ:January 2016 © IEEJ2016

9
Adults who believe most scientists think global warming is happening, 2014 Average 41% vs 98% actual!
(Yale Project on Climate change Communication; Nov., 2015)
IEEJ:January 2016 © IEEJ2016

10
ENERGY IN THE U.S. IEEJ:January 2016 © IEEJ2016

11
CARBON EMISSIONS IN THE U.S. IEEJ:January 2016 © IEEJ2016

12
Nuclear Energy Plays an Important Role in US Energy Supply
• Nuclear power is a clean, reliable base load energy source
– Provides 19% of U.S. electricity generation mix
– Provides 61% of U.S. emission-free electricity
– Avoids about 700 MMTCO2 each year
– Helps reduces overall NOx and SOx levels
• U.S. electricity demand projected to increase ~28% by 2040 from 2011 levels
• 100 GWe nuclear capacity - 99 operating plants
– Fleet maintaining close to 90% average capacity factors
– Most expected to apply for license renewal for 60 years of operation.
Nuclear 19%
Electricity Production, 2012
Total: 4,054,485 GWh
Nuclear 61% Conven.
Hydro 22%
Wind 11%
Solar 0%
Geo-thermal
1% Biomass
5%
Net Non-Carbon Emitting Sources of Electricity, 2012
Source: Energy Information Administration
IEEJ:January 2016 © IEEJ2016

13
Quotes from recent James Hansen article
• Published in The Guardian, Dec 3, 2015 • “Nuclear will make the difference between the world missing
crucial climate targets or achieving them.” • “Policy must be based on facts and not on prejudice…Climate sys-
tems cares about greenhouse gas emissions – not about whether energy comes from renewable power or abundant nuclear power.”
• “Some argue that it is feasible to meet all our energy needs with renewables. …[These[ scenarios downplay or ignore the intermittency issue by making unrealistic technical assumptions and can contain high levels of biomass and hydro .. at the expense of true sustainability.”
• “Large amounts of nuclear power would make it much easier for solar and wind to close the energy gap.”
IEEJ:January 2016 © IEEJ2016

14
Integration of Renewable and Nuclear Power Enables Carbon Reduction across the Energy Spectrum
(Under study in Japan, U.S., China)
• Hybrid Energy Systems – Focus on recognition that only Renewables, Nuclear and Hydro
are clean energy sources available today. – Hydro can not expand significantly in the U.S. or Japan (?) – Emphasize integration of assets on a grid level – Recognize that a national grid must exhibit supply diversity and
high levels of reliability
• Key Attribute – Designed to optimize contribution of both nuclear and
renewable assets – Cleanly produce all needed electricity PLUS another asset in the
industrial or transportation sector
IEEJ:January 2016 © IEEJ2016

15
Price Distribution in Current/Future Scenarios (from Charles Forsberg, MIT, at ICAPP, 2016)
IEEJ:January 2016 © IEEJ2016

16
Schematic of a Hybrid Energy System
IEEJ:January 2016 © IEEJ2016

17
Clean Production of Hydrogen with Hybrid Energy Systems
IEEJ:January 2016 © IEEJ2016

18
Public Trust and Understanding of Safety
• Public recognition of an independent regulator
• Open data sources on performance indicators • Public discussion of the rationale used for
relocations after Fukushima and the uncertainties in that action
• A strong INPO-like organization (JANSI?)
IEEJ:January 2016 © IEEJ2016

19
U.S. poll: Favorable to Nuclear Energy (from Bisconti Research)
49
68
1983
19
84
1985
19
86
1987
19
88
1989
19
90
1991
19
92
1993
19
94
1995
19
96
1998
19
99
2000
20
01
2002
20
03
2004
20
05
2006
20
07
2008
20
09
2010
20
11
2012
20
13
2014
M
ar-1
5
IEEJ:January 2016 © IEEJ2016

20
Aftermath of TMI
• Public support gradually increased • INPO creation
– JANSI in Japan??
• NRC role validated – Vastly strengthened
safety regulations
IEEJ:January 2016 © IEEJ2016

21
Example of Publicly Available Performance Indicators
IEEJ:January 2016 © IEEJ2016

22
PASSIVE SAFETY Important to discuss in Japan???
• ACTIVE SAFETY
- All LWRS in the world utilize active safety today - Reactors require prompt operator actions in an upset condition
Correct actions typically needed in less than an hour Frequent drills with U.S. NRC to assure operator readiness to respond Additional equipment procured to address Station Blackout (U.S. and Japan) Failure to take prompt actions was a MAJOR contributor to Fukushima disaster
• PASSIVE SAFETY - Designed to avoid the need for prompt operator actions - Typically large quantities of stored coolant moved by gravity or convection - Some advanced reactors have inherent safety, no meltdown possible. - Passive safety can extend time for actions from hours to indefinite - Toshiba-Westinghouse AP1000 was first passively safe reactor certified
No operator actions needed for 3 days.
IEEJ:January 2016 © IEEJ2016
23
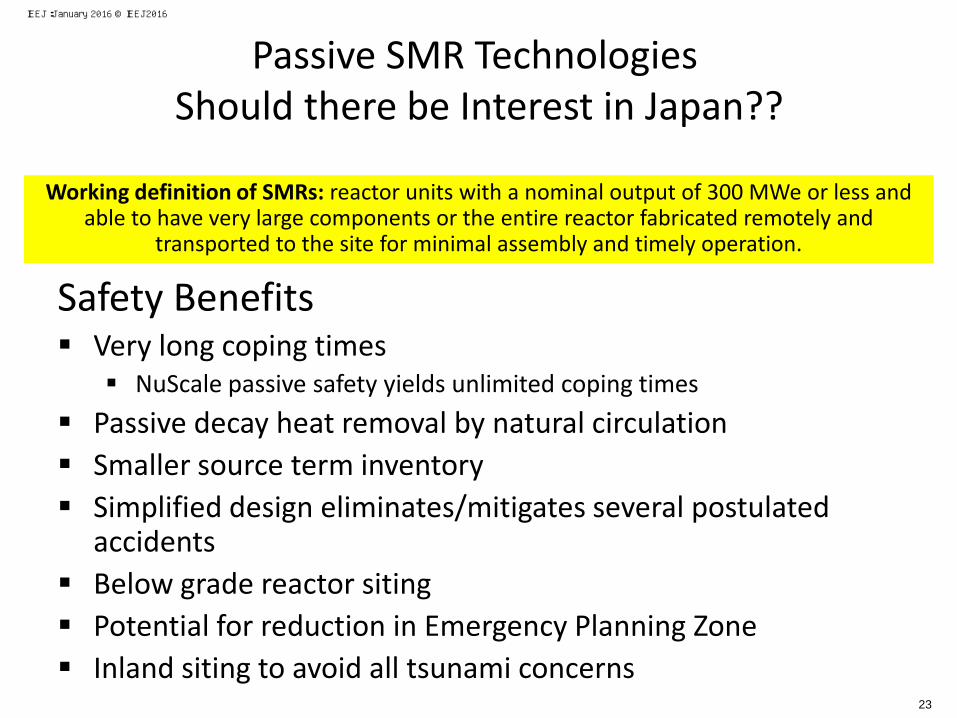
Passive SMR Technologies Should there be Interest in Japan??
Safety Benefits Very long coping times
NuScale passive safety yields unlimited coping times Passive decay heat removal by natural circulation Smaller source term inventory Simplified design eliminates/mitigates several postulated
accidents Below grade reactor siting Potential for reduction in Emergency Planning Zone Inland siting to avoid all tsunami concerns
Working definition of SMRs: reactor units with a nominal output of 300 MWe or less and able to have very large components or the entire reactor fabricated remotely and
transported to the site for minimal assembly and timely operation.
IEEJ:January 2016 © IEEJ2016
24
U.S. Small Modular Reactor (SMR) Licensing Technical Support Program
In 2012, DOE initiated a 6-year/$452M program to provide financial assistance for design engineering, testing, certification and licensing of promising SMR technologies with high likelihood of being deployed at domestic sites in the mid-2020’s.
Commercial SMR development is being accelerated through public/private arrangements with 50% cost share provided by U.S. industry partners.
Site permitting and licensing activities are in progress: – U.S. Government Interagency Agreement for the Tennessee Valley Authority’s Clinch River Site -- Developing Early Site Permit (ESP), expected mid-2019; Cost-shared 50/50 – Second NuScale Cooperative Agreement -- NuScale to partner with a utility to explore siting
SMR on or near Idaho National Laboratory; Site-related activities needed to develop license application; Cost-shared 50/50
IEEJ:January 2016 © IEEJ2016

25
National Path Forward on Nuclear Waste
• Yucca Mountain required by Nuclear Waste Policy Act Amendments of 1987 – Not chosen through a scientific or consent process – Opposed in Nevada and effectively blocked
• Obama Administration recognized need for alternative approaches – Blue Ribbon Commission formed – Impasse continues
IEEJ:January 2016 © IEEJ2016

26
Blue Ribbon Commission Report (issued January 2012)
1. A new, consent-based approach to siting future nuclear waste management facilities.
2. A new organization dedicated solely to implementing the waste management program and empowered with the authority and resources to succeed.
3. Access to the funds nuclear utility ratepayers are providing for the purpose of nuclear waste management.
4. Prompt efforts to develop one or more geologic disposal facilities.
5. Prompt efforts to develop one or more consolidated storage facilities.
6. Prompt efforts to prepare for the eventual large-scale transport of spent nuclear fuel and high-level waste to consolidated storage and disposal facilities when such facilities become available.
7. Support for continued U.S. innovation in nuclear energy technology and for workforce development.
8. Active U.S. leadership in international efforts to address safety, waste management, non-proliferation, and security concerns.
IEEJ:January 2016 © IEEJ2016

27
Key Elements of Administration’s Used Nuclear Fuel and High Level Waste Strategy
IEEJ:January 2016 © IEEJ2016

28
Choice of Open vs. Closed Fuel Cycle
• Open Cycle chosen for U.S. in near term – Many sites suitable for geologic repository in U.S. – Strong U.S. research program in reprocessing – U.S. could revisit their choice, but after a repository is
operational (in my view) • Closed cycle chosen for Japan
– “Complex” history for Rokkasho – Very large quantities of separated plutonium – Ongoing search for possible repository sites
• Decision Drivers – Different Countries may make different choices – Economics may drive decision
• Economics of repositories, fuel resources, and reprocessing.
IEEJ:January 2016 © IEEJ2016

29
Regulated vs De-regulated Markets
• Regulated Markets – Public Utility Commissions control price and supply – PUCs can take a long term view of grid reliability and
cost of electricity.
• De-regulated Markets – In theory, increase competition and lower prices – Consumers can choose their providers – Consumers and shareholders focus on short term
costs and profits
IEEJ:January 2016 © IEEJ2016

30
Deregulation in Texas
• Cost benefits have not been realized – In general, all electricity prices have decreased. – In 10 years pre-deregulation, Texans paid 6% below the
national average. – In 10 years post-deregulation, Texans paid 8.5% above the
national average
• Areas of deregulation have paid more – Comparing Texans in deregulated vs regulated areas, a
typical household lost $4500 since 2002.
Source: Texas Coalition for Affordable Power
IEEJ:January 2016 © IEEJ2016

31
Status of U.S. Deregulation IEEJ:January 2016 © IEEJ2016

32
Investment Considerations in Regulated vs De-Regulated Markets
• In a regulated environment, long term system planning drives investments – System expansion is viewed from a long term cost and reliability
perspective – Utilities can be confident of Return on Investment as long as
they control costs of the construction of new assets.
• In a de-regulated environment, electricity spot prices drive investment. – Impossible to accurately predict long term spot prices. – Utilities emphasize quick, cheap construction of
generation assets to satisfy shareholders.
IEEJ:January 2016 © IEEJ2016

33
Externalities of Nuclear Power not valued in Deregulated Markets
• Zero carbon generation • Very high reliability • Fuel Diversity • Non-proliferation benefits
IEEJ:January 2016 © IEEJ2016

34
Challenges to Nuclear Power in U.S.
• Declining power demand in many regions • Renewable mandates in many states
– Very few states include nuclear in the mandate
• Federal renewable production tax credits • Very low natural gas prices and easy construction • De-regulated markets only value spot pricing. • Very high capital costs with long construction
times.
IEEJ:January 2016 © IEEJ2016

35
Challenges and Changes to U.S. Nuclear Fleet
• Discussions continue on how to value the benefits of nuclear energy in electricity markets. Some market failures have led to plant closings.
– Vermont Yankee permanently shut down December 2014 – Fifth reactor closed since January 1, 2013
• OECD/NEA study (2012): Introduction of additional renewables will impact nuclear by reducing load factors and electricity prices.
– 10% market penetration for wind results in ~24% reduction in nuclear profitability
“Nuclear plants are under increasing economic pressure to close as a result of record low capacity prices………… Losing these plants has long-term implications both to the reliability of the system and on the nation’s emission profile.“
Federal Energy Regulatory Commissioner Moeller, April 2015
IEEJ:January 2016 © IEEJ2016

36
Action to Address Market Issues
• State policies – Illinois legislature considering low carbon portfolio
standard to recognize nuclear attribute – New York completed a power purchase agreement to
allow Ginna plant to continue operation
• Market changes – PJM redefined capacity market to value fuel availability
• EPA Clean Power Plan – Will require states to meet GHG emissions reductions – Policies to do this should value nuclear
IEEJ:January 2016 © IEEJ2016

37
Cost of U.S. Electricity Production Operations, Maintenance and Fuel Only
IEEJ:January 2016 © IEEJ2016

2002-2014 Trends in U.S. Nuclear Plant Costs (2014 $ per MWh)
Year Fuel Capital Operating Total 2002 5.72 3.92 18.59 28.23 2003 5.59 4.93 18.84 29.37 2004 5.28 5.65 18.54 29.47 2005 5.02 5.80 18.95 29.77 2006 5.04 5.56 19.21 29.81 2007 5.13 6.12 19.07 30.31 2008 5.35 6.76 19.51 31.62 2009 5.93 8.91 20.49 35.33 2010 6.76 9.16 20.63 36.55 2011 7.10 10.06 21.88 39.04 2012 7.46 10.76 21.47 39.70 2013 7.73 8.20 20.93 36.86 2014 7.17 8.18 20.92 36.27
2002-2014 Increase 25% 109% 13% 28% 2009-2014 Increase 21% -8% 2% 3%
Source: Electric Utility Cost Group (EUCG)
IEEJ:January 2016 © IEEJ2016

39
Drivers of Nuclear Electricity Cost Increases
• Capital expenditure on upgrades for license extension • Capital expenditure on uprates • Capital expenditure on safety-related upgrades (past: vessel-
head replacement; future: hardened/filtered vents) • Security-related upgrades
IEEJ:January 2016 © IEEJ2016

40
Sanmen Source: SNPTC
Vogtle
Source: Georgia Power Co. Summer Source: SCE&G
Global Demand for Nuclear Energy Continues
• Key Drivers: • Long-term energy supply/energy security • Clean, base-load source of energy • Significant source of jobs and economic benefit
IEEJ:January 2016 © IEEJ2016

41
Thanks for your Attention
• My contact Information – [email protected]
• One of my prime sources and colleagues is Ed Kee – Ed is owner of Nuclear Economics Consulting Group – Ed has written many commentaries on economic issues of
nuclear energy including deregulation – Ed’s commentaries are translated into Japanese by JAIF. – Ed’s commentaries are at http://www.jaif.or.jp/necg-
commentary-series/#nucleareconomics
IEEJ:January 2016 © IEEJ2016
Contact :[email protected]