Embed Size (px)
Citation preview

RESEARCH ARTICLE
Nuclear morphometry and ploidy of normal
and neoplastic haemocytes in mussels
Francesca Carella1*, Gionata De Vico1, Gabriel Landini2
1 Department of Biology, University of Naples Federico II, Naples, Italy, 2 School of Dentistry, College of
Medical and Dental Sciences, University of Birmingham, Birmingham, B5 7EG, United Kingdom
Abstract
Haemic neoplasia (HN) in bivalves has been reported in association with mass mortality
events in various species of molluscs. The aim of this work was to quantify the nuclear mor-
phometry and DNA content of neoplastic cells of mussels Mytilus galloprovincialis affected
by HN using nuclear densitometry in Feulgen-stained preparations. The results were also
compared with a population of normal mussel haemocytes. We captured 256 images of 3
different neoplasia stages and 120 images of normal haemocytes; thus, a total of 120,166
nuclei were analysed. We extracted 21 morphological parameters from normal and neoplas-
tic nuclei. Eighteen of these parameters were different (P<0.05). Among those (expressed
in pixel units—inter-pixel distance of 0.45 micrometres—as: normal vs. neoplastic) nuclear
area (117.1±94.1 vs. 423.1±226.9), perimeter (44.9±14.0 vs. 79.0±21.3) and (IOD) inte-
grated optical density (13.47±34.5 vs. 177.1±150.8) were relevant features to discriminate
between normal and neoplastic cells. Those differences allowed identifying two distinctive
populations of neoplastic nuclei, occasionally in the same individuals at a given phase of the
disease. Moreover, neoplastic haemocytes in less extended lesions showed a ploidy value of
6.2 n along with the presence of a second population of circulating cells with a DNA content
of 10.7n. In samples with moderate disease only one peak at 7n was observed. Finally, in
more severe conditions, a further ploidy peak of 7.8n was recorded, accompanied by a shal-
low but broad peak of 31n. This latter extreme value is thought to be due to the presence of
giant multinucleated cells where individual nuclei overlap in space and cannot be discerned
individually. Computer-based imaging allowed the direct visualization of the cell populations
and simultaneous collection of ploidy data as well as morphological features of nuclei.
Introduction
Nuclear morphology is an important feature associated with cellular function and disease.
Enlargement of nuclei, anisokaryosis, nuclear pleomorphism, changes in chromatin patterns
and nucleolar abnormalities are well-recognized features of neoplastic cells in human [1–3] as
well as animal tumours [4–7]. The quantitative assessment of variability of nuclear features in
pathological and physiological conditions has important diagnostic applications that can be
best achieved using morphometric analysis [7–8].
PLOS ONE | DOI:10.1371/journal.pone.0173219 March 10, 2017 1 / 18
a1111111111
a1111111111
a1111111111
a1111111111
a1111111111
OPENACCESS
Citation: Carella F, De Vico G, Landini G (2017)
Nuclear morphometry and ploidy of normal and
neoplastic haemocytes in mussels. PLoS ONE 12
(3): e0173219. doi:10.1371/journal.pone.0173219
Editor: Donald James Colgan, Australian Museum,
AUSTRALIA
Received: February 22, 2016
Accepted: February 17, 2017
Published: March 10, 2017
Copyright: © 2017 Carella et al. This is an open
access article distributed under the terms of the
Creative Commons Attribution License, which
permits unrestricted use, distribution, and
reproduction in any medium, provided the original
author and source are credited.
Data Availability Statement: All relevant data are
within the paper and its Supporting Information
file.
Funding: The work was supported by the
following: Progetto MODO-Animal Model 2014; the
Engineering and Physical Sciences Research
Council (UK) (Grant No. EP/M023869/1, Novel
context-based segmentation algorithms for
intelligent microscopy).
Competing interests: The authors have declared
that no competing interests exist.

Haemic neoplasia (HN) is a proliferative disorder of bivalve haemocytes first described by
Farley [9] in oysters (Crassostrea virginica and Crassostrea gigas). HN was later observed in
twenty additional molluscan species from various ecosystems and geographic areas, including
commercially-important species, and reported in populations suffering mass mortality [10–
12]. The disease is characterized by the proliferation of atypical cells with a possible haemocyte
origin, which morphologically exhibit high nuclear to cytoplasmic ratio, diffuse chromatin pat-
terns and pleomorphic nuclei [9]. In the advanced disease, those cells typically infiltrate tissues
and organs [13–16]. Moreover, previous studies on bivalves revealed abnormal DNA content
in these neoplastic haemocytes [17–18]. Several hypotheses have been postulated to explain the
origin of the disease, including chemical contamination [19–21], retroviral infection [22–24],
natural environmental extreme conditions [25] or animal clonal transmission [26]. Bivalve
HN was recently proposed as an emerging animal model for human cancer [27], however,
there are many aspects of the disease that remain unclear, including tumour histogenesis and
cell evolution over neoplastic progression, which appear to be different across the affected spe-
cies [13]. In the Mediterranean mussel Mytilus galloprovincialis, very few cases of HN have
been reported to date and therefore the descriptions of the cytological/functional features and
ploidy patterns are limited [11,13, 28, 29–32]. In relation to cell types, there has been reported
the existence of the so-called A and B cell subpopulations in individuals affected with HN in
different mussel species (e.g. M. edulis and M. galloprovincialis) under both light and electron
microscopy in contrast to flow cytometry [13, 33–34]. These cells, characteristic of haemic
neoplasia in mussel species, are easily discernible by their peculiar morphology [13, 33–34],
although their role in disease pathogenesis have not been clarified. It has been speculated that
A and B cell types might represent two distinct cancer cell lineages, while others suggested
they could represent consecutive developmental stages of a single cell lineage during disease
progression [13, 34–69]. Broad genomic abnormalities of cancer cells can be reliably studied
by both FCM (flow cytometry) and image cytometry (ICM). The latter is often used to perform
retrospective studies of DNA quantitation in archived material [37]. The standardized ICM is
recognized as a non-subjective, cost-effective and accurate technique to study DNA alterations
and ploidy changes [37]. In this context, despite that nuclear morphometry and DNA densi-
tometry have been extensively studied in human neoplasia, there have been few applications in
the field of invertebrate pathology. In order to add new insights in the biology of this interest-
ing neoplasia, we focused on HN in M. galloprovincialis and used a morphometric approach
involving light microscopy to 1) describe the nuclear morphology and quantify DNA contents
of the neoplastic cells of mussels affected by HN in Feulgen-stained histological preparations;
2) compare the obtained data with normal haemocytes; and 3) assess the data in the context of
the disease progression according to staging.
Materials and methods
Sampling, histology and feulgen reaction
A total of 35 Mussels (M. galloprovincialis) specimens were selected and retrieved from histo-
logical archival material of the Department of Biological Sciences, University of Naples Feder-
ico II belonging to a total sampling of 600 individuals during 2010. Fifteen mussels (2.5% out
of 600) were affected by HN and used for the study; an additional 20 unaffected individuals
showing normal circulating haemocytes were used as controls. The affected individuals were
from 3 mussel farms from the Gulf of Naples (southern Italy, Campania region) obtained in
March, May and June 2010: Nisida (N 40˚.47985; E14˚.9811 7) (6 individuals), Capo Miseno
(N 14˚.09362; N 40˚.78644) (5 individuals) and Castellammare (NO 14˚. 41745; 40˚.41327)
(4 individuals). The healthy individuals (n = 20) were obtained from the Gulf of Salerno
Nuclear morphometry and ploidy of normal and neoplastic haemocytes in mussels
PLOS ONE | DOI:10.1371/journal.pone.0173219 March 10, 2017 2 / 18
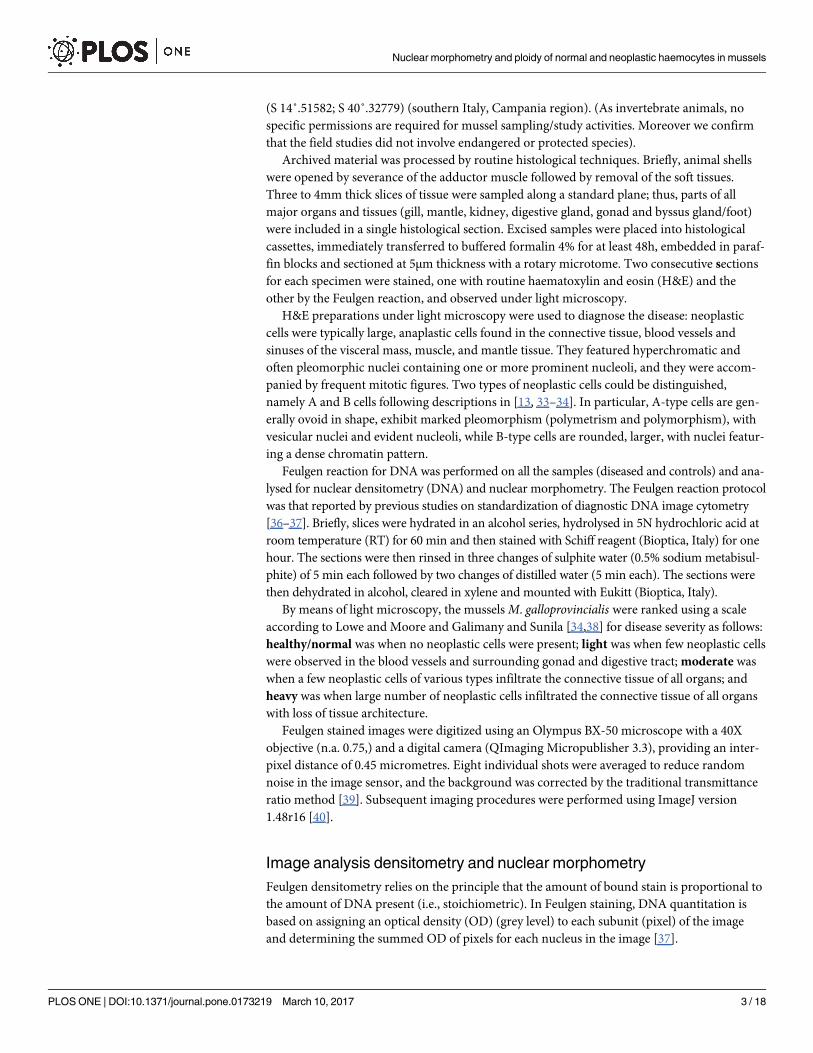
(S 14˚.51582; S 40˚.32779) (southern Italy, Campania region). (As invertebrate animals, no
specific permissions are required for mussel sampling/study activities. Moreover we confirm
that the field studies did not involve endangered or protected species).
Archived material was processed by routine histological techniques. Briefly, animal shells
were opened by severance of the adductor muscle followed by removal of the soft tissues.
Three to 4mm thick slices of tissue were sampled along a standard plane; thus, parts of all
major organs and tissues (gill, mantle, kidney, digestive gland, gonad and byssus gland/foot)
were included in a single histological section. Excised samples were placed into histological
cassettes, immediately transferred to buffered formalin 4% for at least 48h, embedded in paraf-
fin blocks and sectioned at 5μm thickness with a rotary microtome. Two consecutive sections
for each specimen were stained, one with routine haematoxylin and eosin (H&E) and the
other by the Feulgen reaction, and observed under light microscopy.
H&E preparations under light microscopy were used to diagnose the disease: neoplastic
cells were typically large, anaplastic cells found in the connective tissue, blood vessels and
sinuses of the visceral mass, muscle, and mantle tissue. They featured hyperchromatic and
often pleomorphic nuclei containing one or more prominent nucleoli, and they were accom-
panied by frequent mitotic figures. Two types of neoplastic cells could be distinguished,
namely A and B cells following descriptions in [13, 33–34]. In particular, A-type cells are gen-
erally ovoid in shape, exhibit marked pleomorphism (polymetrism and polymorphism), with
vesicular nuclei and evident nucleoli, while B-type cells are rounded, larger, with nuclei featur-
ing a dense chromatin pattern.
Feulgen reaction for DNA was performed on all the samples (diseased and controls) and ana-
lysed for nuclear densitometry (DNA) and nuclear morphometry. The Feulgen reaction protocol
was that reported by previous studies on standardization of diagnostic DNA image cytometry
[36–37]. Briefly, slices were hydrated in an alcohol series, hydrolysed in 5N hydrochloric acid at
room temperature (RT) for 60 min and then stained with Schiff reagent (Bioptica, Italy) for one
hour. The sections were then rinsed in three changes of sulphite water (0.5% sodium metabisul-
phite) of 5 min each followed by two changes of distilled water (5 min each). The sections were
then dehydrated in alcohol, cleared in xylene and mounted with Eukitt (Bioptica, Italy).
By means of light microscopy, the mussels M. galloprovincialis were ranked using a scale
according to Lowe and Moore and Galimany and Sunila [34,38] for disease severity as follows:
healthy/normal was when no neoplastic cells were present; light was when few neoplastic cells
were observed in the blood vessels and surrounding gonad and digestive tract; moderate was
when a few neoplastic cells of various types infiltrate the connective tissue of all organs; and
heavy was when large number of neoplastic cells infiltrated the connective tissue of all organs
with loss of tissue architecture.
Feulgen stained images were digitized using an Olympus BX-50 microscope with a 40X
objective (n.a. 0.75,) and a digital camera (QImaging Micropublisher 3.3), providing an inter-
pixel distance of 0.45 micrometres. Eight individual shots were averaged to reduce random
noise in the image sensor, and the background was corrected by the traditional transmittance
ratio method [39]. Subsequent imaging procedures were performed using ImageJ version
1.48r16 [40].
Image analysis densitometry and nuclear morphometry
Feulgen densitometry relies on the principle that the amount of bound stain is proportional to
the amount of DNA present (i.e., stoichiometric). In Feulgen staining, DNA quantitation is
based on assigning an optical density (OD) (grey level) to each subunit (pixel) of the image
and determining the summed OD of pixels for each nucleus in the image [37].
Nuclear morphometry and ploidy of normal and neoplastic haemocytes in mussels
PLOS ONE | DOI:10.1371/journal.pone.0173219 March 10, 2017 3 / 18

A total of 256 non-overlapping HN images were captured, including images from heavily
(n = 135), moderately (n = 67) and lightly diseased (n = 54) samples. In addition, 120 images
of normal haemocytes were also obtained. In total, 120,224 nuclei were analysed (normal hae-
mocytes n = 28,141 and neoplastic nuclei n = 92,083). Moreover, a total of 1000 nuclei of A
and B cells from selected areas were separately analysed within the neoplastic population (see
Tables 1 and 2).
The green channel of the 24-bit colour images of Feulgen stained nuclei were combined
into a single image stack and converted to a 32-bit greyscale. The green channel includes the
absorption peak frequency for the Feulgen–DNA dye complex and provides a convenient
method to estimate the DNA contents via the integrated optical density (IOD) of the nuclei. A
region of the slide without tissues provided the measure of incident light. The integrated opti-
cal density of the image was computed according to the formula [37]:
IOD ¼Xn
i¼1
� log10
IFiIBi
� �
where n = total number of pixels in the nucleus, IFi = intensity of the ith foreground (nuclear)
pixel, and IBi = intensity of ith background (clear area) pixel.
The nuclear mask was computed by means of Otsu’s thresholding [41] of the green channel
image. Incomplete nuclei partially overlapping the image edges were deleted, and a binary
watershed separation routine was applied to separate touching nuclei. Finally, non-haemocyte
nuclei in tissues were removed by manual image editing before further processing.
In Feulgen DNA densitometry, reference cells from haploid nuclei are required to estimate
the DNA quantity. Such a value is generally calculated by the ratio of the relative DNA content
Table 1. List of morphological parameters (DNA content and shape descriptors) used in the study. All units are in pixels (or pixels squared for cell
area parameters). Pixels to micrometer factor is 0.624. “None” are dimensionless values.
Parameter Units Description
IOD pixels The sum of the greyscale values in the particle
GrAverage pixels Average greyscale values in the particle
Perimeter pixels Perimeter calculated from the centres of the boundary pixels
Area pixels2 The area inside the polygon defined by the perimeter
MinR pixels Radius of the inscribed circle centred at the centre of mass
MaxR pixels Radius of the enclosing circle centred at the centre of mass
Feret pixels Largest axis length
Breadth pixels The largest axis perpendicular to the Feret diameter
CHull pixels Convex Hull or convex polygon calculated from pixel centres
MBCRadius pixels Radius of the Minimal Bounding Circle
AspRatio none Aspect Ratio = Feret/Breadth
Circularity none Circularity = 4*π*Area/Perimeter2, also called form factor
Roundness none Roundness = 4*Area/(π*Feret2)
Compactness none Compactness: sqrt((4/π)*Area)/Feret
Solidity none Solidity = Area/Convex_Area
Concavity pixels2 Concavity = Convex_Area*–AreaCArea = Area of the Convex Hull polygon
Convexity none Convexity = Convex_Hull/Perimeter
Shape none Shape = Perimeter2/Area
ModRatio none Modification Ratio = (2*MinR)/Feret
Sphericity none Sphericity = MinR/MaxR
Rectangularity none Rectangularity = Area/ArBBox* ArBBox = Feret*Breadth, area of the box along Feret diameter
doi:10.1371/journal.pone.0173219.t001
Nuclear morphometry and ploidy of normal and neoplastic haemocytes in mussels
PLOS ONE | DOI:10.1371/journal.pone.0173219 March 10, 2017 4 / 18

Table 2. Descriptive statistic (Mean ±SD) of normal and neoplastic cell nuclei with detail on Perimeter, Area and IOD values. Values of 1000 counted
neoplastic A and B cells are also reported. *Asterisk indicates mean values of morphological features significantly different (P<0.05) compared with normal
haemocytes.
Normal Haemocytes Neoplastic haemocytes
Perimeter 44.90 ±14.0 79.03±21.3 *
A cell: 58±0.72*
B cell: 70.03±0.08*
Area 117.1 ±94.1 423.13±226.9*
A cell: 250±87.2*
B cell: 389.9±125.6*
IOD 13.47 ±34.5 177.13±150.8*
A cell: 133±24.2*
B cell: 162.13±12.2*
GrAverage 0.1704 ±0.05 0.369±0.211*
A cell: 0.15±0.02*
B cell: 0.41±0.12*
MinR 6.283±1.69 8.540±2.44*
A cell: 5.09±1.2*
B cell:9.02 ± 0.01*
MaxR 10.65±2.86 14.47±4.08*
A cell: 9.12±1.12*
B cell: 13.17±13.12*
Feret 20.49±5.37 27.879±7.69*
A cell: 12.23±11.76*
B cell:26.31±12.56*
Breadth 15.20±3.71 21.160 ±5.55*
A cell: 15.32±3.24*
B cell:22.014±9.1*
CHull 42.92±12.9 75.99±19.6*1
A cell: 54.12±46*
B cell:73.467±25. *
MBCRadius 10.28±2.68 13.977±3.85*
A cell: 8.59±1.24*
B cell:13.64±5.76*
AspRatio 1.190±0.42 1.336±0.267*
A cell: 1.25±0.12
B cell:1.242±0.05
Circularity 0.5980±0.09 0.807±0.074*
A cell:0.74±0.2
B cell:0.580±0.71
Roundness 0.3709±0.140 0.667±0.115*
A cell: 0.623±0.2
B cell:0.497±0.12
Compactness 0.8139±0.09 0.8136±0.07
A cell: 0.781±0.02
B cell:0.586±0.55
Solidity 0.7527±0.032 0.961±0.03*
A cell: 0.925±0.02*
B cell:0.625±0.01*
(Continued )
Nuclear morphometry and ploidy of normal and neoplastic haemocytes in mussels
PLOS ONE | DOI:10.1371/journal.pone.0173219 March 10, 2017 5 / 18

in the cells divided by the DNA measurement, based on a previous reference [37]. This value,
called C-value, is the amount of DNA contained within a haploid nucleus expressed in pico-
grams. In order to estimate the DNA content of normal and neoplastic nuclei, the following
formula was used:
Cs ¼ ðIODs x 1CpÞ=IODp;
Cs ¼ðIODs� 1CpÞ
IODp
where Cs = C nuclear DNA content of the sample, Cp = C nuclear DNA content of the pri-
mary standard (in pg), IODs = mean of nuclear IOD value of the sample. and IODp = mean of
nuclear IOD value of the primary standard. For mussel M. galloprovincialis, the primary stan-
dard value of normal haemocytes is 1C = 0.96 pg.
Binary regions that did not correspond to single nuclei were removed by size filtering
(between 25 and 300 pixels). In order to determine whether the obtained masks fit the nuclei
profiles, we computed the difference between the Feulgen stained images and the binary
masks using the ImageCalculator of ImageJ. The DilateNoMerge_8 plugin [42] was also used to
adjust the nuclear dimension when necessary by morphological dilation without merging with
the nearby nuclei. The IOD and associated morphometrical parameters of the nuclei were
obtained using the Particles8 plugin redirected to the 32-bit optical density images [42]. Fig 1
presents the most relevant steps in the sequence of procedures for image processing (see also
S1 Video File).
A total of 21 morphological parameters were measured in the normal and neoplastic nuclei
(Fig 2, Table 1).
Table 2. (Continued)
Normal Haemocytes Neoplastic haemocytes
Concavity 11.080±10.82 18.13±21.2*
A cell: 14.18±8.1*
B cell:6.71±12.1*
Convexity 0.860±0.017 0.964±0.015*
A cell: 0.93±0.02
B cell:0.671±0.01
Shape 12.065±2.836 15.71±1.701*
A cell: 16.90±1.1
B cell:15.11±1.2
ModRatio 0.628±0.1526 0.625±0.13
A cell:0.542 ±0.14
B cell:0.473±0.02
Sphericity 0.606±0.1527 0.604±0.13
A cell: 0.53±0.12*
B cell:0.458±0.01*
Rectangularity 0.493±0.0482 0.678±0.04*
A cell: 0.527±0.02
B cell:0.471±0.01
doi:10.1371/journal.pone.0173219.t002
Nuclear morphometry and ploidy of normal and neoplastic haemocytes in mussels
PLOS ONE | DOI:10.1371/journal.pone.0173219 March 10, 2017 6 / 18

Statistical analysis
The statistical analyses of the data were performed using SPSS 21 (SPSS Inc., Chicago, USA).
Descriptive statistics (mean, standard deviation [SD], maximum and minimum) for all the
morphological parameters were calculated. The differences between the data groups means
were analysed by t test (P<0.05 was considered statistically significant) when only two groups
were compared. A regression analysis was computed using a general linear model (GLM) to
compare the means of the morphological parameters across the different groups. Stepwise lin-
ear discriminant analysis was performed according to normal and neoplastic types and to dis-
ease stages. Differences in the distribution shapes of the various parameters were analysed with
the Kolmogorov-Smirnov test.
Results
The mean values of the extracted 21 morphological parameters for normal and neoplastic cells
are provided in Table 2 and Fig 2.
Fig 1. The sequence of steps to process images of neoplastic nuclei at light disease severity (A, C, E)
and heavy (B,D,F) from Feulgen-stained sections (A-B); converted to the green channel (C-D) and
after binarisation (E-F).
doi:10.1371/journal.pone.0173219.g001
Nuclear morphometry and ploidy of normal and neoplastic haemocytes in mussels
PLOS ONE | DOI:10.1371/journal.pone.0173219 March 10, 2017 7 / 18

According to the disease severity, six cases were classified as early lesions (light) with neo-
plastic cells (A cells only) underlying the stomach epithelium (Fig 3A and 3B). Four cases
were at the intermediate level (moderate diffusion) of neoplasia characterized by small isolated
scattered foci of both A and B cells distributed in different percentages in gills, visceral mass,
mantle and kidney (Fig 3A and 3C). At this stage, necrosis of digestive tubules was recorded in
two cases. The more severe disease condition (5 cases) consisted of massive proliferation of
rounded cells (B-cells only) with a dense chromatin pattern, replacing all of the vascular spaces
with an extensive loss of tissue architecture (Fig 3A and 3D). The degree of infiltration by the
neoplastic cells varied among animals but was most evident in the connective tissue, underlying
the stomach and intestine in the digestive gland region. Statistical analysis of the morphometric
data by using a multivariate general linear model revealed that the mean values of normal and
neoplastic nuclei were significantly different (P<0.05) for most of the morphological parame-
ters, with the exception of the compactness, modification ratio and sphericity (Table 2). Inter-
estingly, according to cases and disease severity, data revealed a bimodal distribution possibly
indicating a transition from less to more severe lesions, suggested by the IOD and area values
(Fig 3A and 3B) and (Table 2).
Fig 2. Scatter plots of 7 of the total morphological parameters extracted from normal and neoplastic nuclei.
doi:10.1371/journal.pone.0173219.g002
Nuclear morphometry and ploidy of normal and neoplastic haemocytes in mussels
PLOS ONE | DOI:10.1371/journal.pone.0173219 March 10, 2017 8 / 18
Comparisons between the area, perimeter and IOD in normal haemocytes and neoplastic
nuclei are presented in Fig 3C. Pairwise comparison using the Kolmogorov-Smirnov test
showed significant differences in the distribution of the IOD, area and perimeter in normal
and neoplastic nuclei (P<0.01).
Within the neoplastic group, the IOD distribution also suggested two different populations
of nuclei (appearing bimodal). Two populations were also suggested by the presence of two
peaks in the distribution of the nuclear area and perimeter length (Fig 3C). The ploidy status
of neoplastic nuclei was characterized by different values among the different phases (Fig 3D).
Normal haemocytes nuclei were considered to have a ploidy value of 1; a peak at this position
was also present in all the three disease conditions (light, moderate and heavy). In HN-affected
mussels with the light lesions, the ploidy value was 6.2n along with a second aneuploid popula-
tion at 10.7n. In samples exhibiting moderate disease, only one peak at 7n was observed.
Finally, in the heavy category, a peak at 7.8n was recorded accompanied by a shallow but
broad peak corresponding to 31n (Fig 3D). The possible reason for these disproportionate
DNA contents is discussed later.
A scatterplot for the area and IOD showed differences in values in the different disease con-
ditions. Haemocytes of normal appearance were also observed in the diseased samples (Fig
4A). Different values of area and IOD were shown in different disease conditions (Fig 4B).
A hierarchical stepwise linear discriminant analysis using all the cell morphological param-
eters revealed that 87.6% of cells could be correctly classified as ’normal’ and 89.2% as ’neoplas-
tic’ (Table 3). When classifying neoplastic nuclei according to the current classification of
disease severity, the class with the lowest correct classification rate was the light category
(42.3% correct) with a large proportion of cases (44.7%) misclassified as moderate (Table 4).
Discussion and conclusions
Cell and nuclei shape have long been considered important indicators of the events occurring
in the cellular micro-environment [43]. The morphology of neoplastic cell nuclei is currently
considered important in the assessment of tumour progression. Nuclear morphometry, i.e.,
the quantitative assessment of changes in profile, size, shape and optical density is frequently
associated with genetic anomalies in cancer cells [44]. Numerous shape descriptors exist in the
literature that can in principle be used to characterize various types of cancers and attempt to
predict their clinical outcomes [4, 45,46]. Over the years, various efficient quantitative methods
of analysis have been developed in the field of microscopy based on mathematical morphology
[47], stereology [48] and image processing principles [49]. In addition, image cytometry
(ICM) using Feulgen-stained tissue sections has been accepted as an accurate means of quan-
tify DNA contents for clinical applications in human cancer [37, 50–60] and in the determina-
tion of animal and plant genome sizes [61,62].
Very few cases of haemic neoplasia of Mediterranean mussel have been described in the lit-
erature, suggesting that it might have a low prevalence [13, 29,30,63]. In this work, our data
seems to be consistent with the above reports, (2.5% incidence in our samples). From a diag-
nostic point of view, our results showed that normal haemocyte nuclei were significantly dif-
ferent from neoplastic nuclei, in 18 out of the 21 morphological parameters and this allowed
discrimination between the normal and neoplastic cell populations. In particular, nuclear area,
perimeter and integrated optical density were the most relevant features for discriminating
normal from neoplastic nuclei.
Furthermore, taking into account current theories in the field of carcinogenesis [64], the
comparison of morphology and ploidy data as performed here, within the context of tumour
progression help us to improve the understanding of the disease pathogenesis. Malignant
Nuclear morphometry and ploidy of normal and neoplastic haemocytes in mussels
PLOS ONE | DOI:10.1371/journal.pone.0173219 March 10, 2017 9 / 18

Fig 3. Histopathology coupled with morphometry and ploidy values. A. Normal haemocytes and three typical
cases of neoplastic condition according to disease severity: A/B cell identification in histological sections and data
Nuclear morphometry and ploidy of normal and neoplastic haemocytes in mussels
PLOS ONE | DOI:10.1371/journal.pone.0173219 March 10, 2017 10 / 18

tumours commonly accumulate genetic defects that promote selection of cell clones with
increasing morphological atypia and enhanced ability to invade surrounding tissues and
metastasize [64]. Moreover, given that tumours accumulate mutations over time, it is neces-
sary to study neoplastic progression within the temporal context of so-called disease staging,
namely the extent of cancer progression at the time of diagnosis. This well-established concept
in clinical oncology is reformulated here in terms of light, moderate and heavy disease,
depending on the extent of invasion of the host tissues by the neoplastic cells at a given time
[65].
Accordingly, in this study, combining morphology and ploidy data, along with the morpho-
logical appearance of the cells, support the existence of at least two cell subpopulations that are
indistinguishable on a morphological level (e.g. only type-A cells might be detected) but featur-
ing differences in ploidy. These data are in accordance with the notion that neoplastic popula-
tions in early stages of cancer are typically affected by genomic instability often resulting in
heterogeneous aneuploid cell populations from which, over time, neoplastic clones with higher
distribution; a: normal haemocytes—granulocyte (big arrowheads) and ialinocytes (small arrowheads); b: light disease
condition with A cells visible (arrowheads and insert) exhibiting marked pleomorphism (polymetrism and polymorphism)
and vesicular nuclei; c: moderate disease condition showing presence of A and B cells (insert) mixed with normal
haemocytes (*); d: heavy disease state primarily exhibits the presence of B cells (insert and arrowheads) rounded in
shape, bigger, with nuclei showing a dense chromatin pattern. H&E. Insert Scale bar: 25 μm; B. Histograms showing
IOD and Area in at different level of disease severity. Notice the second population that arises in the heaviest disease
conditions; (C) Histograms showing the differences in IOD, Area and Perimeter between normal and neoplastic nuclei;
(D) Detailed small fluctuations in the IOD distribution over disease progression and compared with normal cells. The
data were smoothed with a running average filter of size 7 to preserve the large scale features of the plots.
doi:10.1371/journal.pone.0173219.g003
Fig 4. (A) Binned scatterplot for area and IOD in normal and neoplastic nuclei: denser area in neoplastic graph is
visible at the level of normal haemocytes values for IOD and area. (B) Scatterplot of neoplastic samples divided in
disease severity.
doi:10.1371/journal.pone.0173219.g004
Nuclear morphometry and ploidy of normal and neoplastic haemocytes in mussels
PLOS ONE | DOI:10.1371/journal.pone.0173219 March 10, 2017 11 / 18

survival rate and invasive ability emerge [66,67]. In this process, cancer cells typically might
undergo alterations in their morphology, occasionally diverging from the original/precursor
phenotype as they acquire new genetic and functional changes [66]. A typical example of this
process is represented by epithelial cancer cells that are known to acquire a mesenchymal-like
phenotype during tumour progression (i.e., epithelial-mesenchymal transition) [68]. In this
study, markedly differences in the averages of A and B cell types were observed compared with
the overall measures reported of ploidy and morphometry values. This is predictable consider-
ing the limited number of counted cells compared with the whole population of neoplastic
cells included in the study, also those potentially multinucleated. On the other side, this con-
firm not only visually, but with morphometric data, the concrete differences between these
two cells type. In this context, two hypotheses have been previously suggested regarding A-
and B-cell type histo-pathogenesis in Mytilus sp. HN. Moore [69] proposed that in Mytilus edu-lis, A and B cell types perhaps represent 2 distinct cell lineages. In contrast, Lowe and Moore
[34] and Carella [13] suggested that these cells could represent consecutive developmental
stages of a single cell line during disease progression According to the above data, the latter
hypothesis seems to be further supported if we consider that in advanced stages of the disease,
A-type cells disappear and only B-type cells are observed. According to the data examined in
this study and those reported in a recent report [70], co-existence of distinct neoplastic cell
subpopulation within the same host in a given time, is typical of intermediate stages of HN in
M. gallorprovincialis. This suggests that the HN pathogenesis in this species could be different
from that recently proposed for other bivalves, such as Cerastoderma edule, Mya arenaria and
Mytilus trossulus, where a clonal horizontal transmission of neoplastic cells was recently dem-
onstrated [70]. In HN of C. edule, in particular, two neoplastic cell populations have been
described belonging to two distinct neoplastic cell clones (also named Type A and Type B)
[70]. The clones are transmitted from affected to healthy animals by horizontal transplantation
of neoplastic cells through the sea water. However, the two cell types have never been encoun-
tered in the same affected individuals at a given time. In contrast, in Mytilus galloprovincialis,A-Type and B-type cells co-exist in a given individual and so they would seem to belong to the
same ploidy pool. In Mytilus trossulus, a species in which clonal horizontal transmission also
occurs, Vassilenko and Baldwin [71] observed ploidy values during tumour progression that
differed from those found in the present study and in the studies by Elston [11] and Moore
et al [69], suggesting that the diseases in Mytilus sp. are perhaps complex and might not exhibit
uniformity in their development.
As stated, the morphological changes in neoplastic nuclei also corresponded to an increase
in DNA content. In this study we used IOD as a measure of DNA content. Previous compari-
sons have shown that flow cytometry and image analysis provide similar efficacy of DNA
quantification for diagnostic purposes [57]. However, compared with flow cytometry, ICM
has a number of advantages: low cost, a small number of nuclei are required and the visual
morphological distinction between a cancer and a normal cells (important for cyto-patholo-
gists) is still possible. Because individual cells are analysed, ICM also provides a tool to perform
ploidy measurements across cancer cell subpopulations [72]. In our case, ICM led us to
Table 3. The percentages of correct classification by a stepwise discriminant analysis according to
‘normal’ and ‘neoplastic’ cells.
Original Group Predicted group % Total
normal neoplastic
normal 87.6 12.4 100.0
neoplastic 10.8 89.2 100.0
doi:10.1371/journal.pone.0173219.t003
Nuclear morphometry and ploidy of normal and neoplastic haemocytes in mussels
PLOS ONE | DOI:10.1371/journal.pone.0173219 March 10, 2017 12 / 18

measure DNA ploidy in Type-A/Type-B neoplastic cells, suggesting that they belong to a spe-
cific ploidy pool, but this could not have been possible using FC, which loses the morphologi-
cal component of other associated tissue features and requires large sample sizes (>10,000
cells). FC cannot distinguish aneuploidy in a given cell despite the measurement of DNA con-
tent per cell because the measurement in FCM is a distribution of DNA content for the entire
population of cells [72].
In cancer, the genomic diversity ranges from few to large-scale cytogenetic alterations
caused by increased genomic instability [73]. Consistent with this view, DNA content alter-
ation correlates with tumour progression and is observed in solid and haematological malig-
nancies [74]. Similar abnormalities have also been described in HN-affected bivalve molluscs,
with differences noted among species [17]. For instance, a study by Farley [9] reported a rela-
tively high proportion of dividing cells with abnormal numbers of chromosomes. Previous
studies using flow cytometry (FCM) [34] also reported 2 morphologically distinct types of cells
in M. edulis with different DNA contents along with observations of chromosomal aberrations.
These studies reported similar DNA content compared with our cases. With regard to the high
values of ploidy observed in our study, [34] an increase in ploidy is noted during the progres-
sion of the disease in the neoplastic cell populations. Moreover, this increase in DNA in circu-
lating neoplastic cells occurred in parallel with the morphological changes described in
haemocytological preparations. In our study, the peak that was present at every stage could
represent the common diploid fraction of cells that were present in every tumour. In addition,
the presence of an extremely high value of IOD (31n) at the third stage is unlikely to arise from
single cells but perhaps from the effect of nuclear division without cell division, resulting in
multinucleated giant cells, as previously described by [13]. Overlapping packed nuclei along
the direction of observation might therefore artificially increase the optical density in those
multinucleated cells. This possibility might be resolved using transmission electron micros-
copy to clarify the extent and fine structure of the nuclei in those cells.
Other studies on mussels have linked environmental contamination to DNA damage,
including sister-chromatid exchange [75], micronuclei formation [76–77], strand breaks and
cross-linking [78–79], G1-arrest and G2-delay [80] and apoptotic processes caused by the
environmental pollutant tributyltin [81]. Karyotyping studies have reported the presence of
supernumerary chromosomes in cockle (C. edule) cells from Galicia and Portugal [82]. In a
similar manner, karyological analysis of Mytilus neoplastic cells demonstrated that the ploidy
alteration resulted from extensive chromosomal fragmentation [11]. Moreover, Reno et al [18]
observed changes in chromosome shape in M. arenaria, which may indicate chromosomal
breakage.
Stepwise discriminant analysis showed less than a perfect correct classification of cells in
the three classes considered. The possibility of an overlap in the populations across the diag-
nostic classes due to the contemporary presence of various types of neoplastic cells along with
normal haemocytes (20.3% at moderate) may explain this finding. Indeed, in the 3-class dis-
crimination, the analysis showed the lowest rate of correct classification for the moderate
Table 4. The percentages of correct classification by a stepwise discriminant analysis according to disease severity.
Original group Predicted group % Total
normal light moderate heavy
normal 77.8 0.3 20.3 1.6 100.0
light 10.2 42.3 44.7 2.8 100.0
moderate 15.9 10.1 59.2 14.8 100.0
heavy 11.2 8.9 27.5 52.4 100.0
doi:10.1371/journal.pone.0173219.t004
Nuclear morphometry and ploidy of normal and neoplastic haemocytes in mussels
PLOS ONE | DOI:10.1371/journal.pone.0173219 March 10, 2017 13 / 18

stage, where different types of cells were present. This underlines the difficulties in finding
consistent and unique morphologic classifiers and reveals the complications in the implemen-
tation of a standard with regard to neoplasm grading.
In conclusion, our results demonstrate that 1) the quantitative nuclear morphometry
provides valuable information to discriminate between normal and neoplastic population
of cells in Mytilus galloprovincialis HN; 2) the differences observed are statistically signifi-
cant; 3) the methods also allowed the discrimination of two different populations of cells in
the neoplastic samples according to disease severity; 4) the alterations in nuclear structure
appear to be closely related to alterations in ploidy, which are also typical of malignant
processes.
Quantitative measurements of nuclear features are a pre-requisite to assess physiologic and
pathologic responses in model organisms and to enable comparison of data in the accelerating
field of experimental animal research [83–84]. Although the observed population of neoplastic
cells according to disease progression seemed to be divided into distinct morphological sub-
types, the hypothesis of a consecutive developmental stages of a single cell line as hypothesised
in [13, 35] is also supported by the ploidy data presented here.
The high values of ploidy found here as well as in a previous study [34] have not been
reported in cancer of vertebrates. Perhaps such aberrant genomes are less compatible with cell
viability in higher organisms that require complex homeostatic control, although it has been
shown that polyploidy can be tolerated in some eukaryotes [85].
Further genomic investigations could better unravel the parental relationship between
A-Type and B-Type cells in HN of M. galloprovincialis; however, present data along with those
reported for HN in other species seems to suggest that HN in bivalves should be regarded as a
disease complex with multiple and different pathogenesis rather than a single entity. Taken
together, the results may provide the necessary quantitative baseline for reference in the study
of bivalve HN.
Supporting information
S1 Video File. video shows steps necessary to measure ploidy from Feulgen stained prepa-
rations.
(MP4)
Acknowledgments
The authors would like to thank Dr. Grazia Villari for expert technical assistance. The authors
also thank the reviewers for their valuable comments and effort in improving the MS. Collabo-
ration with Birmingham University was supported by “Progetto MODO-Animal Model
2014-Reti di Eccellenza POR Campania FSE 2007–2013”. Gabriel Landini acknowledges
support from the Engineering and Physical Sciences Research Council (UK) (Grant No. EP/
M023869/1, Novel context-based segmentation algorithms for intelligent microscopy).
Author Contributions
Conceptualization: FC GDV.
Data curation: GL FC.
Formal analysis: GL FC.
Funding acquisition: FC.
Nuclear morphometry and ploidy of normal and neoplastic haemocytes in mussels
PLOS ONE | DOI:10.1371/journal.pone.0173219 March 10, 2017 14 / 18

Investigation: FC GDV.
Methodology: GL FC.
Project administration: FC.
Resources: FC.
Software: GL.
Supervision: FC GDV GL.
Validation: FC GDV GL.
Visualization: FC GL.
Writing – original draft: FC.
Writing – review & editing: FC GL GDV.
References1. Bierhoff E, Appel K, Buettner R and Wardelmann E. Comparative morphometric analysis of primary ver-
sus recurrent basal cell carcinoma and of histological subtypes. Significance of morphometry of nuclei.
Anticancer Res. 2003; 23:2697–2700. PMID: 12894560
2. Kontak JA and Campbell SC. Prognostic factors in renal cell carcinoma. Urol Clin North Am. 2003;
30:467–480. PMID: 12953749
3. Li LX, Crotty KA, Palmer AA, Kril JJ, Scolyer RA, Thompson JF et al.,. Argyrophilic staining of nucleolar
organizer region count and morphometry of benign and malignant melanocytic lesions. 2003; Am J Der-
matopath. 25:190–197. PMID: 12775980
4. De Vico G and Maiolino P. Prognostic value of nuclear morphometry in feline mammary carcinomas. J
Comp Pathol. 1997; 117:99–105. PMID: 9352434
5. Roels SLMF, Van Daele AJ, Van Marck EA and Ducatelle RVA. DNA ploidy and nuclear morphometric
variables for the evaluation of melanocytic tumors in dogs and cats. Am J Vet Res. 2000; 61:1074–
1079. PMID: 10976739
6. Maiolino P, Restucci B, Papparella S and De Vico G. Nuclear morphometry in squamous cell carcino-
mas of canine skin. J Comp Pathol. 2002; 127: 114–117. PMID: 12354521
7. Strefezzi RDe F, Xavier G and Catao-Dias JL. Morphometry of canine cutaneous mast cell tumors. Vet
Pathol. 2003; 40: 268–275. doi: 10.1354/vp.40-3-268 PMID: 12724567
8. Maiolino P, Restucci B, Papparella S, Paciello O. and De Vico G. Correlation of Nuclear Morphometric
Features with Animal and Human World Health Organization International Histological Classifications
of Canine Spontaneous Seminomas. Vet Pathol. 2004; 41:608–611. doi: 10.1354/vp.41-6-608 PMID:
15557070
9. Farley CA. Probable neoplastic disease of the hematopoietic system in oysters, Crassostrea virginica
and Crassotrea gigas. Natl Cancer Inst Monogr.1969; 31:541–555. PMID: 5374694
10. Peters EC. Recent investigations on the disseminated sarcomas of marine bivalve molluscs. Am Fish
Soc Spec Publ. 1988. 18:74–92.
11. Elston RA, Moore JD, Brooks K. Disseminated neoplasia of bivalve molluscs. Rev Aquat Sci. 1992;
6:405–466.
12. Barber BJ, Neoplastic diseases of commercially important marine bivalves. Aquat Living Resour 2004;
17:449–466.
13. Carella F, Figueras A, Novoa B, De Vico G. Cytomorphology and PCNA expression pattern in bivalves
Mytilus galloprovincialis and Cerastoderma edule with haemic neoplasia. Dis Aquat Org. 2013; 105:81–
87. doi: 10.3354/dao02612 PMID: 23836773
14. De Vico G and Carella F. Argomenti di patologia comparata dei molluschi: aspetti ecologici e sanitari.
Loffredo editore2012; Naples.
15. Auffret M, Poder M. Sarcomatous lesion in the cockle Cerastoderma edule II. Electron microscopical
study. Aquaculture. 1986; 58:9–15.
Nuclear morphometry and ploidy of normal and neoplastic haemocytes in mussels
PLOS ONE | DOI:10.1371/journal.pone.0173219 March 10, 2017 15 / 18

16. Villalba A, Carballal MJ, Lopez C. Disseminated neoplasia and large foci indicating heavy haemocytic
infiltration in cockles Cerastoderma edule from Galicia (NW Spain). Dis Aquat Org. 2001; 46:213–216.
doi: 10.3354/dao046213 PMID: 11710555
17. Delaporte M, Synard S, Pariseau J, McKenna P, Tremblay R, Davidson J et al. Assessment of haemic
neoplasia in different soft shell clam Mya arenaria populations from eastern Canada by flow cytometry.
J Iinvert Pathol 2008; 98:190–197.
18. Reno PW, House M, Illingworth A. Flow cytometric and chromosome analysis of softshell clams, Mya
arenaria, with disseminated neoplasia. J Invertebr Pathol. 1994; 64:163–172.
19. Farley CA, Plutschak DL and Scott RF. Epizootiology and distribution of transmissible sarcoma in Mary-
land softshell clams, Mya arenaria, 1984–1988. J Environmen Health Perspect. 1991; 90:35–41.
20. Gardner GR, Yevich PP, Hurst P, Theyer P, Benyi S, Harshbarger JC, et al.,Germinomas and teratoid
siphon anomalies in softshell clams, Mya arenaria, environmentally exposed to herbicides. J Environ
Health Perspect. 1991; 90:43–51.
21. Van Beneden RJ, Gardner GR, Blake NJ, Blair DG. Implications for the presence of transforming genes
in gonadal tumours in two bivalve mollusc species. J Cancer Res. 1993; 53:2976–2979.
22. Romalde JL, Vilariño ML, Beaz R, Rodrıguez JM, Dıaz S, Villalba A, et al. Evidence of retroviral aetiol-
ogy for disseminated neoplasia in cockles (Cerestoderma edule). J Iinvert Pathol. 2007; 94:95–1001.
23. Sunila I. Viral transmission and tumor promotion of sarcoma in the softshell, Mya arenaria. In: Rosen-
field A., Kern F.G., Keller B.J. (Eds.), Invertebrate Neoplasia: Initiation and Promotion Mechanisms. U.
S. Department of Commerce, Woods Hole, MA, 1994; pp.11–13
24. Oprandy JJ, Chang PW, Pronovost AD, Cooper KR, Brown CW, Yates VJ. Isolation of a viral agent
causing hematopoietic neoplasia in the soft-shell clam, Mya arenaria. J Invert Pathol. 1981; 38:45–51.
25. McLaughlin SM. Transmission studies of sarcoma in the softshell, Mya arenaria. In: Rosenfield A., Kern
F.G., Keller B.J. (Eds.), Invertebrate Neoplasia: Initiation and Promotion Mechanisms. U.S. Depart-
ment of Commerce, Woods Hole, MA, 1994;pp. 21–22.
26. Metzger MJ, Reinisch C, Sherry J and Goff SP. Horizontal transmission of clonal cancer cells causes
leukemia in soft-shell clams. Cell. 2015; 161:255–263. doi: 10.1016/j.cell.2015.02.042 PMID: 25860608
27. De Vico G. and Carella F. Tumors in invertebrates: molluscs as an emerging animal model for human
cancer. Ivert Surv J. 2015; 12:19–21.
28. Ciocan C, Sunila I. Disseminated neoplasia in blue mussels, Mytilus galloprovincialis, from the Black
Sea, Romania. Mar Pollut Bull. 2005; 50:1335–1339. doi: 10.1016/j.marpolbul.2005.04.042 PMID:
15946706
29. Tiscar PG, Zizzo N, Compagnucci R, Iaffaldano D. Dati preliminari sulla patologia infettiva ed infestiva
dei molluschi eduli lamellibranchi allevati o raccolti sui litorali Pugliesi. Atti Soc Ital Sci Vet. 1990;
44:709–712.
30. Zizzo N, Tiscar PG, Troncone A. Neoplasia in mitili (Mytilus galloprovincialis). Boll Soc Ital Patol Ittica.
1991; 7:19–21.
31. Figueras AJ, Jardon CF, Caldas JR. Diseases and parasites of rafted mussels (Mytilus galloprovincialis
Lmk): preliminary results. Aquaculture. 1991a. 99:17–33.
32. Figueras AJ, Jardon CF, Caldas JR. Diseases and parasites of mussels (Mytilus edulis Linnaeus, 1758)
from two sites on the east coast of the United States. J Shellfish Res. 1991b; 10:84–94.
33. Green M and Alderman DJ. Neoplasia in Mytilus edulis L. from United Kingdom waters. Aquaculture.
1983; 30:1–10.
34. Lowe DM and Moore MN. Cytology and quantitative cytochemistry of a proliferative atypical haemocytic
condition in Mytilus edulis. J Natl Cancer Inst. 1978; 60:1455–1459. PMID: 650708
35. Dimitriadis VK and Koukouzika N. Effect of sampling procedures, transportation stress and laboratory
maintenance on the structure and function of the digestive gland epithelium of the mussel Mytilus gallo-
provincialis. Mar Biol. 2003; 142:915–924.
36. Bocking A, Giroud F, Reith A. Consensus report of the ESACP task force on standardization of diagnos-
tic DNA image cytometry. Anal Cell Pathol. 1995; 8:67–74. PMID: 7734413
37. Hardie DC, Gregory TR, Hebert PDN. From pixels to picograms: a beginners’ guide to genome quantifi-
cation by Feulgen image analysis densitometry. J Histochem Cytochem. 2002; 50:735–749. doi: 10.
1177/002215540205000601 PMID: 12019291
38. Galimany E, Sunila I. Several cases of disseminated neoplasia in mussels Mytilus edulis (L.) in Western
Long Island Sound. J Shellfish Res. 2008; 27:1201–1207.
39. Landini G. How to correct background illumination in brightfield microscopy.2006. Available: http://
imagejdocu.tudor.lu/doku.php?id=howto:working:how_to_correct_background_illumination_in_
brightfield_microscopy
Nuclear morphometry and ploidy of normal and neoplastic haemocytes in mussels
PLOS ONE | DOI:10.1371/journal.pone.0173219 March 10, 2017 16 / 18

40. Rasband WS, 1997–2016. ImageJ. U. S. National Institutes of Health, Bethesda, MD. Available: http://
imagej.nih.gov/ij/.
41. Otsu N. A threshold selection method from gray-level histograms in IEEE Trans Sys Man Cyber. 1979;
9: 62–66.
42. Landini G. Advanced shape analysis with ImageJ. Proceedings of the Second ImageJ user and devel-
oper Conference, Luxembourg, 6–7 November, 2008. p116-121. ISBN 2-919941-06-2.
43. Lobo J, See Y-S, Biggs M, Pandit A. An insight into morphometric descriptors of cell shape that pertain
to regenerative medicine. J Tissue Eng Regen Med. 2015.
44. Bignold LP, Coghlan BLD, Jersmann HPA. Cancer morphology, carcinogenesis and genetic instability:
a background. 2006; Vol. 96 of the series Experientia Supplementum pp 1–24.
45. Landini G and Othman IE. Architectural analysis of oral cancer, dysplastic, and normal epithelia. Cytom-
etry Part A. 2004; 61: 45–55.
46. Sorensen FB. Quantitative analysis of nuclear size for objective malignancy grading: a review with
emphasis on new, unbiased stereological methods. Lab Investig. 1992; 66:4–23. PMID: 1731148
47. Serra J. Image Analysis and Mathematical Morphology. 1982; Academic Press, London.
48. Weibel ER. Stereological Methods, 1979; in Vol. 1: Practical Methods for Biological Morphometry. Aca-
demic Press, London.
49. Russ JC. The Image Processing Handbook, 3rd edn. CRC Press, Boca Raton, 1999; FL.
50. Puech M and GIiroud F. Standardisation of DNA quantitation by image analysis: quality control of instru-
mentation. Cytometry. 1999; 36:11–17. PMID: 10331622
51. Marcos B, Gonzalez–Ageitos A, Echezarreta G, Sanz C, Garcıa MJ, Rivas C. Correlacion de las tecni-
cas de citometrıa de flujo y estatica; su aplicacion en el estudio de los linfomas anaplasicos. Sangre.
1998; 43:25–29.
52. Alanen KA, Lintu M, Joensuu H. Image cytometry of breast carcinomas that are DNA diploid by flow
cytometry: time to revise the concept of DNA diploidy? Anal Quant Cytol Histol.1998; 20:178–186.
PMID: 9642444
53. Thunnissen FBJM, Ellis IO, Jutting U. Quality assurance in DNA image analysis on diploid cells. Cytom-
etry. 1997; 27:21–25. PMID: 9000581
54. Thunnissen FBJM, Ellis IO, Jutting U. Interlaboratory comparison of DNA image analysis. Anal Cell
Pathol. 1996; 12:13–24. PMID: 8933906
55. Reeder JE, Cox C, Wheeless LL, Flint A, Liebert M, Grossman HB. Variability of DNA analysis by image
cytometry. Cytometry. 1997; 28:176–180. PMID: 9181309
56. Yamamoto T, Horiguchi H, Kamma H, Noro M, Ogata T, Inage Y, et al., Comparative DNA analysis by
image cytometry and flow cytometry in non-small cell lung cancer. Japan J Cancer Res. 1994;
85:1171–1177.
57. Bertino B, Knape WA, Pytlinska M, Strauss K, Hammou JC. A comparative study of DNA content as
measured by flow cytometry and image analysis in 1864 specimens. Anal Cell Pathol. 1994; 6:377–
394. PMID: 8060892
58. Borgiani L, Cogorno P, Toso F, Gallo L, Buccaran G, Rovida R, et al.,Comparative DNA analysis of
breast cancer by flow cytometry and image analysis. Pathologica.1994; 86:356–359. PMID: 7535909
59. Fischler DF, Wongbunnate S, Johnston DA, Katz RL. DNA content by image analysis: an accurate dis-
criminator of malignancy in pericardial effusions. Anal Quant Cytol Histol. 1994; 16:167–173. PMID:
7916844
60. Pindur A, Chakraborty S, Welch DG, Wheeler TM. DNA ploidy measurements in prostate cancer: differ-
ences between image analysis and flow cytometry and clinical implications. Prostate. 1994; 25:189–
198. PMID: 8084836
61. Kullman B and Teterin W Estimation of fungal genome size: comparison of image cytometry and photo-
metric cytometry. Folia Cryptog Estonica. 2006; 42: 43–56.
62. Gregory TR. Genome size estimates for two important freshwater molluscs, the zebra mussel (Dreis-
sena polymorpha) and the schistosomiasis vector snail (Biomphalaria glabrata) Genome. 2003;
46:841–844. doi: 10.1139/g03-069 PMID: 14608401
63. Hillman RE. Incidence of neoplasia in west coast bivalves collected during phases 1, 2 and 3 of the Mus-
sel Watch Program. 1990; Mussel Watch Conference, Sequim, WA.
64. Nowell PC. The clonal evolution of tumor cell populations. Science. 1976; 194: 23–28. PMID: 959840
65. Edge SB and Compton CC. The American Joint Committee on Cancer: the 7th Edition of the AJCC
Cancer Staging Manual and the Future of TNM. Ann Surg Oncol. 2010; 17:1471–1474. doi: 10.1245/
s10434-010-0985-4 PMID: 20180029
Nuclear morphometry and ploidy of normal and neoplastic haemocytes in mussels
PLOS ONE | DOI:10.1371/journal.pone.0173219 March 10, 2017 17 / 18

66. Duesberg P, Rausch C, Rasnick D, and Hehlmann R. Genetic instability of cancer cells is proportional
to their degree of aneuploidy. Proc Natl Acad Sci USA. Cell Biol. 1998; 95(23): 13692–13697.
67. Almendro V, Marusyk A, and Polyak K. Cellular Heterogeneity and Molecular Evolution in Cancer. Annu
Rev Pathol. 2013;Mech. Dis. 8:277–302. doi: 10.1146/annurev-pathol-020712-163923 PMID:
23092187
68. Micalizzi DS, Farabaugh SM, Ford HL. Epithelial-Mesenchymal Transition in Cancer: Parallels Between
Normal Development and Tumor Progression. J Mammary Gland Biol Neoplasia. 2010; 15:117–134.
doi: 10.1007/s10911-010-9178-9 PMID: 20490631
69. Moore JD, Elston RA, Drum AS, Wilkinson MT. Alternate pathogenesis of systemic neoplasia in bivalve
mollusc Mytilus. J Invert Pathol. 1991; 58:231–243.
70. Metzger MJ,Villalba A, Carballal MJ, Iglesias D, Sherry J, Reinisch C, et al., Widespread transmission
of independent cancer lineages within multiple bivalve species. Nature. 2016; 534:705–709. doi: 10.
1038/nature18599 PMID: 27338791
71. Vassilenko E and Baldwin S A. Using flow cytometry to detect haemic neoplasia in mussels (Mytilus
trossulus) from the Pacific Coast of Southern British Columbia, Canada.J Invert Pathol. 2014; 117: 68–
72.
72. Nitin A, Xie Y, Patten FW, Reeves AP, and Seibel EJ. DNA Ploidy Measure of Feulgen-Stained Cancer
Cells using Three-Dimensional Image Cytometry. Health Innovations and Point-of-Care Technologies
Conference Seattle, Washington USA, October 8–10, 2014. pp. 6–9.
73. Ganem NJ, Storchova Z, Pellman D. Tetraploidy, aneuploidy and cancer. Curr Opin Genet Dev. 2007;
17:157–162. doi: 10.1016/j.gde.2007.02.011 PMID: 17324569
74. Giam M and Rancati G. Aneuploidy and chromosomal instability in cancer: a jackpot to chaos. Cell Divi-
sion. 2015; 10:3. doi: 10.1186/s13008-015-0009-7 PMID: 26015801
75. Dixon DR, Jones IM, Harrison FL. Cytogenic evidence of inducible processes linked with metabolism of
a xenobiotic chemical in adult and larval Mytilus edulis. Sci Total Environ. 1985; 46:1–8.
76. Brunetti R, Majone F, Gola I, Beltrame C. The micronucleus test: examples of application to marine
ecology. Mar Ecol Progr Ser. 1988; 44:65–68.
77. Wriseberg MN, Bilbo CM, Spliid H. Induction of micronuclei in haemocytes of Mytilus edulis and statisti-
cal analysis. Ecotoxicol Environ Safety. 1992; 23:191–205. PMID: 1374326
78. Vukmirovic M, Bihari N, Zahn RK, Muller WEG, Batel R. DNA damage in marine mussel Mytilus gallo-
provincialis as a biomarker of environmental contamination. Mar Ecol Progr Ser. 1994; 109:165–171.
79. Nacci D, Nelson S, Nelson W, Jackim E. Application of the DNA alkaline unwinding assay to detect
DNA strand breaks in marine bivalves. Mar Environ Res. 1992; 33: 83–100.
80. Bihari N, Batel R, Zahn RK. Flow cytometry in marine environmental research. Periodic Biol. 1999;
101:151–155.
81. Micic M, Bihari N, Labura Z, Muller WEG, Batel R, 2001. Induction of apoptosis in the blue mussel Myti-
lus galloprovincialis by tri-N-butyltin chloride. Aquat Toxicol. 55:61–73. PMID: 11551622
82. Insua A, Thiriot-Quievreux C. Karyotypes of Ceratoderma edule, Venerupis pullastra and Venerupis
rhomboides (Bivalvia, Veneroida). Aquat Living Resour. 1992; 5:1–8.
83. Sharma S, Gao P and Steele VE. Quantitative Morphometry of Respiratory Tract Epithelial Cells as a
Tool for Testing Chemo-preventive Agent Efficacy. Anticancer Res. 2010; 30: 737–742. PMID:
20392991
84. Fickert P, Pollheimer MJ, Beuers U, Lackner C, Hirschfield G, Housset C, et al.,Characterization of ani-
mal models for primary sclerosing cholangitis (PSC). J Hepatol. 2014; 60: 1290–1303. doi: 10.1016/j.
jhep.2014.02.006 PMID: 24560657
85. Otto SP. The evolutionary consequences of polyploidy. Cell. 2007; 131:452–462. doi: 10.1016/j.cell.
2007.10.022 PMID: 17981114
Nuclear morphometry and ploidy of normal and neoplastic haemocytes in mussels
PLOS ONE | DOI:10.1371/journal.pone.0173219 March 10, 2017 18 / 18