Embed Size (px)
Citation preview

D(
MAa
b
h
����
a
ARRA
1
fnsorgtustd
0h
Nuclear Engineering and Design 250 (2012) 116– 124
Contents lists available at SciVerse ScienceDirect
Nuclear Engineering and Design
jo u r n al hom epage : www.elsev ier .com/ locate /nucengdes
uctility and performance assessment of high strength self compacting concreteHSSCC) deep beams: An experimental investigation
ohammad Mohammadhassania,∗, Mohd Zamin Jumaata, Mohammed Jameela, Hamid Badieeb,rul M.S. Arumugama
Department of Civil Engineering, University of Malaya, Kuala Lumpur, MalaysiaDepartment of Civil Engineering, University of Kerman, Iran
i g h l i g h t s
Ductility decreased with increase in tensile reinforcement ratio.The width of the load point and the support point influences premature failure.Load–deflection relationship is linear till 85% of the ultimate load.The absorbed energy increases with the increase of tensile reinforcement ratios.
r t i c l e i n f o
rticle history:eceived 29 July 2011eceived in revised form 1 May 2012ccepted 3 May 2012
a b s t r a c t
The behavior of deep beams is significantly different from that of normal beams. Because of their propor-tions, deep beams are likely to have strength controlled by shear. This paper discusses the results of eightsimply supported high strength self compacting concrete (HSSCC) deep beams having variation in ratioof web reinforcement and tensile reinforcement. The deflection at two points along the beam length,
web strains, tensile bars strains and the strain at concrete surface are recorded. The results show thatthe strain distribution at the section height of mid span is nonlinear. Ductility decreased with increasein tensile reinforcement ratio. The effect of width of load point and the support point is more importantthan the effect of tensile reinforcement ratio in preventing premature failure. Load–deflection graphsconfirm linear relationship up to 85% of the ultimate load for HSSCC over-reinforcement web sections.The absorbed energy index increases with the increase in tensile reinforcement ratios.. Introduction
Identifying structural behaviors has become a major challengeor design engineers especially with the advent of innovative tech-ologies in the field of materials and construction; this is especiallyo in high seismic hazard areas. The discovery of one such technol-gy is the deep beam which is currently a subject of considerableelevance in developing countries that are experiencing rapidrowth in the construction industry. Deep beam has various struc-ural applications, e.g. transfer girder in tall building, floor slabsnder horizontal loads, shear walls, pile caps, foundation, offshoretructure, nuclear power plants and many more. The main objec-
ive of this study is to investigate the performance (i.e. strength anductility) of simply supported HSSCC deep beams.∗ Corresponding author. Tel.: +989133420110; fax: +60 37 9675218.E-mail address: [email protected] (M. Mohammadhassani).
029-5493/$ – see front matter © 2012 Elsevier B.V. All rights reserved.ttp://dx.doi.org/10.1016/j.nucengdes.2012.05.005
© 2012 Elsevier B.V. All rights reserved.
Deep beams are defined as beams having a span-to-depthratio, ln/h, of about 5 or less, or having a shear span less thanabout twice the depth. The behavior of deep beams is signifi-cantly different from that of normal beams. Deep beams behavetwo-dimensional rather than one-dimensional due to their geo-metric proportion. The design of these structural elements is notadequately covered in existing codes of practice; For example,the current British Code (BS 8110, 1985) clearly states that ‘fordesign of deep beams, reference should be made to specialist lit-erature’. The major codes and manuals that discuss on deep beambehaviors are the ACI (American Concrete Institute Code, 1986);the Eurocode 2 (1984); CSA (Canadian Standards Association,1984) and CIRIA (Construction Industry Research and InformationAssociation Guide No. 2, 1977); these are all based on empiricalinvestigation. There is no manual and code with exact theoretical
study for the design of deep beams.The behavior of these structural elements is imprecise and dueto their high stiffness, the deflection at ultimate state is insignif-icant. Therefore, this study aims to investigate the need for safe

Engineering and Design 250 (2012) 116– 124 117
dDsrT(ft(pfdtawatadcaiv
tSee1svlTb
tsim1anaaiou(lbfwtsotatprttosh0
Table 1High strength self-compacting concrete mix design.
Characteristic cube strength 75 MPaAggregate type Crushed granite and natural sandCement type OPCSlump of concrete >650 mmCoarse aggregate 553 kg/m3
Fine aggregate 887 kg/m3
Water–cement ratio 0.27Water–binder ratio 0.25
3
Based on this table, except for the case of ˚9 which is Grade 40steel, all other bars are closer to Grade 75 steel.
Table 2Specifications of the tested beams.
Beam f′c (MPa) � (%) As (cm2)
B1 91.50 0.219 1.91B2 91.50 0.269 2.36B3 91.10 0.410 3.83B4 93.72 0.604 5.58
M. Mohammadhassani et al. / Nuclear
esigns and determine a ductility coefficient of HSSCC deep beams.uctility is defined as the ability of a material or member to
ustain deformation beyond its elastic limit while maintaining aeasonable load-carrying capacity before total collapse or failure.he predominant failure mode for deep beams is shear failureMohammadhassani et al., 2011). The probable effective variablesor ductility of deep beams are included as reinforcement ratio forension steel (�) in percentage, compressive strength of concretef′c), yield strength of steel reinforcement (fy), the load and supportoint width and web reinforcement ratio (�s). The tensile rein-orcement ratio is potentially an important factor that affects theuctility of the concrete beam section. There are few studies andest data on the ductility of over-reinforced HSC beams (Maghsoudind Shari, 2009; Ho et al., 2010). Based on these test results, itas evident that there is a need to revise the definition of bal-
nce design for HSC section with modification of stress block athe compression zone of a concrete section. Due to more steepernd parabolic shape of the stress block in the compression zone, theesign equations are affected more significantly by the shape of theompression block. This complexity of strain distribution is morepparent when the tensile bars used are more than maximum lim-ts suggested by the design codes as it results in neutral axis depthariation.
The design of deep beam structural elements is not covered inhe existing codes. Experimental studies since 1965 (De Paiva andiess, 1965; Chemrouk and Kong, 2004; Chemrouk, 2009; Yangt al., 2007; Ashour and Yang, 2008) had helped develop somempirical methods. However, test data on HSC deep beams above00 MPa are rather limited and are insufficient in determining thetrain distribution in the section height for the investigation of cur-ature ductility. The strain distribution is nonlinear along beamength and across the section height of the element (Ray, 1985).hus the rectangular stress block assumption is not valid for deepeam sections.
Horizontal and vertical web reinforcements are important inhe behavior of deep beams. Web reinforcement increases thehear capacity of the beams. The key role of web reinforcements to restrict the widening of inclined cracks and thus increase or
aintain the shear friction, dowel action, and arch action (ASCE,973). Mansur et al. (1997) reported that the ultimate strengthnd ductility are enhanced by using stirrups for over-reinforcedormal members. However, further research is needed on themount of stirrup required for over-reinforced HSC sections atreas near the supports to achieve the ultimate bending capac-ty (Mohammadhassani, 2011). The effect of web reinforcementsn the ductility of deep beams is that it prevents premature fail-re and widening of cracks. A study by Leonhardt and Walther1966) concluded that for beams with clear span to depth ratioess than two, vertical web reinforcement was of no consequenceecause beams with this clear span to depth ratio range alwaysails by crushing under the bearing area. Many experimental studiesere performed by Kong (2003) on reinforced concrete deep beams
o determine the influences of web reinforcement on the sheartrength of deep beams. These studies stated that the effectivenessf web reinforcement depend on the geometric and loading proper-ies of tested deep beams in terms of the length to depth ratio (l/d)nd shear span to depth ratio (a/d). For low l/d and a/d ratios (lesshan 1.5 and 0.35, respectively) only horizontal web reinforcementlaced close to the bottom was effective and for larger l/d and a/datios, vertical web reinforcement was more effective in increasinghe shear strength. Similarly, Smith and Vantsiotis (1982) studiedhe effect of web reinforcement (a/d) ratio and concrete strength
n the strength and behavior of deep beams. In their research, thehear span to depth ratios (a/d) varied from 0.77 to 2.01. Also theorizontal and vertical web reinforcement ratios varied from 0% to.91% and from 0% to 1.25%, respectively.Super plasticizer 46.0 kg/mSilica fume–cement ratio 0.1
The most likely application of concrete with compressivestrengths more than 69 MPa is a thick containment walls(90–120 cm) and in the roof of pressurized water reactor. Since1992 Landers, 1994 Northridge, 1995 Kobe and 2011 Fukushimaearthquakes, the importance of safe design for these sensitive struc-tures and ductility design issues have been much emphasized.Although the design procedure for concrete structures subjectedto impulse and impact loads, is provided by the American ConcreteInstitute (ACI-349 Code), there is no experimental test data on theductility of deep beam sections. It is also necessary to study theserviceability and energy absorption for the application of deepbeams in seismic hazard area. The existing design codes have beendeveloped from experimental data with concrete strength less than40 MPa, an average overall depth of 340 mm, and an average rein-forcement ratio of 2.22%. Therefore, it is essential to investigate thevalidity of these codes before applying it to concrete sections thatare beyond these specification ranges especially in deep beams.This study will consider the effect of probable parameters that mayinfluence the behavior and ductility of HSSCC deep beams.
2. Material and methodology
Eight HSSCC deep beams have been casted. HSSCC was chosenbecause of its application and economic justification. Self com-pacting concrete is a non-segregating concrete that easily flowsinto the mold. For this purpose local aggregate with maximum20 mm diameters, Ordinary Portland Cement, natural river sand,silica fume and super plasticizer were used. The concrete mix wasby weight with a constant water cement ratio of 0.27 for all beams.The concrete mix design is given in Table 1.
Table 2 presents the properties of hardened cementious mate-rials and the tensile reinforcement ratio for each beam.
In Table 2, � is the tensile reinforcement ratio, f ′c is concrete
compressive strength of cube samples at loading age, and As is thecorresponding area of tensile bar in each beam. The mechanicalspecifications of the bars used are presented in Table 3.
fy and fu indicate the yield and the ultimate stress of bars, respec-tively. Tension tests are performed at the University of Malaya.
B5 79.10 0.809 7.60B6 87.50 0.938 8.54B7 82.24 1.050 9.64B8 97.20 1.260 11.65
118 M. Mohammadhassani et al. / Nuclear Engineering and Design 250 (2012) 116– 124
Fig. 1. Details of t
Table 3Mechanical specification of bars used.
Diameters of used bars (mm) fy (MPa) fu (MPa)
˚9 353.0 446.0˚10 614.4 666.0˚12 621.6 678.4˚16 566.3 656.0
Table 4The bar schedule specification for tested beams.
Beam Tensile bar Vertical web stirrup Horizontal web stirrup
B1 3Ø9 Ø9@10 cm c/c Ø9@15 cm c/cB2 3Ø10 Ø9@10 cm c/c Ø9@15 cm c/cB3 2Ø10 + 2Ø12 Ø9@10 cm c/c Ø9@15 cm c/cB4 2Ø10 + 2Ø16 Ø9@10 cm c/c Ø[email protected] cm c/cB5 2Ø10 + 3Ø16 Ø10@10 cm c/c Ø10@8 cm c/cB6 1Ø9 + 4Ø16 Ø10@10 cm c/c Ø10@8 cm c/c
2
ia
B7 2Ø10 + 4Ø16 Ø10@10 cm c/c Ø10@8 cm c/cB8 2Ø10 + 5Ø16 Ø10@10 cm c/c Ø10@8 cm c/c
.1. Beam details
Details of the tested HSSCC deep beams are schematically shownn Fig. 1. All tested specimens were 500 mm depth, 200 mm width
nd 1500 mm length. Table 4 expresses the beam details.The adopted arrangement is as shown in Fig. 2.
Fig. 2. Details of testing arrangement.
ested beam.
The beams were leveled and placed on two steel cylinders with5 in. diameters. The load was applied at 20 kN intervals to the mid-point of the steel beam arrangement using a hydraulic jack. Theapplied load then acted on the deep beam with similar shear spanfrom the two end points. At each stage of loading, the strains onboth surfaces and the deflections at two points along the beamlength were measured. On the assumption that flexure cracks prop-agate from the base of beam till mid-height of the beam section,Demec gauges are used because it provide resistance to cracks,strain gauges are used only from mid-height to the extreme com-pression fiber. Fig. 2 shows the locations of both these gauge types.The amounts of deflections and strains were obtained just beforereaching the failure at each loading stage.
3. Results and discussions
In case of deep beams, shear deformation dominates and henceshear failure is the probable mode of failure. Shear failures are gen-erally considered as undesirable failures. It reduces the strength ofstructural elements below the flexural capacity and also consider-ably reduces the ductility.
Ductility is a desirable structural property because it allowsstress redistribution and provides an early warning prior to brittlefailure. This is an important fact to consider due to the importanceof serviceability limitation in the lifetime of specified buildings.Fig. 3 shows the calculation of ductility, it is the area below theload–deflection or moment-curvature graphs.
Ductility means the failure that is initiated by yielding ofsteel reinforcement and subsequent extensive deformation with-
out any considerable loss of load bearing capacity. Depending onthe type of structural element and the type of load applied, defor-mation measure for ductility may be either of strain, curvature,Fig. 3. Definition of ductility.

M. Mohammadhassani et al. / Nuclear Engineering and Design 250 (2012) 116– 124 119
Fs
dt
3
i
�
wst
dhrfasa
iosard
bdstdndpttcnmh
icc
Table 5Strain distribution at the mid span height of beam at yield and ultimate loading.
Beam εcy εcu ϕy ϕu � = (ϕu/ϕy)
B1 0.000283 0.000607 0.00498 0.0104 2.09B2 0.000793 0.002172 0.00857 0.0182 2.12B3 – 0.001074 – – –B4 – 0.000575 – – –B5 – 0.000406 – – –
ig. 4. Yield curvature (ϕy) and ultimate destructive curvature (ϕuf) in bendingection.
isplacement or rotation. Common methods in measuring the duc-ility are curvature and displacement indexes.
.1. Ductility measurement by curvature method
In reinforced concrete beams, curvature ductility index methods preferred. This index can be expressed in the form of (��).
� = � = ϕuϕy
(1)
here �u is the ultimate curvature when the concrete compressiontrain reaches a specified limit and �y is the curvature amount whenhe tension reinforcement first reaches its yield strength.
As stated in the literature review in Section 1, deep beamesign does not conform to the Bernoulli assumptions. In Bernoulliypothesis, it is assumed that a normal cross-sectional planeemains planar when the beam deforms. Bernoulli’s hypothesisacilitates the flexural design of reinforced concrete structures byllowing a linear strain distribution for all loading stages. Fig. 4hows the overall template of strain distribution at the mid span of
normal beam section based on the Bernoulli assumption.For study about curvature ductility index in tested deep beams
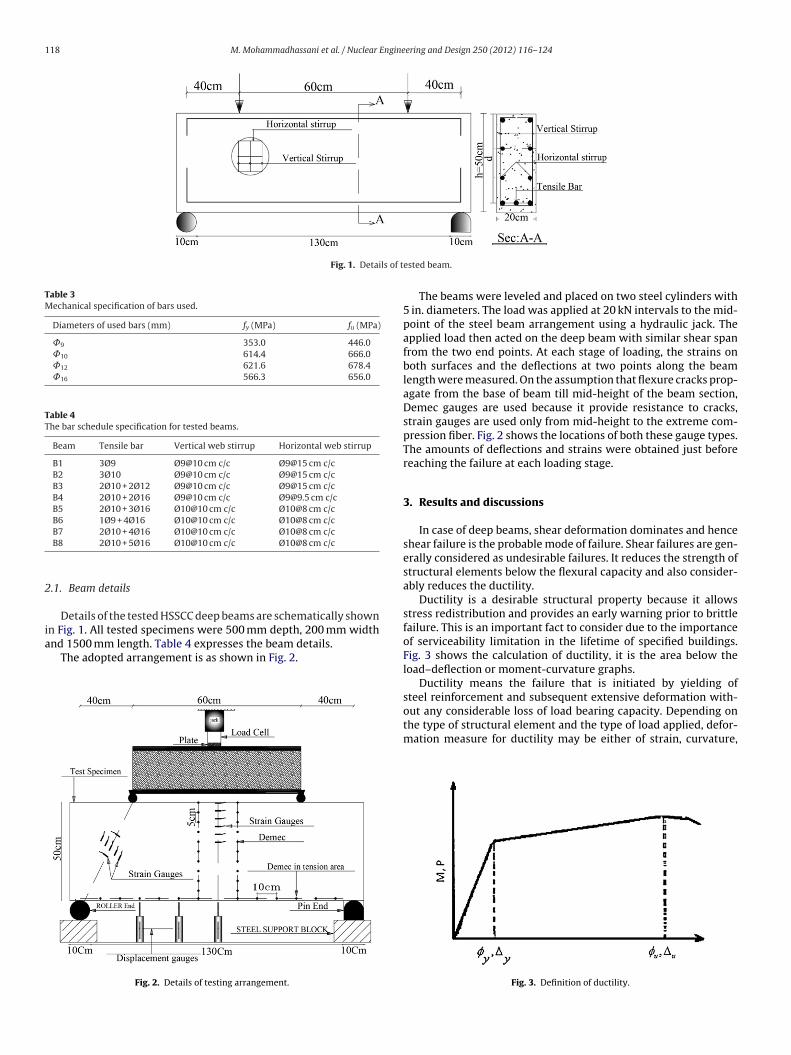
t is necessary to point out the strain distribution along the heightf bending zone at mid span. Thus strain was measured at the midpan on the vertical face along the beam length (refer to Fig. 2). Thisllowed the measuring of beam curvature in the constant momentegions. Fig. 5 shows strain distribution at the mid span of beamuring different loading stages.
The final loads in B3, B4 and B5 are considered as ultimate load,ecause all these three beams failed before yielding of tensile barue to the crushing of concrete at support points. The beams in Fig. 5how non-linear strain distribution. This is due to shear deforma-ion that is insignificant for normal beam but is very significant foreep beams. As a result, the strain block in deep beams becomeson-linear even in the elastic phase. This reiterates that deep beamso not conform to the common hypothesis for normal beams thatlane sections remain planar after bending. Fig. 5 also shows thathe strain of tensile bars in the tension zone is more significant thanhe strain in compression zone. At the ultimate state of loading, theompressive strain distribution in concrete no longer follows theormal beam’s parabolic shape or intensity. The yielding and ulti-ate strains in the compression and tension zones at the mid span
eight of the beam length are presented in Table 5.
In this table, εcu represents the experimental ultimate strainsn HSSCC deep beams at the extreme compression fiber over theonstant moment region. εcy is the experimental finding of con-rete strain at the extreme compression fiber corresponding to the
B6 – 0.000696 – – –B7 0.001105 0.002254 0.00891 0.022 2.47B8 0.001885 0.001963 0.0108 0.012 1.11
yielding of tensile bar, � represents the curvature ductility index;ϕy and ϕu are yielding and ultimate curvatures calculated from geo-metrical proportions (refer to Fig. 4). Eq. (2) presents the ductilitycurvature.
� = εc + εs
d(rad/m) (2)
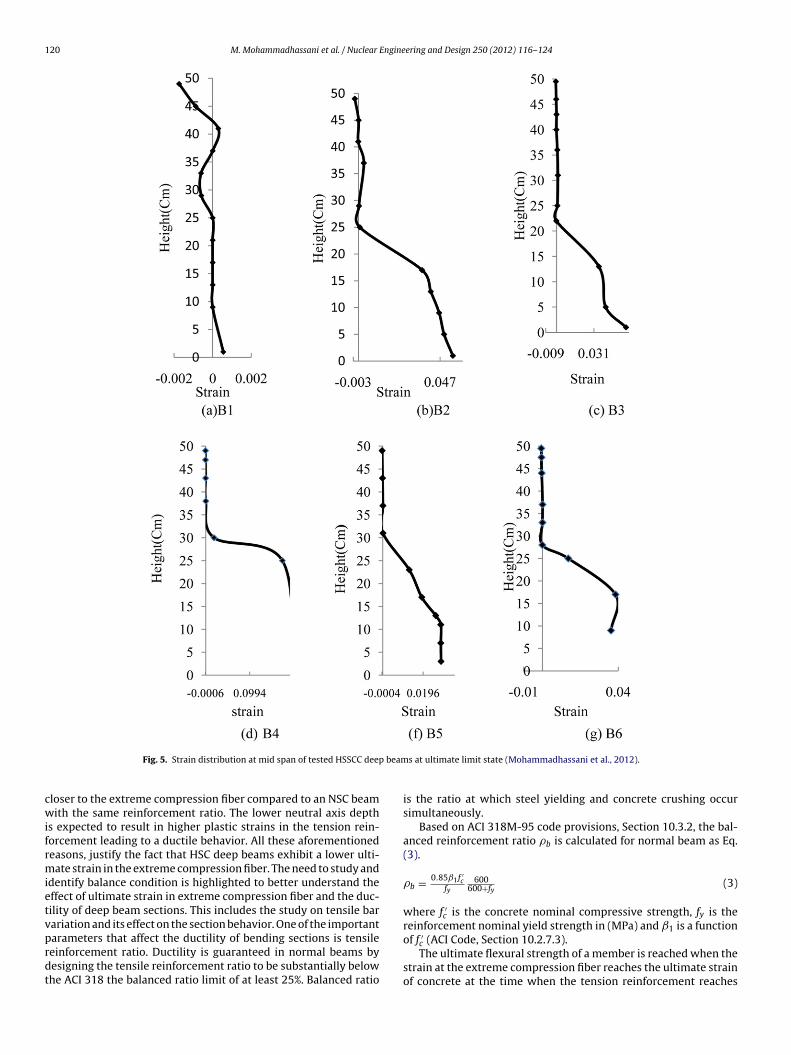
There was no ultimate and yield strain data for B3, B4, B5 and B6due to localized concrete crushing at the load and support pointsprior to yielding of tensile bars. Fig. 6 shows the failure of beam B4 asa sample of the aforementioned localized concrete crushing at thesupport and loading points prior to tensile bar yielding. This crush-ing of concrete before the yield of steel is defined as a prematurefailure.
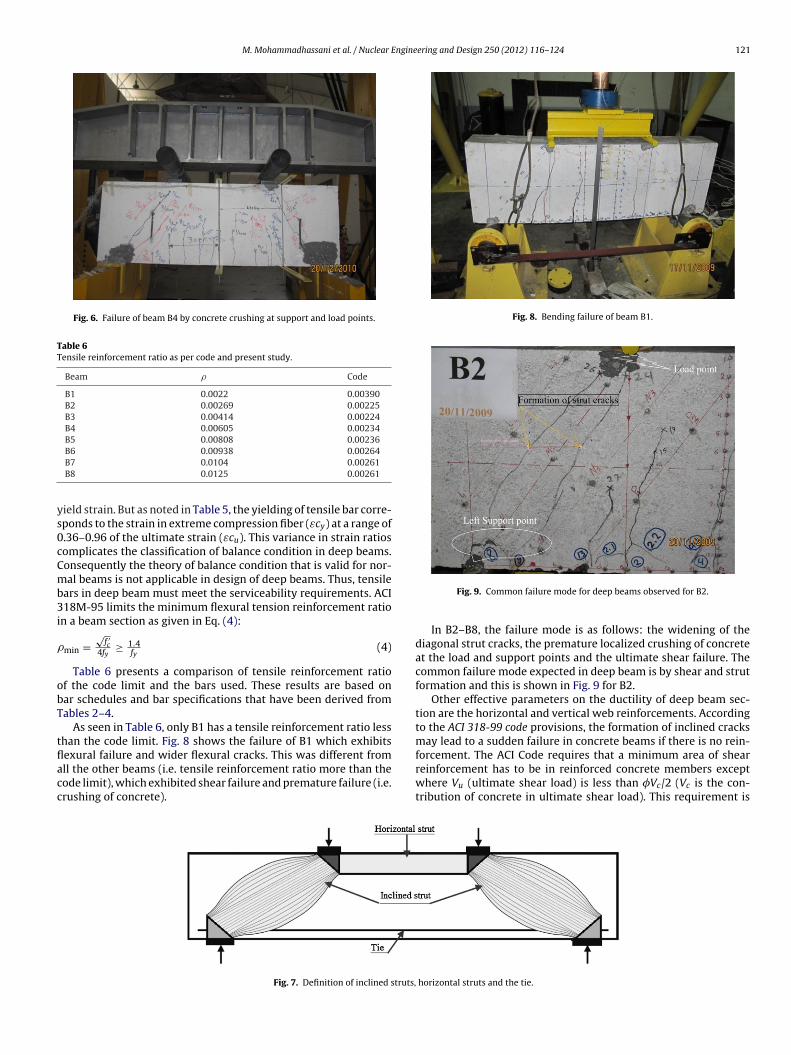
The beam fails prematurely because the applied load causes highconcentrated stress at support and load points. Based on the PCAmanual (Portland Cement Association, 1946), the stress curves atmid span are optimized for support widths of 1/5, 1/10 or 1/20of the span (center to center of the supports). Support widths areimportant because they affect the failure mode and the deflectionamount (Mohammadhassani et al., 2011). In this present study, thesupport and loading point widths were less than L/26 for beamsB1–B5. It was doubled to almost L/12 for B6–B8 to increase theirload bearing capacity in order to prevent localized concrete failure.Table 5 indicates the ultimate strain in extreme compression fiberat pure bending zone of HSSCC tested deep beam sections. All beamsexcept B2 and B7 conform to CSA94 provisions (Canadian StandardAssociation, 1994); B2 and B7 are slightly above the CSA94 limitof 0.002. This is probably due to heavy reinforcement used in thisexperimental work. These strain measurements that were taken inhorizontal struts are similar to the finding of Collins and Mitchell(1986) for strain measurements taken in the inclined struts. Fig. 7shows the locations of inclined struts, horizontal struts and the tie.
The fundamentals of CSA code for design of deep beams and cor-bels are based on the work of Collins and Mitchell (1986). Based ontheir findings, the cracked concrete behaves as a separate materialand the compressive strength of concrete in deep beams is reduceddue to strain-softening. The ultimate strain of concrete at extremecompression fiber has a significant effect on the ductility index andthe reinforcement limits of flexural members. ACI 441R-96 indi-cates that the strain limit of 0.003 is acceptable for both HSC andNSC normal beams; however, this is not applicable for HSC deepbeams. For deep beams, design guide lines are briefly mentionedin the CSA design code. The difference in maximum compressionstrain in extreme compression fiber of normal and deep beamsis due to size effect and load transferring mechanism. Investiga-tions by Van Mier (1986) on plain concrete prisms of 51, 102, and203 mm heights showed the scale effect and size dependency onthe ultimate concrete strain. Based on this study, the size effect ofsection height is explained by the localized damage phenomenonduring the beam failure and this prevents the beam from reaching
its ultimate load.The other reason was the concrete strength. In a HSC beam sec-tion, a shallower compressive stress block is required to equilibratethe tension zone forces. Therefore, the neutral axis in a HSC beam is
120 M. Mohammadhassani et al. / Nuclear Engineering and Design 250 (2012) 116– 124
beam
cwifrmietvprdt
Fig. 5. Strain distribution at mid span of tested HSSCC deep
loser to the extreme compression fiber compared to an NSC beamith the same reinforcement ratio. The lower neutral axis depth
s expected to result in higher plastic strains in the tension rein-orcement leading to a ductile behavior. All these aforementionedeasons, justify the fact that HSC deep beams exhibit a lower ulti-ate strain in the extreme compression fiber. The need to study and
dentify balance condition is highlighted to better understand theffect of ultimate strain in extreme compression fiber and the duc-ility of deep beam sections. This includes the study on tensile barariation and its effect on the section behavior. One of the important
arameters that affect the ductility of bending sections is tensileeinforcement ratio. Ductility is guaranteed in normal beams byesigning the tensile reinforcement ratio to be substantially belowhe ACI 318 the balanced ratio limit of at least 25%. Balanced ratios at ultimate limit state (Mohammadhassani et al., 2012).
is the ratio at which steel yielding and concrete crushing occursimultaneously.
Based on ACI 318M-95 code provisions, Section 10.3.2, the bal-anced reinforcement ratio �b is calculated for normal beam as Eq.(3).
�b = 0.85ˇ1f ′c
fy600
600+fy(3)
where f ′c is the concrete nominal compressive strength, fy is the
reinforcement nominal yield strength in (MPa) and ˇ1 is a function
of f ′c (ACI Code, Section 10.2.7.3).The ultimate flexural strength of a member is reached when the
strain at the extreme compression fiber reaches the ultimate strainof concrete at the time when the tension reinforcement reaches
M. Mohammadhassani et al. / Nuclear Engineering and Design 250 (2012) 116– 124 121
Fig. 6. Failure of beam B4 by concrete crushing at support and load points.
Table 6Tensile reinforcement ratio as per code and present study.
Beam � Code
B1 0.0022 0.00390B2 0.00269 0.00225B3 0.00414 0.00224B4 0.00605 0.00234B5 0.00808 0.00236B6 0.00938 0.00264
ys0cCmb3i
�
obT
tflacc
Fig. 8. Bending failure of beam B1.
B7 0.0104 0.00261B8 0.0125 0.00261
ield strain. But as noted in Table 5, the yielding of tensile bar corre-ponds to the strain in extreme compression fiber (εcy) at a range of.36–0.96 of the ultimate strain (εcu). This variance in strain ratiosomplicates the classification of balance condition in deep beams.onsequently the theory of balance condition that is valid for nor-al beams is not applicable in design of deep beams. Thus, tensile
ars in deep beam must meet the serviceability requirements. ACI18M-95 limits the minimum flexural tension reinforcement ratio
n a beam section as given in Eq. (4):
min =√
f ′c
4fy≥ 1.4
fy(4)
Table 6 presents a comparison of tensile reinforcement ratiof the code limit and the bars used. These results are based onar schedules and bar specifications that have been derived fromables 2–4.
As seen in Table 6, only B1 has a tensile reinforcement ratio lesshan the code limit. Fig. 8 shows the failure of B1 which exhibits
exural failure and wider flexural cracks. This was different fromll the other beams (i.e. tensile reinforcement ratio more than theode limit), which exhibited shear failure and premature failure (i.e.rushing of concrete).Fig. 7. Definition of inclined struts,
Fig. 9. Common failure mode for deep beams observed for B2.
In B2–B8, the failure mode is as follows: the widening of thediagonal strut cracks, the premature localized crushing of concreteat the load and support points and the ultimate shear failure. Thecommon failure mode expected in deep beam is by shear and strutformation and this is shown in Fig. 9 for B2.
Other effective parameters on the ductility of deep beam sec-tion are the horizontal and vertical web reinforcements. Accordingto the ACI 318-99 code provisions, the formation of inclined cracksmay lead to a sudden failure in concrete beams if there is no rein-forcement. The ACI Code requires that a minimum area of shear
reinforcement has to be in reinforced concrete members exceptwhere Vu (ultimate shear load) is less than �Vc/2 (Vc is the con-tribution of concrete in ultimate shear load). This requirement ishorizontal struts and the tie.
122 M. Mohammadhassani et al. / Nuclear Engineering and Design 250 (2012) 116– 124
Table 7Web reinforcement ratio for tested deep beams.
Beam Av/bw · s1 Avh/bw · s2
B1 0.0064 0.0042B2 0.0064 0.0042B3 0.0064 0.0042B4 0.0064 0.0067B5 0.0079 0.0098B6 0.0079 0.0098
it(
A
A
wlporpteb
arssrs
R
w
t
rcrtfhsmetti
TR
B7 0.0079 0.0098B8 0.0079 0.0098
ntended to guarantee a ductile failure. When �Vc/2 ≤ Vu ≤ �Vc ,he minimum area of shear reinforcement is determined from Eqs.5) and (6):
v ≥ 0.0015bws1 (5)
vh ≥ 0.0025bws2 (6)
here Av is the area of vertical shear reinforcements perpendicu-ar to the span; Avh is the area of horizontal shear reinforcementsarallel to the span; bw, width of the beam section; s1, spacingf the vertical shear reinforcement parallel to the longitudinaleinforcement; and s2, spacing of horizontal shear reinforcementerpendicular to the longitudinal reinforcement.The above men-ioned code provisions were based on the findings of Rogowskyt al. (1986). The web reinforcement ratios for the tested deepeams are presented in Table 7.
Table 7 shows that all the specimens were over-reinforcementt the web. Over-reinforcement of web also improves the shearesponse of deep beams. If bearing stress is below the concretetrength limit, this over-web reinforcement can increase the sheartrength and gives a higher ductile response. The effect of over-webeinforcement is observed in the reserve strength index. Reservetrength is defined in Eq. (7).
eserve strength index =[
pu − pcr
pcr
]% (7)
here pu is the ultimate load and pcr is the diagonal cracking load.This index has been calculated and presented in Table 8 for all
ested HSSCC deep beams.In Table 8, B1 and B2 have low tensile reinforcement ratio. No
eserve strength index was obtained for B1 because no diagonalrack occurred before failure. B2 exhibited diagonal cracks and loweserve strength index. Table 8 shows a general anomaly in therend of the reserve strength index. This is caused by the prematureailures in some beams (B3–B5) due to support point widths thatave affected the ultimate load. For B6–B8, the significant reservetrength index observed post-cracking due to the crack retardationechanism indicates that over-web reinforcement is effective. The
ffect of over-web reinforcement and the anomaly in Table 8 showhat the reserve strength index is dependent on the failure mode ofested deep beams. Web bars helps to prevent the propagation ofnclined cracks or premature shear failure of deep beams. All these
able 8eserve strength index for tested HSSCC deep beams.
Beams pu ultimate load (kN) pcr diagonal crackload (kN)
Reserve strengthindex
B1 511 – –B2 744 550 35.27B3 807 504 60.11B4 678 540 25.56B5 662 611 8.35B6 1206 560 115.35B7 1633 308 430.20B8 1983 412 381.13
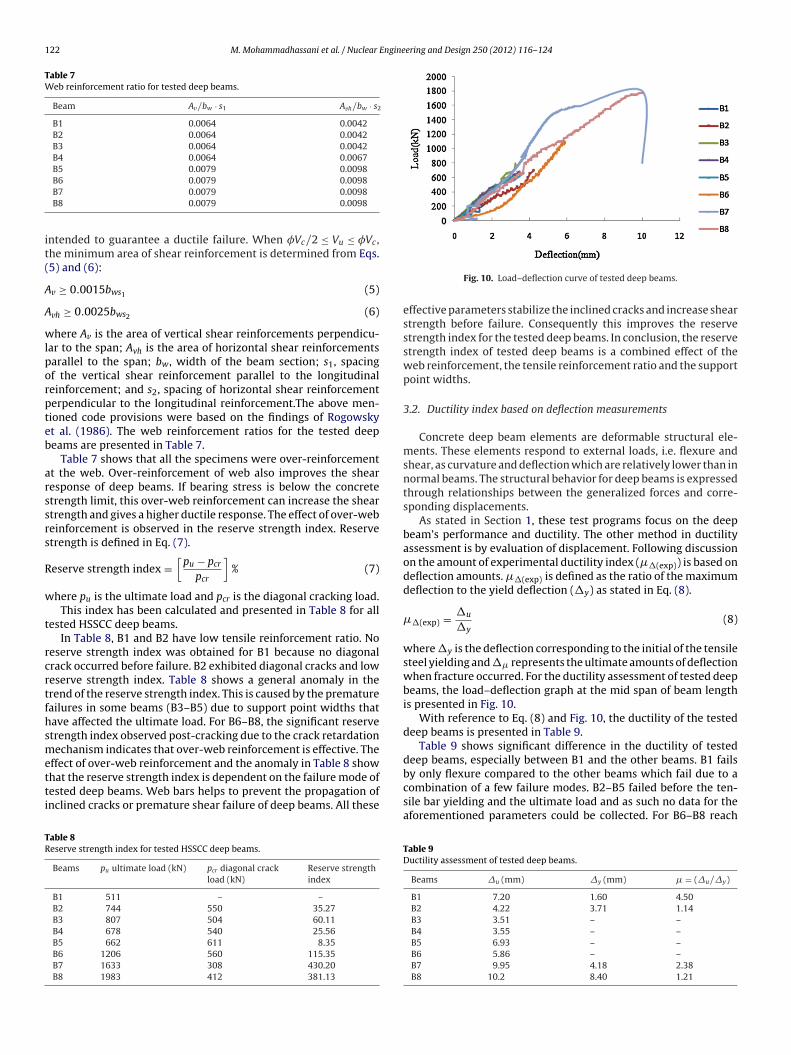
Fig. 10. Load–deflection curve of tested deep beams.
effective parameters stabilize the inclined cracks and increase shearstrength before failure. Consequently this improves the reservestrength index for the tested deep beams. In conclusion, the reservestrength index of tested deep beams is a combined effect of theweb reinforcement, the tensile reinforcement ratio and the supportpoint widths.
3.2. Ductility index based on deflection measurements
Concrete deep beam elements are deformable structural ele-ments. These elements respond to external loads, i.e. flexure andshear, as curvature and deflection which are relatively lower than innormal beams. The structural behavior for deep beams is expressedthrough relationships between the generalized forces and corre-sponding displacements.
As stated in Section 1, these test programs focus on the deepbeam’s performance and ductility. The other method in ductilityassessment is by evaluation of displacement. Following discussionon the amount of experimental ductility index (��(exp)) is based ondeflection amounts. ��(exp) is defined as the ratio of the maximumdeflection to the yield deflection (�y) as stated in Eq. (8).
��(exp) = �u
�y(8)
where �y is the deflection corresponding to the initial of the tensilesteel yielding and �� represents the ultimate amounts of deflectionwhen fracture occurred. For the ductility assessment of tested deepbeams, the load–deflection graph at the mid span of beam lengthis presented in Fig. 10.
With reference to Eq. (8) and Fig. 10, the ductility of the testeddeep beams is presented in Table 9.
Table 9 shows significant difference in the ductility of testeddeep beams, especially between B1 and the other beams. B1 fails
by only flexure compared to the other beams which fail due to acombination of a few failure modes. B2–B5 failed before the ten-sile bar yielding and the ultimate load and as such no data for theaforementioned parameters could be collected. For B6–B8 reachTable 9Ductility assessment of tested deep beams.
Beams �u (mm) �y (mm) � = (�u/�y)
B1 7.20 1.60 4.50B2 4.22 3.71 1.14B3 3.51 – –B4 3.55 – –B5 6.93 – –B6 5.86 – –B7 9.95 4.18 2.38B8 10.2 8.40 1.21
M. Mohammadhassani et al. / Nuclear Engineering and Design 250 (2012) 116– 124 123
Table 10Absorbed energy of tested deep beams.
Beam B1 B2 B3 B4 B5 B6 B7 B8
1325.8 1349.4 2564.4 12299.0 9690.0
tltdtiiacTp
A
wliop
iaeatco
t‘
nftsts
tw
Absorbed energy (kN mm) 388.115 1287.6 1521.9
he ultimate load and its load bearing capacity is affected by theoad and support point widths. There exists a linear relationship upo 85% of the ultimate load in load–deflection graphs of the testedeep beams. The non linear section of load–deflection graph is rela-ively smaller than the linear section; this confirms the low ductilityn the tested deep beams. The area below the load–deflection curves the absorbed energy at loading till failure. For the performancessessment of the tested deep beams, the absorbed energy is cal-ulated by considering the areas below the load deflection graphs.his was carried out using the MATLAB software. The fundamentalrogram is based on Eq. (9).
= (Pi + Pi+1) × (�i+1 − �i)2
(9)
here A is the absorbed energy represented by the area below theoad–deflection graphs, P represents the applied load in each load-ng phase and � indicates the deflection measured at the mid spanf beam length. The absorbed energy in each tested deep beam isresented in Table 10.
Table 10 shows an increase in absorbed energy index with thencrease in tensile reinforcement ratio in all beams except B4, B5nd B8. This index is highly dependent on the ductility. B4 and B5xperience premature failure while B8 experiences low deflectionnd low absorbed energy due to over-reinforcement. Fig. 11 showshe total failure in B7 which occurs due to the ‘exploding’ of con-rete at the bending zone in extreme compression fiber. This typef failing is known as the ultimate failure for structural elements.
The highest absorbed energy is recorded from B7 just prior tohe failure. This type of failure was sudden and followed by a loudexplosion’; Video 1 shows the event as filmed.
This failure pattern is rare because concrete in compression mayot reach the ultimate strain due to the beam height and load trans-
erring mechanism of deep beam. As presented in Table 5, in allested HSSCC deep beams, the highest strain in extreme compres-ion fiber was recorded around 0.002. This amount is very less thanhe maximum amount that concrete may suffered. The reason of
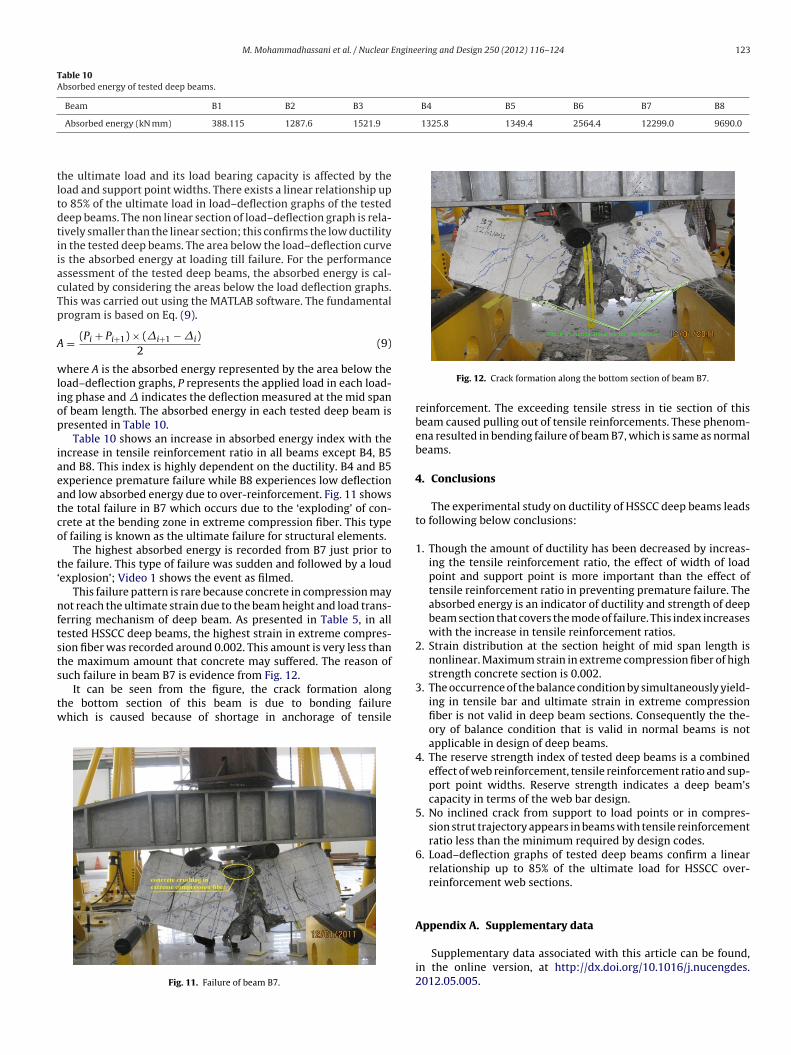
uch failure in beam B7 is evidence from Fig. 12.It can be seen from the figure, the crack formation alonghe bottom section of this beam is due to bonding failurehich is caused because of shortage in anchorage of tensile
Fig. 11. Failure of beam B7.
Fig. 12. Crack formation along the bottom section of beam B7.
reinforcement. The exceeding tensile stress in tie section of thisbeam caused pulling out of tensile reinforcements. These phenom-ena resulted in bending failure of beam B7, which is same as normalbeams.
4. Conclusions
The experimental study on ductility of HSSCC deep beams leadsto following below conclusions:
1. Though the amount of ductility has been decreased by increas-ing the tensile reinforcement ratio, the effect of width of loadpoint and support point is more important than the effect oftensile reinforcement ratio in preventing premature failure. Theabsorbed energy is an indicator of ductility and strength of deepbeam section that covers the mode of failure. This index increaseswith the increase in tensile reinforcement ratios.
2. Strain distribution at the section height of mid span length isnonlinear. Maximum strain in extreme compression fiber of highstrength concrete section is 0.002.
3. The occurrence of the balance condition by simultaneously yield-ing in tensile bar and ultimate strain in extreme compressionfiber is not valid in deep beam sections. Consequently the the-ory of balance condition that is valid in normal beams is notapplicable in design of deep beams.
4. The reserve strength index of tested deep beams is a combinedeffect of web reinforcement, tensile reinforcement ratio and sup-port point widths. Reserve strength indicates a deep beam’scapacity in terms of the web bar design.
5. No inclined crack from support to load points or in compres-sion strut trajectory appears in beams with tensile reinforcementratio less than the minimum required by design codes.
6. Load–deflection graphs of tested deep beams confirm a linearrelationship up to 85% of the ultimate load for HSSCC over-reinforcement web sections.
Appendix A. Supplementary data
Supplementary data associated with this article can be found,in the online version, at http://dx.doi.org/10.1016/j.nucengdes.2012.05.005.

1 Engine
R
A
A
A
A
B
C
C
C
C
C
C
D
24 M. Mohammadhassani et al. / Nuclear
eferences
merican Concrete Institute, revised 1986. Building Code Requirements for Rein-forced Concrete. ACI 318-83, American Concrete Institute, Detroit.
merican Concrete Institute. ACI 349-90. Code Requirements for Nuclear SafetyRelated Concrete Structures.
SCE-ACI Task Committee 426, 1973. The shear strength of reinforcedconcrete members. Proc. Am. Soc. Civil Eng. 99 (June (ST6)), 1091–1187.
shour, A., Yang, K.H., 2008. Application of plasticity theory to reinforced con-crete deep beams: a review. Mag. Concr. Res. 60 (November (9)), 657–664,http://dx.doi.org/10.1680/macr.2008.00038.
ritish Standards Institution, 1985. The Structural Use of Concrete. BS 8110, BritishStandard Institution, London (Parts 1 and 2).
anadian Standards Association, 1984. Design of Concrete Structures for Buildings.CAN3A23.3-M84, Canadian Standards Association, Toronto, Canada.
hemrouk, M., 2009. The design of reinforced concrete deep beams – review of themajor design approaches. In: Proceedings of the International Conference onConcrete Engineering and Technology CONCET 2009, Kuala Lumpur, Malaysia,2–4 March.
hemrouk, M., Kong, K.K., 2004. Diagonal cracking and ultimate shear strength ofslender high strength concrete deep beams. Adv. Struct. Eng. 7 (3), 217228, HongKong.
ollins, M.P., Mitchell, D., 1986. A rational approach to shear design – the 1984Canadian code provisions. ACI J. Proc. 83 (6), 925–933.
ommission of the European Communities, 1984. Common Unified Rules for Con-crete Structures. Eurocode 2, CEC, Brussels, Draft.
onstruction Industry Research and Information Association, 1977. The Design ofDeep Beams in Reinforced Concrete. CIRIA Guide 2. Ove Arup & Partners andCIRIA, London.
e Paiva, H.A.R., Siess, C.P., 1965. Strength and behavior of deep beams. ASCE Struct.J. 91 (10), 19–41.
ering and Design 250 (2012) 116– 124
Ho, J.C.M., Lam, J.Y.K., Kwan, A.K.H., 2010. Flexural ductility and deforma-bility of concrete beams incorporating high-performance materials.http://dx.doi.org/10.1002/tal.579.
Kong, F.K., 2003. Reinforced Concrete Deep Beam. Taylor & Francis Books, Inc.Leonhardt, F., Walther, R., 1966. Wandartige Trager. Bulletin No. 178, Wilhem Ernst
and Sohn, Berlin, 159 pp.Maghsoudi, A.A., Shari, Y., 2009. Trans. A: Civil Eng. 16 (August (4)), 297–307, Sharif
University of Technology.Mansur, M.A., Chin, M.S., Wee, T.H., 1997. Flexural behavior of high-strength con-
crete beams. ACI Struct. J. 94 (6), 663–674.Mohammadhassani, M., 2011. An experimental investigation on bending stiffness
and neutral axis depth variation of over-reinforced high strength concretebeams. Nucl. Eng. Des. 241, 2060–2067.
Mohammadhassani, M., Jumaat, M.Z., Ashour, A., Jameel, M., 2011. Failure modesand serviceability of high strength self compacting concrete deep beams. Eng.Fail. Anal. 18, 2272–2281.
Mohammadhassani, M., Jumaat, M.Z., Jameel, M., 2012. Experimental investigationto compare the modulus of rupture in high strength self compacting concretedeep beams and high strength concrete normal beams. Constr. Build. Mater. 30,265–273.
Portland Cement Association, 1946. Design of Deep Girder. Concrete informationNo. ST66, Chicago.
Ray, S.P., 1985. Flexural strength of reinforced concrete deep beams with and with-out opening in web. J. Struct. Eng. India 12 (October (3)), 75.
Rogowsky, D.M., MacGregor, J.G., Ong, S.Y., 1986. Tests of reinforced concrete deepbeams. Proc. Am. Concr. Inst. 83 (4), 614.
Smith, K.N., Vantsiotis, A.S., 1982. Shear strength of deep beams. Am. Concr. Inst. 79,201.
Van Mier, J.G.M., 1986. Multi-axial strain-softening of concrete, part 1: Fracture. Mat.Struct. 111, 179–190.
Yang, K.-H, Chung, H.-S., Ashour, A.F., 2007. Influence of section depth on the struc-tural behaviour of reinforced concrete continuous deep beams. Mag. Concr. Res.59 (October (8)), 575–586, http://dx.doi.org/10.1680/macr.2007.59.8.575.