Embed Size (px)
Citation preview

Nuclear Energy Part of a Clean Energy Portfolio
South Dakota Public Utilities Commission
Adrian Heymer, NEISenior Director, Strategic Programs
[email protected]; 202-739-8094

Nuclear Energy Institute
Government Relations
Congress, State &, Local
Media &Communications
NuclearGeneration(Regulatory &Technical)
ExecutiveLegal, ITPolicy,
Member Relations

Sustained Reliability and Productivity
90.3% in 200287.9% in 200390.1% in 200489.3% in 200589.6% in 200691.8% in 200791.1% in 2008*
U.S. Nuclear Capacity Factor, Percent
* NEI Estimate
Source: Ventyx Velocity Suite / Energy Information Administration
Updated: 1/09
5,640 MW of power upratesapproved since 1977
52 license extensions to60 years approved
16 license applications for 25 new reactors underreview
Generated805.7 Billion kWh in 2008*

Significant Events at U.S. Nuclear Plants: Annual Industry Average, Fiscal Year 1988-2007
Source: NRC Information Digest, 1988 is the earliest year data is available. Updated: 4/09
Examples of Significant Events•A major transient or an unexpected plant response to a transient;•Degradation of fuel integrity, the primary coolant pressure boundary, or important associated structures;•An unplanned reactor shutdown with complications; •An unplanned release of radioactivity exceeding the technical specifications or regulations;•Fuel oil leak on a safety-related diesel generator

Comparison of Life-Cycle EmissionsTons of Carbon Dioxide Equivalent per Gigawatt-Hour
1,041
622
46 39 18 17 15 14
Coal Natural Gas Biomass Solar PV Hydro Nuclear Geothermal Wind
Source: "Life-Cycle Assessment of Electricity Generation Systems and Applications for Climate Change Policy Analysis," Paul J. Meier, University of Wisconsin-Madison, August 2002.

SecurityIndustry Post 9-11 Actions
$1.8+ Billion in plant security upgrades– Increased security workforce by 60%– Additional equipment & modifications
Force-on-force exercises– Includes extensive insider role
Industry & NRC aircraft impact assessments– Public health & safety assured
Communication protocols established with Federal, State and Local authorities including NORAD

0.0
2.0
4.0
6.0
8.0
10.0
12.0
1995 1996 1997 1998 1999 2000 2001 2002 2003 2004 2005 2006 2007
Coal - 2.47Gas - 6.78Nuclear - 1.76Petroleum - 10.26
2007
U.S. Electricity Production Costs 1995-2007, In 2007 cents per kilowatt-hour
Production Costs = Operations and Maintenance Costs + Fuel Costs
Source: Global Energy DecisionsUpdated: 5/08
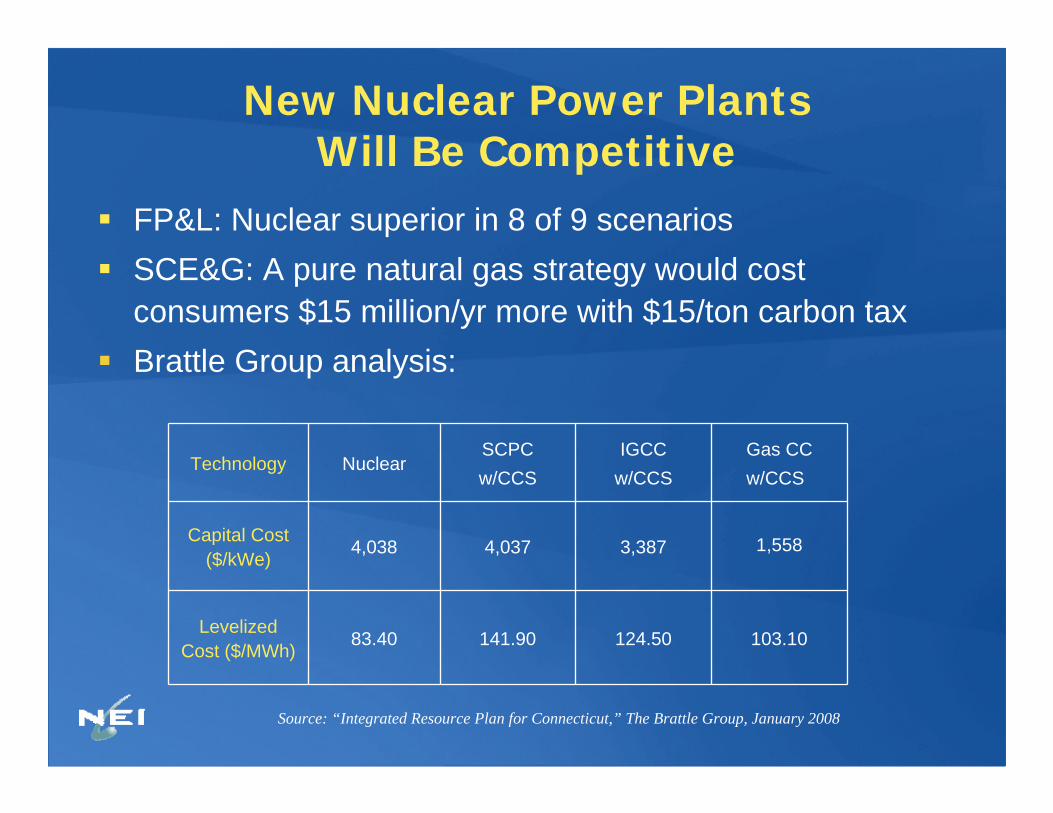
New Nuclear Power Plants Will Be Competitive
FP&L: Nuclear superior in 8 of 9 scenariosSCE&G: A pure natural gas strategy would cost consumers $15 million/yr more with $15/ton carbon taxBrattle Group analysis:
Technology NuclearSCPC w/CCS
IGCCw/CCS
Gas CCw/CCS
Capital Cost ($/kWe) 4,038 4,037 3,387 1,558
LevelizedCost ($/MWh) 83.40 141.90 124.50 103.10
Source: “Integrated Resource Plan for Connecticut,” The Brattle Group, January 2008

Challenges to New Deployment
FinancingWorkforce– Formed community college/university
partnerships
Supply chain– Manufacturers outreach forums– Supply & demand generating opportunities

Potential New US Nuclear Plants

Construction & LicensingThen and Now
THEN NOWDesign as you build Plant designed before major construction begins
No design standardization Standard NRC-certified designs – 70+% Standard
Inefficient construction management practices
Lessons learned from overseas projects;Increased planning; Modular construction
Changing regulatorystandards and requirements
More stable process: NRC approves site, design, construction & operation before construction begins and significant capital is placed “at risk”
Main opportunity for public intervention when plant is essentially complete
More opportunities to intervene at well-defined points in process. Intervention at the end of the process must be based on objective evidence that acceptance criteria, defined in the license, have not been, and will not be met

Future Designs
Small Light-Water Reactors (40MW - 125MW), Gas-Cooled High Temperature & Fast ReactorsGeneration – potential deployment – 2018/19Process heat – High Temperature Reactors– Industrial applications – 2020s– Replace natural gas as heat source
• Petro-chemical industry• Hydrogen manufacture• Coal/gas to liquid fuels • Water purification, desalination, fertilizers …
– Reduce industrial non-generating carbon footprint

Used Fuel ManagementWhat’s Used – What’s Left

Strategic DirectionFour-Part Integrated Program
Form a Executive Commission to assess options while continuing the Yucca Mtn license review– Adjust fee structure to fund only licensing while
options being considered
Establish R&D centers to develop advanced, more economic, proliferation resistant recycling processMove used fuel to interim storage locations & recycle the used fuel--reduce toxicity, heat load & volumeIsolate waste product in a geologic facility

Used Fuel Management
Yucca Mountain
Used Fuel
Used Fuel Recycling,
Interim Storage
Nuclear Waste
Recycled Nuclear Fuel
Advanced Recycling Reactors

Benefits of Nuclear Generation
Does not emit greenhouse gas while generatingStable, low-cost electricityJobs – Each new reactor– 400 – 700 direct jobs plus an equivalent number
of indirect jobs for three generations
Tax revenue & economy -- each reactor– $20 million/yr in state & local taxes– Value to the economy -- $430+ million/yr

2050 Climate Change Goal80% Reduction in CO2 Emissions
Massive & complex transformation in generation & distribution
Electricity & energy costs will rise
No silver bullet– Need all clean generating sources if
impact on economy is to be minimized

Additional Information

692.7
205.6
27.4 12.6 0.5
Nuclear Hydro Wind Geothermal Solar
U.S. Electric Power Industry CO2 AvoidedMillion Metric Tons, 2007
Source: Emissions avoided are calculated using regional and national fossil fuel emissions rates from the Environmental Protection Agency and plant generation data from the Energy Information Administration.
Updated: 4/07
•25 % of US electricity is generated from clean airsources; hydro, wind, solar, nuclear

High Industrial Safety Standards 2007
3.30
2.20
0.13
Manufacturing Utilit ies Nuclear Power Plants
ISAR = Number of accidents resulting in lost work, restricted work, or fatalities per 200,000 worker hours. Electric utilities and manufacturing do not include fatality data.*Includes non-utility personnel for provisional 2008 results Sources: Nuclear (World Association of Nuclear Operators), 2006 Data for Electric Utilities and Manufacturing (U.S. Bureau of Labor Statistics).
*

Source: The Brattle Group, “Transforming America’s Power Industry: The Investment Challenge 2010-2030,” November 2008
New Generating Capacity NeededAssumes 0.7% Annual Growth in Peak Load
133 GW
216 GW
Average Electricity Growth Rate 2000 to date: 1.5%/yrAverage Electricity Growth Rate in 1990s: 1.8%

Levelized Cost of Electricity, $/MWh
Cost of CO2, $/Metric Ton
NGCC ($8-10/MMBtu)
Wind (32.5% CF)
Nuclear
Note: Central Station Solar = 175 $/MWh
All costs are in 2007 $
Rev. October 2008
Comparative Costs of New Generation Options: 2015-2020
50
60
70
80
90
100
110
120
0 10 20 30 40 50
140
130
Coal with CCS (2020)
Average 2007 U.S. wholesale electricity price = 66 $/MWh
Coal without CCS
Source: “Integrated Generation Technology Options, EPRI Report 1018329

Emissions Prevented byU.S. Nuclear Power Plants
SO2
(million short tons) NOx
(million short tons)CO2
(million metric tons)
Prevented byNuclear Plants in 2007 3.04 0.98 692.7
Reduced atFossil Plantsas a result of 1990 Clean Air Act Amendments(1990-2005)
5.15 4.29CO2 emissions are not regulated by Clean Air Act
Source: Environmental Protection Agency, Energy Information Administration, Nuclear Energy InstituteUpdated: 5/08

Lifecycle Emissions for Electricity Generation in Germany Grams per MWh
Source: “ExternE - Externalities of Energy. National Implementation in Germany”; W. Krewitt, P. Mayerhofer, R. Friedrich, A. Trukenmüller, T. Heck, A. Greßmann, F. Raptis, F. Kaspar, J. Sachau, K. Rennings, J. Diekmann, B. Praetorius; IER, Stuttgart; 1998.
Generation type SO2 NOx Particulates CO2
Nuclear 32 70 7 19,700
Coal 326 560 182 815,000
Gas 3 277 18 362,000
Oil 1,611 985 67 935,000
Wind 15 20 4.6 6,460
PV (Home Application) 104 99 6.1 53,300

Emissions Produced by 1 Kilowatt-hour of Electricity Based on Life-Cycle Analysis
Generation Option
Greenhouse gas emissions gram
equiv. (in CO2/kWh)
Sulfur dioxide emissions (in
milligrams/kWh)
Nitrogen oxide emissions (in
milligrams/kWh)
NMVOC (in milligrams
/kWh**)
Particulate matter (in
milligrams /kWh)
Hydropower 2 – 48 5 – 60 3 – 42 0 5
Nuclear 2 – 59 3 – 50 2 – 100 0 2
Wind 7 – 124 21 – 87 14 – 50 0 5 – 35
Solar photovoltaic 13 – 731 24 – 490 16 – 340 70 12 – 190
Biomass forestry waste combustion 15 – 101 12 – 140 701 – 1,950 0 217 – 320
Natural gas (combined cycle) 389 – 511 4 – 15,000[*] 13 – 1,500 72 – 164 1 – 10
Coal – modern plant
790 – 1,182 700 – 32,321 700 – 5,273 18 – 29 30 – 663[*] The sulfur content of natural gas when it comes out of the ground can have a wide range of values. When the hydrogen sulfide content is more that 1 percent, the gas is usually known as “sour gas.” Normally, almost all of the sulfur is removed from the gas and sequestered as solid sulfur before the gas is used to generate electricity. Only in the exceptional case when the hydrogen sulfide is burned would the high values of sulfur dioxide emissions occur.
** NMVOC means non-methane volatile organic compounds.
Source: “Hydropower-Internalized Costs and Externalized Benefits,” Frans H. Koch, International Energy Agency (IEA)-Implementing Agreement for Hydropower Technologies and Programs, Ottawa, Canada, 2000.

O&M, 7%
Fuel77%
Fuel27%
O&M23%
O&M73%
Fuel93%
Coal Gas Nuclear Nuclear Fuel CostComponents
17%
9%4%
35%
35%
Fuel as a Percentage of Electric Power Production Costs
2007ConversionFabrication
Waste Fund
Enrichment
Uranium
Source: Ventyx Velocity Suite; Energy Resources International, Inc.Updated: 5/08

CO2 Emissions Resulting from U.S. Nuclear Plant License Expirations
Assumptions: Gas / Wind Project - 65% natural gas and 35% wind. Nuclear fleet average capacity factor is 90%. Nuclear capacity figures are based on today’s expiration dates – does not include the license renewal of 53 nuclear units. Sources: Capacity—EIA; License Expiration—NRC; Emission rates— Ventyx Velocity Suite / EPA CEMS and EIAUpdated: 1/09
Nuclear capacityResulting emissions from wind/gas project which would replace retired nuclear capacity