Embed Size (px)
Citation preview

50 THE LEAN GUIDE TO NUCLEAR ENERGY
Radioactivity, 2, 4, 5-7, 22-23, 25, 36,
39-40
Defined, See Cast list
Uranium oxide and, 4
Radioactive poem, 5
Radiation, Cast list, 23, 25, 29, 33, 39
Radium-226, 5
Radon-222, 5
Reactors, 5-9, 13, 16-17, 20-28, 32-34,
36, 39, 42
Construction, 7, 9, 16, 31, 36, 39
Decommissioning, 7, 20, 29
Fast-breeder, 20-26
Rising sea levels and, 36
Thorium, 25-26
Renewable Energy, 31, 39
Repositories, 5-6, 8, 35, 39
Reprocessing, 2, 6, 7, 14, 21-23, 42
Fast-breeding and, 21-23
Rhodium, 23
Russia, 4, 5, 13-14, 21, 23, 40
Seawater, 15, 20, 26-27, 42
Sea level rise, 36
SLS. Abbreviation for Storm van
Leeuwen and Smith.
Smith, Dr Philip, 3, 9, 11-12, 20, 41-42
Soft ores, 4, 10
Solvents, 23, 27-28, 33
South Africa, 4
Spent fuel, 2, 6, 21, 36
Structural change, 30
Sustainability, 9, 41
Sustainable Development Commission,
3, 42
Sweden, 35
Technetium, 23
Technological fix, 3, 32, 36
TEQs (Tradable Energy Quotas), 31,
37, 40
Terrorism, 29
Thorium reactors, 20, 24-26, 42
Thorium-230, 5
Thorium-232, 25
Thorium-233, 25
Thorium-234, 5
Titanium hydroxide, 26
Tradable Energy Quotas, see TEQs
Transuranic elements, 2
TREI (Theoretical Return on Energy
Invested), 11-13
Defined, See Cast list
Tributyl phosphate, 23
Tritium, 6
United States, 4, 12-13, 22
Uranium-233, 25-26
Uranium-234, 5
Uranium-235, 1-2, 5, 7, 14, 22, 24-26
Defined, See Cast list
Explained, 1-2
In fast-breeding, 22-26
In fuel, 1-2, 5, 14, 22, 24-26
In nuclear reaction, 1-2, 22, 24-26
Uranium-238, See Cast list, 2,-5, 22-24
In fast-breeding, 22-24
In fuel, 2, 22
In nuclear reaction, 2
Uranium depletion, See Cast list, 1, 12,
19-20, 29-30, 33, 36
Uranium hexafluoride, 5, 8-9, 13, 33-35
Uranium ores, See Cast list, 4-5, 8-12,
15, 19-20, 22, 27-28, 34
Alternative sources, 20-28
Uranium oxide (yellowcake), 4-5, 10,
26-27
See also Enrichment.
Uranium Information Council, 3, 42
Uzbekistan, 4
Waste. See also spent fuel.
Clearing-up programme, See Cast
list, 2, 5, 7-9, 13, 16-19, 28-29, 31,
33-36, 39
From enrichment, 5-8, 13, 17-18, 29
From generation, 2, 6-8, 16-18, 22-
23, 29
From uranium mines, 8, 17, 29
High-level, 6-9, 16, 22, 29, 35-36
Low-level, 6, 29
World Nuclear Association (WNA), 3,
40, 42
Yellowcake. See uranium oxide.
Zirconium, 5
NUCLEAR ENERGY
In Brief
1. The world’s endowment of uranium ore is now so depleted that the nuclear industry will never, from its own resources, be able to generate the energy it needs to clear up its own backlog of waste.
2. It is essential that the waste should be made safe and placed in permanent storage. High-level wastes, in their temporary storage facilities, have to be managed and kept cool to prevent fire and leaks which would otherwise contaminate large areas.
3. Shortages of uranium – and the lack of realistic alternatives – leading to interruptions in supply, can be expected to start in the middle years of the decade 2010-2019, and to deepen thereafter.
4. The task of disposing finally of the waste could not, therefore, now be completed using only energy generated by the nuclear industry, even if the whole of the industry’s output were to be devoted to it. In order to deal with its waste, the industry will need to be a major net user of energy, almost all of it from fossil fuels.
5. Every stage in the nuclear process, except fission, produces carbon dioxide. As the richest ores are used up, emissions will rise.
6. Uranium enrichment uses large volumes of uranium hexafluoride, a halogenated compound (HC). Other HCs are also used in the nuclear life-cycle. HCs are greenhouse gases with global warming potentials ranging up to 10,000 times that of carbon dioxide.
7. An independent audit should now review these findings. The quality of available data is poor, and totally inadequate in relation to the importance of the nuclear question. The audit should set out an energy-budget which establishes how much energy will be needed to make all nuclear waste safe, and where it will come from. It should also supply a briefing on the consequences of the worldwide waste backlog being abandoned untreated.
8. There is no single solution to the coming energy gap. What is needed is a speedy programme of Lean Energy, comprising: (1) energy conservation and efficiency; (2) structural change in patterns of energy-use and land-use; and (3) renewable energy; all within (4) a framework for managing the energy descent, such as Tradable Energy Quotas (TEQs).

ACKNOWLEDGEMENTS
Thank you to my editor, Shaun Chamberlin, for his meticulous work in helping
to get this book ready for publication.
Thank you to Jan Willem Storm van Leeuwen for many months of comments
and expert advice. References for his work, and the work he has published
jointly with the late Dr Philip Smith, are given on pages 41-42. This booklet is
substantially guided by their research, but it builds on it and takes the
discussion of energy policy options further. The conclusions I draw, including
the concept of “energy bankruptcy”, treatment of the backlog of waste, and the
alternative vision of Lean Energy, are my own. All summaries sacrifice detail,
some of which may be important. I make no claim that this booklet is beyond
challenge in its representation of Storm van Leeuwen and Smith’s exhaustive
and careful analysis: the responsibility for the entire contents of this booklet is
my own.
Thank you to the many readers who have commented on parts or all of the text.
Special thanks for detailed technical comments to John Busby. Lucy Care
supplied valuable comments and arranged for several scientific referees with
knowledge of nuclear energy to comment on the text.
Thank you to Christopher White for his drawings.
Thank you to Geoff Lye for advice on publicity matters.
Thank you to the R.H. Southern Trust for financial support.
My work on the Lean Economy project has been aided and encouraged in
various ways and over many years by Elm Farm Research Centre, and its
director, Lawrence Woodward, initially with the support of the late David
Astor.
ABOUT THE AUTHOR
David Fleming has an MA (History) from Oxford, an MBA from Cranfield and
an MSc and PhD (Economics) from Birkbeck College, University of London.
He has worked in industry, the financial services and environmental
consultancy, and is a former Chairman of the Soil Association. He designed the
system of Tradable Energy Quotas (TEQs), (aka Domestic Tradable Quotas and
Personal Carbon Allowances), in 1996, and his booklet about them, Energy
and the Common Purpose, now in its third edition in this series, was first
published 2005. His Lean Logic: The Book of Environmental Manners is
forthcoming.
THE LEAN GUIDE TO NUCLEAR ENERGY 49
Geomelt, 44
Granite, 4, 10, 20-21, 40
Greenhouse gases, 8, 9, 28-29, 39-40,
42
Greenpeace, 3, 40
Grid/network, See Cast list, 1, 8, 11, 18,
26, 32, 34
Hard ores, 4, 10
Half-life, 2, 4, 5, 25
Defined, See Cast list
Of uranium-238’s decay sequence, 5
Halogenated compounds, 9, 44
Hex. See uranium hexafluoride.
Impurities,
In reactions, 2
India, 20, 21, 25
In situ leaching, 4, 29
Isotopes, 2, 6
Defined, See Cast list
Radioactive, See Cast list
Japan, 21, 23-24, 40
Kakrapar, 25
Kazakhstan, 4, 14, 40
King, David, 40
Krypton, 2
Lead-206, 5
Lead-210, 5
Lean Energy, 30-32, 36
Lean Thinking, 30, 42
Leeuwen, Jan Willem Storm van, 3, 9,
11-12, 15, 20, 40-42
Lidsky, M., and Marvin M. Miller, 40
Life-cycle. See nuclear life-cycle.
Lovelock, James, 2, 20-22, 26, 29-31,
40
Low-level radiation, 29
See also Committee Examining
Radiation Risks of Internal Emitters
(CERRIE).
Mining and milling, See Cast list, 4-5,
10-11, 13-17, 20, 27, 29, 31, 34, 39,
41
Minigrids, 32
Monju, 23
Namibia, 4, 14
Neptunium, 2, 22
Net Energy,
Defined, See Cast list
See also Energy Balance.
Neutron, 1, 2, 22, 25
Defined, See Cast list
In nuclear reaction, 1-2
Nevada, 35
Nielsen, Rolf Haugaard, 41
Normality-creep, 6
Nuclear energy, passim
Nuclear fuel, 1-3, 5-9, 13-14, 16, 19-30,
33, 36, 40-41
Alternative sources, 20-28
Nuclear life-cycle: the whole sequence
of processes from uranium-mining
to final safe disposal of all wastes, 4-
7 and passim.
Nuclear Regulatory Commission, 6, 44
Oil peak, 1, 11-12, 15-16, 19, 28-32, 41
Olkiluoto, 9, 35
Olympic Dam, 15
Oxford Research Group, 41
Ozone layer, 33
Palladium, 23
Pearce, Fred, 41
Phénix, 23
Phosphates, 5, 20, 23, 27-28, 39
Plutonium, 2, 6-7, 13, 20-26
In fast-breeder reactors, 21-24
In thorium reactors, 25-26
Plutonium-239, 2, 6, 22-26
Plutonium-241, 23
Polonium-210, 5
Polonium-218, 5
Porritt, Jonathon, 42
PREI (Practical Return on Energy
Invested), 10, 11, 13, 17-18, 27, 33,
35
Defined, See Cast list
Proliferation, 5, 7, 29
Protactinium-233, 25
Protactinium-234, 5
Proton,
Defined, See Cast list

48 THE LEAN GUIDE TO NUCLEAR ENERGY
INDEX
Accidents, 6-7, 24
Alternative sources of nuclear fuel, 20-
28
Americium, 2, 23
Atomic mass,
Defined, See Cast list
Atomic number,
Defined, See Cast list
Australia, 4, 14-16, 39-40, 46
Back-end: dismantling and all waste-
disposal operations, See Cast list, 9,
17, 27, 33-34
Backlog of wastes, 17, 18, 33, 35
Beloyarsk, 23
Bismuth-214, 5
Boron control rods, 2
Boyle, Godfrey, 39
Brazil, 4
Busby, Chris, 16, 39
Calculation of energy share, 47
Canada, 4, 14-15
Carbon-14, 6
Carbon dioxide, 1, 3, 8-10, 39
Ceramic pellets, 5
Chernobyl, 7
Cigar Lake, 15, 46
Climate change, 1, 2, 28-31, 36, 40-41.
See also Greenhouse gases.
Coal, 1, 17, 20-21
Cold War, 13
Committee Examining Radiation Risks
of Internal Emitters (CERRIE), 39
Committee on Radioactive Waste
management (CORWM), 39
Common purpose, 31, 37, 40
Containers for waste disposal, 5-8
Corrosion Residuals and Unidentified
Deposits (CRUD), 7
Curium, 23
Decentralisation of energy, 3, 11, 30-31
Defence-in-depth, 24
Depleted uranium, 5, 8, 13
Defined, See Cast list
Depletion, see Uranium Depletion.
Depletion trap, 19
Diehl, Peter, 43
E=mc2, 1
Edwards, Gordon, 40
Einstein, Albert, 1
Electricity, See Cast list, 1, 3-4, 6-11, 16-
18, 20-22, 27, 29-30, 32, 35-36
Energy balance: the ratio of energy
inputs to energy outputs, taking into
account all processes in the nuclear
life-cycle, 3, 9-11, 13, 15, 17-19, 27,
33-35, 40-42
Energy Balance Sheet, 34
Energy bankruptcy, 18, 32-35
Energy conservation, 30-32
Energy efficiency, 11, 25, 30
of nuclear power, 25
Energy famine. See Energy gap.
Energy gap, 24, 29-31, 36-37
Energy policy, 1, 3, 28-33, 35-37
Enrichment of fuel, See Cast list, 5, 7-8,
13, 16, 27, 29, 31
And proliferation, 5, 7, 29
And wastes, See Cast list, 5, 7-8, 13,
16
EREI (Energy Return on Energy
Invested), 10
Defined, See Cast list
See also TREI and PREI.
Fast-breeder reactors, 1, 20-26, 42
Finland, 9, 35
Fleming, David, 40
Fluorine, 5, 8
France, 5, 21, 23, 40
Freon-114, 9
Front-end: the processes required to
produce nuclear energy –
construction, mining, milling, etc.
See Cast list, 9, 16-17, 27-28, 33-34
Fuel. See nuclear fuel.
Fuel fabrication, 22-23
Gaia, 30, 40
Gas (fuel), 1, 8-11, 14-15, 17, 19, 28-29,
32, 36
THE
LEAN GUIDE TO
NUCLEAR
ENERGY
A Life-Cycle in Trouble
David Fleming
THE LEAN ECONOMY CONNECTION
Published by
THE LEAN ECONOMY CONNECTION
P.O. Box 52449 London NW3 9AN [email protected] www.theleaneconomyconnection.net The Lean Guide to Nuclear Energy: A Life-Cycle in Trouble ISBN 0-9550849-2-8 November 2007 Copyright © David Fleming 2007 Drawings by Christopher White Every care has been taken in the preparation of this booklet, whose findings have been reached in good faith, with no prior agenda. Neither the author nor the publisher can be held liable for any errors or decisions influenced by it. COMMENTS AND REVISIONS
The lack of consensus in the nuclear industry on such fundamentals as the future of uranium supplies and its carbon intensity (greenhouse gas emissions per kilowatt hour) means that many, or most, papers on the subject must contain substantial errors. This paper will be no exception. However, if errors are brought to the author’s attention and proved, the text will be amended accordingly, and new editions issued, both on the website and in the printed version.
THE LEAN GUIDE TO NUCLEAR ENERGY 47
62. NEA/IAEA (2006), Slide Presentation.
63. Storm van Leeuwen (2006C), (2006F).
64. Ibid. Similar problems affect mixed-oxide fuel (MOX) ≈ 2% of current capacity. The number of reactors in operation now: World Nuclear Association (2007b).
65. Lidsky and Miller (1998).
66. Storm van Leeuwen (2006C). Uranium Information Council (2004). See also World Nuclear Association (2007d).
67. Ibid.
68. Storm van Leeuwen (2006D).
69. SVL (2007), Part D10. Storm van Leeuwen (2006E2), “Uranium from Seawater”, Appendix E2.
70. Ibid.
71. NEA/IAEA (2006), Slide Presentation.
72. SVL, Part D9. See also SVL, Part D9 for a summary of prospects for shales as a source of uranium ore.
73. SVL, Part C5. Storm van Leeuwen and Smith (2006E).
74. See, for instance, Déry and Anderson (2007). The author has not, at the time of going to print, been able to find reliable information on: (a) to what extent the extraction of uranium from phosphate ore makes it unsuitable for subsequent use in agriculture; (b) what the nuclear cycle’s energy balance would be, using phosphates as a low-grade uranium ore, (c) what the pollution implications of the organophosphates in the process are, and (d) fully-endorsed information on whether a global phosphates resource exists on a scale which would make it significant for nuclear energy in the future. Commercial enterprise is usually alert to opportunity, and the lack of development of phosphates as an ore strongly suggests that phosphates will not solve the nuclear industry’s fuel problem, but a firm conclusion on this is being held over for later editions.
75. See IEA (2007), pp 6-7. Note that nuclear’s share (p 6) seems inconsistent with this. There are two ways of estimating shares of nuclear power and renewables: (a) the (fossil fuel) inputs needed to produce the outputs at a notional 38% plant efficiency; (b) their actual electricity output. The second method has been chosen here for its better estimate of final demand, but it produces smaller numbers. For a text using method (a), and an explanation of the difference between them, see Boyle (2004).
76. Low-level waste: see Busby (1995).
77. Lovelock (2006), p 99.
78. Ibid, p 135. See also Pearce (2006).
79. See Fleming (2007). For lean thinking see Womack and Jones (2003).
80. The effect of nuclear reactors in sustaining a large-scale grid, and making it harder to build localised energy systems, is discussed by the SDC as “network lock-in”. Sustainable Development Commission (2006), (2), p 10.
81. Tradable Energy Quotas (TEQs), see Fleming (2007).

46 THE LEAN GUIDE TO NUCLEAR ENERGY
September 2007. Areva (2007b) measures this as about 370 gigawatts of installed capacity.
43. World Nuclear Association (2007c).
44. See Dzhakishev (2004) table 2, and other references at note 36.
45. See Bunn (2003).
46. See Collell (2005); Zittel and Schindler (2006), pp 11.12.
47. Busby (2007a).
48. For a description of reprocessing, see chapter 4, p 18-23.
49. Sources for the table. Uranium supply: World production from mines: World Nuclear Association (2007c); additional sources and their availability Dzhakishev (2004); Collell (2006); Bunn (2003), Nicolet and Underhill (1998); International Atomic Energy Agency (2001); Zittel and Schindler (2006); Busby (2006).
50. World Nuclear Association (2007c).
51. See Zittel and Schindler (2006). For updates on Cigar Lake from the developer’s point of view, see Cameco’s website.
52. For quality of the ore in Olympic Dam see Australia Uranium Association (2007). This reports an average of 0.4 percent, but the more recent annual report for 2007 from BHP Billiton (2007), p 63, reports the average of 0.29 kg of uranium oxide per tonne (i.e. 0.029% uranium oxide). Yield: SVL, Part D8. Copper: Busby (2007b).
53. SVL, Part D8.
54. Busby (2007b).
55. Nuclear Energy Agency (2006), Executive Summary, p 3
56. For clarity “back-end including the backlog” should be made explicit to distinguish it from back-end without the backlog. In the industry, the backlog is often called the “legacy”.
57. The energy-costs of each stage in the nuclear energy cycle are set out in SLS and summarised in Storm van Leeuwen (2006B) and in Oxford Research Group (2006b). See also SVL, Part C4, figure C11 and table C2, and (when available) Part G. Appendix B splits the energy costs conveniently into front-end and back-end. Part C lumps much of the front-end and back-end energy costs together as “lifetime operational energy input”. The lifetime operational energy investments of 460 PJ is given as 45 percent of the gross output of 1030 PJ; the present analysis rounds up to 50 percent, but estimates vary greatly (higher and lower), and energy costs will rise rapidly as the ore quality used declines from the present average of 0.15 percent.
58. See Oxford Research Group (2006a); and Storm van Leeuwen (2006B), and (2006E). SVL, Parts C2, C4.
59. Lovelock (2006), p 103.
60. See SVL, Part D9, Storm van Leeuwen (2006E), and a significant source for their work: Huwyler, Rybach and Taube (1975).
61. Storm van Leeuwen (2006C), (2006F).
CONTENTS
1. Introduction 1
2. What Is Really Involved in Nuclear Energy? 4
3. Greenhouse Gases, Ore Quality and Uranium Supply 8
Greenhouse gases 8
Ore quality 9
Uranium supply 11
Supply crunch 13
Can uranium production increase to fill the gap? 14
Can the industry supply the energy to clear its own waste? 16
4. Alternative Sources of Fuel? 20
Granite 20
Fast-breeder reactors 21
Seawater 26
Phosphates 27
5. In Context 29
6. It’s Time to Turn to the Wit and Energy of the People 33
Sources 39
Notes and References 43
Index 48

CAST LIST ————————
ATOM. The smallest particle unique to a particular chemical element. An atom consists of a nucleus of protons and neutrons, surrounded by electrons.
ATOMIC MASS. The sum of neutrons and protons in the nucleus.
ATOMIC NUMBER. The number of protons in the nucleus of an atom: this is what gives an element its characteristic properties.
BACK END ENERGY. The energy needed to dispose of old reactors and to clear up all the wastes produced at each stage of the front-end process.
DEPLETED URANIUM. The waste uranium left behind after the enrichment process. (Not to be confused with uranium depletion – i.e. the decline in the global ore resource).
ELECTRON. A negatively-charged particle orbiting the nucleus of an atom.
ENERGY RETURN ON ENERGY INVESTED (EREI). The ratio between the energy derived from a process and the energy invested in that process.
FRONT END ENERGY. The energy needed to build reactors, to mine, mill, enrich and prepare the fuel, and for the other energy-using tasks needed to produce nuclear power.
GROSS ENERGY. The electricity fed by nuclear reactors into the grid.
HALF-LIFE. The time it takes, statistically, for half the atoms of a given radioactive isotope to decay.
ISOTOPES. Atoms with the same atomic number, but different numbers of neutrons and hence different atomic masses. They are identified by the sum of protons and neutrons, so that, for instance, “uranium-235” has 92 protons and 143 neutrons, whereas uranium-238 has 92 protons and 146 neutrons.
NET ENERGY. Gross energy minus front-end energy.
NEUTRON. A particle with a neutral charge (that is, no charge at all) found in the nucleus of every atom except that of the simple form of hydrogen.
PRACTICAL RETURN ON ENERGY INVESTED (PREI). A measure of the energy return on energy invested which takes account of practical questions of local geology, water problems and price in a market impoverished by energy scarcity.
PROTON. A particle with a positive electrical charge, found in the nucleus of every atom.
RADIOACTIVITY. Radioactive material radiates energy which has the ability to break up and rearrange cellular DNA and the atomic structures of elements.1
THEORETICAL RETURN ON ENERGY INVESTED (TREI). A measure of the energy return on energy invested, taking no account of the practical questions included in PREI.
URANIUM-235. The isotope of uranium which drives the nuclear reaction, and which needs to be present in an enriched concentration of 3.5 percent, in comparison with the 0.7 percent in which it is present in natural uranium.
THE LEAN GUIDE TO NUCLEAR ENERGY 45
not as clear as might be hoped with respect to a statement and derivation of its own estimate of g/kWhs and its distribution through the nuclear cycle. Clarification from the authors would be welcome.
27. The estimate of 451 g/kWh of GHG emissions for combined cycle gas fired electricity generation comes from ISA, Sydney University (2006, p 122), and it covers only the combustion of gas. If losses incurred during extraction and in the distribution grid are included, the greenhouse gas emissions (in CO2 equivalents) is estimated at 577 g/kWh (p 136). The range of estimates for gas turbines comes from Grimston (2005).
28. For definitions of “front-end” and “back-end” see the Cast List and pp 17-18.
29. SLS chapter 2. Storm van Leeuwen (2006B). SVL, Parts D4 and G. Note that the concept of EREI becomes more complex when applied to comparisons between two energy sources. If a given amount of energy, contained in gas, could produce more electricity if used directly in a combined cycle gas turbine than if used in the nuclear energy cycle, nuclear energy becomes an expensive way of reducing the supply of electricity to the grid.
30. Mudd and Diesendorf (2007), p 8.
31. Ibid, p 9.
32. Oil peak: see Lean Economy Connection (2007).
33. World average ore grade: see Canadian Nuclear (2007).
34. Note that Rio Tinto (2005) announced a “cut-off grade” of 0.08 percent for its existing stocks of ore at its Ranger mine in Namibia. The use of “existing stocks” means that the ore has already been mined and is waiting to be milled, so that a lower-grade ore can be tolerated.
35. NEA/IAEA (2006). References to this are taken from accessible but authoritative summaries available on the Web.
36. It estimates that there are 4,743.000 tonnes available at a price of $ 130/kg. Nuclear Energy Agency (2006), Executive Summary. The World Nuclear Association (2007b) reports that current demand is 66,500 tonnes per annum. Note that this calculation of “the reserves to production ratio” is extremely crude, for reasons explained on p 12.
37. NEA (2006), Executive Summary; the calculation is shown at NEA (2006), Slide presentation.
38. This is accessibly summarised in Oxford Research Group, ed (2006a).
39. For the story of optimistic estimates of oil resources from the United States Geological Survey and the International Energy Agency, and the years squandered in debate about this, see Strahan (2007).
40. Nuclear Energy Agency (2006), Executive Summary. First Uranium Corporation (2007); see pp 14-16.
41. World Nuclear Association (2007b).
42. World Nuclear Association (2007b) estimates 439 working reactors operable in

44 THE LEAN GUIDE TO NUCLEAR ENERGY
12. World Nuclear Association (2007), “How It Works: Conversion and Enrichment”; also SLS chapter 2.
13. Disposal of high-level waste: For detail of the energy costs, see SLS, chapter 4; this is now conveniently summarised in SVL, Part C4. See also World Nuclear Association (2007), “How It Works: used fuel management”; and (for the UK), Committee on Radioactive Waste Management (July 2006), esp. chapters 14-15. For overview see Nielsen (2006). A variant is GeoMelt (see Google references). See also Busby (2006b).
14. Committee Examining Radiation Risks of Internal Emitters (CERRIE) (2004), Report.
15. The Nuclear Regulatory Commission is cited by Miller (2000), p 385-386. Nuclear engineer: George Gallatin, senior nuclear engineer, cited by Miller (2000), p 386. Flooded nuclear power stations: King (2004).
16. SLS, chapter 3; chapter 4. Storm van Leeuwen (2006B), pp 4-5, in Evidence to the IPCC Working Group III, Fourth Assessment Report Draft for Expert Review. For EPR see Areva (2007a) and web references. Summary/revision/clarification in SVL Part F.
17. This summary relies substantially on SLS. For “30 percent” see references below.
18. 16 percent: Storm van Leeuwen (2006a), “Energy from Uranium”, Ceedata Consulting, p 8, now summarised in Oxford Research Group, ed (2006a). See also Storm van Leeuwen (2006), Appendix B, and Oxford Research Group (2006b). The ideal source for this is, when available, will be SVL, Part G).
19. See SVL, Part C5. Note the question-marks.
20. Natural uranium per GW/annum: see Nuclear Fuel Energy Balance Calculator (2007); the approximation used here of 200 tonnes differs from SLS’s 162 tonnes. Global warming potential of HCs: see Bureau of Air Quality (2007). Nuclear reactors do not run continually over their lifetime; so “full-power years” are used as a measure of the time for which a particular reactor is actually producing electricity at full power during its lifetime.
21. The Consultation accepts estimates derived from the Sustainable Development Commission (2006), The Role of Nuclear Power in a Low Carbon Economy, chapter 2, p 22: “The Nuclear Energy Agency, (NEA), Foratom and the International Atomic Energy Authority (IAEA) all agree that nuclear power emits low amounts of carbon – between 2-6 g of carbon equivalent per kWh.” (See p 36 of the SDC report for sources).
22. ISA, University of Sydney (2005), pp 7, 171.
23. ISA, University of Sydney (2005) pp 63-67; Storm van Leeuwen (2006B*).
24. Concrete: AFX News (2007).
25. Storm van Leeuwen (2006B*).
26. However, knowledge of the whole set of emissions from nuclear energy, including GHGs from the solvents, is rudimentary. The ISA report is comprehensive, and includes an impressive critique of other estimates including SLS (pp 55-76), but it is
THE LEAN GUIDE TO NUCLEAR ENERGY 1
1. INTRODUCTION
The main objectives of energy policy must be (1) to achieve a profound
reduction in the release of the gases that are changing the climate, and (2)
to find other ways of maintaining the energy services we need as supplies
of oil and gas decline towards depletion. Nuclear power seems at first
sight to have something to offer here. It does not depend on oil, gas or
coal as its primary fuel.2 It is based on a process which does not, in itself,
produce carbon dioxide. It is concentrated in a relatively small number of
very large plants, so that it fits easily into the national grid. And there is
even the theoretical prospect of it being able to breed its own fuel. So –
what’s the problem?
The question is considered here in the six chapters of this short study,
which is intended as a readable introduction to the nuclear question for
everyone interested in, or involved in, the debate about it. It starts here
with a short description of the principles, explaining what nuclear energy
is. Chapter 2 describes what has to be done in order to derive energy
from uranium. Chapter 3 explains why the nuclear industry is in fact a
substantial source of carbon emissions, and it makes the link with the
problem of uranium depletion and the wider question of the amount of
energy that has to be put into the process to get energy out of it. Chapter
4 asks whether there are alternative sources of the uranium fuel on which
the industry depends, and chapter 5 sets nuclear energy in context with
the energy problem as a whole. Chapter 6 draws conclusions.
Now for the principles. The form of nuclear power available to us at
present comes from nuclear fission, fuelled by uranium. Uranium-235 is
an isotope of uranium with the rare and useful property that, when struck
by a neutron, it splits into two and, in the process, produces more
neutrons. Some of these neutrons then proceed to split more atoms of
uranium-235 in a chain of events which produces a huge amount of
energy. We can get an idea of how much energy it produces by looking at
Einstein’s famous equation, E=mc2, which says that the energy produced
is the mass multiplied by the square of the speed of light. A little bit of
mass disappears – we can think of this as the material weighing slightly
less at the end of the process than at the beginning – and it is that
“missing” mass which turns into energy which can be used to make steam
to drive turbines and produce electricity.

2 THE LEAN GUIDE TO NUCLEAR ENERGY
While other neutrons from the reaction go their separate ways, some go
on to do something very interesting: if one collides with an atom of
uranium-238, one of the other isotopes of uranium, it may stay there,
triggering a couple of decay cycles to form plutonium-239. And
plutonium-239 shares with uranium-235 the property that it, too, splits
when struck by neutrons, so that it begins to act as a fuel as well.3
The process can be controlled; the control is provided by a moderator
consisting of water or graphite, which speeds the reaction up, and by
neutron-absorbing boron control rods, which slow it down. Eventually,
however, the uranium gets clogged with radioactive impurities such as the
barium and krypton produced when uranium-235 decays, along with
“transuranic” elements such as americium and neptunium, and a lot of
the uranium-235 itself gets used up. It takes a year or two for this to
happen, but eventually the fuel elements have to be removed, and fresh
ones inserted. The spent fuel elements are very hot and radioactive
(stand close to them for a second or two and you are dead), so there are
some tricky questions about what to do with them. Sometimes spent fuel
is recycled (reprocessed), to extract the remaining uranium and
plutonium and use them again, although you don’t get as much fuel back
as you started with, and the bulk of impurities still has to be disposed of.
Alternatively, the whole lot is disposed of – but there is more to this than
just dumping it somewhere, for it never really goes away. The half-life of
uranium-238, one of the largest constituents of the waste, is about the
same as the age of the earth: 4.5 billion years.4
Those are the principles. Now for a closer look at what nuclear energy
means. An informed discussion is especially needed, now that James
Lovelock has produced his devastating challenge, arguing that climate
change is so real, so advanced
and potentially so catastrophic
that the risks associated with
nuclear power are trivial by
comparison – and that there is
no alternative. Nuclear
energy, he insists, is the only
large-scale option: it is feasible
and practical; a nuclear
renaissance is needed without
THE LEAN GUIDE TO NUCLEAR ENERGY 43
NOTES AND REFERENCES
1. Radioactivity is a property of minute particles in the dust, food and water which we take into our bodies every day. Some is natural background radiation, released by local rocks, and in most cases our bodies have had millions of years’ practice in coping with them or secreting them. Some radioactive particles, however, products of the fission of uranium, are not just intensely toxic; they are new elements against which our bodies have no defences. For a controversial view of the health impacts of radioactivity, see Busby (1995), chapters 6-7.
2. Note that some 65 percent of global greenhouse gas emissions arise directly from the generation and use of energy. See Stern (2007), executive summary, p iv.
3. Edwards (2004).
4. Institute for Energy and Environmental Research (2005).
5. Lovelock (2006).
6. Storm van Leeuwen and Smith (2007) abbreviated to SLS. Sustainable Development Commission (2006).
7. SVL, Part D5. World Nuclear Association (2007a), “How it works: getting uranium from the ground”.
8. Treatment of tailings and restoration, SVL, Part D6. Considered ideal rather than best practice, ISA, Sydney University (2006), p 98. (In SLS, chapter 4, p 4, there is also the requirement to seal the mine floor with clay).
9. For more detail on the decay products of uranium-238, see Edwards (2004), Section A.
10. World Nuclear Association (2007), “How It Works: Conversion and Enrichment”; also Storm van Leeuwen and Smith (2005), chapter 2.
11. France’s store of 200,000 tonnes, and 8,000 tonnes p.a. addition: Greenpeace (2005): “At the end of 2003, the inventory of the French nuclear waste agency Andra stated that there were 220,000 tonnes of DU stored in France. According to forecasts, this gigantic stock will exceed 350,000 tonnes by 2020 only as a result of enrichment for EDF.” (p 3).
A further 8,000 tonnes exported: Greenpeace (2005): Net annual imports of uranium waste from Europe to Russia are “in excess of 8,000 tonnes” (p 7). This is based on Peter Diehl (2005), “Re-enrichment of West European Depleted Uranium Tails in Russia” Eco Defence (at Appendix 1 of Greenpeace 2005).
Greenpeace (2005) also points out that the trade is illegal: “The Russian legislation prohibits the import of foreign nuclear materials for storage. According to paragraph 3 of article 48 of the federal law of 2001, “On Environmental Protection”, import of nuclear waste and foreign nuclear materials to the Russian Federation for the purpose of its storage or disposal is prohibited.” Ostensibly, the material goes to Russia only for re-enrichment, but the bulk remains and has to be stored as uranium hexafluoride. The transport arrangements are also illegal: the containers are Type 48G, a lower specification than the required IAEA TS-R-1, which is itself grossly inadequate in the case of fire (e.g.) on a container-ship on route from Le Havre to St. Petersburg.

42 THE LEAN GUIDE TO NUCLEAR ENERGY
Storm van Leeuwen (2006B), “Greenhouse Gases from Nuclear”, Appendix B, in Evidence to the IPCC Working Group III, Fourth Assessment Report Draft for Expert Review. (2006B*) is a subsequent revision. For accessible and edited versions of these appendices, see Storm van Leeuwen (2007).
Storm van Leeuwen (2006C), “Breeders”, Appendix C.
Storm van Leeuwen (2006E), “Uranium Resources and Nuclear Energy”, Appendix E.
Storm van Leeuwen (2006E2), “Uranium from Seawater”, Appendix E2.
Storm van Leeuwen (2006F), “Reprocessing”, Appendix F.
Storm van Leeuwen (2007), Jan Willem, Nuclear Power: The Energy Balance”, at http://www.stormsmith.nl/ . Abbreviated in these notes to SAL. At 21/10.2007, only Parts A-D are yet on-line.
Strahan, David (2007), The Last Oil Shock, London: John Murray.
Sustainable Development Commission (2006), (1) The Role of Nuclear Power in a Low Carbon Economy; (2) Is Nuclear the Answer? a commentary by Jonathon Porritt, Chairman, Sustainable Development Commission; (3) Evidence-Based Papers (1-8) – see www.sd-commission.org.uk/
SVL. Abbreviation for Storm van Leeuwen (2007).
Uranium Information Council (2004), “Thorium”, www.uic.com.au/nip67.htm.
Womack, James and Daniel Jones (2003), Lean Thinking, second edition, London: Simon & Schuster.
World Nuclear Association (2007a), at http://www.world-nuclear.org/
World Nuclear Association (2007b), “World Nuclear Power Reactors and Uranium Requirements, http://www.world-nuclear.org/info/reactors.html.
World Nuclear Association (2007c): “Uranium Production Figures (1998-2006), www.world-nuclear.org./info/uprod.html.
World Nuclear Association (2007d), “Thorium”, http://www.world-nuclear.org/info/inf62.html
Zittel, Werner and Jörg Schindler (2006), Uranium Resources and Nuclear Energy, Energy Watch Group, http://www.energyshortage.com/uran/docs2006/REO-Uranium_5-12-2006.pdf (http://tinyurl.com/2uggkd ).
THE LEAN GUIDE TO NUCLEAR ENERGY 3
delay. Well, this is undoubtedly something we need to think about and
decide on; however, that thinking must be firmly based on the practical
realities of the nuclear fuel cycle. We do not need to get involved in the
arcane physics of the nuclear reaction itself, but we do need to know – if
we are to make any sense of this – what the production of electricity from
nuclear power really involves. And who is “we”? It is all of us, scientists
or not: this has to be an informed citizens’ decision.5
The principal source for what follows is the long-sustained programme of
research on the nuclear energy life-cycle by the nuclear engineer Jan
Willem Storm van Leeuwen and the nuclear scientist the late Dr Philip
Smith. Their work, based on total immersion in the literature of the
science and technology of nuclear power, is motivated not by the
intention to make a case either for or against, but to bring the best
available information on the energy balance of the nuclear industry to the
attention of policy makers and into the public debate. This booklet does
not rely exclusively on their research; it refers also to many other studies
such as those of the University of Sydney and the U.K. Sustainable
Development Commission, along with the work of the World Nuclear
Association, the Uranium Information Council, Greenpeace and others.
The quality of data about the nuclear energy cycle is poor, and every study
reflects this in some way; nonetheless, the analysis by Storm van Leeuwen
and Smith, which has benefited from several years of critics’ comments
and answered questions and revisions, provides an exhaustive and well-
researched guide to a sensible view of the future of nuclear energy.6
If there is to be proper and inclusive consultation on the question of
nuclear energy, citizens and their representatives need to be aware of
some of the principles; for instance, they need to be free of popular
misconceptions about the nuclear process producing no carbon dioxide
and being an unlimited source of energy. This gentle tour round the
nuclear life-cycle explains what happens at each stage – and it turns out,
at every stage, to be in trouble. But, as we shall see, a different sort of life
cycle is available – a realistic way forward. It replaces the large-scale,
central, uniform technical fix with small-scale, local judgment. It adapts
to local conditions and enhances skills. It is a life-cycle with promise.

4 THE LEAN GUIDE TO NUCLEAR ENERGY
2. WHAT IS REALLY INVOLVED IN
NUCLEAR ENERGY?
To produce electricity from uranium ore, this is what you have to do.
1. Mining and milling. Uranium is widely distributed in the earth’s crust,
but only in minute quantities, with the exception of a few places where it
has accumulated in concentrations rich enough to be used as an ore. The
main deposits of ore, in order of size, are in Australia, Kazakhstan,
Canada, South Africa, Namibia, Brazil, the Russian Federation, the USA,
and Uzbekistan. There are some rich ores; concentrations of uranium
oxide as high as 10 percent have been found, but 0.2 percent (two parts
per thousand) or less is usual. Most of the usable “soft” (sandstone)
uranium ores have a concentration in the range between 0.2 and 0.01
percent; in the case of “hard” (granite) ore, the usable lower limit is 0.02
percent. The mines are usually open-cast pits which may be up to 250m
deep. The deeper deposits require underground workings and some
uranium is mined by “in situ leaching”, where hundreds of tonnes of
sulphuric acid, nitric acid, ammonia and other chemicals are injected into
the strata and then pumped up again after some 3-25 years, yielding
about a quarter of the uranium from the treated rocks and depositing
unquantifiable amounts of radioactive and toxic metals into the local
environment.7
When it has been mined, the ore is milled to extract the uranium oxide.
In the case of ores with a concentration of 0.1 percent, the milling must
grind up about 1,000 tonnes of rock to extract one tonne of the bright
yellow oxide called “yellowcake”. Both the oxide and the tailings (that is,
the 999 tonnes of rock that remain) are kept radioactive indefinitely by,
for instance, uranium-238, and they contain all thirteen of its radioactive
decay products, each one changing its identity as it decays into the next,
and together forming a cascade of heavy metals with their spectacularly
varied half-lives (see Radioactive Poem opposite).
Once these radioactive rocks have been disturbed and milled, they stay
around. They take up much more space than they did in their
undisturbed state, and their radioactive products are free to be washed
and blown away into the environment by rain and wind. These tailings
ought therefore to be treated: the acids should be neutralised with THE LEAN GUIDE TO NUCLEAR ENERGY 41
nuclear.org/sym/2005/maeda.htm .
Miller, G. Tyler (2000), Living in the Environment: Principles, Connections and Solutions, (eleventh edition), Pacific Grove, CA: Brooks/Cole.
Mudd, Gavin and Mark Diesendorf (2007), “Sustainability Aspects of Uranium Mining: Towards Accurate Accounting?”, Second International Conference on sustainability Engineering and Science, Auckland, 20-23 February http://civil.eng.monash.edu.au/about/staff/muddpersonal/2007-SustEngSci-Sust-v-Uranium-Mining.pdf (http://tinyurl.com/ynsv77 )
NEA/IAEA (2006): Nuclear Energy Association / International Agency, Uranium 2005: Resources, Production and Demand, (the “Red Book”), available from the OECD in Paris.
Executive Summary at http://www.nea.fr/html/general/press/2006/redbook[-] /welcome.html (http://tinyurl.com/23rdxk )
Slide Presentation at http://www.nea.fr/html/general/press/2006/[-] redbook/redbook.pdf (http://tinyurl.com/ysbxbe )
Nicolet, Jean-Paul and Douglas Underhill (1998), “Balancing Needs: Global Trends in Uranium Production and Demand”, IAEA Division of Nuclear Fuel Cycle and Waste Technology, at http://f40.iaea.org/worldatom/Periodicals/Bulletin[-] /Bull401/article4.html. (http://tinyurl.com/2scmcl )
Nielsen, Rolf Haugaard (2006), “Final Resting Place”, New Scientist, No 2541, 4 March, pp 38-41.
Nuclear Fuel Energy Balance Calculator (2007) at http://www.wise-uranium.org/nfce.html .
Oxford Research Group, ed (2006a), Storm van Leeuwen, “Energy Security and Uranium Reserves”, Factsheet 4, at http://www.oxfordresearchgroup.org.uk/[-] publications/briefing_papers/energyfactsheet4.php (http://tinyurl.com/2ntqkt ).
Oxford Research Group, ed (2006b), Storm van Leeuwen, “Energy from Uranium”, http://www.stormsmith.nl/publications/Energy%20from%20Uranium%20-%20July%202006.pdf (http://tinyurl.com/3atnrd )
Pearce, Fred (2006), The Last Generation, Eden Project.
Rio Tinto (2005), “Increase in Ranger Mine’s Reserves and Resources”, (press release), http://www.riotinto.com/documents/Media/PR444g_ERA_Increase_[-] in_Ranger_mine_reserves_resources.pdf (http://tinyurl.com/yrb59c )
SLS. Abbreviation for Jan Willem Storm van Leeuwen and Philip Smith (2005).
Stern, Nicholas (2007), The Economics of Climate Change,http://www.hm-treasury.gov.uk/independent_reviews/stern_review_economics_climate[-] _change/stern_review_report.cfm . (http://tinyurl.com/ye5to7 ).
Storm van Leeuwen, Jan Willem and Philip Smith (2005), Nuclear Power: The Energy Balance”, at http://www.stormsmith.nl/ . This is being revised and replaced by Storm van Leeuwen (2007), but the original is still available on this site. Abbreviated in these notes and references to SLS.
Maeda, Haruo (2005), The Global Nuclear Fuel Market: Supply and Demand to 2030, World Nuclear Association Symposium 2005, http://www.world-

40 THE LEAN GUIDE TO NUCLEAR ENERGY
http://energybulletin.net/33164.html.
Dzhakishev, Moukhtar (2004), “Uranium Production in Kazakhstan as a Potential Source for Covering the World Uranium Shortage”, World Nuclear Association, at http://www.world-nuclear.org/sym/2004/dzhakishev.htm.
Edwards, Gordon (2004), “Health and Environmental Issues Linked to the Nuclear Fuel Chain”, Section A: Radioactivity, at www.ccnr.org/ceac_B.html .
First Uranium Corporation (2007), Annual Information Form at http://www.firsturanium.com/downloads/2007_annual_information_form.pdf (http://tinyurl.com/28xmy8 ).
Fleming, David (2007), Energy and the Common Purpose: Descending the Energy Staircase with Tradable Energy Quotas (TEQs), third edition, London: The Lean Economy Connection, www.teqs.net.
Greenpeace (2005), International Briefing Paper (18th November), “Europe’s Radioactive Secret: How EDF [Électricité de France] and European nuclear utilities are dumping nuclear waste in the Russian Federation”, at http://www.greenpeace.[-] org/international/press/reports/european-rad-secret. (http://tinyurl.com/2adgea ).
Grimston, Malcolm (2005), Memorandum to the Select Committee on Environmental Audit, U.K. House of Commons.
Huwyler, S., L. Rybach and M. Taube (1975), “Extraction of uranium and thorium and other metals from granite”, EIR-289, Technical Communications 123, Eidgenossische Technische Hochschule, Zurich, September, tr. Los Alamos Scientific Laboratory, LA-TR-77-42, 1977), cited in Storm van Leeuwen (2006E).
Institute for Energy and Environmental Research (2005), Uranium Fact Sheet at http://www.ieer.org/fctsheet/uranium.html [sic - the typo may have been corrected by the time you read this].
International Energy Agency (2007), Key World Energy Statistics, http://www.iea.org/textbase/nppdf/free/2007/key_stats_2007.pdf (http://tinyurl.com/2vqztn )
International Atomic Energy Agency (2001), Analysis of Atomic Energy Supply to 2050, at http://www-pub.iaea.org/MTCD/publications/PDF/Pub1104_scr.pdf.
ISA, University of Sydney (2005), Life-Cycle Energy Balance and Greenhouse Gas Emissions of Nuclear Energy in Australia, University of Sydney, at http://www.pmc.gov.au/publications/umpner/docs/commissioned/ISA_report.pdf (http://tinyurl.com/2omtaq )
King, David (2004), “Global Warming, the science of climate change, the imperatives for action”, Greenpeace Business Lecture, Royal Society of Arts, 12 October.
Lean Economy Connection (2007), www.theleaneconomyconnection.net/links.html
Lidsky, Lawrence M., and Marvin M. Miller (1998), “Nuclear Power and Energy Security: A Revised Strategy for Japan”. (Website no longer available).
Lovelock, James (2006), The Revenge of Gaia, London: Penguin.
THE LEAN GUIDE TO NUCLEAR ENERGY 5
limestone and made insoluble with
phosphates; the overburden of rock covering
the ore strata should be replaced and the area
should be replanted with indigenous
vegetation. In fact, all this is hardly ever
done, and it is regarded as an ideal rather
than a requirement of best practice. It would
require some four times the energy needed to
mine the ore in the first place.8
2. Preparing the fuel. The uranium oxide
(U3O8) then has to be enriched. Natural
uranium contains about 0.7 percent uranium-
235; the rest is mainly uranium-234 and -
238, neither of which directly support the
needed chain reaction. In order to bring the
concentration of uranium-235 up to the
required 3.5 percent, the oxide is reacted with
fluorine to form uranium hexafluoride (UF6),
or “hex”, a substance with the useful property
that it changes – sublimes – from a solid to a
gas at 56.5°C, and it is as a gas that it is fed
into an enrichment plant. About 85 percent
of it promptly comes out again as waste in the
form of depleted uranium hexafluoride, known as “enrichment tails”.10
Some of that waste is converted into depleted uranium metal, some of
which is in turn sometimes distributed back into the environment via its
use in armour-piercing shells, but most of it is stored as enrichment tails
in the form of gas. It reacts violently or explodes on contact with water
(including water vapour in the air), so it ought to be transferred from its
temporary containers to steel and concrete containers and buried in
geological repositories. In fact, most is put on hold: each year, about
8,000 tonnes are added to France’s store of 200,000 tonnes of depleted
uranium, and a further 8,000 tonnes are exported from Europe to
Russia.11
The 15 percent which emerges as enriched uranium is then converted into
ceramic pellets of uranium dioxide (UO2), packed in zirconium alloy
tubes, and bundled together to form fuel elements for reactors.12
RADIOACTIVE POEM
The decay sequence of
uranium-2389
The sequence starts with
uranium-238. Half of it
decays in 4.5 billion years,
turning as it does so into
thorium-234 (24 days),
protactinium-234 (one
minute), uranium-234
(245,000 years), thorium-
230 (76,000 years),
radium-226 (1,600 years),
radon-222 (3.8 days),
polonium-218 (3 minutes),
lead-214 (27 minutes),
bismuth-214 (20 minutes),
polonium-214 (180
microseconds), lead-210
(22 years), bismuth-210 (5
days), polonium-210 (138
days) and, at the end of the
line, lead-206 (non-
radioactive).
Déry, Patrick, and Bart Anderson (2007), “Peak Phosphorus”, Energy Bulletin,

6 THE LEAN GUIDE TO NUCLEAR ENERGY
3. Generation. The fuel can now be used to produce heat to raise the
steam to generate electricity. In due course the process generates waste
in the form of spent fuel elements and, whether these are then
reprocessed and re-used or not, eventually they have to be disposed of.
But first they must be allowed to cool off in ponds to allow the isotopes to
decay to some extent, for between 10 and 100 years – sixty years may be
taken as typical. The ponds need a reliable electricity supply to keep them
stirred and topped up with water to stop the radioactive fuel elements
drying out and catching fire. In due course, these wastes will need to be
packed, using remotely-controlled robots, into very secure canisters lined
with lead, steel and pure electrolytic copper, in which they must lie buried
in giant geological repositories considered to be stable. It may turn out in
due course that there is one best solution, but there will never be an ideal
way to store waste which will be radioactive for a thousand centuries or
more and, whatever option is chosen, it will require a lot of energy. For
example, the energy needed over the lifetime of a reactor to manufacture
the canisters (each weighing more than ten times as much as the waste
they contain), and to make the electrolytic copper, has never been
verified, but it is estimated to be about equal to the energy needed to
build the reactor in the first place.13
A second form of waste produced in the generation process consists of the
routine release of very small amounts of radioactive isotopes such as
hydrogen-3 (tritium), carbon-14, plutonium-239 and many others into
the local air and water. The significance of this has only recently started
to be recognised and investigated.14
A third, less predictable, form of waste occurs in the form of emissions
and catastrophic releases in the event of accident. The nuclear industry
has good safety systems in place; it must, because the consequences of an
accident are so extreme. However, it is not immune to accident. The
work is routine, requiring workers to cope with long periods of tedium
punctuated by the unexpected, along with “normality-creep” as anomalies
become familiar. The hazards were noted in the mid-1990s by a senior
nuclear engineer working for the U.S. Nuclear Regulatory Commission: “I
believe in nuclear power but after seeing the NRC in action, I’m
convinced a serious accident is not just likely, but inevitable... They’re
asleep at the wheel.” Every technology has its accidents; indeed, the
Nuclear Regulatory Commission estimates the probability of meltdown in
THE LEAN GUIDE TO NUCLEAR ENERGY 39
SOURCES
AFX News 2007), “TVO says won’t share nuclear reactor cost overruns with Areva”, at http://www.forbes.com/markets/feeds/afx/2007/09/28/afx4165822.html (http://tinyurl.com/2w2kl4 ).
Areva (2007a), “The first generation III+ reactor currently under construction”, at http://www.areva-np.com/scripts/info/publigen/content/templates/show.asp?[-] P=1655&L=US&SYNC=Y (http://tinyurl.com/y557hh ).
Areva (2007b) Presentations: “Business and Strategy Overview” http://www.areva.com/servlet/BlobProvider?blobcol=urluploadedfile&blobheader=application%2Fpdf&blobkey=id&blobtable=Downloads&blobwhere=1141726537731&filename=Overview+July+2007.pdf (http://tinyurl.com/3y855b ). (Reference became unavailable at 25/10/07).
Australia Uranium Association (2007), “Australia’s Uranium Mines”, www.uic.com.au/emine.htm.
BHP Billiton (2007), Annual Report, at http://www.bhpbilliton.com/bbContent[-] Repository/bhbpannualreport07.pdf (http://tinyurl.com/26f2mz )
Boyle, Godfrey (2004), Renewable Energy, Oxford.
Bunn, Matthew (2003), “Reducing Excess Stockpiles”, Nuclear Threat Initiative (NTI), www.nti.org/e_research/cnwm/reducing/heudeal.asp
Bureau of Air Quality (2007), “Greenhouses Gases and their Global Warming Potential Relative to CO2” at www.state.me.us/dep/air/emissions/ghg-equiv.htm .
Busby, Chris (1995), Wings of Death, Aberystwyth: Green Audit.
Busby, John (2006), “Rip van Winkel Wakes”, http://www.sandersresearch.com/index.php?option=com_content&task=view&id=993&Itemid=105). http://tinyurl.com/2lkbml ).
Busby, John (2007a), “A Little Makes a Lot?” http://www.sandersresearch.com/index.php?option=com_content&task=view&id=1300&Itemid=105. (http://tinyurl.com/35gunk )
Busby, John (2007b), “An Even Bigger Hole”, http://sandersresearch.com/index.php?option=com_content&task=view&id=1323&Itemid=103 (http://tinyurl.com/35pefj).
Cameco’s website: www.cameco.com.
Canadian Nuclear (2007), FAQ at http://www.nuclearfaq.ca/cnf_sectionG.htm .
Collell, Marcel Coderich (2005), “The Nuclear Mirage and the World Energy Situation”, Real Instituto Elcano, http://www.realinstitutoelcano.org/analisis/925.asp.
Committee Examining Radiation Risks of Internal Emitters (CERRIE), (2004), Report, at www.cerrie.org.
Committee on Radioactive Waste Management (July 2006), “Managing Our Radioactive Waste Safely”, Final Report 31/7/06. www.corwm.org.uk.

38 THE LEAN GUIDE TO NUCLEAR ENERGY
THE LEAN GUIDE TO NUCLEAR ENERGY 7
the U.S. in a twenty-year period as between 15-45 percent. The risk never
goes away; society bears the pain and carries on but, in the case of nuclear
power, there is a difference: the consequences of a serious accident –
another accident on the scale of Chernobyl, or greater, or much greater –
would take nuclear power towards being an uninsurable risk, even with
the help of government subsidies for the premiums.15
And a by-product of this – “waste” in the fourth sense – is the plutonium
itself which, when isolated and purified in a reprocessing plant, can be
brought up to weapons-grade, making it the fuel needed for nuclear
proliferation. This is one of three ways in which the industry is the
platform from which the proliferation of nuclear weapons can be
developed; the second one is by enriching the uranium-235 to around 90
percent, rather than the mere 3.5 percent required by a reactor. The third
consists of providing a source of radioactive materials which can be
dispersed using conventional explosive - a “dirty bomb”.
4. The reactor. Nuclear reactors at present have a lifetime of about 30-
40 years, but produce electricity at full power for no more than 24 years;
the new European Pressurised Water Reactors (EPR), it is claimed, will
last longer. During their lifetimes, reactors have to be maintained and (at
least once) thoroughly refurbished; eventually, corrosion and intense
radioactivity make them impossible to repair. Eventually, they must be
dismantled, but experience of this is limited. As a first step, the fuel
elements must be put into storage; the cooling system must be cleaned to
reduce radioactive corrosion residuals and unidentified deposits (CRUD).
These operations, together, produce about 1,000 m3 of high-level waste.
After a cooling-off period which may be as much as 50-100 years, the
reactor has to be dismantled and cut into small pieces to be packed in
containers for final disposal. The total energy required for
decommissioning has been estimated at approximately 50 percent more
than the energy needed in the original construction.16

8 THE LEAN GUIDE TO NUCLEAR ENERGY
3. GREENHOUSE GASES, ORE QUALITY
AND URANIUM SUPPLY
Greenhouse gases
Every stage in the life-cycle of nuclear fission uses energy, and most of
this energy is derived from fossil fuels. Nuclear power is therefore a
substantial source of greenhouse gases. The delivery of electricity into the
grid from nuclear power produces, at present, roughly one third as much
carbon dioxide as the delivery of the same quantity of electricity from
natural gas...17
... or, rather, it would do so, if the full energy cost of producing electricity
from uranium were counted in – including the energy cost of all the
waste-disposal commitments (chapter 2). Unfortunately (in part because
of the need to allow high-level waste to cool off) that is not the case.
Nuclear waste-disposal is being postponed until a later date. This means
that the carbon emissions associated with nuclear energy look rather
good at the moment: at about 60 grams per kWh they are approximately
16 percent of the emissions produced by gas-powered electricity
generation. The catch is that this figure roughly doubles when the
energy-cost of waste-disposal is taken into account, and it grows
relentlessly as the industry is forced to turn to lower-grade ores. What
lies ahead is the prospect of the remaining ores being of such poor quality
that the gas and other fossil fuels used in the nuclear life-cycle would
produce less carbon dioxide per kilowatt-hour if they were used directly
as fuels to generate electricity.18
Carbon dioxide is not the only greenhouse gas released by the nuclear
industry. The conversion of one tonne of uranium into an enriched form
requires the addition of about half a tonne of fluorine, producing uranium
hexafluoride gas (hex) to be used in the centrifuge process. At the end of
the process, only the enriched fraction of the gas is actually used in the
reactor: the remainder, depleted hex, is left as waste. Not all of this gas
can by any means be prevented from escaping into the atmosphere, and
most of it will eventually do so unless it is packed into secure containers
and finally buried in deep repositories.19
It is worth remembering here, first, that to supply enough enriched fuel
for a standard 1GW (1 gigawatt = 1 billion watts) reactor for one full- THE LEAN GUIDE TO NUCLEAR ENERGY 37
not a good way of involving the public. It is only when we are free of such
narcotic fallacies that there will be a commitment to the one option for
which there is a prospect of success: tapping the energy of the people.
We have to integrate energy, economics and society, and to enable them
to develop in a way which copes with the reality of the energy gap that is
now almost upon us. That calls for an effective framework which makes it
clear to all of us – citizens, firms, the government, everyone – what the
energy limits are now, and achieves an orderly descent to the low limits
that will apply in the future. It is then up to us to bring all the skill,
ingenuity and judgment we can to negotiating our way down the energy
descent. We need to discover a common purpose. All this is possible if
there is an appropriate framework for it, a system in which individual
motivations are aligned with the collective need. There are various names
for it. One of them is Tradable Energy Quotas (TEQs).
We need to enable small-scale actions to build up onto a scale that gets
results; we need a robust, simple, system for recruiting ingenuity and
intelligence, and the common purpose to make it happen now. Such a
design exists. There is a non-nuclear life-cycle ready and waiting.81

36 THE LEAN GUIDE TO NUCLEAR ENERGY
depletion in this booklet, it is climate change that may
well set the final date for completion of the massive and
non-negotiable task of dealing with nuclear waste.
Many reactors are in low-lying areas in the path of
rising seas; and many of the storage ponds, crowded
with high-level waste, are close by. Estimated dates for steep rises in sea
levels are constantly being brought forward. With an angry climate, and
whole populations on the move, it will be hard to find the energy, the
funds, the skills and the orderly planning needed for a massive
programme of waste disposal – or even moving waste out of the way of
rising tides. When outages in gas supplies lead to break down in
electricity supplies, the electrical-powered cooling systems that stop high-
level waste from catching fire will stop working. It will also be hard to
stop ragged armies, scrambling for somewhere to live, looting spent fuel
rods from unguarded dumps, attaching them to conventional explosives,
and being prepared to use them.
All this will have to be dealt-with, and at speed. There may be no time to
wait for reactor cores and high-level wastes to cool down. But, then, it
may be a frank impossibility to bury them until they have cooled down...
In any event, the task of making those wastes safe should be an
unconditional priority, equal to that of confronting climate change itself.
The default-strategy of seeding the world with radioactive time-bombs
which will pollute the oceans and detonate at random intervals for
thousands of years into the future, whether there are any human beings
around to care about it or not, should be recognised as off any scale
calibrated in terms other than dementia.
Nuclear power is the energy source that claims a significance and causes
trouble far beyond the scale of the energy it produces. It is a distraction
from the need to face up to the coming energy gap, to inform the public
and to call on the wit and energy which is available to develop a
programme of Lean Energy. Of the many shortcomings in the response
to energy-matters, a central one has been the failure to involve the public
in doing what it could, given a chance, be good at – inventing solutions
and making them happen in realistic local detail. Determined attempts
are being made to rectify this (the U.K. Government’s Climate Change
Communication Initiative is an example) but the construction of nuclear
reactors, presented as almost carbon-free fixes for the energy problem, is THE LEAN GUIDE TO NUCLEAR ENERGY 9
power year, about 200 tonnes of
natural uranium has to be
processed. Secondly, hex is a
halogenated compound (HC),
one of several that are used at
various stages of the cycle. HCs
are potent greenhouse gases.
The global warming potential of
freon-114, for instance, is nearly
10,000 times greater than that
of the same mass of carbon
dioxide.20
There is no published data on
releases of HCs from nuclear
energy. There must be a
suspicion that they reduce any
advantage over fossil fuels
which the nuclear power
industry enjoys at present in the
production of greenhouse gases.
Given the unfounded but
popular presumption that
nuclear energy is carbon-free, it
would be helpful if a reliable
study of all releases of
greenhouse gases from the
nuclear fuel cycle, and their
effect on the atmosphere, were
commissioned and published
without delay.
Ore quality
Both the quantity of greenhouse
gases released by nuclear energy
per kilowatt hour and the net
energy return of the nuclear
industry are determined
GREENHOUSE GAS EMISSIONS
By stage in the nuclear cycle
Estimates for the release of carbon dioxide from the nuclear cycle vary widely. The U.K. Government’s 2007 Nuclear Power Consultation accepts estimates that, across its whole life-cycle, nuclear power emits between 7 and 22 g/kWh,21 but empirical analysis of the energy intensity and carbon emissions at each stage of the nuclear cycle produces much higher figures. This is shown (for instance) in the Integrated Sustainability Analysis (ISA) by The University of Sydney, which concludes that the greenhouse gas (GHG) intensity of nuclear power varies within the range 10-130≈60 g/kWh.22 The estimate (below) by Storm van Leeuwen and Smith (SLS) is higher because it reflects best practice, which may be better than standard good practice, especially for waste treatment and disposal, and because the reality of errors and problems in the nuclear cycle typically raises the energy cost well beyond the planned level.23 A recent example of this is the construction of the new Olkiluoto reactor in Finland, where (owing to trial and error) much of the concrete has to be re-laid, raising the carbon emissions associated with the project well beyond the intention.24
The assumed reactor lifetime is 30 full-power years; the ore grade is 0.15 percent; at lower grades, emissions would rise sharply. SLS covers just CO2.25 ISA’s estimate includes all GHG emissions from the nuclear cycle.26 GHG emissions gas-fired electricity generation are about 450 g/kWh.27
OPERATION Construction Front end28 Back end28 Dismantling Total
CO2 g/kWh 12-35 36 17 23-46 88-134

10 THE LEAN GUIDE TO NUCLEAR ENERGY
primarily by the quality (grade) of uranium ore that is being used. The
lower the grade of ore, the more energy is needed to mine and mill it and
to deal with the larger quantity of tailings. The limit, in theory, is reached
with an ore grade of about 0.01 percent for soft rocks such as sandstone,
and 0.02 percent for hard rocks such as granite. If grades lower than
those limits were to be used, more carbon dioxide per kilowatt hour
would be produced by the nuclear cycle than by the same amount of
energy produced from gas. The energy return on energy invested (EREI)
would be less than the energy return you would get if you generated the
electricity directly in a gas turbine.29
But these are only “theoretical” limits, because in practice the turning-
point to a negative energy return may be substantially sooner than that.
There are five key reasons why ore which is theoretically rich enough to
give a positive EREI may in fact not be rich enough to justify exploitation:
to yield a practical return on energy investment (PREI), a grade of ore is
needed which is substantially higher than the 0.01/0.02 percent
identified as the lower limits for a theoretical return. These “PREI
factors” are as follows:
PREI FACTORS
1. Deep deposits. Deposits at great depth, requiring the removal of massive
overburden, or the development of very deep underground mines, require
more energy to mine the resource than is required by the shallower mines
now being exploited. It is virtually certain that all uranium deposits near
the surface have already been discovered, so any deposits discovered in
the future will be deep.30
2. Water. You can have too little water (it is needed as part of the process of
deriving uranium oxide from the ore) or too much (it can cause flooding).
Some of the more promising mines have big water problems.31
3. A trivial contribution. If the EREI of an energy project is only slightly
positive, the problem is that you get so little energy back that it can never
make a useful contribution to meeting demand: even with a vast industry
and inputs of resources and land, you still cannot derive energy in useful
amounts.
4. An investment that may not be available. The poorer ores of the future
will have to be derived from extremely large mines, which will require
many years of investment before they produce any payback at all. There
THE LEAN GUIDE TO NUCLEAR ENERGY 35
o If it is 2010, the whole of the energy produced by the industry over its
remaining life of 30 years must be directed into clearing up its own
wastes, starting now.
o If it is 2025, the industry has some fifteen years before the onset of
energy bankruptcy.
o If it is 2095, we are looking at an industry facing, in 85 years time, an
inheritance 0f waste whose treatment will demand a flow of energy
equal to some 115 years of electricity output – and with no electricity
left over to sell.
In other words, the greater the estimate of remaining reserves, the longer
the period of energy debt. In the event of the recklessly optimistic
estimate of there being 200 years uranium remaining with a positive
PREI, the last 115 years of the nuclear industry’s operation would be
committed to paying back its energy debt, dealing with the backlog of
wastes, and with the large accumulation of its new wastes accrued during
the final 200 years of its life. An energy debt on this scale is scarcely good
news. Nor is the financial debt that would go with it.
With some justice, the nuclear industry could point out that the task of
dealing with its wastes has already started, and that high-level waste has
to be allowed to cool off. An experimental deep repository for high-level
waste has been excavated in Sweden; Finland has started on a real one at
Olkiluoto; plans to build one in Nevada are being debated; and research is
being done into ways of dealing with uranium hexafluoride. And yet, the
questions of where exactly it will go, who will take responsibility for the
waste held in deteriorating stockpiles in unstable regions, how to pay for
it and, above all, where the energy will come from, remain unanswered.
Meanwhile, the industry continues to add to the problem. And suitable
sites – stable, preferably dry, and enjoying the support of the local
population – are rare; the vast size of a permanent repository, the
technical difficulty, the energy needed and the cost all bring this massive
task of long-term disposal to the edge of what is possible. It may in fact
never be possible to find a permanent resting-place for all, or even for a
decent proportion, of the waste that has already been produced.
The nuclear industry should therefore focus on finding solutions to the
whole of its waste problem before it becomes too late to do so. And hold
it right there, because this is perhaps the moment to think about what
“too late” might mean. Notwithstanding the emphasis placed on

34 THE LEAN GUIDE TO NUCLEAR ENERGY
We have, then, four dates for the turning-point at which the industry will
never be able to supply the energy needed to get rid of its own wastes:
that is, energy-bankruptcy: 2000, 2010, 2025 and 2095.
o If it is 2000, the industry is already deep into its energy-bankruptcy. It
will never be able to get rid of its own waste from its own resources.
There is the prospect of having to call on the supplies of fossil fuel
energy, at a time of deepening scarcity, to deal with the nuclear waste
which the waning nuclear industry cannot clear up.
ENERGY BALANCE SHEET:
YEARS OF NET NUCLEAR ENERGY REMAINING FROM 2010 at current rates of extraction.
(Assumed start-date for industry 1950. Assumed present 2010. Numbers in years)
1. Estimate: years of positive PREI ore remaining 10 30 60 200
2. Front-end process energy (25% of remaining years) 2.5 7.5 15 50
3. Energy to clear new waste (25% of remaining years) 2.5 7.5 15 50
4. Energy to clear old waste (25% of past 60 years) 15 15 15 15
5. Total needed for front end plus back end (2+3+4) 20 30 45 115
6. Years remaining (1-5) -10 0 15 85
7. Year of energy-bankruptcy: all energy produced is 2000 2010 2025 2095
Suppose the industry, starting with no waste, has 200 years before its usable ore runs out. During that time, it generates a gross amount of energy which it feeds into the grid, but at the same time it must (a) provide the energy needed for its own front-end operation, (b) pay back the energy it used to mine its ore, build its reactors, etc., and (c) clear up its own wastes. As explained in chapter 3, pp 17-18, each of these amount to about 25 percent of its gross energy output. Therefore that amount – 75 percent of its gross output, must be subtracted to find the number of years for which the industry can continue before using the whole of its output to pay back its energy debt and clear up its wastes.
There are other ways in which this could be calculated – for instance, using net output (gross output less the front-end energy cost factored in over time); or the back-end work could start sooner. These would tell slightly different stories, but they would be equally valid. The method shown in the table is a reminder that the industry actually supplies less energy (net) than the gross energy that it puts into the grid. At a time of energy scarcity, this is a key consideration. And it tells us how long the industry has left before waste-disposal becomes the reason for its existence.
THE LEAN GUIDE TO NUCLEAR ENERGY 11
has to be some doubt as to whether, in the difficult years following the oil
peak, that scale of long-term financial investment will be available. This
is particularly doubtful in view of the fact that nuclear energy is really
suitable only for centralised electricity grids – which are likely to become
increasingly obsolete in the future as supplies of natural gas (for
generating grid electricity) become scarce and less reliable, and as the
cost-effective alternative of improving energy efficiency locally is
advanced with all speed under pressure of need.32
5. Local geological conditions. Practical local difficulties, such as flooding,
can be expected to increase as deeper and more remote mines are
exploited.
What all of this means is that an energy source – such as uranium ore –
ceases to be useful well before it actually reaches the point where the
theoretical return on energy invested – TREI – turns negative. It is the
practical return on energy invested – PREI – that matters. So, where
does the practical turning point lie, below which the ore quality is too
poor to be useful? We know that this varies with local conditions; we
know that uranium ores as poor as 0.03 percent are being mined now –
but only as a by-product in mines being exploited with other minerals; we
know that this will be a matter of perpetual debate; and we know that the
average ore grade being worked worldwide is at present about 0.15
percent.33 But for a worldwide average above which uranium ore can still
provide a positive PREI, a suggested guideline is no lower than 0.1
percent.34
Uranium supply
So – how much uranium ore with a positive PREI do we have left?
The “Red Book” is the most authoritative source on the quantity and
quality of the remaining uranium ore, and of future prospects for
production. It is prepared by the OECD Nuclear Energy Agency (NEA) in
partnership with the International Atomic Energy Agency (IAEA), and
the 2005 edition was published in June 2006.35 In its discussion of the
availability of usable uranium ore, it suggests that there is 70 years’
supply at the current price.36 It adds, however, that, when “prognostic-
ated and speculative” resources are added in, there is enough to maintain
current output for a further 270 years. 37
Storm van Leeuwen and Smith acknowledge that there is more uranium
needed to dispose of new and old waste (6+2010)

12 THE LEAN GUIDE TO NUCLEAR ENERGY
ore to be discovered, and that there are massive quantities of uranium in
the ground, but argue that the quality of the ore remaining after 60 years
of further extraction is likely to be too poor to yield a positive TREI.38
We have, then, two rather similar estimates – 70 years and 60 years – but
one of them then adds prognosticated and speculative reserves to give us
270 years supply at current rates; the other sees no evidence that the
prognosticated and speculative reserves would in fact give us a positive
TREI. Does this leave us in total confusion as to which to believe? Not
quite. As we know, from experience of the parallel case of peak oil, the
official agencies – in the case of oil, the United States Geological Survey
and the International Energy Agency – have a strong and now widely
acknowledged tendency for massive bias towards exaggerating future
prospects. 39 Prognosticated and speculative reserves, if they exist, will be
deep below the surface, requiring very large investments of time, capital
and energy before they can be exploited. Those speculative resources –
which the NEA hopes will one day becomes usable reserves – will need to
be remarkably rich, relative to the vast deposits of very low-grade and
useless ore of which we are already aware. That is, we know enough to err
on the safe side and stick to the demonstrable 60-70 year estimate of
remaining ore with a positive TREI, on which the NEA and Storm van
Leeuwen and Smith are agreed...
... and yet, let us look again at what that 60/70-year estimate really
means. Both the NEA and the Storm van Leeuwen and Smith estimates
contain assumptions which tend to exaggerate the time remaining before
depletion. First, both estimates are “reserves-to-production ratios” –
current reserves simply divided by current annual production, which
gives the misleading impression that production can continue at a
constant rate before coming to an abrupt stop. In fact, it is well
understood that, after reaching a peak well before the artificial cut-off
point given by the reserves-to-production ratio, production of a resource
in its latter years takes its time to decline towards zero; it is in the years
closely following the peak that the trouble starts, not in the year when
production finally comes to a stop.
Secondly, the growth in demand for uranium which the nuclear industry
seems to expect would, in any case, foreshorten the whole sequence: if 70
years is a relevant guideline for the creation of reserves if usage remains
constant, a likely cut-off point on the assumption of increasing demand is THE LEAN GUIDE TO NUCLEAR ENERGY 33
6. IT’S TIME TO TURN TO THE WIT AND
ENERGY OF THE PEOPLE
The strategic matters discussed in chapter 5 are important, but it is the
waste problem which is decisive. There is a turning-point when the
nuclear industry will become energy-bankrupt, if it has not already done
so. After that, it will never be able to generate the energy needed for
permanent disposal of its backlog of waste, even if it diverts its whole
energy output into the task.
This prospect needs to be researched urgently and by more than one
research centre with the authority to get at the facts, but otherwise
working independently of industry or government interests. Research
should also, with all speed, get evidence about the global warming and
ozone impacts of uranium hexafluoride and other solvents, both in use
and as leaking waste. And here is a hypothesis to which we need an
answer at some speed: if the worldwide backlog of nuclear wastes were
simply left to leak, catch fire and spread into the environment, the
resulting levels of radiation and toxicity would in principle require the
evacuation of the planet. True, or not?
Waste and depletion are two aspects of the same problem. For the timing
of depletion, we will consider four estimates, starting with one which
suggests that the industry will not recover from the 2011-2020 outages,
giving an estimate of 10 years before the industry ceases to be a
significant producer of electrical power owing to depletion of uranium
giving a positive practical return on energy invested (PREI). The second
estimate suggests that the industry does recover from the coming outages
and continues as an energy producer at roughly current rates for 30 years.
Thirdly, we take the estimate discussed in chapter 3, which has a time-
horizon of 6o years. Fourthly, let us suppose that this present analysis is
completely misguided, and that the industry will continue on its present
scale for another 200 years.
These estimates are now brought together with the estimates of the net
energy yielded by the nuclear industry, after the costs of the front-end
processes (procuring the fuel and producing energy from it) and back-end
processes (dismantling reactors and dealing with wastes) are taken into
account. They are summarised in the Energy Balance Sheet.

32 THE LEAN GUIDE TO NUCLEAR ENERGY
What appears to follow from this is a best-of-both-worlds strategy: to
develop nuclear energy as far as the uranium supply allows, and at the
same time to develop Lean Energy. But the problem is that the two
strategies are substantially incompatible. A dash for nuclear energy
would reduce the funds and other resources, and the concentrated focus,
needed for Lean Energy. Nuclear energy relies on the existence of a fully-
powered-up grid system into which it can feed its output of electricity –
but the grid itself is mainly powered by the electricity from gas-fuelled
power stations, so that if gas supplies were to be interrupted, the grid
would (at least partially) close down, along with the nuclear reactors that
feed into it; Lean Energy, on the other hand, is flexibly organised around
local minigrids.
Nuclear energy inevitably brings a sense of reassurance that, in the end,
the technical fix will save us; Lean Energy calls on the whole range of
technology from the most advanced to the most labour-intensive, along
with adaptations in behaviour, in the economy, in the use of land and
distance, in the way food is grown and materials are used, and in the
sinews and culture of society itself. Nuclear energy’s potential
contribution to energy services in the future, starting from its present
level of 2½ percent of final energy demand, is small; the potential for
Lean Energy is at least twenty times greater. Nuclear energy is about
conserving the bankrupt present; Lean Energy is about inventing and
building a future that works.80
For these reasons, the best-of-both-worlds strategy of backing both
nuclear energy and Lean Energy could be expected to lead to worst-of-
both-worlds consequences. Lean Energy would be impeded by nuclear
energy; nuclear energy would be hopelessly ineffective without Lean
Energy. Result: paralysis. This should not be overstated: a few token
nuclear reactors to replace some of those that are about to be retired
would make it much harder to develop Lean Energy with the single-
minded urgency and resources needed, without necessarily ruling out
progress towards it entirely. But the defining reality of the energy future
has to be an acknowledgment that no large-scale technical fix is available.
Energy cannot any longer be delegated to experts. The future will have to
be a collective, society-transforming effort.
THE LEAN GUIDE TO NUCLEAR ENERGY 13
probably closer to 35 years.
Thirdly, both estimates are of the TREI limits, not the much earlier
turning-point to negative PREI.
These three factors bring forward the period during which deep deficits in
uranium supply can be expected, to the decade 2011-2020.
Supply crunch
And, indeed, there is a widely-shared recognition that there will be a
severe shortage of uranium around 2013. This is frankly acknowledged
by the NEA itself, and set in context by the First Uranium Corporation.40
Here are the reasons (remember that the numbers are approximations).
At present, about 65,000 tonnes of natural uranium are consumed each
year in nuclear reactors worldwide.41 The number of reactors in existence
in 2013 will be the product of (1) retirements of old reactors and (2) start-
ups of new ones. There is no basis for a reliable estimate of what that net
number will be, so we will assume that there is no change from the
present.42
About 40,000 tonnes of this total demand of 65,000 tonnes are supplied
from uranium mines, which leaves the remaining 25,000 tonnes to be
supplied from other sources.43 10,000 tonnes comes from “military
uranium” – that is, from the highly-enriched uranium salvaged from
nuclear weapons, chiefly from the arsenal which the Soviet Union built up
during the Cold War, and which is now being dismantled with the help of
subsidies from the United States. The remaining 15,000 tonnes comes
from a range of “secondary supplies”, consisting of inventories of
uranium fuel that have been built up in the past, together with recycled
mine tailings and some mixed-oxide fuel (MOX), a mixture of recycled
plutonium and depleted uranium.44
The expectation is that neither of these crucial supplements to mined
uranium have much longer to last. Military uranium is being depleted
rapidly. At present, it is sold to the United States by Russia on a supply
contract which expires in 2013. It is a blend of highly-enriched uranium
(HEU) and low-enriched uranium (LEU), and it is supplied in the form of
uranium hexafluoride. The deal is attractive to the United States, which
not only gets an invaluable supply of nuclear fuel, but does not have to
worry about disposing of the waste that arises in the enrichment process;

14 THE LEAN GUIDE TO NUCLEAR ENERGY
it is, however, becoming less attractive to Russia, which needs all the fuel
it can get for its own expanding nuclear programme, and Russia is in any
case getting towards to the end of her supply of obsolete nuclear
warheads. There is no chance of the contract being renewed beyond
2013.45
Secondary supplies are also in decline. The inventories are approaching
exhaustion, and this has been one of the drivers of the recent sharp rise in
the price of uranium.46 The amount of uranium derived from tailings has
been falling, and it has been calculated that the scale of the task of
increasing production of uranium-235 now would require arrays of
continuously-operating gas centrifuge plants running into the millions.47
The supply of MOX fuel, derived from a reprocessing which is already at
its practical limits, is not expected to increase.48
URANIUM DEMAND AND SUPPLY BALANCE TO 2013 49
Demand (tonnes) Current demand, assumed unchanged from the present. 65,000
Supply (tonnes) Current supply (2007) 65,000 (of which 40,000 is produced from mines) Less loss of fuel from military uranium -10,000 Less loss of secondary supplies -10,000 Less decline in existing mines’ output -2,000 Equals expected reduction in absence of new projects -22,000 Deficit to be filled by new projects 22,000 Adding up to nominal supply by 2013 65,000
2013, the year in which the contract for military uranium expires, can be
taken to be a crucial date for uranium prospects, as summarised in the
table. Unless the production of mined uranium can be increased by some
22,000 tonnes per annum, there will be a 35 percent deficit in uranium
supply. So, the question is whether the production of mined uranium can
rise to compensate.
Can uranium production increase to fill the gap?
Although several of the medium-sized producers have in recent years
roughly maintained their output, or slightly increased it – notably
Kazakhstan, Namibia, Niger and Russia – the world’s two largest
producers – Canada and Australia – both show some evidence of being in
THE LEAN GUIDE TO NUCLEAR ENERGY 31
(3) Renewable energy: to design and build renewable energy systems to
match the needs and resources of the particular place and site.
(4) Tradable Energy Quotas (TEQs): to define a secure energy budget for
the whole economy, involving every energy-user in the common purpose
of achieving deep reductions in energy demand.79
It cannot be expected that this strategy will fill the energy gap completely,
or neatly, or in time, but nor is Lovelock suggesting that nuclear energy
could do so. Even if there were neither a uranium-supply problem to
restrain the use of nuclear energy, nor a waste-problem, and even if it
were the overriding priority for governments around the world, nuclear
energy would still fall far short of filling the gap. It would be impossible
to build all the nuclear power stations needed in time, and the energy
required for construction and for building the mining-milling-
enrichment-transport systems would mean that a rapidly-growing
nuclear energy industry would be using more energy than it provided
throughout most of its period of growth – the more rapid the growth, the
deeper the energy deficit it would cause.
There are good reasons to believe that Lean Energy could do better. It
would start to get results immediately. Per unit of energy-services
produced, it would be about ten times cheaper. It would be flexible and
sensitive to detail, making the best possible use of local conditions, skills
and ingenuity. It would be able to call on the skill and cooperation of the
entire population. And it would be part of an environmental and practical
evolution towards reduced transport, environmental protection and
strengthened local economics all coming together in a joined-up
programme.
3. The oil peak
Lovelock does not give enough weight to the significance of the oil peak.
As this weighs in, it will establish conditions in which there is no choice
but to conserve energy, whether the urgency of climate change is
recognised or not. Without the oil peak to concentrate the mind, action to
save the climate could be leisurely at best. With the oil peak reminding
us, by repeatedly turning out the lights and stopping us filling up our cars,
we will have an incentive to follow the one available option of Lean
Energy with all the will and determination we can find.
————————

30 THE LEAN GUIDE TO NUCLEAR ENERGY
emissions – or else fall into the energy gap and take the consequences.
Lovelock writes: “We need emission-free energy sources immediately,
and there is no serious contender to nuclear fission”.77 He suggests that
the decision is much clarified for us if we recognise the risk of climate
change for what it is, and he adds that we will not succeed in doing this if
we do not in the process move beyond the intellectual analysis and,
instead, feel the fear:
Few, even among climate scientists and ecologists, seem yet to realise fully
the potential severity, or the imminence, of catastrophic global disaster;
understanding is still in the conscious mind alone and not yet the visceral
reaction of fear. We lack an intuitive sense, an instinct, that tells us when
Gaia is in danger.78
Lovelock’s argument is persuasive. But there are three grounds on which
it is open to criticism.
1. The nuclear fuel cycle
Uranium depletion is not a “flawed idea”; it is a reality that is just a little
way ahead. Lovelock’s otherwise brilliant analysis of climate change
displays no knowledge of the nuclear fuel-cycle. His optimism about the
feasibility of nuclear power in the future is a case of whistling in the dark.
2. Alternative energy strategies
Lovelock may underestimate the potential of the fourfold strategy which
can be described as “Lean Energy”, an application of “lean thinking” –
perceptive intelligence applied to systems. It consists of four aims:
(1) Energy efficiency: to achieve the decisive improvements in the
efficiency of energy-services made possible by the conservation and
energy-saving technologies.
(2) The proximity principle: to develop the potential for local provision of
energy, goods and services. This major structural change, reducing the
transport-dependency of goods, people and electricity, is difficult but
necessary. It is achievable only incrementally, building local competence
across the whole range of economics and culture. Deep reductions in
travel and transport can be expected to come about rapidly and brutally
as the oil market breaks down; adapting to them – and crucially,
preparing for them before the event – will take longer.
THE LEAN GUIDE TO NUCLEAR ENERGY 15
recent decline, with uranium production falling by (respectively), 15 and
20 percent in 2005-2006.50
In both cases, hopes for expanding production have been pinned on
major new projects – the new Cigar Lake mine in Canada, and the
expansion of Olympic Dam in Australia. Cigar Lake is designed to
produce nearly 7,000 tonnes per annum, and it was due to start in 2007.
However, in October 2006, it flooded; the probable way of containing the
water in the sandstone above the workings is by refrigeration, which will
require large inputs of energy even before work can begin. It is now
uncertain whether, even after long past and future delays, Cigar Lake will
ever be a substantial source of uranium.51
The contribution of Olympic Dam is in some ways even more dubious. At
present, it is an underground mine well past its maturity, and the
management, BHP Billiton, is considering whether to move to an
adjacent ore body with an open pit mine on a massive scale. The new
mine would be three kilometres in diameter and one kilometre deep, with
some 350 metres of rock overburden to be removed in order to get at the
ore. The problem is that the uranium ore is very low-grade – only 0.06
percent and less, with an average of 0.029 percent, so that it would be
uneconomic in money terms if it were not for the copper, gold and silver
which the rock also contains. But that itself is a mixed blessing because it
means that the copper is contaminated with small quantities of uranium,
which has to be removed in a smelter constructed in the Australian
desert, adding even greater energy-costs to the final energy yield.52
Doubts as to whether Olympic Dam is capable of yielding uranium with a
positive energy balance are increased by a recent study by Storm van
Leeuwen, who suggests that the energy return on the energy invested in
the mine is only marginally better than that of gas. Moreover, the
removal of 350 metres of overburden, followed by the milling of low-
grade ore would require Australia to import diesel oil with an energy
content not far short of the final energy-yield of the uranium it would
produce. High oil prices, aggravated by actual outages in oil supplies as
the effects of the oil peak mature, would cause problems for a project for
which a large and reliable flow of diesel would have to be guaranteed.
Moreover, the mine is in an area of extreme drought: even if it does
supply its own water by desalinating seawater, it is possible that the needs
16 THE LEAN GUIDE TO NUCLEAR ENERGY
of agriculture will have a prior claim on South Australia’s water
resources.53
The BHP Billiton board has not yet made the final decision whether to go
ahead, but the independent nuclear energy analyst John Busby concludes
that it is “unlikely”, and that, even if it did, uranium production would
“certainly” be closer to 5,000 tonnes per annum than to the 15,000
tonnes which was originally planned.54
On this evidence is seems probable that, far from expanding in order to
sustain the flow of energy following the oil peak, the nuclear industry will
indeed begin to falter during the decade 2010-2019, with some nuclear
reactors being closed down for lack of fuel, and some of the reactors now
in the planning stage and under construction remaining unused
indefinitely.
In the light of this, a judgment has to be made as to whether hopes of a
revival of uranium supply are a sufficiently realistic foundation on which
to base expectations that the nuclear industry has a long term future as a
major energy provider. Even the NEA hedges its bets about this. Readers
are invited to read the following two sentences from the Executive
Summary with care and to decide for themselves whether they are
reassured that the uranium needed to fuel the industry’s recovery after
the coming shortfall will in fact be available:
The long lead-times needed to bring resources into production continues to
underscore the importance of making timely decisions to increase
production capability well in advance of any supply shortfall. Improved
information on the nature and extent of world uranium inventories and
other secondary sources would improve the accuracy of the forecasting
required to make these timely production decisions.55
And this brings us to the critical question of whether there will be enough
uranium to provide the energy to clear up the nuclear industry’s own
accumulated waste.
Can the industry supply the energy to clear its own waste?
First of all, we need some definitions. We can define the “net” energy
produced by the nuclear industry as the electricity generated minus
“front-end” energy – the energy needed to build reactors, to mine, mill,
enrich and prepare the fuel, and to carry out all the other energy-using
THE LEAN GUIDE TO NUCLEAR ENERGY 29
5. IN CONTEXT
The priority for the nuclear industry now should be to use the electricity
generated by nuclear power to clean up its own pollution and to phase
itself out before events force it to close down abruptly. Contrary to what
you might think, given the huge scale of its problems and its supposed
status as a fall-back position which could solve our energy problems the
nuclear energy industry is small, providing a mere 2½ percent of the
world’s final energy demand.75 Nuclear power is not a solution to the
energy famine brought on by the decline of oil and gas. Nor is it a means
of reducing emissions of greenhouse gases. It cannot provide energy
solutions, however much we may want it to do so.
But the conclusion that the nuclear industry cannot provide the energy we
need over the next three or four decades means that we have a problem.
An energy gap lies before us, for two reasons. First the damage done to
the self-regulating systems of the climate is already so great that we are at
or near the tipping point at which global heating will get out of control,
moving relentlessly but quickly towards a new equilibrium state possibly
lethal to the majority of the inhabitants of the planet and to its
civilisations. Secondly, we are at or near the "oil peak" at which supplies
of oil and (slightly later) gas will turn down into a relentless decline with
consequences on a scale comparable to those of climate change. In this
situation, we have little choice. If there is any energy source at all which
could operate on the scale and in the time needed to fill this energy gap,
then we must take it, even if it comes with enormous disadvantages.
Nuclear energy certainly has disadvantages, quite apart from the clincher
problem of the depletion of its fuel. It is a source of low-level radiation
which may be more dangerous than was previously thought. It is a source
of high-level waste which has to be sequestered. Every stage in the
process produces lethal waste, including the mining and leaching
processes, the milling, the enrichment and the decommissioning. It is
very expensive. It is a terrorist target and its enrichment processes are
stepping stones to the production of nuclear weapons.76
And yet, so great is the need for some way of closing-off the demand for
fossil fuels and filling the energy gap, and so serious are the consequences
of not doing so, that Lovelock can argue that it would be better to develop
nuclear energy, even with these disadvantages, than to fail to stop carbon

28 THE LEAN GUIDE TO NUCLEAR ENERGY
best, a poor source of uranium. The largest deposits contain uranium ore
concentrations of between 0.007 percent and 0.023 percent; they average
around 0.01 percent.73 That is to say, this is a low-grade uranium ore,
giving a negative PREI. Moreover, there is now increasing concern that
the production of phosphates, which are an essential requirement for
agriculture too, is close to its peak, and is poised for the decline
characteristic of a depleting resource.74
The ultimate, iconic error for a society in trouble is to “eat its seed corn”.
The evidence so far suggests that the use of phosphates as a source of the
uranium for nuclear fuel would be like burning it.
————————
If we bring the above brief review of alternative sources of uranium
together with the analysis of chapter 3, it is reasonable to conclude that,
even if the nuclear industry presented no other problems, “peak uranium”
would rule out the prospect of the nuclear industry being in any way an
answer to “peak oil”, and to scarcities of gas and coal.
It is now decision-time for many nations confronting the fierce certainty
of climate change, the depletion of oil and gas, and the ageing of their
nuclear reactors. Why should the decision-makers take any notice of this
analysis, written from a global perspective? Well, one of the problems is
that it is not a decision that can be made in isolation. Nuclear power
could in theory be sustained by a few individual nations: they could
perhaps export their wastes, and reduced competition for rich ores would
mean that the supply of uranium could be spun out for a long time. So,
for an individual nation looking at the choice in isolation, the nuclear
option may seem to be attractive. But there is a “fallacy of composition”
here: an option that is available to one cannot be supposed to be available
to many; on the contrary, it is only available to the one because it is not
adopted by many – and if it is adopted by many, then everyone is in
trouble, deep trouble.
THE LEAN GUIDE TO NUCLEAR ENERGY 17
tasks needed to produce nuclear energy. “Back-end” energy – the energy
needed to clear up all the wastes produced at each stage of the front-end
processes, including the disposal of old reactors – is of two kinds: (1) the
energy needed to dispose of the new waste – that is, the waste produced
in the future, and (2) the energy needed to dispose of the whole backlog
which has accumulated since the nuclear industry started-up in the
1950s. Back-end energy is the combined total of both of these.56
Most of the energy needed for these front-end and back-end processes
actually comes from derivatives of fossil fuels such as diesel oil to power
mining and milling machines, and coal or gas to make steel and concrete.
But it is the total energy balance that matters, not the question of which
source of energy will be needed for any particular part of the nuclear
cycle, so it makes sense to think of all the front-end and back-end energy
needs as if they were supplied from nuclear electricity.
This means that some of the energy produced by nuclear reactors will not
actually be available for sale because it will be required for those
processes. To keep the explanation simple and in round numbers, we will
use the estimate that the industry has another 60 years during which it
could in practice sustain current rates of extraction, getting more energy
out of the entire process than it puts into it – a positive PREI. Remember
that, for reasons explained above, this is an optimistic estimate, and the
implications of other estimates will be discussed in chapter 6. But, for
now, let us call 60 years the “nominal” estimate and use it to help us
concentrate on the principles:
The first question to ask is, “How long would the industry be able to
sustain its current output if the front-end energy costs had to be met out
of the electricity generated by nuclear reactors?” Well, this varies with
circumstances but, as an approximate guideline, the front-end processes
require about one quarter of the gross energy output of nuclear reactors,
so the answer to this question is: three quarters of 60 years – that is,
about 45 years.57
Now we come to the back-end processes: the energy cost of disposing of
the 60 years-worth of new waste is approximately the same as that of the
front end – that is, about one quarter of the gross output, or 15 years of
energy supply, so that brings the supply of available energy down to 30
years.

18 THE LEAN GUIDE TO NUCLEAR ENERGY
But then there is still the backlog – the 60 years-worth of waste produced
since 1950, and dealing with this will this require yet another 15 years of
energy supply. That brings us finally down to the amount of energy we
have available for use in the grid: 15 years.
In other words, even if the industry really had 60 years’ supply of
uranium left for its use, it would only have some fifteen years left before
the decisive moment; from that turning-point, its entire net output of
energy would have to be used for the essential task of getting rid of its
stockpile of wastes, plus the wastes produced in the future.58
If, in its attempt to supply as much energy as possible, the industry were
to postpone the task for more than that fifteen years, it would become
energy-bankrupt: it would owe more energy to the planet than it could
generate: it would never be able to produce enough net energy to dispose
of its life-time waste. This means that, even if the nominal estimate of 60
years were correct, the industry would face a turning-point to energy-
bankruptcy in about 2025.
The task of clearing up the remaining waste – the alternative to
converting the planet into an open-plan waste-dump – is non-negotiable.
The time we have left in which to do it depends on how much uranium
with a positive PREI remains – and the short time we have left, even if
there is as much as sixty years’ supply remaining, is set in context with
other estimates, both shorter and longer, in chapter 6. Meanwhile, we
should not forget the money-cost of this. If the nuclear industry in the
second half of its nominal 120-year whole-life span (1950-2070) were to
commit itself (as it must) to the cost
of clearing up its current and future
waste, any electricity left over and
available for sale would become
exceedingly expensive, and the
industry would soon reach the point
at which it had no spare energy to sell
anyway.
Meanwhile, governments will have to
keep the clear-up programme going
well into the future, whatever the
other priorities. They will probably
THE LEAN GUIDE TO NUCLEAR ENERGY 27
“desorption” – separating the adsorbed uranium ions from the beds.
Thirdly, the solution that results from this must be purified, removing the
other compounds that have accumulated in much higher concentration
than the uranium ions. Fourthly, the solution is concentrated, and fifthly,
a solvent is used to extract the uranium. The sixth stage is to concentrate
the uranium and purify it into uranium oxide (yellowcake), ready for
enrichment in the usual way.69
But the operation is massive and takes a lot of energy. Very roughly, two
cubic kilometres of sea water is needed to yield enough natural uranium
to supply one tonne of fuel, prepared and ready for action in a reactor. A
1 GW reactor needs about 200 tonnes of natural uranium for one full-
power year, so each reactor would require some 400 cubic kilometres of
seawater to be processed – that is 40,000 cubic kilometres of seawater
being processed in order to keep a useful fleet of 100 nuclear reactors in
business for one (full-power) year.70
And what is the energy balance of all this? One tonne of natural uranium
is needed to produce to produce approximately 160 TJ (1 terajoule =
1,000 billion joules), less the energy costs of the front-end processes
(defined in chapter 3) – giving a net electricity yield of some 120 TJ, while
the back-end processes have to come out of that. The energy needed to
supply the uranium from seawater, ready for entry into that fuel cycle, is
in the region of 195-250 TJ, so that the use of seawater as a source of
energy would require more energy than it could produce.
Phosphates
The claims for phosphates as a source of uranium are impressive. The
Red Book published by the NEA and the IAEA concludes that, by
including phosphates as a uranium source, their already high estimate for
the supply of uranium, including prognosticated resources (275 years at
current rates) could be more than doubled to 675 years.71
The first thing to note is that the process of extraction is difficult. The
phosphate ores are used to produce phosphoric acid, which is then
concentrated in uranium, a process which requires solvents including
toxic organophosphate compounds, and produces organofluoro-
phosphorus and greenhouse gases in the form of fluorohydrocarbons.72
And then there is the even deeper problem of supply. Phosphates are, at

26 THE LEAN GUIDE TO NUCLEAR ENERGY
very much of that around either; (b) what there is (especially if we are
going to do what Lovelock urges) is going to be busy as the fuel for once-
through reactors and/or fast-breeder reactors, as explained above; and (c)
it is advisable, wherever there is an alternative, to keep plutonium-239
and uranium-233 – an unpredictable mixture – as separate as possible.
The third, and ideal, option is uranium-233, the final fuel produced by the
thorium cycle, but the problem here is that it doesn’t exist until the cycle
is complete, so it can’t be used to start it.
But let’s suppose that enough uranium-235 or plutonium-239 were made
available to provide a full load for one reactor and to keep it going for its
lifetime. There is no good foundation for forecasting the rate of growth
but, taking account of all the assumptions about technical solutions that
are intrinsic to this subject, there is the possibility that by 2075 there
could be two thorium-cycle breeder reactors delivering energy to the
grid.68
Seawater
Seawater contains uranium in a concentration of about thirty parts per
billion, and advocates of nuclear power are right to say that, if this could
be used, then nuclear power could in principle supply us with the energy
we need for a long time to come. Ways of extracting those minute
quantities of uranium from seawater and concentrating them into
uranium oxide have been worked out in some detail. First of all, uranium
ions are attracted – “adsorbed” – onto adsorption beds consisting of a
suitable material such as titanium hydroxide, and there are also some
polymers with the right properties. These beds must be suspended in the
sea in huge arrays, many
kilometres in length, in places
where there is a current to wash
the seawater through them, and
where the sea is sufficiently warm
– at least 20°C. They must then
be lifted out of the sea and taken
on-shore, where, in the first stage
of the process, they are cleansed to
remove organic materials and
organisms. Stage two consists of
THE LEAN GUIDE TO NUCLEAR ENERGY 19
have to buy-in much of the needed net energy from other sources, at
which point, of course, the industry will change from being a net supplier
of energy to being a net consumer. And yet, in an energy-strapped
society, the non-nuclear energy needed to dispose of the nuclear
industry’s legacy will be hard to find. The prospect is opening up of
massive stocks of unstable wastes which – since the energy is lacking –
are impossible to clear up.
Nuclear energy is therefore caught in a depletion trap – the depletion of
rich uranium ore, on a timescale similar to that of oil and gas. So the
question to be asked is: as the conventional uranium sources run low, are
there alternative sources of fuel for nuclear energy?

20 THE LEAN GUIDE TO NUCLEAR ENERGY
4. ALTERNATIVE SOURCES OF FUEL?
At this point, the natural thing to do is to turn to James Lovelock’s robust
dismissal of the idea that the growth of nuclear power is likely to be
constrained by depletion of its raw material. This is how he deals with it:
Another flawed idea now circulating is that the world supply of uranium is
so small that its use for energy would last only a few years. It is true that if
the whole world chose to use uranium as its sole fuel, supplies of easily-
mined uranium would soon be exhausted. But there is a superabundance of
low-grade uranium ore: most granite, for example, contains enough
uranium to make its fuel capacity five times that of an equal mass of coal.
India is already preparing to use its abundant supplies of thorium, an
alternative fuel, in place of uranium.59
Lovelock also urges that we have a readily-available stock of fuel in the
plutonium that has been accumulated from the reactors that are shortly
to be decommissioned. And he might have added that other candidates
as sources of nuclear fuel are seawater and phosphates. So, if we put the
supposed alternatives to uranium ore in order, this is what we have: (1)
granite; (2) fast-breeder reactors using (a) plutonium and (b) thorium;
(3) seawater; and (4) phosphates.
Granite
It has already been explained above that granite with a uranium content
of less than 0.02 percent cannot be used as a source of nuclear energy,
because that is the borderline at which the energy needed to sustain the
whole nuclear energy life-cycle is greater – and in the case of even poorer
ores, much greater – than the energy that comes back. But Lovelock is so
insistent and confident on this point that it is worth revisiting.
Storm van Leeuwen, basing his calculations on his joint published work
with Smith, considers how much granite would be needed to supply a 1
GW nuclear reactor with the 200 tonnes of natural uranium needed as a
fuel source for a year’s full-power electricity production. Ordinary granite
contains roughly four grams of uranium per tonne of granite (4 ppm or
0.0004 percent). One year’s supply of uranium extracted from this
granite would require 100 million tonnes of granite (assuming, very
optimistically, that you can get the granite to yield as much as half the
uranium it contains). So, Lovelock’s granite could indeed be used to
THE LEAN GUIDE TO NUCLEAR ENERGY 25
much as 10 percent thorium oxide. The relevant isotope is the slightly
radioactive thorium-232. It has a half-life three times that of the earth, so
that makes it useless as a direct source of energy, but it can be used as the
starting-point from which to breed an efficient nuclear fuel. Here’s how:
o Start by irradiating the thorium-232, using a start-up fuel – plutonium-
239 will do it. Thorium-232 is slightly fertile, and absorbs a neutron to
become thorium-233.
o The thorium-233, with a half-life of 22.2 minutes, decays to
protactinium-233.
o The protactinium-233, with a half-life of 27 days, decays into uranium-
233.
o The uranium-233 is highly fissile, and can be used not just as nuclear
fuel, but as the start-up source of irradiation for a blanket of thorium-
232, to keep the whole cycle going indefinitely. 66
But, as is so often the case with nuclear power, it is not as good as it looks.
The two-step sequence of plutonium-breeding is, as we have seen, hard
enough. The four-step sequence of thorium-breeding is worse. The
uranium-233 which you get at the end of the process is contaminated
with uranium-232 and with highly-radioactive thorium-228, both of
which are neutron-emitters, reducing its effectiveness as a fuel; it also has
the disadvantage that it can be used in nuclear weapons. The
comparatively long half-life of protactinium-233 (27 days) makes for
problems in the reactor, since substantial quantities linger on for up to a
year. Some reactors – including Kakrapar-1 and -2 in India – have both
achieved full power using some thorium in their operation, and it may
well be that, if there is to be a very long-term future for nuclear fission, it
will be thorium that drives it along. And yet, the full thorium breeding
cycle, working on a scale which is large-enough and reliable-enough to be
commercial, is a long way away.67
And even if that day does come, its contribution, for the foreseeable
future, will be tiny. This is because it has to begin with some start-up fuel
– a source of neutrons to get the whole thing going. That could come in
any of three forms. It could come from uranium-235, which is going to be
scarce, but there could perhaps be a case for using some in a breeder,
even if the process for the first generation of reactors used more energy
than it generated. Or, it could come from plutonium, but (a) there isn’t
24 THE LEAN GUIDE TO NUCLEAR ENERGY
away how seductive this technology is because when plutonium is used in
fast breeders, wrapped in large “blankets” of uranium-238, you need (in
theory) just three tonnes of plutonium to drive the process along, so you
could (in theory) start up 80 fast-breeder reactors at the same time. So,
they start breeding in 2035. But the process is not as fast as the name
suggests (“fast” refers to the speeds needed at the subatomic level, rather
than the speed of the process), and the outcome is by no means certain;
but let us give the technology the benefit of the doubt: everything goes
according to plan. Forty years later, each breeder reactor would have
bred enough plutonium to replace itself and to start up another one.
With the benefit of these magical assumptions becoming reality, by 2075
– long after reaching the depths of the coming energy famine – we would
have 160 breeder reactors in place worldwide (there are 439 nuclear
reactors in operation now). And that is all we would have, because the
ordinary, uranium-235-based reactors would by then be out of fuel.64
SAFETY CATCH
The complexity of preventing accidents can make the system impossible
There is a systemic problem with the design of breeder reactors. Nuclear
accident is potentially so destructive that the possibility has to be practically
ruled out under all circumstances. This means that the defence-in-depth
systems have to be extremely complex, which means that the installation must
be large enough to derive economies of scale – otherwise it would be
uneconomic. However, that in turn means that no confinement dome can be
built on any acceptable design criterion on a scale and with the structural
strength to withstand a major accident. Therefore, the defence-in-depth
systems have to be even more complex, which in turn means that they become
even more problem-prone than the device they were meant to protect.
A study for the nuclear industry in Japan concludes: “A successful commercial
breeder reactor must have three attributes: it must breed, it must be
economical, and it must be safe. Although any one or two of these attributes
can be achieved in isolation by proper design, the laws of physics apparently
make it impossible to achieve all three simultaneously, no matter how clever
the design.”65
(b) Thorium
The other way of breeding fuel is to use thorium. Thorium is a metal
found in most rocks and soils, and there are some rich ores bearing as THE LEAN GUIDE TO NUCLEAR ENERGY 21
provide power for a nuclear reactor, but there are snags. The minor one
is that it would leave a heap of granite tailings (if neatly stacked) 100
metres high, 100 metres wide and 4 kilometres long. The major snag is
that the extraction process would require some 650 PJ (a petajoule =
1,000,000 billion joules) energy to produce the 26 PJ electricity provided
by the reactor. That is, the process would use up some 25 times more
energy that the reactor produced.60
As for the comparison between granite and coal: well, a 1 GW coal-fired
power station needs about 2 million tonnes of coal to keep it going for a
year, compared with 100 million tonnes of granite. Far from the
practically-available fuel capacity of a tonne of granite being five times
that of a tonne coal, it is 50 times less. Lovelock’s calculation is adrift by a
multiple of around 250.
Fast breeder reactors
(a) Plutonium
Lovelock’s proposal that we should use plutonium as the fuel for the
nuclear power stations of the future can be taken in either of two ways.
He might be suggesting that we could simply run the reactors on
plutonium on the conventional “once-through” system which is standard,
using light-water reactors. It is debatable whether this can be done; it has
never been attempted, and it would involve a significantly different
process, including the use of a different moderator. A more plausible
approach would be to use it in some kind of combination with uranium –
but then it is not solving the problem of uranium becoming scarce, and
the very small contribution (2 per cent) which has been successfully
reprocessed from spent fuel into mixed oxides (MOX) shows that this is
not going to be a replacement for uranium.
There are about 240 tonnes of plutonium in the world held in stock for
civilian use. In principle, this could be increased from two sources; (a)
the ex-weapons plutonium (about 150-200 tonnes); and (b) from the
plutonium in spent fuel – but the problem here is that extracting it adds
yet another layer of difficulty to the aim of a smoothly-running
commercial operation for fast-breeders. The UK’s extraction plant,
Thorp, has closed down after a massive leak and is unlikely to be
reopened; extraction of plutonium is done to some extent in France,
Russia, Japan and India, but it is such a tricky process that the United

22 THE LEAN GUIDE TO NUCLEAR ENERGY
States has made it illegal.61
But breeding is a potentially attractive technology. Let us suppose, then,
that the best estimate for the amount of available plutonium in the world
is 240 tonnes, and that there is enough uranium or MOX around to use it
in reactors. You don’t get many functioning reactors for that. The UK’s
stocks of 106 tonnes, along with MOX, would be enough to fuel just two
reactors for their lifetime (so there would be enough for four reactors
worldwide). Then, at the end of their life (say, 24 full-power years), the
plutonium would have been used up; they would then be closed down and
not replaced, because at that time there will be no uranium left to fuel
them, apart perhaps from very small quantities of MOX. This would
scarcely be a useful strategy, so it is more sensible to suppose that
Lovelock has in mind the second possibility: that the plutonium reactors
should be breeder reactors, designed not just to produce electricity now,
but to breed more plutonium for the future.
Breeders are in principle a very attractive technology. In uranium ore, a
mere 0.7 percent of the uranium content consists of the useful isotope –
the one that is fissile and produces energy – uranium-235. Most of the
rest consists of uranium-238, and most of that simply gets in the way and
has to be dumped at the end; it is uranium-238 which is responsible for
much of the awesome mixture of radioactive materials that causes the
waste problem. And yet, uranium-238, as we saw in the introduction,
also has the property of being fertile. When bombarded by neutrons from
a “start-up” fuel like uranium-235 or plutonium-239, it can absorb a
neutron to become uranium-239, which quickly decays to neptunium-239
and then to plutonium-239. This means that plutonium-239 can be used
as a start-up fuel to breed more plutonium-239, more-or-less indefinitely.
That’s where the claim that nuclear power would one day be too cheap to
meter comes from. The Nuclear Energy Agency (NEA) and International
Atomic Energy Agency (IAEA) suggest that if all available sources of ore
are exploited, and fast-breeder reactors perfected and developed, we may
look forward to 20,000 years of nuclear energy at current rates of
output.62
But there is a catch. It is a complicated technology. It consists of three
operations: breeding, reprocessing and fuel fabrication, all of which have
to work concurrently and smoothly.
THE LEAN GUIDE TO NUCLEAR ENERGY 23
First, breeding: this does not simply convert uranium-238 to plutonium-
239; at the same time, it breeds plutonium-241, americium, curium,
rhodium, technetium, palladium and much else. This fiercely radioactive
mixture tends to clog up and corrode the equipment. There are in
principle ways round these problems, but a smoothly-running breeding
process on a commercial scale has never yet been achieved.63
Secondly, reprocessing. The mixture of radioactive products that comes
out of the breeding process has to be sorted, with the plutonium-239
being extracted. The mixture itself is highly radioactive, and tends to
degrade the solvent, tributyl phosphate. Here, too, insoluble compounds
form, clogging up the equipment; there is some debate about how great
the danger is of plutonium accumulating into a critical mass, and setting
off a nuclear explosion. The mixture gets hot and releases radioactive
gases; and significant quantities of the plutonium and uranium are lost as
waste. As in the case of the breeder operation itself, smoothly-running
reprocessing on a commercial scale has never yet been achieved.
The third operation is to fabricate the recovered plutonium as fuel. The
mixture gives off a great deal of gamma and alpha radiation, so the whole
process of forming the fuel into rods which can then be put back into a
reactor has to be done by remote control. This, too, has yet to be achieved
as a smoothly-running commercial operation.
And, of course, it follows that the whole fast-breeder cycle, consisting of
three processes none of which have ever worked as intended, has itself
never worked. There are three fast-breeder reactors in the world:
Beloyarsk-3 in Russia, Monju in Japan and Phénix in France; Monju and
Phénix have long been out of operation; Beloyarsk is still operating, but it
has never bred.
But let us look on the bright
side of all this. Suppose that,
with 30 years of intensive
research and development, the
world’s nuclear energy
industry could find a use for all
the reactor-grade plutonium in
existence, and fabricate it into
fuel rods. You can see straight
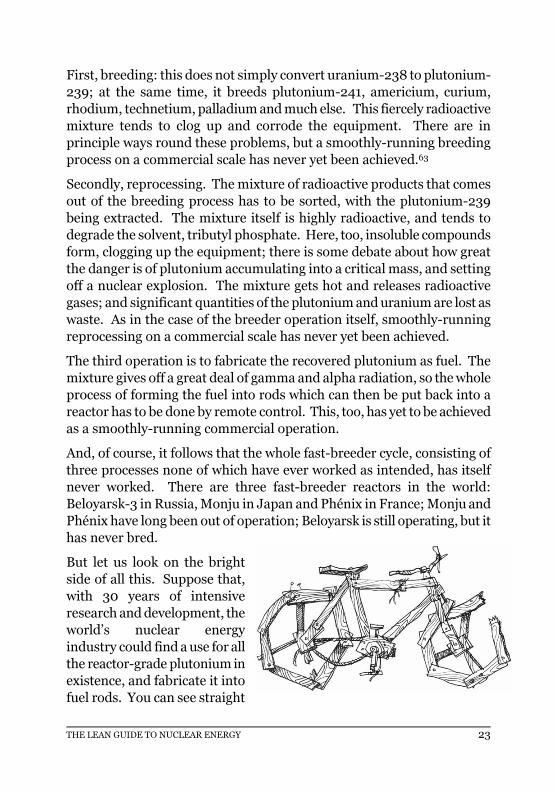

24 THE LEAN GUIDE TO NUCLEAR ENERGY
away how seductive this technology is because when plutonium is used in
fast breeders, wrapped in large “blankets” of uranium-238, you need (in
theory) just three tonnes of plutonium to drive the process along, so you
could (in theory) start up 80 fast-breeder reactors at the same time. So,
they start breeding in 2035. But the process is not as fast as the name
suggests (“fast” refers to the speeds needed at the subatomic level, rather
than the speed of the process), and the outcome is by no means certain;
but let us give the technology the benefit of the doubt: everything goes
according to plan. Forty years later, each breeder reactor would have
bred enough plutonium to replace itself and to start up another one.
With the benefit of these magical assumptions becoming reality, by 2075
– long after reaching the depths of the coming energy famine – we would
have 160 breeder reactors in place worldwide (there are 439 nuclear
reactors in operation now). And that is all we would have, because the
ordinary, uranium-235-based reactors would by then be out of fuel.64
SAFETY CATCH
The complexity of preventing accidents can make the system impossible
There is a systemic problem with the design of breeder reactors. Nuclear
accident is potentially so destructive that the possibility has to be practically
ruled out under all circumstances. This means that the defence-in-depth
systems have to be extremely complex, which means that the installation must
be large enough to derive economies of scale – otherwise it would be
uneconomic. However, that in turn means that no confinement dome can be
built on any acceptable design criterion on a scale and with the structural
strength to withstand a major accident. Therefore, the defence-in-depth
systems have to be even more complex, which in turn means that they become
even more problem-prone than the device they were meant to protect.
A study for the nuclear industry in Japan concludes: “A successful commercial
breeder reactor must have three attributes: it must breed, it must be
economical, and it must be safe. Although any one or two of these attributes
can be achieved in isolation by proper design, the laws of physics apparently
make it impossible to achieve all three simultaneously, no matter how clever
the design.”65
(b) Thorium
The other way of breeding fuel is to use thorium. Thorium is a metal
found in most rocks and soils, and there are some rich ores bearing as THE LEAN GUIDE TO NUCLEAR ENERGY 21
provide power for a nuclear reactor, but there are snags. The minor one
is that it would leave a heap of granite tailings (if neatly stacked) 100
metres high, 100 metres wide and 4 kilometres long. The major snag is
that the extraction process would require some 650 PJ (a petajoule =
1,000,000 billion joules) energy to produce the 26 PJ electricity provided
by the reactor. That is, the process would use up some 25 times more
energy that the reactor produced.60
As for the comparison between granite and coal: well, a 1 GW coal-fired
power station needs about 2 million tonnes of coal to keep it going for a
year, compared with 100 million tonnes of granite. Far from the
practically-available fuel capacity of a tonne of granite being five times
that of a tonne coal, it is 50 times less. Lovelock’s calculation is adrift by a
multiple of around 250.
Fast breeder reactors
(a) Plutonium
Lovelock’s proposal that we should use plutonium as the fuel for the
nuclear power stations of the future can be taken in either of two ways.
He might be suggesting that we could simply run the reactors on
plutonium on the conventional “once-through” system which is standard,
using light-water reactors. It is debatable whether this can be done; it has
never been attempted, and it would involve a significantly different
process, including the use of a different moderator. A more plausible
approach would be to use it in some kind of combination with uranium –
but then it is not solving the problem of uranium becoming scarce, and
the very small contribution (2 per cent) which has been successfully
reprocessed from spent fuel into mixed oxides (MOX) shows that this is
not going to be a replacement for uranium.
There are about 240 tonnes of plutonium in the world held in stock for
civilian use. In principle, this could be increased from two sources; (a)
the ex-weapons plutonium (about 150-200 tonnes); and (b) from the
plutonium in spent fuel – but the problem here is that extracting it adds
yet another layer of difficulty to the aim of a smoothly-running
commercial operation for fast-breeders. The UK’s extraction plant,
Thorp, has closed down after a massive leak and is unlikely to be
reopened; extraction of plutonium is done to some extent in France,
Russia, Japan and India, but it is such a tricky process that the United

20 THE LEAN GUIDE TO NUCLEAR ENERGY
4. ALTERNATIVE SOURCES OF FUEL?
At this point, the natural thing to do is to turn to James Lovelock’s robust
dismissal of the idea that the growth of nuclear power is likely to be
constrained by depletion of its raw material. This is how he deals with it:
Another flawed idea now circulating is that the world supply of uranium is
so small that its use for energy would last only a few years. It is true that if
the whole world chose to use uranium as its sole fuel, supplies of easily-
mined uranium would soon be exhausted. But there is a superabundance of
low-grade uranium ore: most granite, for example, contains enough
uranium to make its fuel capacity five times that of an equal mass of coal.
India is already preparing to use its abundant supplies of thorium, an
alternative fuel, in place of uranium.59
Lovelock also urges that we have a readily-available stock of fuel in the
plutonium that has been accumulated from the reactors that are shortly
to be decommissioned. And he might have added that other candidates
as sources of nuclear fuel are seawater and phosphates. So, if we put the
supposed alternatives to uranium ore in order, this is what we have: (1)
granite; (2) fast-breeder reactors using (a) plutonium and (b) thorium;
(3) seawater; and (4) phosphates.
Granite
It has already been explained above that granite with a uranium content
of less than 0.02 percent cannot be used as a source of nuclear energy,
because that is the borderline at which the energy needed to sustain the
whole nuclear energy life-cycle is greater – and in the case of even poorer
ores, much greater – than the energy that comes back. But Lovelock is so
insistent and confident on this point that it is worth revisiting.
Storm van Leeuwen, basing his calculations on his joint published work
with Smith, considers how much granite would be needed to supply a 1
GW nuclear reactor with the 200 tonnes of natural uranium needed as a
fuel source for a year’s full-power electricity production. Ordinary granite
contains roughly four grams of uranium per tonne of granite (4 ppm or
0.0004 percent). One year’s supply of uranium extracted from this
granite would require 100 million tonnes of granite (assuming, very
optimistically, that you can get the granite to yield as much as half the
uranium it contains). So, Lovelock’s granite could indeed be used to
THE LEAN GUIDE TO NUCLEAR ENERGY 25
much as 10 percent thorium oxide. The relevant isotope is the slightly
radioactive thorium-232. It has a half-life three times that of the earth, so
that makes it useless as a direct source of energy, but it can be used as the
starting-point from which to breed an efficient nuclear fuel. Here’s how:
o Start by irradiating the thorium-232, using a start-up fuel – plutonium-
239 will do it. Thorium-232 is slightly fertile, and absorbs a neutron to
become thorium-233.
o The thorium-233, with a half-life of 22.2 minutes, decays to
protactinium-233.
o The protactinium-233, with a half-life of 27 days, decays into uranium-
233.
o The uranium-233 is highly fissile, and can be used not just as nuclear
fuel, but as the start-up source of irradiation for a blanket of thorium-
232, to keep the whole cycle going indefinitely. 66
But, as is so often the case with nuclear power, it is not as good as it looks.
The two-step sequence of plutonium-breeding is, as we have seen, hard
enough. The four-step sequence of thorium-breeding is worse. The
uranium-233 which you get at the end of the process is contaminated
with uranium-232 and with highly-radioactive thorium-228, both of
which are neutron-emitters, reducing its effectiveness as a fuel; it also has
the disadvantage that it can be used in nuclear weapons. The
comparatively long half-life of protactinium-233 (27 days) makes for
problems in the reactor, since substantial quantities linger on for up to a
year. Some reactors – including Kakrapar-1 and -2 in India – have both
achieved full power using some thorium in their operation, and it may
well be that, if there is to be a very long-term future for nuclear fission, it
will be thorium that drives it along. And yet, the full thorium breeding
cycle, working on a scale which is large-enough and reliable-enough to be
commercial, is a long way away.67
And even if that day does come, its contribution, for the foreseeable
future, will be tiny. This is because it has to begin with some start-up fuel
– a source of neutrons to get the whole thing going. That could come in
any of three forms. It could come from uranium-235, which is going to be
scarce, but there could perhaps be a case for using some in a breeder,
even if the process for the first generation of reactors used more energy
than it generated. Or, it could come from plutonium, but (a) there isn’t

26 THE LEAN GUIDE TO NUCLEAR ENERGY
very much of that around either; (b) what there is (especially if we are
going to do what Lovelock urges) is going to be busy as the fuel for once-
through reactors and/or fast-breeder reactors, as explained above; and (c)
it is advisable, wherever there is an alternative, to keep plutonium-239
and uranium-233 – an unpredictable mixture – as separate as possible.
The third, and ideal, option is uranium-233, the final fuel produced by the
thorium cycle, but the problem here is that it doesn’t exist until the cycle
is complete, so it can’t be used to start it.
But let’s suppose that enough uranium-235 or plutonium-239 were made
available to provide a full load for one reactor and to keep it going for its
lifetime. There is no good foundation for forecasting the rate of growth
but, taking account of all the assumptions about technical solutions that
are intrinsic to this subject, there is the possibility that by 2075 there
could be two thorium-cycle breeder reactors delivering energy to the
grid.68
Seawater
Seawater contains uranium in a concentration of about thirty parts per
billion, and advocates of nuclear power are right to say that, if this could
be used, then nuclear power could in principle supply us with the energy
we need for a long time to come. Ways of extracting those minute
quantities of uranium from seawater and concentrating them into
uranium oxide have been worked out in some detail. First of all, uranium
ions are attracted – “adsorbed” – onto adsorption beds consisting of a
suitable material such as titanium hydroxide, and there are also some
polymers with the right properties. These beds must be suspended in the
sea in huge arrays, many
kilometres in length, in places
where there is a current to wash
the seawater through them, and
where the sea is sufficiently warm
– at least 20°C. They must then
be lifted out of the sea and taken
on-shore, where, in the first stage
of the process, they are cleansed to
remove organic materials and
organisms. Stage two consists of
THE LEAN GUIDE TO NUCLEAR ENERGY 19
have to buy-in much of the needed net energy from other sources, at
which point, of course, the industry will change from being a net supplier
of energy to being a net consumer. And yet, in an energy-strapped
society, the non-nuclear energy needed to dispose of the nuclear
industry’s legacy will be hard to find. The prospect is opening up of
massive stocks of unstable wastes which – since the energy is lacking –
are impossible to clear up.
Nuclear energy is therefore caught in a depletion trap – the depletion of
rich uranium ore, on a timescale similar to that of oil and gas. So the
question to be asked is: as the conventional uranium sources run low, are
there alternative sources of fuel for nuclear energy?

18 THE LEAN GUIDE TO NUCLEAR ENERGY
But then there is still the backlog – the 60 years-worth of waste produced
since 1950, and dealing with this will this require yet another 15 years of
energy supply. That brings us finally down to the amount of energy we
have available for use in the grid: 15 years.
In other words, even if the industry really had 60 years’ supply of
uranium left for its use, it would only have some fifteen years left before
the decisive moment; from that turning-point, its entire net output of
energy would have to be used for the essential task of getting rid of its
stockpile of wastes, plus the wastes produced in the future.58
If, in its attempt to supply as much energy as possible, the industry were
to postpone the task for more than that fifteen years, it would become
energy-bankrupt: it would owe more energy to the planet than it could
generate: it would never be able to produce enough net energy to dispose
of its life-time waste. This means that, even if the nominal estimate of 60
years were correct, the industry would face a turning-point to energy-
bankruptcy in about 2025.
The task of clearing up the remaining waste – the alternative to
converting the planet into an open-plan waste-dump – is non-negotiable.
The time we have left in which to do it depends on how much uranium
with a positive PREI remains – and the short time we have left, even if
there is as much as sixty years’ supply remaining, is set in context with
other estimates, both shorter and longer, in chapter 6. Meanwhile, we
should not forget the money-cost of this. If the nuclear industry in the
second half of its nominal 120-year whole-life span (1950-2070) were to
commit itself (as it must) to the cost
of clearing up its current and future
waste, any electricity left over and
available for sale would become
exceedingly expensive, and the
industry would soon reach the point
at which it had no spare energy to sell
anyway.
Meanwhile, governments will have to
keep the clear-up programme going
well into the future, whatever the
other priorities. They will probably
THE LEAN GUIDE TO NUCLEAR ENERGY 27
“desorption” – separating the adsorbed uranium ions from the beds.
Thirdly, the solution that results from this must be purified, removing the
other compounds that have accumulated in much higher concentration
than the uranium ions. Fourthly, the solution is concentrated, and fifthly,
a solvent is used to extract the uranium. The sixth stage is to concentrate
the uranium and purify it into uranium oxide (yellowcake), ready for
enrichment in the usual way.69
But the operation is massive and takes a lot of energy. Very roughly, two
cubic kilometres of sea water is needed to yield enough natural uranium
to supply one tonne of fuel, prepared and ready for action in a reactor. A
1 GW reactor needs about 200 tonnes of natural uranium for one full-
power year, so each reactor would require some 400 cubic kilometres of
seawater to be processed – that is 40,000 cubic kilometres of seawater
being processed in order to keep a useful fleet of 100 nuclear reactors in
business for one (full-power) year.70
And what is the energy balance of all this? One tonne of natural uranium
is needed to produce to produce approximately 160 TJ (1 terajoule =
1,000 billion joules), less the energy costs of the front-end processes
(defined in chapter 3) – giving a net electricity yield of some 120 TJ, while
the back-end processes have to come out of that. The energy needed to
supply the uranium from seawater, ready for entry into that fuel cycle, is
in the region of 195-250 TJ, so that the use of seawater as a source of
energy would require more energy than it could produce.
Phosphates
The claims for phosphates as a source of uranium are impressive. The
Red Book published by the NEA and the IAEA concludes that, by
including phosphates as a uranium source, their already high estimate for
the supply of uranium, including prognosticated resources (275 years at
current rates) could be more than doubled to 675 years.71
The first thing to note is that the process of extraction is difficult. The
phosphate ores are used to produce phosphoric acid, which is then
concentrated in uranium, a process which requires solvents including
toxic organophosphate compounds, and produces organofluoro-
phosphorus and greenhouse gases in the form of fluorohydrocarbons.72
And then there is the even deeper problem of supply. Phosphates are, at

28 THE LEAN GUIDE TO NUCLEAR ENERGY
best, a poor source of uranium. The largest deposits contain uranium ore
concentrations of between 0.007 percent and 0.023 percent; they average
around 0.01 percent.73 That is to say, this is a low-grade uranium ore,
giving a negative PREI. Moreover, there is now increasing concern that
the production of phosphates, which are an essential requirement for
agriculture too, is close to its peak, and is poised for the decline
characteristic of a depleting resource.74
The ultimate, iconic error for a society in trouble is to “eat its seed corn”.
The evidence so far suggests that the use of phosphates as a source of the
uranium for nuclear fuel would be like burning it.
————————
If we bring the above brief review of alternative sources of uranium
together with the analysis of chapter 3, it is reasonable to conclude that,
even if the nuclear industry presented no other problems, “peak uranium”
would rule out the prospect of the nuclear industry being in any way an
answer to “peak oil”, and to scarcities of gas and coal.
It is now decision-time for many nations confronting the fierce certainty
of climate change, the depletion of oil and gas, and the ageing of their
nuclear reactors. Why should the decision-makers take any notice of this
analysis, written from a global perspective? Well, one of the problems is
that it is not a decision that can be made in isolation. Nuclear power
could in theory be sustained by a few individual nations: they could
perhaps export their wastes, and reduced competition for rich ores would
mean that the supply of uranium could be spun out for a long time. So,
for an individual nation looking at the choice in isolation, the nuclear
option may seem to be attractive. But there is a “fallacy of composition”
here: an option that is available to one cannot be supposed to be available
to many; on the contrary, it is only available to the one because it is not
adopted by many – and if it is adopted by many, then everyone is in
trouble, deep trouble.
THE LEAN GUIDE TO NUCLEAR ENERGY 17
tasks needed to produce nuclear energy. “Back-end” energy – the energy
needed to clear up all the wastes produced at each stage of the front-end
processes, including the disposal of old reactors – is of two kinds: (1) the
energy needed to dispose of the new waste – that is, the waste produced
in the future, and (2) the energy needed to dispose of the whole backlog
which has accumulated since the nuclear industry started-up in the
1950s. Back-end energy is the combined total of both of these.56
Most of the energy needed for these front-end and back-end processes
actually comes from derivatives of fossil fuels such as diesel oil to power
mining and milling machines, and coal or gas to make steel and concrete.
But it is the total energy balance that matters, not the question of which
source of energy will be needed for any particular part of the nuclear
cycle, so it makes sense to think of all the front-end and back-end energy
needs as if they were supplied from nuclear electricity.
This means that some of the energy produced by nuclear reactors will not
actually be available for sale because it will be required for those
processes. To keep the explanation simple and in round numbers, we will
use the estimate that the industry has another 60 years during which it
could in practice sustain current rates of extraction, getting more energy
out of the entire process than it puts into it – a positive PREI. Remember
that, for reasons explained above, this is an optimistic estimate, and the
implications of other estimates will be discussed in chapter 6. But, for
now, let us call 60 years the “nominal” estimate and use it to help us
concentrate on the principles:
The first question to ask is, “How long would the industry be able to
sustain its current output if the front-end energy costs had to be met out
of the electricity generated by nuclear reactors?” Well, this varies with
circumstances but, as an approximate guideline, the front-end processes
require about one quarter of the gross energy output of nuclear reactors,
so the answer to this question is: three quarters of 60 years – that is,
about 45 years.57
Now we come to the back-end processes: the energy cost of disposing of
the 60 years-worth of new waste is approximately the same as that of the
front end – that is, about one quarter of the gross output, or 15 years of
energy supply, so that brings the supply of available energy down to 30
years.

16 THE LEAN GUIDE TO NUCLEAR ENERGY
of agriculture will have a prior claim on South Australia’s water
resources.53
The BHP Billiton board has not yet made the final decision whether to go
ahead, but the independent nuclear energy analyst John Busby concludes
that it is “unlikely”, and that, even if it did, uranium production would
“certainly” be closer to 5,000 tonnes per annum than to the 15,000
tonnes which was originally planned.54
On this evidence is seems probable that, far from expanding in order to
sustain the flow of energy following the oil peak, the nuclear industry will
indeed begin to falter during the decade 2010-2019, with some nuclear
reactors being closed down for lack of fuel, and some of the reactors now
in the planning stage and under construction remaining unused
indefinitely.
In the light of this, a judgment has to be made as to whether hopes of a
revival of uranium supply are a sufficiently realistic foundation on which
to base expectations that the nuclear industry has a long term future as a
major energy provider. Even the NEA hedges its bets about this. Readers
are invited to read the following two sentences from the Executive
Summary with care and to decide for themselves whether they are
reassured that the uranium needed to fuel the industry’s recovery after
the coming shortfall will in fact be available:
The long lead-times needed to bring resources into production continues to
underscore the importance of making timely decisions to increase
production capability well in advance of any supply shortfall. Improved
information on the nature and extent of world uranium inventories and
other secondary sources would improve the accuracy of the forecasting
required to make these timely production decisions.55
And this brings us to the critical question of whether there will be enough
uranium to provide the energy to clear up the nuclear industry’s own
accumulated waste.
Can the industry supply the energy to clear its own waste?
First of all, we need some definitions. We can define the “net” energy
produced by the nuclear industry as the electricity generated minus
“front-end” energy – the energy needed to build reactors, to mine, mill,
enrich and prepare the fuel, and to carry out all the other energy-using
THE LEAN GUIDE TO NUCLEAR ENERGY 29
5. IN CONTEXT
The priority for the nuclear industry now should be to use the electricity
generated by nuclear power to clean up its own pollution and to phase
itself out before events force it to close down abruptly. Contrary to what
you might think, given the huge scale of its problems and its supposed
status as a fall-back position which could solve our energy problems the
nuclear energy industry is small, providing a mere 2½ percent of the
world’s final energy demand.75 Nuclear power is not a solution to the
energy famine brought on by the decline of oil and gas. Nor is it a means
of reducing emissions of greenhouse gases. It cannot provide energy
solutions, however much we may want it to do so.
But the conclusion that the nuclear industry cannot provide the energy we
need over the next three or four decades means that we have a problem.
An energy gap lies before us, for two reasons. First the damage done to
the self-regulating systems of the climate is already so great that we are at
or near the tipping point at which global heating will get out of control,
moving relentlessly but quickly towards a new equilibrium state possibly
lethal to the majority of the inhabitants of the planet and to its
civilisations. Secondly, we are at or near the "oil peak" at which supplies
of oil and (slightly later) gas will turn down into a relentless decline with
consequences on a scale comparable to those of climate change. In this
situation, we have little choice. If there is any energy source at all which
could operate on the scale and in the time needed to fill this energy gap,
then we must take it, even if it comes with enormous disadvantages.
Nuclear energy certainly has disadvantages, quite apart from the clincher
problem of the depletion of its fuel. It is a source of low-level radiation
which may be more dangerous than was previously thought. It is a source
of high-level waste which has to be sequestered. Every stage in the
process produces lethal waste, including the mining and leaching
processes, the milling, the enrichment and the decommissioning. It is
very expensive. It is a terrorist target and its enrichment processes are
stepping stones to the production of nuclear weapons.76
And yet, so great is the need for some way of closing-off the demand for
fossil fuels and filling the energy gap, and so serious are the consequences
of not doing so, that Lovelock can argue that it would be better to develop
nuclear energy, even with these disadvantages, than to fail to stop carbon

30 THE LEAN GUIDE TO NUCLEAR ENERGY
emissions – or else fall into the energy gap and take the consequences.
Lovelock writes: “We need emission-free energy sources immediately,
and there is no serious contender to nuclear fission”.77 He suggests that
the decision is much clarified for us if we recognise the risk of climate
change for what it is, and he adds that we will not succeed in doing this if
we do not in the process move beyond the intellectual analysis and,
instead, feel the fear:
Few, even among climate scientists and ecologists, seem yet to realise fully
the potential severity, or the imminence, of catastrophic global disaster;
understanding is still in the conscious mind alone and not yet the visceral
reaction of fear. We lack an intuitive sense, an instinct, that tells us when
Gaia is in danger.78
Lovelock’s argument is persuasive. But there are three grounds on which
it is open to criticism.
1. The nuclear fuel cycle
Uranium depletion is not a “flawed idea”; it is a reality that is just a little
way ahead. Lovelock’s otherwise brilliant analysis of climate change
displays no knowledge of the nuclear fuel-cycle. His optimism about the
feasibility of nuclear power in the future is a case of whistling in the dark.
2. Alternative energy strategies
Lovelock may underestimate the potential of the fourfold strategy which
can be described as “Lean Energy”, an application of “lean thinking” –
perceptive intelligence applied to systems. It consists of four aims:
(1) Energy efficiency: to achieve the decisive improvements in the
efficiency of energy-services made possible by the conservation and
energy-saving technologies.
(2) The proximity principle: to develop the potential for local provision of
energy, goods and services. This major structural change, reducing the
transport-dependency of goods, people and electricity, is difficult but
necessary. It is achievable only incrementally, building local competence
across the whole range of economics and culture. Deep reductions in
travel and transport can be expected to come about rapidly and brutally
as the oil market breaks down; adapting to them – and crucially,
preparing for them before the event – will take longer.
THE LEAN GUIDE TO NUCLEAR ENERGY 15
recent decline, with uranium production falling by (respectively), 15 and
20 percent in 2005-2006.50
In both cases, hopes for expanding production have been pinned on
major new projects – the new Cigar Lake mine in Canada, and the
expansion of Olympic Dam in Australia. Cigar Lake is designed to
produce nearly 7,000 tonnes per annum, and it was due to start in 2007.
However, in October 2006, it flooded; the probable way of containing the
water in the sandstone above the workings is by refrigeration, which will
require large inputs of energy even before work can begin. It is now
uncertain whether, even after long past and future delays, Cigar Lake will
ever be a substantial source of uranium.51
The contribution of Olympic Dam is in some ways even more dubious. At
present, it is an underground mine well past its maturity, and the
management, BHP Billiton, is considering whether to move to an
adjacent ore body with an open pit mine on a massive scale. The new
mine would be three kilometres in diameter and one kilometre deep, with
some 350 metres of rock overburden to be removed in order to get at the
ore. The problem is that the uranium ore is very low-grade – only 0.06
percent and less, with an average of 0.029 percent, so that it would be
uneconomic in money terms if it were not for the copper, gold and silver
which the rock also contains. But that itself is a mixed blessing because it
means that the copper is contaminated with small quantities of uranium,
which has to be removed in a smelter constructed in the Australian
desert, adding even greater energy-costs to the final energy yield.52
Doubts as to whether Olympic Dam is capable of yielding uranium with a
positive energy balance are increased by a recent study by Storm van
Leeuwen, who suggests that the energy return on the energy invested in
the mine is only marginally better than that of gas. Moreover, the
removal of 350 metres of overburden, followed by the milling of low-
grade ore would require Australia to import diesel oil with an energy
content not far short of the final energy-yield of the uranium it would
produce. High oil prices, aggravated by actual outages in oil supplies as
the effects of the oil peak mature, would cause problems for a project for
which a large and reliable flow of diesel would have to be guaranteed.
Moreover, the mine is in an area of extreme drought: even if it does
supply its own water by desalinating seawater, it is possible that the needs

14 THE LEAN GUIDE TO NUCLEAR ENERGY
it is, however, becoming less attractive to Russia, which needs all the fuel
it can get for its own expanding nuclear programme, and Russia is in any
case getting towards to the end of her supply of obsolete nuclear
warheads. There is no chance of the contract being renewed beyond
2013.45
Secondary supplies are also in decline. The inventories are approaching
exhaustion, and this has been one of the drivers of the recent sharp rise in
the price of uranium.46 The amount of uranium derived from tailings has
been falling, and it has been calculated that the scale of the task of
increasing production of uranium-235 now would require arrays of
continuously-operating gas centrifuge plants running into the millions.47
The supply of MOX fuel, derived from a reprocessing which is already at
its practical limits, is not expected to increase.48
URANIUM DEMAND AND SUPPLY BALANCE TO 2013 49
Demand (tonnes) Current demand, assumed unchanged from the present. 65,000
Supply (tonnes) Current supply (2007) 65,000 (of which 40,000 is produced from mines) Less loss of fuel from military uranium -10,000 Less loss of secondary supplies -10,000 Less decline in existing mines’ output -2,000 Equals expected reduction in absence of new projects -22,000 Deficit to be filled by new projects 22,000 Adding up to nominal supply by 2013 65,000
2013, the year in which the contract for military uranium expires, can be
taken to be a crucial date for uranium prospects, as summarised in the
table. Unless the production of mined uranium can be increased by some
22,000 tonnes per annum, there will be a 35 percent deficit in uranium
supply. So, the question is whether the production of mined uranium can
rise to compensate.
Can uranium production increase to fill the gap?
Although several of the medium-sized producers have in recent years
roughly maintained their output, or slightly increased it – notably
Kazakhstan, Namibia, Niger and Russia – the world’s two largest
producers – Canada and Australia – both show some evidence of being in
THE LEAN GUIDE TO NUCLEAR ENERGY 31
(3) Renewable energy: to design and build renewable energy systems to
match the needs and resources of the particular place and site.
(4) Tradable Energy Quotas (TEQs): to define a secure energy budget for
the whole economy, involving every energy-user in the common purpose
of achieving deep reductions in energy demand.79
It cannot be expected that this strategy will fill the energy gap completely,
or neatly, or in time, but nor is Lovelock suggesting that nuclear energy
could do so. Even if there were neither a uranium-supply problem to
restrain the use of nuclear energy, nor a waste-problem, and even if it
were the overriding priority for governments around the world, nuclear
energy would still fall far short of filling the gap. It would be impossible
to build all the nuclear power stations needed in time, and the energy
required for construction and for building the mining-milling-
enrichment-transport systems would mean that a rapidly-growing
nuclear energy industry would be using more energy than it provided
throughout most of its period of growth – the more rapid the growth, the
deeper the energy deficit it would cause.
There are good reasons to believe that Lean Energy could do better. It
would start to get results immediately. Per unit of energy-services
produced, it would be about ten times cheaper. It would be flexible and
sensitive to detail, making the best possible use of local conditions, skills
and ingenuity. It would be able to call on the skill and cooperation of the
entire population. And it would be part of an environmental and practical
evolution towards reduced transport, environmental protection and
strengthened local economics all coming together in a joined-up
programme.
3. The oil peak
Lovelock does not give enough weight to the significance of the oil peak.
As this weighs in, it will establish conditions in which there is no choice
but to conserve energy, whether the urgency of climate change is
recognised or not. Without the oil peak to concentrate the mind, action to
save the climate could be leisurely at best. With the oil peak reminding
us, by repeatedly turning out the lights and stopping us filling up our cars,
we will have an incentive to follow the one available option of Lean
Energy with all the will and determination we can find.
————————

32 THE LEAN GUIDE TO NUCLEAR ENERGY
What appears to follow from this is a best-of-both-worlds strategy: to
develop nuclear energy as far as the uranium supply allows, and at the
same time to develop Lean Energy. But the problem is that the two
strategies are substantially incompatible. A dash for nuclear energy
would reduce the funds and other resources, and the concentrated focus,
needed for Lean Energy. Nuclear energy relies on the existence of a fully-
powered-up grid system into which it can feed its output of electricity –
but the grid itself is mainly powered by the electricity from gas-fuelled
power stations, so that if gas supplies were to be interrupted, the grid
would (at least partially) close down, along with the nuclear reactors that
feed into it; Lean Energy, on the other hand, is flexibly organised around
local minigrids.
Nuclear energy inevitably brings a sense of reassurance that, in the end,
the technical fix will save us; Lean Energy calls on the whole range of
technology from the most advanced to the most labour-intensive, along
with adaptations in behaviour, in the economy, in the use of land and
distance, in the way food is grown and materials are used, and in the
sinews and culture of society itself. Nuclear energy’s potential
contribution to energy services in the future, starting from its present
level of 2½ percent of final energy demand, is small; the potential for
Lean Energy is at least twenty times greater. Nuclear energy is about
conserving the bankrupt present; Lean Energy is about inventing and
building a future that works.80
For these reasons, the best-of-both-worlds strategy of backing both
nuclear energy and Lean Energy could be expected to lead to worst-of-
both-worlds consequences. Lean Energy would be impeded by nuclear
energy; nuclear energy would be hopelessly ineffective without Lean
Energy. Result: paralysis. This should not be overstated: a few token
nuclear reactors to replace some of those that are about to be retired
would make it much harder to develop Lean Energy with the single-
minded urgency and resources needed, without necessarily ruling out
progress towards it entirely. But the defining reality of the energy future
has to be an acknowledgment that no large-scale technical fix is available.
Energy cannot any longer be delegated to experts. The future will have to
be a collective, society-transforming effort.
THE LEAN GUIDE TO NUCLEAR ENERGY 13
probably closer to 35 years.
Thirdly, both estimates are of the TREI limits, not the much earlier
turning-point to negative PREI.
These three factors bring forward the period during which deep deficits in
uranium supply can be expected, to the decade 2011-2020.
Supply crunch
And, indeed, there is a widely-shared recognition that there will be a
severe shortage of uranium around 2013. This is frankly acknowledged
by the NEA itself, and set in context by the First Uranium Corporation.40
Here are the reasons (remember that the numbers are approximations).
At present, about 65,000 tonnes of natural uranium are consumed each
year in nuclear reactors worldwide.41 The number of reactors in existence
in 2013 will be the product of (1) retirements of old reactors and (2) start-
ups of new ones. There is no basis for a reliable estimate of what that net
number will be, so we will assume that there is no change from the
present.42
About 40,000 tonnes of this total demand of 65,000 tonnes are supplied
from uranium mines, which leaves the remaining 25,000 tonnes to be
supplied from other sources.43 10,000 tonnes comes from “military
uranium” – that is, from the highly-enriched uranium salvaged from
nuclear weapons, chiefly from the arsenal which the Soviet Union built up
during the Cold War, and which is now being dismantled with the help of
subsidies from the United States. The remaining 15,000 tonnes comes
from a range of “secondary supplies”, consisting of inventories of
uranium fuel that have been built up in the past, together with recycled
mine tailings and some mixed-oxide fuel (MOX), a mixture of recycled
plutonium and depleted uranium.44
The expectation is that neither of these crucial supplements to mined
uranium have much longer to last. Military uranium is being depleted
rapidly. At present, it is sold to the United States by Russia on a supply
contract which expires in 2013. It is a blend of highly-enriched uranium
(HEU) and low-enriched uranium (LEU), and it is supplied in the form of
uranium hexafluoride. The deal is attractive to the United States, which
not only gets an invaluable supply of nuclear fuel, but does not have to
worry about disposing of the waste that arises in the enrichment process;

12 THE LEAN GUIDE TO NUCLEAR ENERGY
ore to be discovered, and that there are massive quantities of uranium in
the ground, but argue that the quality of the ore remaining after 60 years
of further extraction is likely to be too poor to yield a positive TREI.38
We have, then, two rather similar estimates – 70 years and 60 years – but
one of them then adds prognosticated and speculative reserves to give us
270 years supply at current rates; the other sees no evidence that the
prognosticated and speculative reserves would in fact give us a positive
TREI. Does this leave us in total confusion as to which to believe? Not
quite. As we know, from experience of the parallel case of peak oil, the
official agencies – in the case of oil, the United States Geological Survey
and the International Energy Agency – have a strong and now widely
acknowledged tendency for massive bias towards exaggerating future
prospects. 39 Prognosticated and speculative reserves, if they exist, will be
deep below the surface, requiring very large investments of time, capital
and energy before they can be exploited. Those speculative resources –
which the NEA hopes will one day becomes usable reserves – will need to
be remarkably rich, relative to the vast deposits of very low-grade and
useless ore of which we are already aware. That is, we know enough to err
on the safe side and stick to the demonstrable 60-70 year estimate of
remaining ore with a positive TREI, on which the NEA and Storm van
Leeuwen and Smith are agreed...
... and yet, let us look again at what that 60/70-year estimate really
means. Both the NEA and the Storm van Leeuwen and Smith estimates
contain assumptions which tend to exaggerate the time remaining before
depletion. First, both estimates are “reserves-to-production ratios” –
current reserves simply divided by current annual production, which
gives the misleading impression that production can continue at a
constant rate before coming to an abrupt stop. In fact, it is well
understood that, after reaching a peak well before the artificial cut-off
point given by the reserves-to-production ratio, production of a resource
in its latter years takes its time to decline towards zero; it is in the years
closely following the peak that the trouble starts, not in the year when
production finally comes to a stop.
Secondly, the growth in demand for uranium which the nuclear industry
seems to expect would, in any case, foreshorten the whole sequence: if 70
years is a relevant guideline for the creation of reserves if usage remains
constant, a likely cut-off point on the assumption of increasing demand is THE LEAN GUIDE TO NUCLEAR ENERGY 33
6. IT’S TIME TO TURN TO THE WIT AND
ENERGY OF THE PEOPLE
The strategic matters discussed in chapter 5 are important, but it is the
waste problem which is decisive. There is a turning-point when the
nuclear industry will become energy-bankrupt, if it has not already done
so. After that, it will never be able to generate the energy needed for
permanent disposal of its backlog of waste, even if it diverts its whole
energy output into the task.
This prospect needs to be researched urgently and by more than one
research centre with the authority to get at the facts, but otherwise
working independently of industry or government interests. Research
should also, with all speed, get evidence about the global warming and
ozone impacts of uranium hexafluoride and other solvents, both in use
and as leaking waste. And here is a hypothesis to which we need an
answer at some speed: if the worldwide backlog of nuclear wastes were
simply left to leak, catch fire and spread into the environment, the
resulting levels of radiation and toxicity would in principle require the
evacuation of the planet. True, or not?
Waste and depletion are two aspects of the same problem. For the timing
of depletion, we will consider four estimates, starting with one which
suggests that the industry will not recover from the 2011-2020 outages,
giving an estimate of 10 years before the industry ceases to be a
significant producer of electrical power owing to depletion of uranium
giving a positive practical return on energy invested (PREI). The second
estimate suggests that the industry does recover from the coming outages
and continues as an energy producer at roughly current rates for 30 years.
Thirdly, we take the estimate discussed in chapter 3, which has a time-
horizon of 6o years. Fourthly, let us suppose that this present analysis is
completely misguided, and that the industry will continue on its present
scale for another 200 years.
These estimates are now brought together with the estimates of the net
energy yielded by the nuclear industry, after the costs of the front-end
processes (procuring the fuel and producing energy from it) and back-end
processes (dismantling reactors and dealing with wastes) are taken into
account. They are summarised in the Energy Balance Sheet.

34 THE LEAN GUIDE TO NUCLEAR ENERGY
We have, then, four dates for the turning-point at which the industry will
never be able to supply the energy needed to get rid of its own wastes:
that is, energy-bankruptcy: 2000, 2010, 2025 and 2095.
o If it is 2000, the industry is already deep into its energy-bankruptcy. It
will never be able to get rid of its own waste from its own resources.
There is the prospect of having to call on the supplies of fossil fuel
energy, at a time of deepening scarcity, to deal with the nuclear waste
which the waning nuclear industry cannot clear up.
ENERGY BALANCE SHEET:
YEARS OF NET NUCLEAR ENERGY REMAINING FROM 2010 at current rates of extraction.
(Assumed start-date for industry 1950. Assumed present 2010. Numbers in years)
1. Estimate: years of positive PREI ore remaining 10 30 60 200
2. Front-end process energy (25% of remaining years) 2.5 7.5 15 50
3. Energy to clear new waste (25% of remaining years) 2.5 7.5 15 50
4. Energy to clear old waste (25% of past 60 years) 15 15 15 15
5. Total needed for front end plus back end (2+3+4) 20 30 45 115
6. Years remaining (1-5) -10 0 15 85
7. Year of energy-bankruptcy: all energy produced is 2000 2010 2025 2095
Suppose the industry, starting with no waste, has 200 years before its usable ore runs out. During that time, it generates a gross amount of energy which it feeds into the grid, but at the same time it must (a) provide the energy needed for its own front-end operation, (b) pay back the energy it used to mine its ore, build its reactors, etc., and (c) clear up its own wastes. As explained in chapter 3, pp 17-18, each of these amount to about 25 percent of its gross energy output. Therefore that amount – 75 percent of its gross output, must be subtracted to find the number of years for which the industry can continue before using the whole of its output to pay back its energy debt and clear up its wastes.
There are other ways in which this could be calculated – for instance, using net output (gross output less the front-end energy cost factored in over time); or the back-end work could start sooner. These would tell slightly different stories, but they would be equally valid. The method shown in the table is a reminder that the industry actually supplies less energy (net) than the gross energy that it puts into the grid. At a time of energy scarcity, this is a key consideration. And it tells us how long the industry has left before waste-disposal becomes the reason for its existence.
THE LEAN GUIDE TO NUCLEAR ENERGY 11
has to be some doubt as to whether, in the difficult years following the oil
peak, that scale of long-term financial investment will be available. This
is particularly doubtful in view of the fact that nuclear energy is really
suitable only for centralised electricity grids – which are likely to become
increasingly obsolete in the future as supplies of natural gas (for
generating grid electricity) become scarce and less reliable, and as the
cost-effective alternative of improving energy efficiency locally is
advanced with all speed under pressure of need.32
5. Local geological conditions. Practical local difficulties, such as flooding,
can be expected to increase as deeper and more remote mines are
exploited.
What all of this means is that an energy source – such as uranium ore –
ceases to be useful well before it actually reaches the point where the
theoretical return on energy invested – TREI – turns negative. It is the
practical return on energy invested – PREI – that matters. So, where
does the practical turning point lie, below which the ore quality is too
poor to be useful? We know that this varies with local conditions; we
know that uranium ores as poor as 0.03 percent are being mined now –
but only as a by-product in mines being exploited with other minerals; we
know that this will be a matter of perpetual debate; and we know that the
average ore grade being worked worldwide is at present about 0.15
percent.33 But for a worldwide average above which uranium ore can still
provide a positive PREI, a suggested guideline is no lower than 0.1
percent.34
Uranium supply
So – how much uranium ore with a positive PREI do we have left?
The “Red Book” is the most authoritative source on the quantity and
quality of the remaining uranium ore, and of future prospects for
production. It is prepared by the OECD Nuclear Energy Agency (NEA) in
partnership with the International Atomic Energy Agency (IAEA), and
the 2005 edition was published in June 2006.35 In its discussion of the
availability of usable uranium ore, it suggests that there is 70 years’
supply at the current price.36 It adds, however, that, when “prognostic-
ated and speculative” resources are added in, there is enough to maintain
current output for a further 270 years. 37
Storm van Leeuwen and Smith acknowledge that there is more uranium
needed to dispose of new and old waste (6+2010)

10 THE LEAN GUIDE TO NUCLEAR ENERGY
primarily by the quality (grade) of uranium ore that is being used. The
lower the grade of ore, the more energy is needed to mine and mill it and
to deal with the larger quantity of tailings. The limit, in theory, is reached
with an ore grade of about 0.01 percent for soft rocks such as sandstone,
and 0.02 percent for hard rocks such as granite. If grades lower than
those limits were to be used, more carbon dioxide per kilowatt hour
would be produced by the nuclear cycle than by the same amount of
energy produced from gas. The energy return on energy invested (EREI)
would be less than the energy return you would get if you generated the
electricity directly in a gas turbine.29
But these are only “theoretical” limits, because in practice the turning-
point to a negative energy return may be substantially sooner than that.
There are five key reasons why ore which is theoretically rich enough to
give a positive EREI may in fact not be rich enough to justify exploitation:
to yield a practical return on energy investment (PREI), a grade of ore is
needed which is substantially higher than the 0.01/0.02 percent
identified as the lower limits for a theoretical return. These “PREI
factors” are as follows:
PREI FACTORS
1. Deep deposits. Deposits at great depth, requiring the removal of massive
overburden, or the development of very deep underground mines, require
more energy to mine the resource than is required by the shallower mines
now being exploited. It is virtually certain that all uranium deposits near
the surface have already been discovered, so any deposits discovered in
the future will be deep.30
2. Water. You can have too little water (it is needed as part of the process of
deriving uranium oxide from the ore) or too much (it can cause flooding).
Some of the more promising mines have big water problems.31
3. A trivial contribution. If the EREI of an energy project is only slightly
positive, the problem is that you get so little energy back that it can never
make a useful contribution to meeting demand: even with a vast industry
and inputs of resources and land, you still cannot derive energy in useful
amounts.
4. An investment that may not be available. The poorer ores of the future
will have to be derived from extremely large mines, which will require
many years of investment before they produce any payback at all. There
THE LEAN GUIDE TO NUCLEAR ENERGY 35
o If it is 2010, the whole of the energy produced by the industry over its
remaining life of 30 years must be directed into clearing up its own
wastes, starting now.
o If it is 2025, the industry has some fifteen years before the onset of
energy bankruptcy.
o If it is 2095, we are looking at an industry facing, in 85 years time, an
inheritance 0f waste whose treatment will demand a flow of energy
equal to some 115 years of electricity output – and with no electricity
left over to sell.
In other words, the greater the estimate of remaining reserves, the longer
the period of energy debt. In the event of the recklessly optimistic
estimate of there being 200 years uranium remaining with a positive
PREI, the last 115 years of the nuclear industry’s operation would be
committed to paying back its energy debt, dealing with the backlog of
wastes, and with the large accumulation of its new wastes accrued during
the final 200 years of its life. An energy debt on this scale is scarcely good
news. Nor is the financial debt that would go with it.
With some justice, the nuclear industry could point out that the task of
dealing with its wastes has already started, and that high-level waste has
to be allowed to cool off. An experimental deep repository for high-level
waste has been excavated in Sweden; Finland has started on a real one at
Olkiluoto; plans to build one in Nevada are being debated; and research is
being done into ways of dealing with uranium hexafluoride. And yet, the
questions of where exactly it will go, who will take responsibility for the
waste held in deteriorating stockpiles in unstable regions, how to pay for
it and, above all, where the energy will come from, remain unanswered.
Meanwhile, the industry continues to add to the problem. And suitable
sites – stable, preferably dry, and enjoying the support of the local
population – are rare; the vast size of a permanent repository, the
technical difficulty, the energy needed and the cost all bring this massive
task of long-term disposal to the edge of what is possible. It may in fact
never be possible to find a permanent resting-place for all, or even for a
decent proportion, of the waste that has already been produced.
The nuclear industry should therefore focus on finding solutions to the
whole of its waste problem before it becomes too late to do so. And hold
it right there, because this is perhaps the moment to think about what
“too late” might mean. Notwithstanding the emphasis placed on

36 THE LEAN GUIDE TO NUCLEAR ENERGY
depletion in this booklet, it is climate change that may
well set the final date for completion of the massive and
non-negotiable task of dealing with nuclear waste.
Many reactors are in low-lying areas in the path of
rising seas; and many of the storage ponds, crowded
with high-level waste, are close by. Estimated dates for steep rises in sea
levels are constantly being brought forward. With an angry climate, and
whole populations on the move, it will be hard to find the energy, the
funds, the skills and the orderly planning needed for a massive
programme of waste disposal – or even moving waste out of the way of
rising tides. When outages in gas supplies lead to break down in
electricity supplies, the electrical-powered cooling systems that stop high-
level waste from catching fire will stop working. It will also be hard to
stop ragged armies, scrambling for somewhere to live, looting spent fuel
rods from unguarded dumps, attaching them to conventional explosives,
and being prepared to use them.
All this will have to be dealt-with, and at speed. There may be no time to
wait for reactor cores and high-level wastes to cool down. But, then, it
may be a frank impossibility to bury them until they have cooled down...
In any event, the task of making those wastes safe should be an
unconditional priority, equal to that of confronting climate change itself.
The default-strategy of seeding the world with radioactive time-bombs
which will pollute the oceans and detonate at random intervals for
thousands of years into the future, whether there are any human beings
around to care about it or not, should be recognised as off any scale
calibrated in terms other than dementia.
Nuclear power is the energy source that claims a significance and causes
trouble far beyond the scale of the energy it produces. It is a distraction
from the need to face up to the coming energy gap, to inform the public
and to call on the wit and energy which is available to develop a
programme of Lean Energy. Of the many shortcomings in the response
to energy-matters, a central one has been the failure to involve the public
in doing what it could, given a chance, be good at – inventing solutions
and making them happen in realistic local detail. Determined attempts
are being made to rectify this (the U.K. Government’s Climate Change
Communication Initiative is an example) but the construction of nuclear
reactors, presented as almost carbon-free fixes for the energy problem, is THE LEAN GUIDE TO NUCLEAR ENERGY 9
power year, about 200 tonnes of
natural uranium has to be
processed. Secondly, hex is a
halogenated compound (HC),
one of several that are used at
various stages of the cycle. HCs
are potent greenhouse gases.
The global warming potential of
freon-114, for instance, is nearly
10,000 times greater than that
of the same mass of carbon
dioxide.20
There is no published data on
releases of HCs from nuclear
energy. There must be a
suspicion that they reduce any
advantage over fossil fuels
which the nuclear power
industry enjoys at present in the
production of greenhouse gases.
Given the unfounded but
popular presumption that
nuclear energy is carbon-free, it
would be helpful if a reliable
study of all releases of
greenhouse gases from the
nuclear fuel cycle, and their
effect on the atmosphere, were
commissioned and published
without delay.
Ore quality
Both the quantity of greenhouse
gases released by nuclear energy
per kilowatt hour and the net
energy return of the nuclear
industry are determined
GREENHOUSE GAS EMISSIONS
By stage in the nuclear cycle
Estimates for the release of carbon dioxide from the nuclear cycle vary widely. The U.K. Government’s 2007 Nuclear Power Consultation accepts estimates that, across its whole life-cycle, nuclear power emits between 7 and 22 g/kWh,21 but empirical analysis of the energy intensity and carbon emissions at each stage of the nuclear cycle produces much higher figures. This is shown (for instance) in the Integrated Sustainability Analysis (ISA) by The University of Sydney, which concludes that the greenhouse gas (GHG) intensity of nuclear power varies within the range 10-130≈60 g/kWh.22 The estimate (below) by Storm van Leeuwen and Smith (SLS) is higher because it reflects best practice, which may be better than standard good practice, especially for waste treatment and disposal, and because the reality of errors and problems in the nuclear cycle typically raises the energy cost well beyond the planned level.23 A recent example of this is the construction of the new Olkiluoto reactor in Finland, where (owing to trial and error) much of the concrete has to be re-laid, raising the carbon emissions associated with the project well beyond the intention.24
The assumed reactor lifetime is 30 full-power years; the ore grade is 0.15 percent; at lower grades, emissions would rise sharply. SLS covers just CO2.25 ISA’s estimate includes all GHG emissions from the nuclear cycle.26 GHG emissions gas-fired electricity generation are about 450 g/kWh.27
OPERATION Construction Front end28 Back end28 Dismantling Total
CO2 g/kWh 12-35 36 17 23-46 88-134

8 THE LEAN GUIDE TO NUCLEAR ENERGY
3. GREENHOUSE GASES, ORE QUALITY
AND URANIUM SUPPLY
Greenhouse gases
Every stage in the life-cycle of nuclear fission uses energy, and most of
this energy is derived from fossil fuels. Nuclear power is therefore a
substantial source of greenhouse gases. The delivery of electricity into the
grid from nuclear power produces, at present, roughly one third as much
carbon dioxide as the delivery of the same quantity of electricity from
natural gas...17
... or, rather, it would do so, if the full energy cost of producing electricity
from uranium were counted in – including the energy cost of all the
waste-disposal commitments (chapter 2). Unfortunately (in part because
of the need to allow high-level waste to cool off) that is not the case.
Nuclear waste-disposal is being postponed until a later date. This means
that the carbon emissions associated with nuclear energy look rather
good at the moment: at about 60 grams per kWh they are approximately
16 percent of the emissions produced by gas-powered electricity
generation. The catch is that this figure roughly doubles when the
energy-cost of waste-disposal is taken into account, and it grows
relentlessly as the industry is forced to turn to lower-grade ores. What
lies ahead is the prospect of the remaining ores being of such poor quality
that the gas and other fossil fuels used in the nuclear life-cycle would
produce less carbon dioxide per kilowatt-hour if they were used directly
as fuels to generate electricity.18
Carbon dioxide is not the only greenhouse gas released by the nuclear
industry. The conversion of one tonne of uranium into an enriched form
requires the addition of about half a tonne of fluorine, producing uranium
hexafluoride gas (hex) to be used in the centrifuge process. At the end of
the process, only the enriched fraction of the gas is actually used in the
reactor: the remainder, depleted hex, is left as waste. Not all of this gas
can by any means be prevented from escaping into the atmosphere, and
most of it will eventually do so unless it is packed into secure containers
and finally buried in deep repositories.19
It is worth remembering here, first, that to supply enough enriched fuel
for a standard 1GW (1 gigawatt = 1 billion watts) reactor for one full- THE LEAN GUIDE TO NUCLEAR ENERGY 37
not a good way of involving the public. It is only when we are free of such
narcotic fallacies that there will be a commitment to the one option for
which there is a prospect of success: tapping the energy of the people.
We have to integrate energy, economics and society, and to enable them
to develop in a way which copes with the reality of the energy gap that is
now almost upon us. That calls for an effective framework which makes it
clear to all of us – citizens, firms, the government, everyone – what the
energy limits are now, and achieves an orderly descent to the low limits
that will apply in the future. It is then up to us to bring all the skill,
ingenuity and judgment we can to negotiating our way down the energy
descent. We need to discover a common purpose. All this is possible if
there is an appropriate framework for it, a system in which individual
motivations are aligned with the collective need. There are various names
for it. One of them is Tradable Energy Quotas (TEQs).
We need to enable small-scale actions to build up onto a scale that gets
results; we need a robust, simple, system for recruiting ingenuity and
intelligence, and the common purpose to make it happen now. Such a
design exists. There is a non-nuclear life-cycle ready and waiting.81

38 THE LEAN GUIDE TO NUCLEAR ENERGY
THE LEAN GUIDE TO NUCLEAR ENERGY 7
the U.S. in a twenty-year period as between 15-45 percent. The risk never
goes away; society bears the pain and carries on but, in the case of nuclear
power, there is a difference: the consequences of a serious accident –
another accident on the scale of Chernobyl, or greater, or much greater –
would take nuclear power towards being an uninsurable risk, even with
the help of government subsidies for the premiums.15
And a by-product of this – “waste” in the fourth sense – is the plutonium
itself which, when isolated and purified in a reprocessing plant, can be
brought up to weapons-grade, making it the fuel needed for nuclear
proliferation. This is one of three ways in which the industry is the
platform from which the proliferation of nuclear weapons can be
developed; the second one is by enriching the uranium-235 to around 90
percent, rather than the mere 3.5 percent required by a reactor. The third
consists of providing a source of radioactive materials which can be
dispersed using conventional explosive - a “dirty bomb”.
4. The reactor. Nuclear reactors at present have a lifetime of about 30-
40 years, but produce electricity at full power for no more than 24 years;
the new European Pressurised Water Reactors (EPR), it is claimed, will
last longer. During their lifetimes, reactors have to be maintained and (at
least once) thoroughly refurbished; eventually, corrosion and intense
radioactivity make them impossible to repair. Eventually, they must be
dismantled, but experience of this is limited. As a first step, the fuel
elements must be put into storage; the cooling system must be cleaned to
reduce radioactive corrosion residuals and unidentified deposits (CRUD).
These operations, together, produce about 1,000 m3 of high-level waste.
After a cooling-off period which may be as much as 50-100 years, the
reactor has to be dismantled and cut into small pieces to be packed in
containers for final disposal. The total energy required for
decommissioning has been estimated at approximately 50 percent more
than the energy needed in the original construction.16

6 THE LEAN GUIDE TO NUCLEAR ENERGY
3. Generation. The fuel can now be used to produce heat to raise the
steam to generate electricity. In due course the process generates waste
in the form of spent fuel elements and, whether these are then
reprocessed and re-used or not, eventually they have to be disposed of.
But first they must be allowed to cool off in ponds to allow the isotopes to
decay to some extent, for between 10 and 100 years – sixty years may be
taken as typical. The ponds need a reliable electricity supply to keep them
stirred and topped up with water to stop the radioactive fuel elements
drying out and catching fire. In due course, these wastes will need to be
packed, using remotely-controlled robots, into very secure canisters lined
with lead, steel and pure electrolytic copper, in which they must lie buried
in giant geological repositories considered to be stable. It may turn out in
due course that there is one best solution, but there will never be an ideal
way to store waste which will be radioactive for a thousand centuries or
more and, whatever option is chosen, it will require a lot of energy. For
example, the energy needed over the lifetime of a reactor to manufacture
the canisters (each weighing more than ten times as much as the waste
they contain), and to make the electrolytic copper, has never been
verified, but it is estimated to be about equal to the energy needed to
build the reactor in the first place.13
A second form of waste produced in the generation process consists of the
routine release of very small amounts of radioactive isotopes such as
hydrogen-3 (tritium), carbon-14, plutonium-239 and many others into
the local air and water. The significance of this has only recently started
to be recognised and investigated.14
A third, less predictable, form of waste occurs in the form of emissions
and catastrophic releases in the event of accident. The nuclear industry
has good safety systems in place; it must, because the consequences of an
accident are so extreme. However, it is not immune to accident. The
work is routine, requiring workers to cope with long periods of tedium
punctuated by the unexpected, along with “normality-creep” as anomalies
become familiar. The hazards were noted in the mid-1990s by a senior
nuclear engineer working for the U.S. Nuclear Regulatory Commission: “I
believe in nuclear power but after seeing the NRC in action, I’m
convinced a serious accident is not just likely, but inevitable... They’re
asleep at the wheel.” Every technology has its accidents; indeed, the
Nuclear Regulatory Commission estimates the probability of meltdown in
THE LEAN GUIDE TO NUCLEAR ENERGY 39
SOURCES
AFX News 2007), “TVO says won’t share nuclear reactor cost overruns with Areva”, at http://www.forbes.com/markets/feeds/afx/2007/09/28/afx4165822.html (http://tinyurl.com/2w2kl4 ).
Areva (2007a), “The first generation III+ reactor currently under construction”, at http://www.areva-np.com/scripts/info/publigen/content/templates/show.asp?[-] P=1655&L=US&SYNC=Y (http://tinyurl.com/y557hh ).
Areva (2007b) Presentations: “Business and Strategy Overview” http://www.areva.com/servlet/BlobProvider?blobcol=urluploadedfile&blobheader=application%2Fpdf&blobkey=id&blobtable=Downloads&blobwhere=1141726537731&filename=Overview+July+2007.pdf (http://tinyurl.com/3y855b ). (Reference became unavailable at 25/10/07).
Australia Uranium Association (2007), “Australia’s Uranium Mines”, www.uic.com.au/emine.htm.
BHP Billiton (2007), Annual Report, at http://www.bhpbilliton.com/bbContent[-] Repository/bhbpannualreport07.pdf (http://tinyurl.com/26f2mz )
Boyle, Godfrey (2004), Renewable Energy, Oxford.
Bunn, Matthew (2003), “Reducing Excess Stockpiles”, Nuclear Threat Initiative (NTI), www.nti.org/e_research/cnwm/reducing/heudeal.asp
Bureau of Air Quality (2007), “Greenhouses Gases and their Global Warming Potential Relative to CO2” at www.state.me.us/dep/air/emissions/ghg-equiv.htm .
Busby, Chris (1995), Wings of Death, Aberystwyth: Green Audit.
Busby, John (2006), “Rip van Winkel Wakes”, http://www.sandersresearch.com/index.php?option=com_content&task=view&id=993&Itemid=105). http://tinyurl.com/2lkbml ).
Busby, John (2007a), “A Little Makes a Lot?” http://www.sandersresearch.com/index.php?option=com_content&task=view&id=1300&Itemid=105. (http://tinyurl.com/35gunk )
Busby, John (2007b), “An Even Bigger Hole”, http://sandersresearch.com/index.php?option=com_content&task=view&id=1323&Itemid=103 (http://tinyurl.com/35pefj).
Cameco’s website: www.cameco.com.
Canadian Nuclear (2007), FAQ at http://www.nuclearfaq.ca/cnf_sectionG.htm .
Collell, Marcel Coderich (2005), “The Nuclear Mirage and the World Energy Situation”, Real Instituto Elcano, http://www.realinstitutoelcano.org/analisis/925.asp.
Committee Examining Radiation Risks of Internal Emitters (CERRIE), (2004), Report, at www.cerrie.org.
Committee on Radioactive Waste Management (July 2006), “Managing Our Radioactive Waste Safely”, Final Report 31/7/06. www.corwm.org.uk.

40 THE LEAN GUIDE TO NUCLEAR ENERGY
http://energybulletin.net/33164.html.
Dzhakishev, Moukhtar (2004), “Uranium Production in Kazakhstan as a Potential Source for Covering the World Uranium Shortage”, World Nuclear Association, at http://www.world-nuclear.org/sym/2004/dzhakishev.htm.
Edwards, Gordon (2004), “Health and Environmental Issues Linked to the Nuclear Fuel Chain”, Section A: Radioactivity, at www.ccnr.org/ceac_B.html .
First Uranium Corporation (2007), Annual Information Form at http://www.firsturanium.com/downloads/2007_annual_information_form.pdf (http://tinyurl.com/28xmy8 ).
Fleming, David (2007), Energy and the Common Purpose: Descending the Energy Staircase with Tradable Energy Quotas (TEQs), third edition, London: The Lean Economy Connection, www.teqs.net.
Greenpeace (2005), International Briefing Paper (18th November), “Europe’s Radioactive Secret: How EDF [Électricité de France] and European nuclear utilities are dumping nuclear waste in the Russian Federation”, at http://www.greenpeace.[-] org/international/press/reports/european-rad-secret. (http://tinyurl.com/2adgea ).
Grimston, Malcolm (2005), Memorandum to the Select Committee on Environmental Audit, U.K. House of Commons.
Huwyler, S., L. Rybach and M. Taube (1975), “Extraction of uranium and thorium and other metals from granite”, EIR-289, Technical Communications 123, Eidgenossische Technische Hochschule, Zurich, September, tr. Los Alamos Scientific Laboratory, LA-TR-77-42, 1977), cited in Storm van Leeuwen (2006E).
Institute for Energy and Environmental Research (2005), Uranium Fact Sheet at http://www.ieer.org/fctsheet/uranium.html [sic - the typo may have been corrected by the time you read this].
International Energy Agency (2007), Key World Energy Statistics, http://www.iea.org/textbase/nppdf/free/2007/key_stats_2007.pdf (http://tinyurl.com/2vqztn )
International Atomic Energy Agency (2001), Analysis of Atomic Energy Supply to 2050, at http://www-pub.iaea.org/MTCD/publications/PDF/Pub1104_scr.pdf.
ISA, University of Sydney (2005), Life-Cycle Energy Balance and Greenhouse Gas Emissions of Nuclear Energy in Australia, University of Sydney, at http://www.pmc.gov.au/publications/umpner/docs/commissioned/ISA_report.pdf (http://tinyurl.com/2omtaq )
King, David (2004), “Global Warming, the science of climate change, the imperatives for action”, Greenpeace Business Lecture, Royal Society of Arts, 12 October.
Lean Economy Connection (2007), www.theleaneconomyconnection.net/links.html
Lidsky, Lawrence M., and Marvin M. Miller (1998), “Nuclear Power and Energy Security: A Revised Strategy for Japan”. (Website no longer available).
Lovelock, James (2006), The Revenge of Gaia, London: Penguin.
THE LEAN GUIDE TO NUCLEAR ENERGY 5
limestone and made insoluble with
phosphates; the overburden of rock covering
the ore strata should be replaced and the area
should be replanted with indigenous
vegetation. In fact, all this is hardly ever
done, and it is regarded as an ideal rather
than a requirement of best practice. It would
require some four times the energy needed to
mine the ore in the first place.8
2. Preparing the fuel. The uranium oxide
(U3O8) then has to be enriched. Natural
uranium contains about 0.7 percent uranium-
235; the rest is mainly uranium-234 and -
238, neither of which directly support the
needed chain reaction. In order to bring the
concentration of uranium-235 up to the
required 3.5 percent, the oxide is reacted with
fluorine to form uranium hexafluoride (UF6),
or “hex”, a substance with the useful property
that it changes – sublimes – from a solid to a
gas at 56.5°C, and it is as a gas that it is fed
into an enrichment plant. About 85 percent
of it promptly comes out again as waste in the
form of depleted uranium hexafluoride, known as “enrichment tails”.10
Some of that waste is converted into depleted uranium metal, some of
which is in turn sometimes distributed back into the environment via its
use in armour-piercing shells, but most of it is stored as enrichment tails
in the form of gas. It reacts violently or explodes on contact with water
(including water vapour in the air), so it ought to be transferred from its
temporary containers to steel and concrete containers and buried in
geological repositories. In fact, most is put on hold: each year, about
8,000 tonnes are added to France’s store of 200,000 tonnes of depleted
uranium, and a further 8,000 tonnes are exported from Europe to
Russia.11
The 15 percent which emerges as enriched uranium is then converted into
ceramic pellets of uranium dioxide (UO2), packed in zirconium alloy
tubes, and bundled together to form fuel elements for reactors.12
RADIOACTIVE POEM
The decay sequence of
uranium-2389
The sequence starts with
uranium-238. Half of it
decays in 4.5 billion years,
turning as it does so into
thorium-234 (24 days),
protactinium-234 (one
minute), uranium-234
(245,000 years), thorium-
230 (76,000 years),
radium-226 (1,600 years),
radon-222 (3.8 days),
polonium-218 (3 minutes),
lead-214 (27 minutes),
bismuth-214 (20 minutes),
polonium-214 (180
microseconds), lead-210
(22 years), bismuth-210 (5
days), polonium-210 (138
days) and, at the end of the
line, lead-206 (non-
radioactive).
Déry, Patrick, and Bart Anderson (2007), “Peak Phosphorus”, Energy Bulletin,

4 THE LEAN GUIDE TO NUCLEAR ENERGY
2. WHAT IS REALLY INVOLVED IN
NUCLEAR ENERGY?
To produce electricity from uranium ore, this is what you have to do.
1. Mining and milling. Uranium is widely distributed in the earth’s crust,
but only in minute quantities, with the exception of a few places where it
has accumulated in concentrations rich enough to be used as an ore. The
main deposits of ore, in order of size, are in Australia, Kazakhstan,
Canada, South Africa, Namibia, Brazil, the Russian Federation, the USA,
and Uzbekistan. There are some rich ores; concentrations of uranium
oxide as high as 10 percent have been found, but 0.2 percent (two parts
per thousand) or less is usual. Most of the usable “soft” (sandstone)
uranium ores have a concentration in the range between 0.2 and 0.01
percent; in the case of “hard” (granite) ore, the usable lower limit is 0.02
percent. The mines are usually open-cast pits which may be up to 250m
deep. The deeper deposits require underground workings and some
uranium is mined by “in situ leaching”, where hundreds of tonnes of
sulphuric acid, nitric acid, ammonia and other chemicals are injected into
the strata and then pumped up again after some 3-25 years, yielding
about a quarter of the uranium from the treated rocks and depositing
unquantifiable amounts of radioactive and toxic metals into the local
environment.7
When it has been mined, the ore is milled to extract the uranium oxide.
In the case of ores with a concentration of 0.1 percent, the milling must
grind up about 1,000 tonnes of rock to extract one tonne of the bright
yellow oxide called “yellowcake”. Both the oxide and the tailings (that is,
the 999 tonnes of rock that remain) are kept radioactive indefinitely by,
for instance, uranium-238, and they contain all thirteen of its radioactive
decay products, each one changing its identity as it decays into the next,
and together forming a cascade of heavy metals with their spectacularly
varied half-lives (see Radioactive Poem opposite).
Once these radioactive rocks have been disturbed and milled, they stay
around. They take up much more space than they did in their
undisturbed state, and their radioactive products are free to be washed
and blown away into the environment by rain and wind. These tailings
ought therefore to be treated: the acids should be neutralised with THE LEAN GUIDE TO NUCLEAR ENERGY 41
nuclear.org/sym/2005/maeda.htm .
Miller, G. Tyler (2000), Living in the Environment: Principles, Connections and Solutions, (eleventh edition), Pacific Grove, CA: Brooks/Cole.
Mudd, Gavin and Mark Diesendorf (2007), “Sustainability Aspects of Uranium Mining: Towards Accurate Accounting?”, Second International Conference on sustainability Engineering and Science, Auckland, 20-23 February http://civil.eng.monash.edu.au/about/staff/muddpersonal/2007-SustEngSci-Sust-v-Uranium-Mining.pdf (http://tinyurl.com/ynsv77 )
NEA/IAEA (2006): Nuclear Energy Association / International Agency, Uranium 2005: Resources, Production and Demand, (the “Red Book”), available from the OECD in Paris.
Executive Summary at http://www.nea.fr/html/general/press/2006/redbook[-] /welcome.html (http://tinyurl.com/23rdxk )
Slide Presentation at http://www.nea.fr/html/general/press/2006/[-] redbook/redbook.pdf (http://tinyurl.com/ysbxbe )
Nicolet, Jean-Paul and Douglas Underhill (1998), “Balancing Needs: Global Trends in Uranium Production and Demand”, IAEA Division of Nuclear Fuel Cycle and Waste Technology, at http://f40.iaea.org/worldatom/Periodicals/Bulletin[-] /Bull401/article4.html. (http://tinyurl.com/2scmcl )
Nielsen, Rolf Haugaard (2006), “Final Resting Place”, New Scientist, No 2541, 4 March, pp 38-41.
Nuclear Fuel Energy Balance Calculator (2007) at http://www.wise-uranium.org/nfce.html .
Oxford Research Group, ed (2006a), Storm van Leeuwen, “Energy Security and Uranium Reserves”, Factsheet 4, at http://www.oxfordresearchgroup.org.uk/[-] publications/briefing_papers/energyfactsheet4.php (http://tinyurl.com/2ntqkt ).
Oxford Research Group, ed (2006b), Storm van Leeuwen, “Energy from Uranium”, http://www.stormsmith.nl/publications/Energy%20from%20Uranium%20-%20July%202006.pdf (http://tinyurl.com/3atnrd )
Pearce, Fred (2006), The Last Generation, Eden Project.
Rio Tinto (2005), “Increase in Ranger Mine’s Reserves and Resources”, (press release), http://www.riotinto.com/documents/Media/PR444g_ERA_Increase_[-] in_Ranger_mine_reserves_resources.pdf (http://tinyurl.com/yrb59c )
SLS. Abbreviation for Jan Willem Storm van Leeuwen and Philip Smith (2005).
Stern, Nicholas (2007), The Economics of Climate Change,http://www.hm-treasury.gov.uk/independent_reviews/stern_review_economics_climate[-] _change/stern_review_report.cfm . (http://tinyurl.com/ye5to7 ).
Storm van Leeuwen, Jan Willem and Philip Smith (2005), Nuclear Power: The Energy Balance”, at http://www.stormsmith.nl/ . This is being revised and replaced by Storm van Leeuwen (2007), but the original is still available on this site. Abbreviated in these notes and references to SLS.
Maeda, Haruo (2005), The Global Nuclear Fuel Market: Supply and Demand to 2030, World Nuclear Association Symposium 2005, http://www.world-

42 THE LEAN GUIDE TO NUCLEAR ENERGY
Storm van Leeuwen (2006B), “Greenhouse Gases from Nuclear”, Appendix B, in Evidence to the IPCC Working Group III, Fourth Assessment Report Draft for Expert Review. (2006B*) is a subsequent revision. For accessible and edited versions of these appendices, see Storm van Leeuwen (2007).
Storm van Leeuwen (2006C), “Breeders”, Appendix C.
Storm van Leeuwen (2006E), “Uranium Resources and Nuclear Energy”, Appendix E.
Storm van Leeuwen (2006E2), “Uranium from Seawater”, Appendix E2.
Storm van Leeuwen (2006F), “Reprocessing”, Appendix F.
Storm van Leeuwen (2007), Jan Willem, Nuclear Power: The Energy Balance”, at http://www.stormsmith.nl/ . Abbreviated in these notes to SAL. At 21/10.2007, only Parts A-D are yet on-line.
Strahan, David (2007), The Last Oil Shock, London: John Murray.
Sustainable Development Commission (2006), (1) The Role of Nuclear Power in a Low Carbon Economy; (2) Is Nuclear the Answer? a commentary by Jonathon Porritt, Chairman, Sustainable Development Commission; (3) Evidence-Based Papers (1-8) – see www.sd-commission.org.uk/
SVL. Abbreviation for Storm van Leeuwen (2007).
Uranium Information Council (2004), “Thorium”, www.uic.com.au/nip67.htm.
Womack, James and Daniel Jones (2003), Lean Thinking, second edition, London: Simon & Schuster.
World Nuclear Association (2007a), at http://www.world-nuclear.org/
World Nuclear Association (2007b), “World Nuclear Power Reactors and Uranium Requirements, http://www.world-nuclear.org/info/reactors.html.
World Nuclear Association (2007c): “Uranium Production Figures (1998-2006), www.world-nuclear.org./info/uprod.html.
World Nuclear Association (2007d), “Thorium”, http://www.world-nuclear.org/info/inf62.html
Zittel, Werner and Jörg Schindler (2006), Uranium Resources and Nuclear Energy, Energy Watch Group, http://www.energyshortage.com/uran/docs2006/REO-Uranium_5-12-2006.pdf (http://tinyurl.com/2uggkd ).
THE LEAN GUIDE TO NUCLEAR ENERGY 3
delay. Well, this is undoubtedly something we need to think about and
decide on; however, that thinking must be firmly based on the practical
realities of the nuclear fuel cycle. We do not need to get involved in the
arcane physics of the nuclear reaction itself, but we do need to know – if
we are to make any sense of this – what the production of electricity from
nuclear power really involves. And who is “we”? It is all of us, scientists
or not: this has to be an informed citizens’ decision.5
The principal source for what follows is the long-sustained programme of
research on the nuclear energy life-cycle by the nuclear engineer Jan
Willem Storm van Leeuwen and the nuclear scientist the late Dr Philip
Smith. Their work, based on total immersion in the literature of the
science and technology of nuclear power, is motivated not by the
intention to make a case either for or against, but to bring the best
available information on the energy balance of the nuclear industry to the
attention of policy makers and into the public debate. This booklet does
not rely exclusively on their research; it refers also to many other studies
such as those of the University of Sydney and the U.K. Sustainable
Development Commission, along with the work of the World Nuclear
Association, the Uranium Information Council, Greenpeace and others.
The quality of data about the nuclear energy cycle is poor, and every study
reflects this in some way; nonetheless, the analysis by Storm van Leeuwen
and Smith, which has benefited from several years of critics’ comments
and answered questions and revisions, provides an exhaustive and well-
researched guide to a sensible view of the future of nuclear energy.6
If there is to be proper and inclusive consultation on the question of
nuclear energy, citizens and their representatives need to be aware of
some of the principles; for instance, they need to be free of popular
misconceptions about the nuclear process producing no carbon dioxide
and being an unlimited source of energy. This gentle tour round the
nuclear life-cycle explains what happens at each stage – and it turns out,
at every stage, to be in trouble. But, as we shall see, a different sort of life
cycle is available – a realistic way forward. It replaces the large-scale,
central, uniform technical fix with small-scale, local judgment. It adapts
to local conditions and enhances skills. It is a life-cycle with promise.

2 THE LEAN GUIDE TO NUCLEAR ENERGY
While other neutrons from the reaction go their separate ways, some go
on to do something very interesting: if one collides with an atom of
uranium-238, one of the other isotopes of uranium, it may stay there,
triggering a couple of decay cycles to form plutonium-239. And
plutonium-239 shares with uranium-235 the property that it, too, splits
when struck by neutrons, so that it begins to act as a fuel as well.3
The process can be controlled; the control is provided by a moderator
consisting of water or graphite, which speeds the reaction up, and by
neutron-absorbing boron control rods, which slow it down. Eventually,
however, the uranium gets clogged with radioactive impurities such as the
barium and krypton produced when uranium-235 decays, along with
“transuranic” elements such as americium and neptunium, and a lot of
the uranium-235 itself gets used up. It takes a year or two for this to
happen, but eventually the fuel elements have to be removed, and fresh
ones inserted. The spent fuel elements are very hot and radioactive
(stand close to them for a second or two and you are dead), so there are
some tricky questions about what to do with them. Sometimes spent fuel
is recycled (reprocessed), to extract the remaining uranium and
plutonium and use them again, although you don’t get as much fuel back
as you started with, and the bulk of impurities still has to be disposed of.
Alternatively, the whole lot is disposed of – but there is more to this than
just dumping it somewhere, for it never really goes away. The half-life of
uranium-238, one of the largest constituents of the waste, is about the
same as the age of the earth: 4.5 billion years.4
Those are the principles. Now for a closer look at what nuclear energy
means. An informed discussion is especially needed, now that James
Lovelock has produced his devastating challenge, arguing that climate
change is so real, so advanced
and potentially so catastrophic
that the risks associated with
nuclear power are trivial by
comparison – and that there is
no alternative. Nuclear
energy, he insists, is the only
large-scale option: it is feasible
and practical; a nuclear
renaissance is needed without
THE LEAN GUIDE TO NUCLEAR ENERGY 43
NOTES AND REFERENCES
1. Radioactivity is a property of minute particles in the dust, food and water which we take into our bodies every day. Some is natural background radiation, released by local rocks, and in most cases our bodies have had millions of years’ practice in coping with them or secreting them. Some radioactive particles, however, products of the fission of uranium, are not just intensely toxic; they are new elements against which our bodies have no defences. For a controversial view of the health impacts of radioactivity, see Busby (1995), chapters 6-7.
2. Note that some 65 percent of global greenhouse gas emissions arise directly from the generation and use of energy. See Stern (2007), executive summary, p iv.
3. Edwards (2004).
4. Institute for Energy and Environmental Research (2005).
5. Lovelock (2006).
6. Storm van Leeuwen and Smith (2007) abbreviated to SLS. Sustainable Development Commission (2006).
7. SVL, Part D5. World Nuclear Association (2007a), “How it works: getting uranium from the ground”.
8. Treatment of tailings and restoration, SVL, Part D6. Considered ideal rather than best practice, ISA, Sydney University (2006), p 98. (In SLS, chapter 4, p 4, there is also the requirement to seal the mine floor with clay).
9. For more detail on the decay products of uranium-238, see Edwards (2004), Section A.
10. World Nuclear Association (2007), “How It Works: Conversion and Enrichment”; also Storm van Leeuwen and Smith (2005), chapter 2.
11. France’s store of 200,000 tonnes, and 8,000 tonnes p.a. addition: Greenpeace (2005): “At the end of 2003, the inventory of the French nuclear waste agency Andra stated that there were 220,000 tonnes of DU stored in France. According to forecasts, this gigantic stock will exceed 350,000 tonnes by 2020 only as a result of enrichment for EDF.” (p 3).
A further 8,000 tonnes exported: Greenpeace (2005): Net annual imports of uranium waste from Europe to Russia are “in excess of 8,000 tonnes” (p 7). This is based on Peter Diehl (2005), “Re-enrichment of West European Depleted Uranium Tails in Russia” Eco Defence (at Appendix 1 of Greenpeace 2005).
Greenpeace (2005) also points out that the trade is illegal: “The Russian legislation prohibits the import of foreign nuclear materials for storage. According to paragraph 3 of article 48 of the federal law of 2001, “On Environmental Protection”, import of nuclear waste and foreign nuclear materials to the Russian Federation for the purpose of its storage or disposal is prohibited.” Ostensibly, the material goes to Russia only for re-enrichment, but the bulk remains and has to be stored as uranium hexafluoride. The transport arrangements are also illegal: the containers are Type 48G, a lower specification than the required IAEA TS-R-1, which is itself grossly inadequate in the case of fire (e.g.) on a container-ship on route from Le Havre to St. Petersburg.

44 THE LEAN GUIDE TO NUCLEAR ENERGY
12. World Nuclear Association (2007), “How It Works: Conversion and Enrichment”; also SLS chapter 2.
13. Disposal of high-level waste: For detail of the energy costs, see SLS, chapter 4; this is now conveniently summarised in SVL, Part C4. See also World Nuclear Association (2007), “How It Works: used fuel management”; and (for the UK), Committee on Radioactive Waste Management (July 2006), esp. chapters 14-15. For overview see Nielsen (2006). A variant is GeoMelt (see Google references). See also Busby (2006b).
14. Committee Examining Radiation Risks of Internal Emitters (CERRIE) (2004), Report.
15. The Nuclear Regulatory Commission is cited by Miller (2000), p 385-386. Nuclear engineer: George Gallatin, senior nuclear engineer, cited by Miller (2000), p 386. Flooded nuclear power stations: King (2004).
16. SLS, chapter 3; chapter 4. Storm van Leeuwen (2006B), pp 4-5, in Evidence to the IPCC Working Group III, Fourth Assessment Report Draft for Expert Review. For EPR see Areva (2007a) and web references. Summary/revision/clarification in SVL Part F.
17. This summary relies substantially on SLS. For “30 percent” see references below.
18. 16 percent: Storm van Leeuwen (2006a), “Energy from Uranium”, Ceedata Consulting, p 8, now summarised in Oxford Research Group, ed (2006a). See also Storm van Leeuwen (2006), Appendix B, and Oxford Research Group (2006b). The ideal source for this is, when available, will be SVL, Part G).
19. See SVL, Part C5. Note the question-marks.
20. Natural uranium per GW/annum: see Nuclear Fuel Energy Balance Calculator (2007); the approximation used here of 200 tonnes differs from SLS’s 162 tonnes. Global warming potential of HCs: see Bureau of Air Quality (2007). Nuclear reactors do not run continually over their lifetime; so “full-power years” are used as a measure of the time for which a particular reactor is actually producing electricity at full power during its lifetime.
21. The Consultation accepts estimates derived from the Sustainable Development Commission (2006), The Role of Nuclear Power in a Low Carbon Economy, chapter 2, p 22: “The Nuclear Energy Agency, (NEA), Foratom and the International Atomic Energy Authority (IAEA) all agree that nuclear power emits low amounts of carbon – between 2-6 g of carbon equivalent per kWh.” (See p 36 of the SDC report for sources).
22. ISA, University of Sydney (2005), pp 7, 171.
23. ISA, University of Sydney (2005) pp 63-67; Storm van Leeuwen (2006B*).
24. Concrete: AFX News (2007).
25. Storm van Leeuwen (2006B*).
26. However, knowledge of the whole set of emissions from nuclear energy, including GHGs from the solvents, is rudimentary. The ISA report is comprehensive, and includes an impressive critique of other estimates including SLS (pp 55-76), but it is
THE LEAN GUIDE TO NUCLEAR ENERGY 1
1. INTRODUCTION
The main objectives of energy policy must be (1) to achieve a profound
reduction in the release of the gases that are changing the climate, and (2)
to find other ways of maintaining the energy services we need as supplies
of oil and gas decline towards depletion. Nuclear power seems at first
sight to have something to offer here. It does not depend on oil, gas or
coal as its primary fuel.2 It is based on a process which does not, in itself,
produce carbon dioxide. It is concentrated in a relatively small number of
very large plants, so that it fits easily into the national grid. And there is
even the theoretical prospect of it being able to breed its own fuel. So –
what’s the problem?
The question is considered here in the six chapters of this short study,
which is intended as a readable introduction to the nuclear question for
everyone interested in, or involved in, the debate about it. It starts here
with a short description of the principles, explaining what nuclear energy
is. Chapter 2 describes what has to be done in order to derive energy
from uranium. Chapter 3 explains why the nuclear industry is in fact a
substantial source of carbon emissions, and it makes the link with the
problem of uranium depletion and the wider question of the amount of
energy that has to be put into the process to get energy out of it. Chapter
4 asks whether there are alternative sources of the uranium fuel on which
the industry depends, and chapter 5 sets nuclear energy in context with
the energy problem as a whole. Chapter 6 draws conclusions.
Now for the principles. The form of nuclear power available to us at
present comes from nuclear fission, fuelled by uranium. Uranium-235 is
an isotope of uranium with the rare and useful property that, when struck
by a neutron, it splits into two and, in the process, produces more
neutrons. Some of these neutrons then proceed to split more atoms of
uranium-235 in a chain of events which produces a huge amount of
energy. We can get an idea of how much energy it produces by looking at
Einstein’s famous equation, E=mc2, which says that the energy produced
is the mass multiplied by the square of the speed of light. A little bit of
mass disappears – we can think of this as the material weighing slightly
less at the end of the process than at the beginning – and it is that
“missing” mass which turns into energy which can be used to make steam
to drive turbines and produce electricity.

CAST LIST ————————
ATOM. The smallest particle unique to a particular chemical element. An atom consists of a nucleus of protons and neutrons, surrounded by electrons.
ATOMIC MASS. The sum of neutrons and protons in the nucleus.
ATOMIC NUMBER. The number of protons in the nucleus of an atom: this is what gives an element its characteristic properties.
BACK END ENERGY. The energy needed to dispose of old reactors and to clear up all the wastes produced at each stage of the front-end process.
DEPLETED URANIUM. The waste uranium left behind after the enrichment process. (Not to be confused with uranium depletion – i.e. the decline in the global ore resource).
ELECTRON. A negatively-charged particle orbiting the nucleus of an atom.
ENERGY RETURN ON ENERGY INVESTED (EREI). The ratio between the energy derived from a process and the energy invested in that process.
FRONT END ENERGY. The energy needed to build reactors, to mine, mill, enrich and prepare the fuel, and for the other energy-using tasks needed to produce nuclear power.
GROSS ENERGY. The electricity fed by nuclear reactors into the grid.
HALF-LIFE. The time it takes, statistically, for half the atoms of a given radioactive isotope to decay.
ISOTOPES. Atoms with the same atomic number, but different numbers of neutrons and hence different atomic masses. They are identified by the sum of protons and neutrons, so that, for instance, “uranium-235” has 92 protons and 143 neutrons, whereas uranium-238 has 92 protons and 146 neutrons.
NET ENERGY. Gross energy minus front-end energy.
NEUTRON. A particle with a neutral charge (that is, no charge at all) found in the nucleus of every atom except that of the simple form of hydrogen.
PRACTICAL RETURN ON ENERGY INVESTED (PREI). A measure of the energy return on energy invested which takes account of practical questions of local geology, water problems and price in a market impoverished by energy scarcity.
PROTON. A particle with a positive electrical charge, found in the nucleus of every atom.
RADIOACTIVITY. Radioactive material radiates energy which has the ability to break up and rearrange cellular DNA and the atomic structures of elements.1
THEORETICAL RETURN ON ENERGY INVESTED (TREI). A measure of the energy return on energy invested, taking no account of the practical questions included in PREI.
URANIUM-235. The isotope of uranium which drives the nuclear reaction, and which needs to be present in an enriched concentration of 3.5 percent, in comparison with the 0.7 percent in which it is present in natural uranium.
THE LEAN GUIDE TO NUCLEAR ENERGY 45
not as clear as might be hoped with respect to a statement and derivation of its own estimate of g/kWhs and its distribution through the nuclear cycle. Clarification from the authors would be welcome.
27. The estimate of 451 g/kWh of GHG emissions for combined cycle gas fired electricity generation comes from ISA, Sydney University (2006, p 122), and it covers only the combustion of gas. If losses incurred during extraction and in the distribution grid are included, the greenhouse gas emissions (in CO2 equivalents) is estimated at 577 g/kWh (p 136). The range of estimates for gas turbines comes from Grimston (2005).
28. For definitions of “front-end” and “back-end” see the Cast List and pp 17-18.
29. SLS chapter 2. Storm van Leeuwen (2006B). SVL, Parts D4 and G. Note that the concept of EREI becomes more complex when applied to comparisons between two energy sources. If a given amount of energy, contained in gas, could produce more electricity if used directly in a combined cycle gas turbine than if used in the nuclear energy cycle, nuclear energy becomes an expensive way of reducing the supply of electricity to the grid.
30. Mudd and Diesendorf (2007), p 8.
31. Ibid, p 9.
32. Oil peak: see Lean Economy Connection (2007).
33. World average ore grade: see Canadian Nuclear (2007).
34. Note that Rio Tinto (2005) announced a “cut-off grade” of 0.08 percent for its existing stocks of ore at its Ranger mine in Namibia. The use of “existing stocks” means that the ore has already been mined and is waiting to be milled, so that a lower-grade ore can be tolerated.
35. NEA/IAEA (2006). References to this are taken from accessible but authoritative summaries available on the Web.
36. It estimates that there are 4,743.000 tonnes available at a price of $ 130/kg. Nuclear Energy Agency (2006), Executive Summary. The World Nuclear Association (2007b) reports that current demand is 66,500 tonnes per annum. Note that this calculation of “the reserves to production ratio” is extremely crude, for reasons explained on p 12.
37. NEA (2006), Executive Summary; the calculation is shown at NEA (2006), Slide presentation.
38. This is accessibly summarised in Oxford Research Group, ed (2006a).
39. For the story of optimistic estimates of oil resources from the United States Geological Survey and the International Energy Agency, and the years squandered in debate about this, see Strahan (2007).
40. Nuclear Energy Agency (2006), Executive Summary. First Uranium Corporation (2007); see pp 14-16.
41. World Nuclear Association (2007b).
42. World Nuclear Association (2007b) estimates 439 working reactors operable in

46 THE LEAN GUIDE TO NUCLEAR ENERGY
September 2007. Areva (2007b) measures this as about 370 gigawatts of installed capacity.
43. World Nuclear Association (2007c).
44. See Dzhakishev (2004) table 2, and other references at note 36.
45. See Bunn (2003).
46. See Collell (2005); Zittel and Schindler (2006), pp 11.12.
47. Busby (2007a).
48. For a description of reprocessing, see chapter 4, p 18-23.
49. Sources for the table. Uranium supply: World production from mines: World Nuclear Association (2007c); additional sources and their availability Dzhakishev (2004); Collell (2006); Bunn (2003), Nicolet and Underhill (1998); International Atomic Energy Agency (2001); Zittel and Schindler (2006); Busby (2006).
50. World Nuclear Association (2007c).
51. See Zittel and Schindler (2006). For updates on Cigar Lake from the developer’s point of view, see Cameco’s website.
52. For quality of the ore in Olympic Dam see Australia Uranium Association (2007). This reports an average of 0.4 percent, but the more recent annual report for 2007 from BHP Billiton (2007), p 63, reports the average of 0.29 kg of uranium oxide per tonne (i.e. 0.029% uranium oxide). Yield: SVL, Part D8. Copper: Busby (2007b).
53. SVL, Part D8.
54. Busby (2007b).
55. Nuclear Energy Agency (2006), Executive Summary, p 3
56. For clarity “back-end including the backlog” should be made explicit to distinguish it from back-end without the backlog. In the industry, the backlog is often called the “legacy”.
57. The energy-costs of each stage in the nuclear energy cycle are set out in SLS and summarised in Storm van Leeuwen (2006B) and in Oxford Research Group (2006b). See also SVL, Part C4, figure C11 and table C2, and (when available) Part G. Appendix B splits the energy costs conveniently into front-end and back-end. Part C lumps much of the front-end and back-end energy costs together as “lifetime operational energy input”. The lifetime operational energy investments of 460 PJ is given as 45 percent of the gross output of 1030 PJ; the present analysis rounds up to 50 percent, but estimates vary greatly (higher and lower), and energy costs will rise rapidly as the ore quality used declines from the present average of 0.15 percent.
58. See Oxford Research Group (2006a); and Storm van Leeuwen (2006B), and (2006E). SVL, Parts C2, C4.
59. Lovelock (2006), p 103.
60. See SVL, Part D9, Storm van Leeuwen (2006E), and a significant source for their work: Huwyler, Rybach and Taube (1975).
61. Storm van Leeuwen (2006C), (2006F).
CONTENTS
1. Introduction 1
2. What Is Really Involved in Nuclear Energy? 4
3. Greenhouse Gases, Ore Quality and Uranium Supply 8
Greenhouse gases 8
Ore quality 9
Uranium supply 11
Supply crunch 13
Can uranium production increase to fill the gap? 14
Can the industry supply the energy to clear its own waste? 16
4. Alternative Sources of Fuel? 20
Granite 20
Fast-breeder reactors 21
Seawater 26
Phosphates 27
5. In Context 29
6. It’s Time to Turn to the Wit and Energy of the People 33
Sources 39
Notes and References 43
Index 48

Published by
THE LEAN ECONOMY CONNECTION
P.O. Box 52449 London NW3 9AN [email protected] www.theleaneconomyconnection.net The Lean Guide to Nuclear Energy: A Life-Cycle in Trouble ISBN 0-9550849-2-8 November 2007 Copyright © David Fleming 2007 Drawings by Christopher White Every care has been taken in the preparation of this booklet, whose findings have been reached in good faith, with no prior agenda. Neither the author nor the publisher can be held liable for any errors or decisions influenced by it. COMMENTS AND REVISIONS
The lack of consensus in the nuclear industry on such fundamentals as the future of uranium supplies and its carbon intensity (greenhouse gas emissions per kilowatt hour) means that many, or most, papers on the subject must contain substantial errors. This paper will be no exception. However, if errors are brought to the author’s attention and proved, the text will be amended accordingly, and new editions issued, both on the website and in the printed version.
THE LEAN GUIDE TO NUCLEAR ENERGY 47
62. NEA/IAEA (2006), Slide Presentation.
63. Storm van Leeuwen (2006C), (2006F).
64. Ibid. Similar problems affect mixed-oxide fuel (MOX) ≈ 2% of current capacity. The number of reactors in operation now: World Nuclear Association (2007b).
65. Lidsky and Miller (1998).
66. Storm van Leeuwen (2006C). Uranium Information Council (2004). See also World Nuclear Association (2007d).
67. Ibid.
68. Storm van Leeuwen (2006D).
69. SVL (2007), Part D10. Storm van Leeuwen (2006E2), “Uranium from Seawater”, Appendix E2.
70. Ibid.
71. NEA/IAEA (2006), Slide Presentation.
72. SVL, Part D9. See also SVL, Part D9 for a summary of prospects for shales as a source of uranium ore.
73. SVL, Part C5. Storm van Leeuwen and Smith (2006E).
74. See, for instance, Déry and Anderson (2007). The author has not, at the time of going to print, been able to find reliable information on: (a) to what extent the extraction of uranium from phosphate ore makes it unsuitable for subsequent use in agriculture; (b) what the nuclear cycle’s energy balance would be, using phosphates as a low-grade uranium ore, (c) what the pollution implications of the organophosphates in the process are, and (d) fully-endorsed information on whether a global phosphates resource exists on a scale which would make it significant for nuclear energy in the future. Commercial enterprise is usually alert to opportunity, and the lack of development of phosphates as an ore strongly suggests that phosphates will not solve the nuclear industry’s fuel problem, but a firm conclusion on this is being held over for later editions.
75. See IEA (2007), pp 6-7. Note that nuclear’s share (p 6) seems inconsistent with this. There are two ways of estimating shares of nuclear power and renewables: (a) the (fossil fuel) inputs needed to produce the outputs at a notional 38% plant efficiency; (b) their actual electricity output. The second method has been chosen here for its better estimate of final demand, but it produces smaller numbers. For a text using method (a), and an explanation of the difference between them, see Boyle (2004).
76. Low-level waste: see Busby (1995).
77. Lovelock (2006), p 99.
78. Ibid, p 135. See also Pearce (2006).
79. See Fleming (2007). For lean thinking see Womack and Jones (2003).
80. The effect of nuclear reactors in sustaining a large-scale grid, and making it harder to build localised energy systems, is discussed by the SDC as “network lock-in”. Sustainable Development Commission (2006), (2), p 10.
81. Tradable Energy Quotas (TEQs), see Fleming (2007).

48 THE LEAN GUIDE TO NUCLEAR ENERGY
INDEX
Accidents, 6-7, 24
Alternative sources of nuclear fuel, 20-
28
Americium, 2, 23
Atomic mass,
Defined, See Cast list
Atomic number,
Defined, See Cast list
Australia, 4, 14-16, 39-40, 46
Back-end: dismantling and all waste-
disposal operations, See Cast list, 9,
17, 27, 33-34
Backlog of wastes, 17, 18, 33, 35
Beloyarsk, 23
Bismuth-214, 5
Boron control rods, 2
Boyle, Godfrey, 39
Brazil, 4
Busby, Chris, 16, 39
Calculation of energy share, 47
Canada, 4, 14-15
Carbon-14, 6
Carbon dioxide, 1, 3, 8-10, 39
Ceramic pellets, 5
Chernobyl, 7
Cigar Lake, 15, 46
Climate change, 1, 2, 28-31, 36, 40-41.
See also Greenhouse gases.
Coal, 1, 17, 20-21
Cold War, 13
Committee Examining Radiation Risks
of Internal Emitters (CERRIE), 39
Committee on Radioactive Waste
management (CORWM), 39
Common purpose, 31, 37, 40
Containers for waste disposal, 5-8
Corrosion Residuals and Unidentified
Deposits (CRUD), 7
Curium, 23
Decentralisation of energy, 3, 11, 30-31
Defence-in-depth, 24
Depleted uranium, 5, 8, 13
Defined, See Cast list
Depletion, see Uranium Depletion.
Depletion trap, 19
Diehl, Peter, 43
E=mc2, 1
Edwards, Gordon, 40
Einstein, Albert, 1
Electricity, See Cast list, 1, 3-4, 6-11, 16-
18, 20-22, 27, 29-30, 32, 35-36
Energy balance: the ratio of energy
inputs to energy outputs, taking into
account all processes in the nuclear
life-cycle, 3, 9-11, 13, 15, 17-19, 27,
33-35, 40-42
Energy Balance Sheet, 34
Energy bankruptcy, 18, 32-35
Energy conservation, 30-32
Energy efficiency, 11, 25, 30
of nuclear power, 25
Energy famine. See Energy gap.
Energy gap, 24, 29-31, 36-37
Energy policy, 1, 3, 28-33, 35-37
Enrichment of fuel, See Cast list, 5, 7-8,
13, 16, 27, 29, 31
And proliferation, 5, 7, 29
And wastes, See Cast list, 5, 7-8, 13,
16
EREI (Energy Return on Energy
Invested), 10
Defined, See Cast list
See also TREI and PREI.
Fast-breeder reactors, 1, 20-26, 42
Finland, 9, 35
Fleming, David, 40
Fluorine, 5, 8
France, 5, 21, 23, 40
Freon-114, 9
Front-end: the processes required to
produce nuclear energy –
construction, mining, milling, etc.
See Cast list, 9, 16-17, 27-28, 33-34
Fuel. See nuclear fuel.
Fuel fabrication, 22-23
Gaia, 30, 40
Gas (fuel), 1, 8-11, 14-15, 17, 19, 28-29,
32, 36
THE
LEAN GUIDE TO
NUCLEAR
ENERGY
A Life-Cycle in Trouble
David Fleming
THE LEAN ECONOMY CONNECTION
ACKNOWLEDGEMENTS
Thank you to my editor, Shaun Chamberlin, for his meticulous work in helping
to get this book ready for publication.
Thank you to Jan Willem Storm van Leeuwen for many months of comments
and expert advice. References for his work, and the work he has published
jointly with the late Dr Philip Smith, are given on pages 41-42. This booklet is
substantially guided by their research, but it builds on it and takes the
discussion of energy policy options further. The conclusions I draw, including
the concept of “energy bankruptcy”, treatment of the backlog of waste, and the
alternative vision of Lean Energy, are my own. All summaries sacrifice detail,
some of which may be important. I make no claim that this booklet is beyond
challenge in its representation of Storm van Leeuwen and Smith’s exhaustive
and careful analysis: the responsibility for the entire contents of this booklet is
my own.
Thank you to the many readers who have commented on parts or all of the text.
Special thanks for detailed technical comments to John Busby. Lucy Care
supplied valuable comments and arranged for several scientific referees with
knowledge of nuclear energy to comment on the text.
Thank you to Christopher White for his drawings.
Thank you to Geoff Lye for advice on publicity matters.
Thank you to the R.H. Southern Trust for financial support.
My work on the Lean Economy project has been aided and encouraged in
various ways and over many years by Elm Farm Research Centre, and its
director, Lawrence Woodward, initially with the support of the late David
Astor.
ABOUT THE AUTHOR
David Fleming has an MA (History) from Oxford, an MBA from Cranfield and
an MSc and PhD (Economics) from Birkbeck College, University of London.
He has worked in industry, the financial services and environmental
consultancy, and is a former Chairman of the Soil Association. He designed the
system of Tradable Energy Quotas (TEQs), (aka Domestic Tradable Quotas and
Personal Carbon Allowances), in 1996, and his booklet about them, Energy
and the Common Purpose, now in its third edition in this series, was first
published 2005. His Lean Logic: The Book of Environmental Manners is
forthcoming.
THE LEAN GUIDE TO NUCLEAR ENERGY 49
Geomelt, 44
Granite, 4, 10, 20-21, 40
Greenhouse gases, 8, 9, 28-29, 39-40,
42
Greenpeace, 3, 40
Grid/network, See Cast list, 1, 8, 11, 18,
26, 32, 34
Hard ores, 4, 10
Half-life, 2, 4, 5, 25
Defined, See Cast list
Of uranium-238’s decay sequence, 5
Halogenated compounds, 9, 44
Hex. See uranium hexafluoride.
Impurities,
In reactions, 2
India, 20, 21, 25
In situ leaching, 4, 29
Isotopes, 2, 6
Defined, See Cast list
Radioactive, See Cast list
Japan, 21, 23-24, 40
Kakrapar, 25
Kazakhstan, 4, 14, 40
King, David, 40
Krypton, 2
Lead-206, 5
Lead-210, 5
Lean Energy, 30-32, 36
Lean Thinking, 30, 42
Leeuwen, Jan Willem Storm van, 3, 9,
11-12, 15, 20, 40-42
Lidsky, M., and Marvin M. Miller, 40
Life-cycle. See nuclear life-cycle.
Lovelock, James, 2, 20-22, 26, 29-31,
40
Low-level radiation, 29
See also Committee Examining
Radiation Risks of Internal Emitters
(CERRIE).
Mining and milling, See Cast list, 4-5,
10-11, 13-17, 20, 27, 29, 31, 34, 39,
41
Minigrids, 32
Monju, 23
Namibia, 4, 14
Neptunium, 2, 22
Net Energy,
Defined, See Cast list
See also Energy Balance.
Neutron, 1, 2, 22, 25
Defined, See Cast list
In nuclear reaction, 1-2
Nevada, 35
Nielsen, Rolf Haugaard, 41
Normality-creep, 6
Nuclear energy, passim
Nuclear fuel, 1-3, 5-9, 13-14, 16, 19-30,
33, 36, 40-41
Alternative sources, 20-28
Nuclear life-cycle: the whole sequence
of processes from uranium-mining
to final safe disposal of all wastes, 4-
7 and passim.
Nuclear Regulatory Commission, 6, 44
Oil peak, 1, 11-12, 15-16, 19, 28-32, 41
Olkiluoto, 9, 35
Olympic Dam, 15
Oxford Research Group, 41
Ozone layer, 33
Palladium, 23
Pearce, Fred, 41
Phénix, 23
Phosphates, 5, 20, 23, 27-28, 39
Plutonium, 2, 6-7, 13, 20-26
In fast-breeder reactors, 21-24
In thorium reactors, 25-26
Plutonium-239, 2, 6, 22-26
Plutonium-241, 23
Polonium-210, 5
Polonium-218, 5
Porritt, Jonathon, 42
PREI (Practical Return on Energy
Invested), 10, 11, 13, 17-18, 27, 33,
35
Defined, See Cast list
Proliferation, 5, 7, 29
Protactinium-233, 25
Protactinium-234, 5
Proton,
Defined, See Cast list

50 THE LEAN GUIDE TO NUCLEAR ENERGY
Radioactivity, 2, 4, 5-7, 22-23, 25, 36,
39-40
Defined, See Cast list
Uranium oxide and, 4
Radioactive poem, 5
Radiation, Cast list, 23, 25, 29, 33, 39
Radium-226, 5
Radon-222, 5
Reactors, 5-9, 13, 16-17, 20-28, 32-34,
36, 39, 42
Construction, 7, 9, 16, 31, 36, 39
Decommissioning, 7, 20, 29
Fast-breeder, 20-26
Rising sea levels and, 36
Thorium, 25-26
Renewable Energy, 31, 39
Repositories, 5-6, 8, 35, 39
Reprocessing, 2, 6, 7, 14, 21-23, 42
Fast-breeding and, 21-23
Rhodium, 23
Russia, 4, 5, 13-14, 21, 23, 40
Seawater, 15, 20, 26-27, 42
Sea level rise, 36
SLS. Abbreviation for Storm van
Leeuwen and Smith.
Smith, Dr Philip, 3, 9, 11-12, 20, 41-42
Soft ores, 4, 10
Solvents, 23, 27-28, 33
South Africa, 4
Spent fuel, 2, 6, 21, 36
Structural change, 30
Sustainability, 9, 41
Sustainable Development Commission,
3, 42
Sweden, 35
Technetium, 23
Technological fix, 3, 32, 36
TEQs (Tradable Energy Quotas), 31,
37, 40
Terrorism, 29
Thorium reactors, 20, 24-26, 42
Thorium-230, 5
Thorium-232, 25
Thorium-233, 25
Thorium-234, 5
Titanium hydroxide, 26
Tradable Energy Quotas, see TEQs
Transuranic elements, 2
TREI (Theoretical Return on Energy
Invested), 11-13
Defined, See Cast list
Tributyl phosphate, 23
Tritium, 6
United States, 4, 12-13, 22
Uranium-233, 25-26
Uranium-234, 5
Uranium-235, 1-2, 5, 7, 14, 22, 24-26
Defined, See Cast list
Explained, 1-2
In fast-breeding, 22-26
In fuel, 1-2, 5, 14, 22, 24-26
In nuclear reaction, 1-2, 22, 24-26
Uranium-238, See Cast list, 2,-5, 22-24
In fast-breeding, 22-24
In fuel, 2, 22
In nuclear reaction, 2
Uranium depletion, See Cast list, 1, 12,
19-20, 29-30, 33, 36
Uranium hexafluoride, 5, 8-9, 13, 33-35
Uranium ores, See Cast list, 4-5, 8-12,
15, 19-20, 22, 27-28, 34
Alternative sources, 20-28
Uranium oxide (yellowcake), 4-5, 10,
26-27
See also Enrichment.
Uranium Information Council, 3, 42
Uzbekistan, 4
Waste. See also spent fuel.
Clearing-up programme, See Cast
list, 2, 5, 7-9, 13, 16-19, 28-29, 31,
33-36, 39
From enrichment, 5-8, 13, 17-18, 29
From generation, 2, 6-8, 16-18, 22-
23, 29
From uranium mines, 8, 17, 29
High-level, 6-9, 16, 22, 29, 35-36
Low-level, 6, 29
World Nuclear Association (WNA), 3,
40, 42
Yellowcake. See uranium oxide.
Zirconium, 5
NUCLEAR ENERGY
In Brief
1. The world’s endowment of uranium ore is now so depleted that the nuclear industry will never, from its own resources, be able to generate the energy it needs to clear up its own backlog of waste.
2. It is essential that the waste should be made safe and placed in permanent storage. High-level wastes, in their temporary storage facilities, have to be managed and kept cool to prevent fire and leaks which would otherwise contaminate large areas.
3. Shortages of uranium – and the lack of realistic alternatives – leading to interruptions in supply, can be expected to start in the middle years of the decade 2010-2019, and to deepen thereafter.
4. The task of disposing finally of the waste could not, therefore, now be completed using only energy generated by the nuclear industry, even if the whole of the industry’s output were to be devoted to it. In order to deal with its waste, the industry will need to be a major net user of energy, almost all of it from fossil fuels.
5. Every stage in the nuclear process, except fission, produces carbon dioxide. As the richest ores are used up, emissions will rise.
6. Uranium enrichment uses large volumes of uranium hexafluoride, a halogenated compound (HC). Other HCs are also used in the nuclear life-cycle. HCs are greenhouse gases with global warming potentials ranging up to 10,000 times that of carbon dioxide.
7. An independent audit should now review these findings. The quality of available data is poor, and totally inadequate in relation to the importance of the nuclear question. The audit should set out an energy-budget which establishes how much energy will be needed to make all nuclear waste safe, and where it will come from. It should also supply a briefing on the consequences of the worldwide waste backlog being abandoned untreated.
8. There is no single solution to the coming energy gap. What is needed is a speedy programme of Lean Energy, comprising: (1) energy conservation and efficiency; (2) structural change in patterns of energy-use and land-use; and (3) renewable energy; all within (4) a framework for managing the energy descent, such as Tradable Energy Quotas (TEQs).