Embed Size (px)
DESCRIPTION
An overview of NTPC Faridbad gas power plant
Citation preview

A Practical Training Report on
AN OVERVIEW OF THE GAS POWER PLANT
Submitted By
ANKIT CHAWLA
2K11-MRCE-ECE-007
ECE (A) VIII Semester
To
Mr. Pankaj Bhatia
Coordinator
MANAV RACHNA COLLEGE OF ENGINEERING
ECE DEPARTMENT
May 2015


ACKNOWLEDGEMENT
I express my deep sense of gratitude to my project supervisor Mr.V.K.Bhatia and
Mr.Umesh, NTPC LIMITED, for their immense support and excellent guidance. They have
helped me to explore this vast topic in an organized manner and provided me with all the ideas on
how to work towards the research-oriented venture.
I acknowledge with gratitude the help extended by all Mr.Puran Singh and technical staff
of NTPC FARIDABAD for their co-operation and guidance that helped me a lot during the course
of training. I have learnt a lot working under them and I will always be indebted of them for this
value addition in me. Last but not the least, I thank my family and friends for their constant
encouragement and wholehearted support during the entire project work.

TABLE OF CONTENTS
1. ABOUT THE COMPANY
1.1 Corporate Vision
1.2 Core Values
1.3 Installed Capacity of NTPC
2. FARIDABAD GAS POWER PLANT
2.1 Introduction
2.2 Salient Features
2.3 CONVERSION FROM GAS TO ELECTRICITY
3. FUEL
3.1 Natural Gas
3.2 Naphtha
3.3 Operations and fuel handling department
4. CONTROL & INSTRUMENTATION DEPARTMENT
4.1 AUTOMATION& CONTROL
4.1.1 The benefits
4.1.2 Process Structure
4.1.3 Control system Structure
4.1.4 System Overview
4.2 CONTROL & MONITORING MECHANISMS
4.3 POWER STATION INSTRUMENTATION
4.3.1 Presentation of information
4.3.2 Selection of instruments
4.3.3 Concept of instrumentation in thermal power station
5. INTERPRETATION of INSTRUMENT READINGS
6. PRESSURE MEASUREMENT AND MEASURING INSTRUMENTS
6.1 Pressure measurement-introduction
6.2 Pressure Measuring Devices

6.2.1 Manometer elements
6.2.2 Diaphragm, Capsule and bellows
6.2.3 Bourdon Tube Gauges
6.2.4 Transmitters for pressure measurement and differential pressure
measurement
7. LEVEL MEASUREMENT & MEASURING INSTRUMENTS
7.1 level measurement- introduction
7.2 methods
7.2.1 float and liquid displacement
7.2.2 Head pressure measurement system
7.2.3 Electrical/electronic methods
7.2.4 Ultrasonic methods
7.2.5 Nucleonic methods
8. FLOW MEASUREMENT&MEASURING INSTRUMENTS
8.1 Flow measurement-Introduction
8.2 Instruments
8.2.1 differential flow measurement
a)concentric orifice plates
b) venture tube and nozzle
c) pilot tube
d)dall tube
9.2.2 electromagnetic flowmeters
9.2.3 ultrasonic flowmeter
10. TEMPERATURE MEASUREMENT &MEASURING INSTRUMENTS
11. PNEUMATIC INSTRUMENTS

CHAPTER 1 ABOUT THE COMPANY
1.1 CORPORATE VISION:
“A world class integrated power major, powering India’s growth, with increasing global presence”
1.2CORE VALUES: [BE COMMITTED]
B-Business Ethics
E-Environmentally and economically sustainable
C-Customer Focus
O-Organizational & Professional pride
M-Mutual Respect and Trust
M- Motivating self and others
I- Innovation & Speed
T-Total quality for Excellence
T- Transparent and Respected organization
E – Enterprising
D – Devoted
India’s largest power company, NTPC was set up in 1975 with 100% ownership by the
Government of India to accelerate power development in India. NTPC is emerging as a
diversified power major with presence in the entire value chain of the power generation business.
The company has set a target to have an installed power generating capacity of 1,28,000
MW by the year 2032. The capacity will have a diversified fuel mix comprising 56% coal, 16%
Gas, 11% Nuclear and 17% Renewable Energy Sources(RES) including hydro. By 2032, non
fossil fuel based generation capacity shall make up nearly 28% of NTPC’s portfolio.

At present, Government of India holds 89.5% of the total equity shares of the company and the
balance 10.5% is held by FIIs, Domestic Banks, Public and others. Within a span of 31 years,
NTPC has emerged as a truly national power company, with power generating facilities in all the
major regions of the country.
NTPC has been operating its plants at high efficiency levels. Although the company has 17.75%
of the total national capacity, it contributes 27.40% of total power generation due to its focus on
high efficiency.
Apart from power generation, which is the mainstay of the company, NTPC has already ventured
into consultancy, power trading, ash utilization and coal mining. NTPC became a Maharatna
company in May 2010, one of the only four companies to be awarded this status. NTPC was
ranked 424th in the ‘2014, Forbes Global 2000’ ranking of the World’s biggest companies.
The concept of Corporate Social Responsibility is deeply ingrained in NTPC's culture. Through its
expansive CSR initiatives, NTPC strives to develop mutual trust with the communities that
surround its power stations
NTPC has adopted a multi-pronged growth strategy which includes capacity addition through
green field projects, expansion of existing stations, joint ventures, subsidiaries and takeover of
stations.
NTPC's core business is engineering, construction and operation of power generating plants and
providing consultancy to power utilities in India and abroad.
In October 2004, NTPC launched its Initial Public Offering (IPO) consisting of 5.25% as fresh
issue and 5.25% as offer for sale by the Government of India
NTPC thus became a listed company in November 2004 with the Government holding 89.5% of the
equity share capital.
In February 2010, the Shareholding of Government of India was reduced from 89.5% to 84.5%
through a further public offer. Government of India has further divested 9.5% shares through OFS
route in February 2013. With this, GOI's holding in NTPC has reduced from 84.5% to 75%. The rest
is held by Institutional Investors, banks and Public.
NTPC is not only the foremost power generator; it is also among the great places to work. The company is
guided by the “People before Plant Load Factor” mantra which is the template for
all its human resource related policies. NTPC has been ranked as “6th Best Company to work
for in India” among the Public Sector Undertakings and Large Enterprises for the year 2014, by
the Great Places to Work Institute, India Chapter in collaboration with The Economic Times.

1.3 INSTALLED CAPACITY OF NTPC
Present installed capacity of NTPC is 44,598 MW (including 6,196 MW through JVs) comprising
of 40 NTPC Stations (17 Coal based stations, 7 combined cycle gas/liquid fuel based stations, 1
Hydro based station), 7 Joint Venture stations (6 coal based and one gas based) and 8 renewable
energy projects.
Table 1
NO.OF PLANTS CAPACITY(MW)
NTPC OWNED
COAL 17 33,675
GAS/LIQUID FUEL 7 4,017
HYDRO 1 600
RENEWABLE ENERGY
PRODUCTS
8 110
TOTAL 33 38,402
OWNED BY JVs
COAL AND GAS 7 6,196
TOTAL 40 44,598

Coal Based Power Stations
With 17 coal based power stations, NTPC is the largest thermal power generating company in the
country. The company has a coal based installed capacity of 33,675 MW.
Table 2
S.NO COAL BASED (OWNED BY
NTPC)
STATE COMMISSIONED
CAPACITY(MW)
1 Singrauli Uttar Pradesh 2,000
2 Korba Chhattisgarh 2,600
3 Ramagundam Telangana 2,600
4 Farakka West Bengal 2,100
5 Vindhyachal Madhya Pradesh 4,260
6 Rihand Uttar Pradesh 3,000
7 Kahalgaon Bihar 2,340
8 Dadri Uttar Pradesh 1,820
9 Talcher kaniha Orissa 3,000
10 Feroze Gandhi, Unchahar Uttar Pradesh 1,050
11 Talcher Thermal Orissa 460
12 Simhadri Andhra Pradesh 2,000
13 Tanda Uttar Pradesh 440
14 Badarpur Delhi 705
15 Sipat Chhattisgarh 2,980
16 Mauda Maharashtra 1,000
17 Barh Bihar 1,320
Total 33,675

Coal Based Joint Ventures:Table 3
S.NO COAL BASED(OWNED BY JVs) STATE COMMISSIONED CAPACITY(MW)
1 Durgapur West Bengal 120
2 Rourkela Orissa 120
3 Bhilai Chhattisgarh 574
4 Kanti Bihar 415
5 IGSTPP,Jhajjar Haryana 1500
6 Vallur Tamil Nadu 1500
Gas Based Power Stations :
The details of NTPC gas based power stations is as follows : Table 4
S.NO GAS BASED(OWNED BY NTPC) STATE COMMISSIONED
CAPACITY(MW)
1 Anta Rajasthan 419.33
2 Auraiya Uttar Pradesh 663.36
3 Kawas Gujarat 656.20
4 Dadri Uttar Pradesh 829.78
5 Jhanor-Gandhar Gujarat 657.39
6 Rajiv Gandhi CCPP Kayamkulam Kerala 359.58
7 Faridabad Haryana 431.59
S.NO GAS BASED(OWNED BY JVs) STATE COMMISSION
CAPACITY(MW)
1 RGPPL Maharashtra 1967.08
Total 4,229
Total 4,017.23

Hydro Based Power Projects
NTPC has increased thrust on hydro development for a balanced portfolio for long term
sustainability. The first step in this direction was taken by initiating investment in Koldam Hydro
Electric Power Project located on Satluj river in Bilaspur district of Himachal Pradesh. Other
hydro project under construction is Tapovan Vishnugad. On all these projects construction
activities are in full swing.
Table 5
S.NO HYDRO BASED STATE APPROVED
CAPACITY(MW)
COMMISSION
CAPACITY(MW)
1 Koldam(HEPP) Himachal Pradesh 800 600
2 Tapovan Vishnugad
(HEPP)
Uttarakhand 520 -
3 Singrauli CW
Discharge(Small Hydro)
Uttar pradesh 8 -
4 Lata Tapovan Uttarakhand 171 -
5 Rammam West Bengal 120 -
Renewable Energy & Distributed Generation
Renewable Energy
The future lies with renewable energy. Renewable energy technologies provide clean and green
sources of electricity. With their abundance supply, they form the backbone for India’s energy
security and ‘energy independence’ as envisaged by 2020. The aim is to transform NTPC into the
country's largest green power producer in the coming years. Green power is national power.
Objectives
NTPC envisages a broad base generation mix by evaluating conventional and alternate sources of
energy to ensure long run competitiveness and mitigate fuel risks.
Vision
“ To provide green power through locally available resources at affordable price, promoting clean
energy”.
Total 1,519 600

Portfolio of Renewable Power
NTPC has drafted its business plan of capacity addition of about 1,000 MW through renewable
resources by 2017. In this Endeavour, NTPC has already commissioned 95 MW Solar PV Projects
and another 15 MW Solar PV and 8 MW Small Hydro Projects are under implementation.
Renewable Energy Projects
Solar Energy: Projects Commissioned (95 MW)
Table 6
Sr. No. Project State/UT Capacity (MW)
1. Dadri Solar PV Uttar Pradesh 5
2. Port blair Solar PV Andaman & Nicobar Island 5
3. Ramagundam Solar PV (Phase -I) Telangana 10
4. Talcher Kaniha Solar PV Odisha 10
5. Faridabad Solar PV Haryana 5
6. Unchahar Solar PV Uttar Pradesh 10
7. Rajgarh Solar PV Madhya Pradesh 50
8. Singrauli Solar PV Uttar Pradesh 15
Total 110
Wind Energy:
Projects under Tendering (80 MW)
40 MW Wind energy projects in Karnataka.
40 MW Wind energy projects in Maharashtra.
Further, one wind project at a site allocated by Govt. of Karnataka is planned.
Hydro Energy:
Projects under Execution (8 MW)
8 MW hydro energy based project at NTPC-Singrauli in Uttar Pradesh.
Geothermal Energy:
Tattapani Geothermal Project in Chhattisgarh: MoU Signed with Govt. of Chhattisgarh.
Feasibility studies in association with the Geological Survey of India are in progress.

Distributed Generation
India’s growth story is not possible unless the entire country marches in tandem. This means that
the growth trajectory of rural India where two-thirds of our population lives ramps up
considerably. Economic development with the supply of reliable energy is a must for this goal to
be realized. Subsequently efficient energy management is crucial for rural development. Some of
the villages are located in remote & inaccessible areas where it would be either impossible or
extremely expensive to extend the existing power transmission network. To this end, distributed
generation is the solution to the challenge in providing power to off-the-beaten track village
clusters. Currently 16 decentralized distributed generation power projects with a combined
capacity of 340 KW have been commissioned for benefitting 2280 households with a population
of 12500 in four states.
Awards:
IEEMA Power award-2009 in the category of “Excellence in Distributed Generation”.
NTPC Distributed Generation film “Energizing villages” has been awarded in category
“development venture” by Public Society of India, Hyderabad.

CHAPTER 2 FARIDABAD GAS POWER PLANT
2.1 INTRODUCTION
NTPC-Faridabad was approved on 25th July 1997. The total project cost was 1163 cr. INR.
The plant was fully functional in the year 2000 with an installed capacity of 432 MW. The
plant under an agreement with the Haryana government supplies the entire power
generated to the state of Haryana only.
Faridabad gas power plant is a combined cycle power plant having a net capacity of
432MW. It consists of two gas turbines with capacity of 138MW each and a steam
turbine with the capacity of 156MW. The main fuel used here is natural gas. In case of
the unavailability or shortage of natural gas the alternative fuel used is naphtha. Since
the production cost with naphtha differs from that with natural gas by Rs. 6-7 per unit,
naphtha is not used as a main fuel.
The power plant is called the combined cycle power plant because the heat energy
liberated during the combustion of natural gas is not dissipated into the environment but is
utilized for the generation of steam which rotates the steam turbine.
2.2 SALIENT FEATURES:
1. Project Faridabad Gas Power Project
2. Location Village Mujedi, P.O. Neemka, Faridabad,
Haryana
3. Plant Capacity 432 MW
4. Plant Configuration Gas Turbine 1 - 138 MW
Gas Turbine 2 - 138 MW
Steam Turbine - 156 MW
5. Mode of Operation Base Load
6. Fuel Natural Gas
7. Alternate Fuel Naphtha / HSD
8. Average Gas requirement 2 million cubic meters per day

9. Fuel Source HBJ pipe line (through GAIL)
10. Cooling water Rampur Distributory source
11. Naphtha Storage 2 tanks of 8000 KL. Capacity each.
12. HSD Storage 1 tank of capacity 400 KL.
13. Power Evacuation 2 X 220 KV Double circuit lines each to
220KV BBMB sub-station at Samaypur
(Ballabgarh) and HVPN sub-station at Palla
(Faridabad)
2.3 CONVERSION FROM GAS TO ELECTRICITY
The basic principle of the Combined Cycle is simple: burning gas in a gas turbine (GT)
produces not only power - which can be converted to electric power by a coupled generator but
also extremely hot exhaust gases. Routing these gases through a water-cooled heat exchanger
produces steam, which can be turned into electric power with a coupled steam turbine and
generator.
This set-up of Gas Turbine, waste-heat boiler, steam turbine and generators is called a combined
cycle. This type of power plant is being installed in increasing numbers round the world where
there is access to substantial quantities of natural gas.
This type of power plant produces high power outputs at high efficiencies and with low emissions.
It is also possible to use the steam from the boiler for heating purposes so such power plants can
operate to deliver electricity alone.
The electricity produced here is supplied to the distribution grids as well as used to operate the
plant. In case of total power failure, the plant is operated using a Black Star Diesel Generator set.
The exciter of the turbine as well as other machinery is coupled to both the BSDG as well as main
power supply. In case of power failure, the power source is automatically switched to BSDG
supply.
Efficiencies are very wide ranging depending on the lay-out and size of the installation.
Developments needed for this type of energy conversion is only for the gas turbine. Both waste
heat boilers and steam turbines are in common use and well-developed, without specific needs for
further improvement.

Figure 2.1: Flow diagram depicting process of conversion of Natural Gas to Electricity

The above diagram depicts the process of conversion of natural gas to electricity. It is a combined
cycle which utilizes the heat of the fuel gas to heat the water and operate the steam turbine.
The step by step description of the process and the machinery is as follows:
1. Air Intake System:
The air intake system consists of huge suction pumps in order to meet the air requirements. The
air to fuel ratio is 11:1. Thus the amount of air being taken in is controlled so as to keep this ratio
constant.
Figure 2.2: The view of air intake system at NTPC Faridabad
2. Air filters
The air obtained from the environment contains numerous pollutants and unwanted compounds
which may harm the machinery and reduce the efficiency of the system. These unwanted
compounds may also react with the surface of the machinery and cause scaling which would
subsequently reduce the lifetime of the machinery. To overcome this problem, the air is passed
through the filter section. This section consists of an array of 576 filters to eliminate all the
unwanted particles and compounds present in the air.

3. Air compressor
The filtered air is then passed through the compressor section. The compression of air takes place
in 16 stages. The compression reduces the temperature of air. To compensate the heat loss and
prevent the temperature shock in the next stage, heat addition is done in the next stage of
combustion.
Figure 2.3: A sectional view of an air compressor
4. Combustion chamber
After compression, the air is sent to the combustion chamber where 11 parts of air is burnt with
one part of natural gas. This leads to the expansion of air which is used to rotate the turbine.
Each turbine section is preceded by two combustors. Each combustor consists of eight burners.
Figure2.4: cross- sectional view of a combustor used in the combustion chamber.

Fuel enters the front of the burner as an atomized spray or in a pre-vaporized form. Air flows in
around the fuel nozzle and through the first row of combustion air holes in the liner. Air near the
burner nozzle stays close to the front liner wall for cooling and cleaning purposes. Air entering the
opposing liner holes mixes rapidly with the fuel to form a combustible mixture. Air entering the
forward section of the liner re-circulates and moves upstream against the fuel spray. During
combustion, this action permits rapid mixing and prevents flame blowout by forming a low-
velocity stabilization zone. This zone acts as a continuous pilot for the rest of the burner. Air
entering the downstream part of the liner provides the correct mixture for combustion. This air
also creates the intense turbulence necessary for mixing the fuel and air and for transferring
energy from the burned to the un-burnt gases. Since an engine usually has two ignition plugs,
cross ignition tubes are necessary in the can and can-annular types of burners. These tubes allow
burning to start in the other cans or inner liners.
5. Gas turbine It is a single shaft (with line compressive unit). It is a 50 Hz; 135MW machine which runs on
natural gas could also be operated on the liquid Naphtha. The gas turbine is very heavy, industrial
type, within line compressor multistage flow type. The combustion chamber is of annular type.
According to the flow of the air ; compressor is placed first, combustion chamber is next to it and
turbine at the end of gas turbine. Two bearings are placed to support the shaft of the machine,
these turbines are provided at the compressor starting end, and other are placed at the turbine end.
The shaft of the unit is provided with the blades in the turbine region.
i) Basic parts of the Gas Turbine:
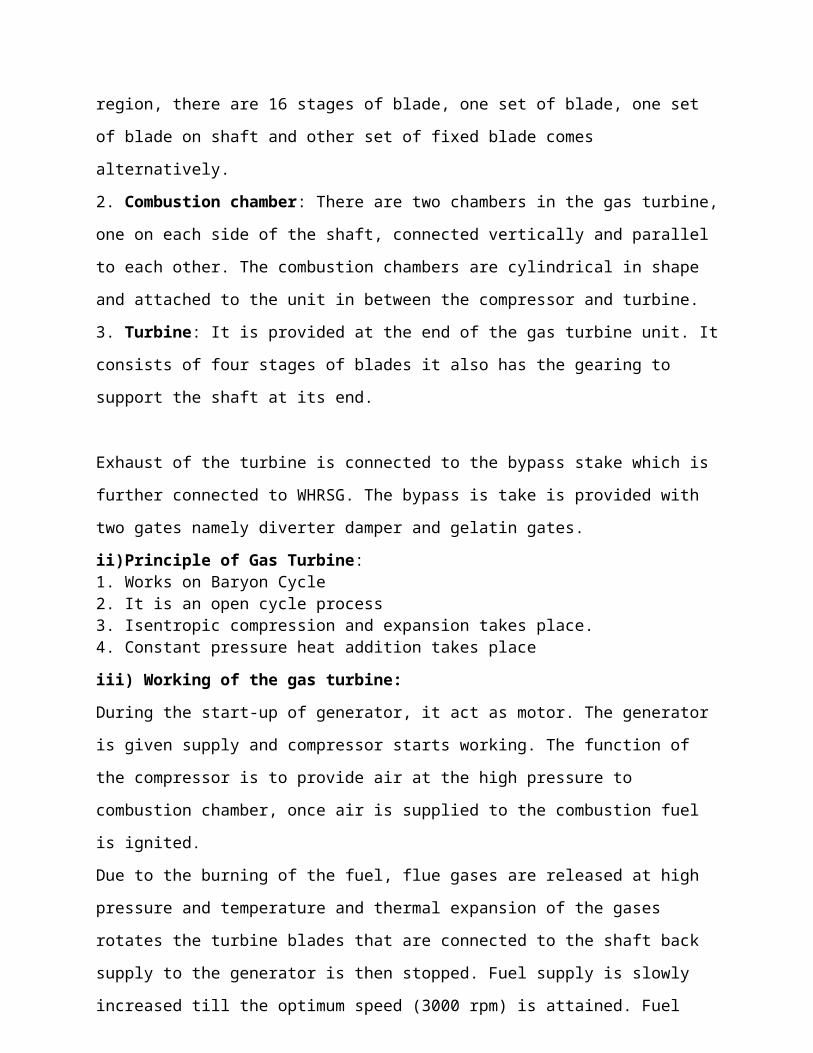
1. Compressor: Is a fuel stage axial type. It is provided with a variable inlet guide system to
enable efficient operation. Filters are provided at the top of the compressor to filter any unwanted
material from entering the turbine. In the compressor region, there are 16 stages of blade, one set
of blade, one set of blade on shaft and other set of fixed blade comes alternatively.
2. Combustion chamber: There are two chambers in the gas turbine, one on each side of the
shaft, connected vertically and parallel to each other. The combustion chambers are cylindrical in
shape and attached to the unit in between the compressor and turbine.
3. Turbine: It is provided at the end of the gas turbine unit. It consists of four stages of blades it
also has the gearing to support the shaft at its end.
Exhaust of the turbine is connected to the bypass stake which is further connected to WHRSG.
The bypass is take is provided with two gates namely diverter damper and gelatin gates.

ii)Principle of Gas Turbine: 1. Works on Baryon Cycle 2. It is an open cycle process 3. Isentropic compression and expansion takes place. 4. Constant pressure heat addition takes place
iii) Working of the gas turbine:
During the start-up of generator, it act as motor. The generator is given supply and compressor
starts working. The function of the compressor is to provide air at the high pressure to combustion
chamber, once air is supplied to the combustion fuel is ignited.
Due to the burning of the fuel, flue gases are released at high pressure and temperature and
thermal expansion of the gases rotates the turbine blades that are connected to the shaft back
supply to the generator is then stopped. Fuel supply is slowly increased till the optimum speed
(3000 rpm) is attained. Fuel supply is kept constant. The flue gases after rotating the turbine can
be directed to the WHRSG sing diverter damper and gelatine gate.
iv)Gas Turbine
Specifications:
manufacture SIEMENS(Germany); model-
V 94.2
capacity 137.76 MW
compressor 16 stage
turbine 4 stages
burner Hybrid dual fuel
combustors SILO type
Air intake filters Pulse cleaning(576 in
numbers)
By pass take Vertical 70 m in height
Ambient temperature 27 deg c
Ambient pressure 1013 Mbar

v) Gas turbine
generator
specifications:
Relative humidity 60%
Voltage rating
Current
10.5 KV+/-5%
9354A
Power factor 0.85 lagging
KVA( Apparent
power)
170.12 MVA
Excitation current 833 Amp
Excitation voltage 410 V
Insulation type Class F micalastic
Connection type
Stator Winding
AA
YY
Speed 3000 rpm
.
Figure 2.5 Gas Turbine
The air from the combustion chamber creates thrust on the turbine blades to provide rotation

Figure 2.6 Turbine Blades
The Gas Turbine used at NTPC-Faridabad is V94.2 (model-3) is manufactured by SIEMENS
6. Generator
The rotation of gas turbine leads to the rotation of the rotor part of the generator which is
connected to the same shaft as that of the turbine.
Generator
Turbine and the generator mounted on a single shaft
Figure 2.7

7. Step up transformer
The electricity is generated at 10.5KV. But this voltage is very less for the purpose of
transmission over a long distance and hence the step-up transformer is used to step up the voltage
from 10.5KV to 220KV.
Figure 2.8 Step Up Transformer
8. Unit auxiliary transformer
For the purpose of running the machinery of the plant and exciting the generator, the power
obtained from the gas turbine is utilized. Since the machinery is operated at 6.6KV, the voltage is
first stepped down from 10.5KV to 6.6KV using the unit auxiliary transformer and then supplied
within the plant.
Figure 2.9: An auxiliary transformer

9. High pressure boiler drum
The flue gas from the turbine has a very high temperature of 5400oC. This is utilized to heat the
water in the boiler drums. High power boiler drum absorbs most of the heat from the flue gas and
thus generates high power steam.
10. Low pressure boiler drum
The remaining heat is absorbed by the low power boiler drum. Thus low power steam is
generated.
Both the low power and high power steams are sent to the steam turbine.
11. Steam turbine
The plant is provided with one steam turbine generating unit. The turbine is a 3000 rpm
condensing set without any extraction for feed heating. It is a 160 MW, 50 Hz two cylinder
condensing type turbines. The first cylinder (H.P) is a single flow type 25 reactions stages and the
second cylinder (L.P) is a double flow with 7 reaction stages. It is provided with two main and
two LP stop and control valves. The H.P and L.P sections have individual turbine rotors, which
are connected to each other, and the generator with rigid couplings.
i). Basic parts of Steam Turbine:
1. H.P. Turbine: It is a single flow type turbine, with horizontal split casing and double shell. The
provision of steam inlet temperature and high pressure to admission section is subjected only to
low temperature and pressure effective at the exhaust of the turbine. The high pressure turbine is
provided with two main stop and control valves to check and regulate the entry of the steam in to
casing.
2. L.P. Turbine: It is a three cell design and has a double flow system for max efficiency. The
inner casing carries the first row of stationary blades and is supported on the outer casing so as to
allow for thermal expansion .The middle casing rest on four girders, independent of the outer
casing. The LP turbine is provided with two control valves.
3. Bearing: The HP rotor is supported on two bearings, a combined journal bearing close to the
coupling with LP rotor .The LP journal bearing at its end. The bearing pedestals are anchored to
the foundation and are fixed in position.
ii) Working of steam turbine:
The HP steam is fed to the HP section of the steam turbine. The steam passes through the stop and
control valves of the HP turbine and enters the inner casing. On entering the inner casing, the

steam after leaving the HP turbine gets converted into LP steam. This LP steam produced at the
WHRSG is passed into the inlet of the double flow LP turbine. On entering the steam once again
expands and due to the combined effect of HP&LP rotors, the generator rotor also rotated and
electricity is produced. The two outlet of the LP turbine are connected to the condenser where
water and steam mixture are connected into water for further use in the WHRSG.
iii). Specifications of HP
Turbine:
TYPE Single flow
No. of stages 25 reaction stages
Total H.P main steam
pressure
76.4 bar
HP main steam temp. 528 deg c
HPT exhaust pressure 5.1 bar
HPT exhaust temp. 175 deg
iv) Specifications of L.P. Turbine
TYPE double flow
No. of stages 7 reaction stages
Total L.P steam flow 46 T/hr
L.P main steam pressure 4.38 bar
v) Steam turbine
specification:
manufacturer BHEL( Haridwar, India)
type 2 cylinder condensing turbine
capacity 156.07MW
Maximum terminal outputs 160 MW
Main steam pressure 76.4 and 4.38 bar
Condenser vacuum -0.92 bar
speed 3000 rpm
Steam turbine generator 160000 W/188230 VA
Stator current 6900 amp
coolant air
insulation Class F

Power factor 0.85 lag
Excitation system Brush less excitation
Rotor voltage 432 V
Rotor current 797 amp
The high pressure turbine receives HP steam i.e. 85 Kg/cm2, while the low pressure turbine
receives the low pressure steam i.e. 4-5 Kg/ cm2.
Figure 2.10 A steam turbine
12. Condenser
The condenser condenses the steam from the exhaust of the turbine into liquid to allow it to be
pumped. If the condenser is made cooler, the pressure of the exhaust steam is reduced and
efficiency of the cycle increases.
The surface condenser is a shell and tube heat exchanger in which cooling water is circulated
through the tubes. The exhaust steam from the low pressure turbine enters the shell where it is
cooled and converted to condensate (water) by flowing over the tubes.
Figure 2.11: Condenser
For best efficiency, the temperature in the condenser must be kept low practically in order to
achieve the lowest possible pressure in the condensing steam. Since the condenser temperature
can be kept below 100°C, where the vapour pressure of water is much less than atmospheric
pressure, the condenser generally works under vacuum. Thus two vacuum pumps are used to
maintain the vacuum pressure of 0.9 Kg/cm2. A third vacuum pump is kept on standby in case of
emergency.
The water thus condensed is sent to the de-aerator for the removal of air. This is done by the
condensate extraction pumps.
13. Steam turbine generator
As the thrust is created on the steam turbine blades, the rotor section of the generator to which the
turbine is connected, is rotated due to the rotation of the turbine shaft. This generates power of
156 MW and a voltage of 15.75 KV is generated which is then stepped up at the next stage and
sent for transmission.
Constructional view
Figure 2.12Constructional view of Heat Recovery Steam Generator

Figure 2.13 A view of the steam turbine generator
Waste Heat Recovery Steam Generator
The waste heat generator are unfired, heat recovery type design to accept the maximum exhaust
temperature along with flue gas flow from the turbine. It is a natural circulation dual unit. All heat
transfer surface are of fin type. The feed control system is located in between the economizer and
drain to eliminate the possibility of streaming in the economizer and to enable operation with zero
approach point thereby increasing in the efficiency of the combine cycle plant. A condensate
preheated is added to low temperature zone of WHRG. There are two types of steam produced in
this unit (H.P & L.P).
Basic Parts of WHRSG:
1. Condensate Pre-heater: It is present at the end of WHRSG. It is added to lower the
temperature of flue gases in addition to increase the thermal efficiency of the plant. It consists of
spiral fined tubes welded to the top and bottom headers. There are maximum rows per module.
2. Economizers: There are three different types of economizers. These are:
a) L.P economizer: these tubes act as the economizer of the L.P steam; these are spiral fined tubes
welded to the top and bottom headers and have fully drainable design.
b) H.P economizer: these tube act as economizer for H.P steam, they also have spiral fined tubes
welded to the top bottom headers and have fully drainable design.
3. Evaporator: These are of two types:
a) L.P evaporator: these tubes act as evaporator for the L.P. steam; these are connected to the L.P.
drum and are spiral finned tubes.

b) H.P evaporator: these tubes act as evaporator for H.P. steam, these are connected to H.P. drum
and are placed closure to the turbine exhaust then the L.P. evaporator. These are also spiral fined
tubes welded to the top and bottom headers are connected to the H.P. steam drum.
4. Super-heater:
a) L.P. super heater: these tubes act as super heater for the L.P Steam. These are the fourth heat
transfer surface in the direction of the gas flow. These are consisting of finned tubes, welded to
the top and bottom headers and have maximum of two rows per module. These are designed for
single gas flow on tube side and have fully drainable design.
b) H.P. super heater 1&2: these tubes act as superheated for the H.P. Steam. These are the first
heat transfer surface in the direction of gas flow. These consist of multi pass flow on the side and
single flow on the gas side.
5. Steam drum: these are the two drums placed at the top of WHSRG, these are:
a) L.P. Drum: these drum store the L.P steam produced during the flow of water in the L.P.
evaporator. It is small in the size than the H.P drum and has a blow of cork at its top to avoid
blasting at high steam pressure.
b) H.P. Drum: this drum store the H.P steam produced during the flow of water through H.P.
super heater. It also has a blow cork for safety purposes.
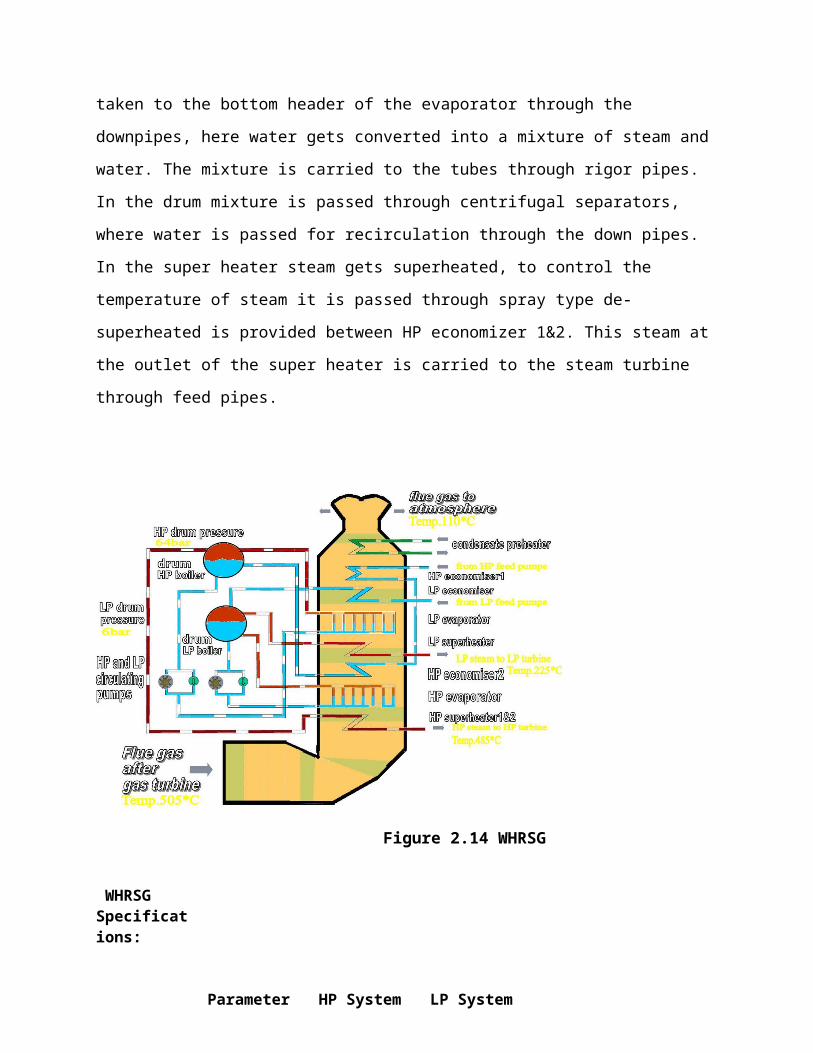
Working of the WHRSG:
The boiler feed pumps feed the water to the HP & LP economizers, where the temperature of the
water rises close to the saturation temperature after flowing to the economizers the water is passed
to the steam drums through feed control system, then water is taken to the bottom header of the
evaporator through the downpipes, here water gets converted into a mixture of steam and water.
The mixture is carried to the tubes through rigor pipes. In the drum mixture is passed through
centrifugal separators, where water is passed for recirculation through the down pipes. In the
super heater steam gets superheated, to control the temperature of steam it is passed through spray
type de-superheated is provided between HP economizer 1&2. This steam at the outlet of the
super heater is carried to the steam turbine through feed pipes.

Figure 2.14 WHRSG
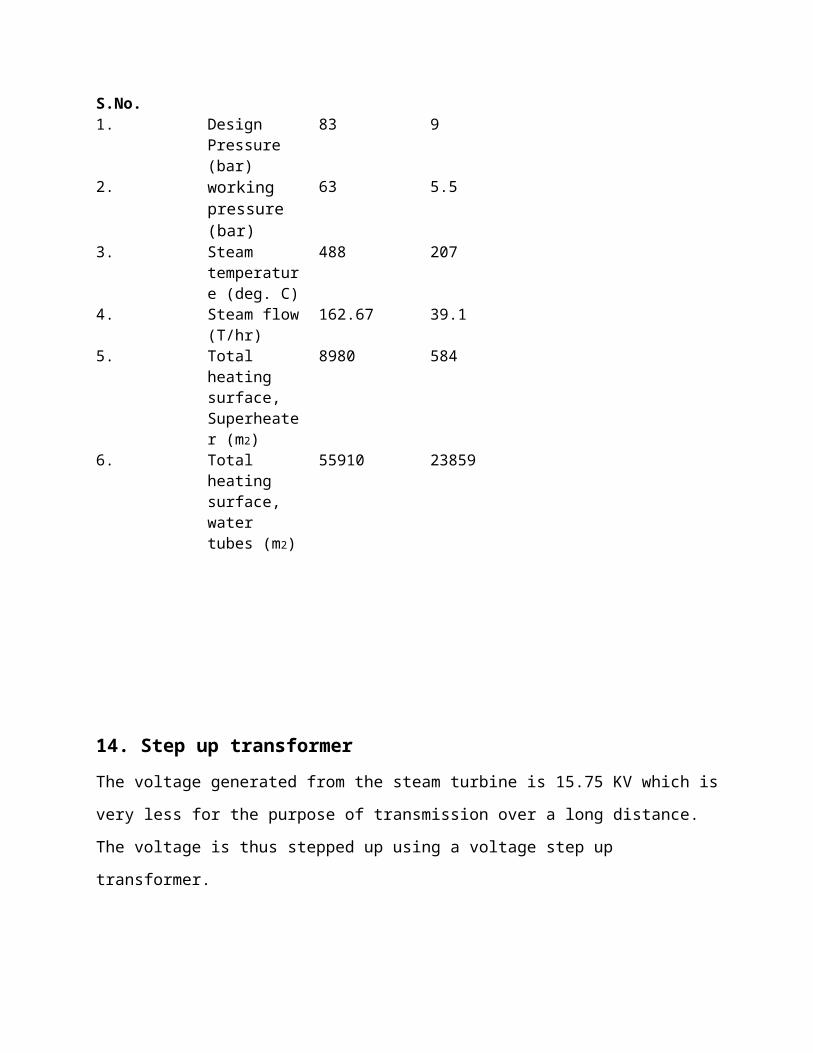
WHRSG Specifications:
S.No. Parameter HP System LP System 1. Design
Pressure (bar) 83 9
2. working pressure (bar)
63 5.5
3. Steam temperature (deg. C)
488 207
4. Steam flow (T/hr)
162.67 39.1
5. Total heating surface, Superheater (m2)
8980 584
6. Total heating surface, water tubes (m2)
55910 23859

14. Step up transformer
The voltage generated from the steam turbine is 15.75 KV which is very less for the purpose of
transmission over a long distance. The voltage is thus stepped up using a voltage step up
transformer.
Figure 2.14 A typical step up transformer
15. De-aerator
The water from the condenser is led here by the condensate extraction pumps. The de-aerating
boiler feed water system eliminates the need of expensive oxygen scavenger chemicals and also
offers the following advantages:
Removes carbon dioxide as well as oxygen.
Raises the boiler feed water temperature, eliminating thermal shock in boilers.
Improves overall boiler room efficiency.
Feed water pumps are sized for each individual application - assuring total compatibility
and optimum operation.
PRINCIPLE: Paging scheme-high temperature breaks down the gases and expels the air.
HOW DOES IT WORK? Aerated water is fed into the de-aerator through the inlet water
connection. This water passes through the steam-filled heating and venting section. The water
temperature is raised and many of the un-dissolved gases are released. As the water passes
through the assembly, it flows to a scrubber section where final de-aeration is accomplished by

scrubbing the water with oxygen free steam. This steam is induced through a stainless steel spray
valve assembly which causes the high velocity steam to break the water down to a fine mist
through a violent scrubbing action. The de-aerated water spills over to the tanks storage
compartment for use by the boiler, and the gases are vented to the atmosphere.
De-aerator
Figure 2.15 De-aerator
16. Feed storage
The de-aerated water is then stored into the feed storage tank and is pumped out when required.
17. Boiler feed pumps
They are used to pump the water from the feed storage tank to the respective boiler drums. They
are classified as high and low pressure boiler feed pumps based on the boiler drum to which they
pump the water.
18. Cooling towers
A cooling tower is equipment used to reduce the temperature of a water stream by extracting heat
from water and emitting it to the atmosphere. Cooling towers make use of evaporation whereby
some of the water is evaporated into a moving air stream and subsequently discharged into the
atmosphere.
The tower vary in size from small roof-top units to very large hyperboloid structures that can be
up to 200 meters tall and 100 meters in diameter, or rectangular structure that can be over 40
meters tall and 80 meters long. Materials are chosen to enhance corrosion resistance, reduce
maintenance, and promote reliability and long service life. Galvanized steel, various grades of
stainless steel, glass fibre, and concrete are widely used in tower construction

Figure 2.16 Cooling towers
CHAPTER 3 FUEL
Gas turbines are capable of burning a range of fuels including Naphtha, crude oil and natural gas.
Selection of fuel depend upon several factors including availability of fuel, fuel cost, cleanliness
of the fuel. Natural gas is an ideal fuel because it provides efficiency and reliability with low
operation and maintenance cost. Liquid fuels particularly heavy oils; usually contain
contaminants, which cause corrosion and fouling in gas turbine. Contaminants which cannot be
removed from fuel may leave deposits in gas turbine, which reduces the performance and adds to
the maintenance cost.
Duel fuel system is commonly used, enabling the gas turbine to burn up the fuels when primary
fuel sources are not available. Duel fuel system can be designed to fire both fuels simultaneously.
3.1. Natural gas
Natural gas is an ideal fuel in gas turbine. It contains primarily Methane (CH4) other gases are
ethane (C2H6), Nitrogen (N2), Carbon dioxide (CO2) and Sulphur(S). It has following advantages:
clean burning.
Availability at lower cost.
particularly free from solid residue.
High calorific value of Methane.
Low Sulphur content.

For FGPP, This gas comes from Bombay High through medium of pipelines and one pipeline
from Village Chhainsa (Faridabad).
Fig 3.1 Pipelines of gas source
3.2. Naphtha
FGPP works on natural gas but if there is shortage of natural gas then plant is run on Naphtha.
Naphtha as compared to natural gas has less calorific value but there is no alternate fuel other than
Naphtha. It is cheaper than any other fuel and the amount of flue gases that comes out of the
Naphtha can also be sent out to boiler to boil the water for manufacturing of steam for running the
steam turbine.
Naphtha is highly inflammable and highly explosive fuel. When it makes a mixture with air, it
forms a very highly dangerous explosive mixture. When the supply of natural gas cuts off, the
pipelines are filled with air. So while using Naphtha, it is necessary to remove that air because it
can make explosive mixture with Naphtha. So for flushing this air a high-speed diesel (HSD) is
sent to the pipeline, which removes the air present. In this way HSD enters the combustion
chamber and working continues. This is the procedure for working of gas turbine when it has to
feed on Naphtha without stopping the while plant, which was previously feed on natural gas.
Naphtha before entering the pipelines undergoes filtration various times so that there should not
be any impurity in that when it enters the combustion chamber. The main difference between
Naphtha and Natural gas is that, natural gas enters the combustion chamber in the form of gas but
Naphtha enters in form of liquid spray. Then it is compressed in it and due to high compression it

burns and leaves very highly pressurized flue gases, which in turn is used to rotate the gas turbine.
This entire process of using the Naphtha as a fuel is known as Naphtha firing.
Fig 3.2 Naphtha specification
3.3 OPERATIONS AND FUEL HANDLING DEPARTMENT
This department handles the operations of the plant by managing the fuel and all the machinery
related to the monitoring and controlling the various parameters of the fuel.
The natural gas is supplied to the plant through the HBJ pipeline based on the requirement. It is
then used as per requirement.
For emergency purposes, the plant stores 16000Kl of naphtha at any point of time.
During the generation of electricity using naphtha, the naphtha is dosed with HSD (High Speed
Diesel) to form a favorable and efficient combustible fuel.
Storage of naphtha: Naphtha is piped through the Asavati pipeline as per the order placed and is
pumped into the reservoirs using two unloading pumps. Its flow into the reservoirs is then
monitored using the proper measuring instruments.
Naphtha is stored in two 8000Kl reservoirs made of cement and RCC walls. The reservoirs are
inverted bowl floating roof type to prevent any air inside the chamber which may cause a harmful
reaction with naphtha. A pressure of 28Kg/cm2 is maintained inside the reservoirs. Also, the
chamber is insulated completely in order to control the temperature and prevent combustion of
naphtha owing to high temperature.

Figure 3.3 Naphtha Storage tanks
Storage of HSD: HSD is supplied by the Indian oil co. via tankers. It is then stored in the
Reservoirs and used as per the needs. The reservoirs are fixed roof type.
Fire fighting structure: Both the reservoirs are protected by a foam pump house situated near the
reservoirs. In case of fire, the automatic fire combat systems get enabled and the foam is pumped
at such an angle so that it settles on the roof of the reservoir and cuts-off the oxygen supply to the
fuel.
Forwarding of the fuel: Naphtha is sent to the reservoirs using the unloading pumps. When
required, it is pumped out and sent to the dosing chamber using three forwarding pumps.
The HSD is also pumped from the reservoirs to the dosing chamber by two forwarding pumps.

CHAPTER 4 CONTROL AND INSTRUMENTATION DEPARTMENT
Control and instrumentation in any process industry, can be compared to the nerve system in the
human being .The way the nerve system controlling the operation of various limbs of human
being, C & I in the same way controlling and operating various motors, pumps, dampers, valves
etc. and helping us to achieve our targets.
Control and instrumentation, as the name indicates, is a branch in engineering which deals with
various measurement, indication, transmission and control in different technical fields. The latest
developments made in the area of instrumentation are so wide that it has become humanly
impossible to master over all the systems individually. Even in instrumentation there are further
sub groups now. The term instrument means “A device or combination of devices used directly or
indirectly to measure and display a variable.”
Instrumentation is a measurement of various parameters with comparison to set standards. We
have been using for ages different instruments such as weights, yard stick, scales, measuring
tapes, standard container for liquid measurement e.g. Litre, gallons etc. Each of these equipments
is an instrument. Similarly, in industries and Process plants, Instrumentation makes use of various
measuring components designed to suit the process and the purpose. As some of the big industries
and process plants need to control different process variable from a remote distance control room,
the further measuring, transmitting indicating, recording, abnormality alarm system and
innovated. The process of innovation is marching ahead in fast rate. In the near future, we are
certainly to enter in towards more and more sophistication n C&I stream.
The Control & Instrumentation Department(C&I) is responsible for the operation of all the
electronic sensors, actuators and controllers besides maintaining the pressures, temperatures, level
and the flow in the various tanks, pipes and also in the various heat exchangers present in the
plant. It is thus the brain of the plant.
The main functions of the C&I dept. at NTPC Faridabad are:
1. Measurement and display of various parameters.
2. To control the various parameters by Automatic feedback controlling which involves the taking
of decision based on inputs from measurements by the processor.
3. Protection of various equipments (pumps, generators etc.) and workers from hazards by
automatically tripping a cycle when hazardous conditions are reached.
4. Alarm generation in case of a mechanical or an electrical failure.

The Faridabad plant has outsourced its automaton to various companies on a Package Based
Deal.
The C&I dept. besides also undertakes the modifications or up gradation of its systems.
This division basically calibrates various instruments and takes care of any faults occur in any of
the auxiliaries in the plant. It deals with metallurgical problems. In any process the philosophy of
instrumentation should provide a comprehensive intelligence feedback on the important
parameters viz. Temperature, Pressure, Level and Flow. This department is the brain of the plant
because from the relays to transmitters followed by the electronic computation chipsets and
recorders and lastly the controlling circuitry, all fall under this.
Figure 4.1 C&I department

4.1 AUTOMATION AND CONTROL
The word automation is widely used today in relation to various types of applications, such as
office automation, plant or process automation.
This subsection presents the application of a control system for the automation of a process /
plant, such as a power station. In this last application, the automation actively controls the plant
during the three main phases of operation: plant start-up, power generation in stable or put During
plant start-up and shut-down, sequence controllers as well as long range modulating controllers in
or out of operation every piece of the plant, at the correct time and in coordinated modes, taking
into account safety as well as overstressing limits.
During stable generation of power, the modulating portion of the automation system keeps the
actual generated power value within the limits of the desired load demand.
During major load changes, the automation system automatically redefines new set points and
switches ON or OFF process pieces, to automatically bring the individual processes in an
optimally coordinated way to the new desired load demand. This load transfer is executed
according to pre- programmed adaptively controlled load gradients and in a safe way.
4.1.1 THE BENEFITS
The main benefits of plant automation are to increase overall plant availability and efficiency. The
increase of these two factors is achieved through a series of features summarized as follows:
1) Optimization of house load consumption during plant start- up, shut-down and operation, via:
Faster plant start-up through elimination of control errors creating delays.
Faster sequence of control actions compared to manual ones. Even a well- trained
operator crew would probably not be able to bring the plant to full load in the same
time without considerable risks.
Co-ordination of house load to the generated power output.
2) Ensure and maintain plant operation, even in case of disturbances in the control system, via:
Coordinated ON / OFF and modulating control switchover capability from a sub process
to a redundant one.
Prevent sub-process and process tripping chain reaction following a process component
trip.
3) Reduce plant / process shutdown time for repair and maintenance as well as repair costs,
via:
Protection of individual process components against overstress (in a stable or unstable
plant operation).

Bringing processes in a safe stage of operation, where process components are protected
against overstress.
4.1.2 PROCESS STRUCTURE
Analysis of processes in Power Stations and Industry advocates the advisability of dividing the
complex overall process into individual sub-processes having distinctly defined functions. This
division of the process in clearly defined groups, termed as FUNCTIONAL GROUPS, results in
a hierarchical process structure. While the hierarchical structure is governed in the horizontal
direction by the number of drives (motorized valves, fans, dampers, pumps, etc.) in other words
the size of the process; in the vertical direction, there is a distinction made between three
fundamental levels, these being the: -
Drive Level
Function Group Level
Unit Level.
To the Drive Level, the lowest level, belong the individual process equipment and associated
electrical drives.
The Function Group is that part of the process that fulfils a particular defined task e.g., Induced
Draft Control, Feed Water Control, Blooming Mill Control, etc. Thus at the time of planning it is
necessary to identify each function group in a clear manner by assigning it to a particular process
activity. Each function group contains a combination of its associated individual equipment
drives. The drive levels are subordinate to this level.
The function groups are combined to obtain the overall process control function at the Unit
Level. The above three levels are defined with regard to the process and not from the control point
of view
SWAS (Supply Water Analysis System)
It constantly monitors the various parameters of the supply water
4.1.3 CONTROL SYSTEM STRUCTURE
The primary requirement to be fulfilled by any control system architecture is that it be capable of
being organized and implemented on true process-oriented lines. In other words, the control
system structure should map on to the hierarchy process structure.
BHEL’s PROCONTROL P®, a microprocessor based intelligent remote multiplexing system that
meets the requirement of controlling the steam turbine. On the other hand CALIPUM-ST controls
the gas turbine.
4.1.4 SYSTEM OVERVIEW
The control and automation system used here is a microcontroller based intelligent multiplexing
system. This system, designed on a modular basis, allows to tighten the scope of control hardware
to the particular control strategy and operating requirements of the process. Regardless of the type
and extent of process to control provides system uniformity and integrity for:
Signal conditioning and transmission Modulating controls
4.2 CONTROL AND MONITORING MECHANISMS
There are basically two types of Problems faced in a Power Plant
Metallurgical
Mechanical
Mechanical Problem can be related to Turbines that is the max speed permissible for a turbine is
3000 rpm, so speed should be monitored and maintained at that level
Metallurgical Problem can be view as the maximum Inlet Temperature for Turbine is 1060oC so
temperature should be below the limit.
Monitoring of all the parameters is necessary for the safety of both:
Employees
Machines
So the Parameters to be monitored are:
Speed
Temperature
Current
Voltage
Pressure
Eccentricity
Flow of Gases
Vacuum Pressure
Valves
Level
The C&I dept. uses various instruments in its functioning.
They can be broadly classified as:
1. Sensors
2. Controllers
3. Actuators
Sensors
1. Sensors are instruments used for measurement purposes.
2. They measure various parameters and convert them to electrical output which is supplied to
controllers.
3. This data is then displayed which aid the engineers make the judicious decisions.
These sensors measure the following parameters:
1. Level of fluids in pipes and tanks e.g. LVDT can be used for this measurement.
2. Flow of fluids such as fuel steam etc. done by sensors such as Venturimeters or Rotameters.
3. Pressure in tanks and pipes also can be measured
It’s done by sensors such as Gauges, Pressure Switches, Capacitive Transducer etc.
4. Temperatures can be measured anywhere in the system.
Instruments such as Thermocouples and RTDs are used

Controllers
These are devices which receive data from the sensors, process it and give instruction to the
actuators based on the processed data. They are analogous to the human brain.
Various types of control systems used at NTPC Faridabad are:
1. Single control system
This consists of a single processor which controls the entire process. This system is not quite
efficient as it draws large amount of power and also if the processor fails then the entire unit has
to stop.
2. Distributed control system
This consists of various processors which are responsible for various parts of the process and have
a channel of communication between them enabling them to work efficiently. Such a system is
more efficient and is favored.
DCS is extensively used within the plant to control various processes of the plant.
Actuators
Actuators are analogous to motor organs like hands or legs of the body. Actuators are the
instruments which are responsible for carrying out control commands from the controller like
closing of a valve etc.
Actuators are of manly three types:
1. Pneumatic
These actuators carry out mechanical tasks using compressed air. These are very accurate but are
not very strong and get damaged easily. The pressure in it is in the range of 3-15 psi.
2. Hydraulic Actuators
These use the pressure of compressed oil to perform their tasks. These actuators are quite strong
but lack a high degree of accuracy.
3. Electronic Actuators
These make use of electronic motors to perform their tasks.

4.3. POWER STATION INSTRUMENTATION
TYPES OF INSTRUMENTS
This discussion is only on the process instrumentations measuring the physical quantities such as
temperature, pressure, level flow etc. The other types of instruments are the electrical instruments
measuring electrical quantities such as current, voltage etc. The different types of instruments
normally in use are given below:
1) Indicators
Indicators are of two categories local and remote. Local indicators are self contained and self
operative and are mounted on the site. The remote indicators are used for telemeter purposes and
mounted in the centralized control room or control panel. The indicators both local and remote are
sometimes provided with signaling contacts where ever required. The remote indicators depend on
electricity, electronics, pneumatic or hydraulic system for their operation and accordingly they are
named. The indicators can be classified as analogue or digital on the basis of final display of the
reading.
2) Recorders
Recorders are necessary wherever the operating history is required for analyzing the trends and
for any future case studies or efficiency purposes. Recorders can be of single point measuring a
single parameter or multipoint measuring a number of parameters by single instrument. Multipoint
Recorders are again categorized as multipoint continuous or multipoint dot recorders. The
multipoint dot recorders select the point one after the other in sequence where as the continuous
recorders measure simultaneously all the points.
4.3.1. PRESENTATION OF INFORMATIONS
Enormous amount of information measured and received from the various parts of the
plants/process are to be presented to the operators giving appropriate importance to each one. In
order to have an easy and effective presentation, the information are generally grouped in to the
following three groups:
Vital information which is required by operators at all times for the safe operation of the
plant. This information is presented through single point indicator/recorder, placed on the
front panels. Main steam pressure, temperature, condenser level, vacuum, drum level,
furnace pressure etc. are some such parameters.

The second group of information is generally not vital under the normal operation of the
plant. But they become vital whenever some sections of the plant start malfunctioning.
Such needs are met through multipoint indicators/recorders placed in the front panels.
Temperature and draft across the flue gas path bearing temperature of the motors of fans
etc are some such examples
.The last group of information is not required by the operators but for the efficiency
engineers. This information are given by recorders mounted on back panels or local
Panels. D.M. make up quantity, fuel oil flow quantity etc. are some examples.
4.3.2 SELECTION OF INSTRUMENTS
Instruments engineers are required to work in close association with the system design as well as
the equipment design engineers in selecting instruments and sensing system. After deciding the
capacity of Thermal Power Station the designs of Boiler turbine and auxiliary equipments such as
mills, pumps, fans, de-aerator, feed heaters etc. are taken up.
Based on the design of the main and the auxiliary equipments, the parameter values for efficient
and economic operation determined load are specified. The instrument and system design
engineers decide the location for the measurement of various parameters such as level, pressure,
flow, differential pressure, temperature and other parameters based on the system design and
layout conditions.
Then the instrument engineers select the appropriate instruments influenced by following factors:
i) Required accuracy of measurement
ii) Range of Measurement
iii) The form of final data display required
iv) Process media
v) Cost
vi) Calibration and repair facilities required/ available
vii) Layout restriction
viii) Maintenance requirement/ availability

4.3.3. CONCEPT OF INSTRUMENTATION IN THERMAL POWER STATIONThe concepts of instrumentation are that:
i) Instruments should be independent for their working
ii) The total instrumentation should be independent to each other in assessing the process
conditions.
iii) Instrumentations should be sufficient to provide adequate information to the operators
for:
a) Cold start of the unit
b) Warm/hot start of the unit
c) Shut down both planned and emergency shutdown.
POWER STATION INSTRUMENTATION
The process conditions and the equipment conditions are to be assessed by the operators from the
information received from the various instruments. The instruments and range vary very widely
as per the process media. The following section deals with these instruments. The inter
dependence and inter relation of these instrument readings play very significant role in the
stability and the efficiency of the heat balance.
TEMPERATURE MEASURING INSTRUMENTS
Accurate measurement of temperature is required to assess the material fatigue, heat balance,
heat transfer etc. The measurement ranges from ambient temperature where air inlet to F.D. fan
is measured to 13000C to 14000C inside the furnace zone. Temperature measurement is made in
many medias such as water/steam, oil (fuel oil and lubricating oil), air fuel gases, hydrogen gas,
metal temperatures, turbine top and bottom, generator winding and cores, S.H. tube metal etc.
Filled system thermometry such as mercury in glass, mercury in steel, vapor filled or gas filled
are used for local indication. The selection of thermometer depends upon the range of the
temperatures to be measured. These instruments are available with electrical contacts for setting
up annunciation and protection system wherever required.
Resistance thermometer or thermocouples are used as primary sensors in remote measurement of
temperatures depending upon the range. Resistance thermometers are of platinum and copper
resistance type. Platinum resistance thermometers are calibrated to have 46 ohms or 100 ohms at
00C. The secondary instruments used in conjunction are cross coil indicators or electronic
bridges. These instruments indicate temperature by measuring the nature of resistance which

changes with the change in temperature. Resistance thermometers are generally used up to 3000
C.
Above 3000 C, thermocouples are used as primary sensor. The common types of thermocouples
used in thermal power station are chromel-alumel or chromel-copel depending upon the
temperature. Iron constantan is another thermocouple in use. The secondary instruments for
thermocouple sensor are pyrometriv millivolt meters or electronic potentiometers. Null balance
method is used for the very accurate measurement of millivolts generated by thermocouples
sensing the process temperatures.
The electronic bridges and potentiometers can be either indicators, or indicator cum recorders
with alarm/protection contracts and with remote transmission facilities.
PRESSURE MEASURING INSTRUMENTS
The pressure measurement in thermal power station ranges from 1 Kg/cm2 (nearly) at condenser
to hydraulic test pressure of boiler. Here again many medias exist such as steam/water,
lubricating oil, fuel oil, air, fuel gases, hydrogen etc.
For local indication of pressure and differential pressure, bourdon tube, type and diaphragm type
gauges or liquid monometers either electronic or pneumatic coupled with a secondary instrument
indicator/recorder. Many varieties of transmitters are in use. In these transmitters the mechanical
movement of sensing elements such as bourdon, bellows, diaphragm etc. due to the pressure
causes an electrical property change such as current, voltage, resistance, capacitance, reluctance,
inductance etc. which is utilized as a measure of pressure in the secondary instruments. The
secondary instruments are either indicators or recorders which may incorporate signaling
contacts.
LEVEL MEASUREMENTLevel measurement is generally carried out as differential pressure measurements. In power
stations, level measurement in open tanks such as DM storage Tank and Fuel Oil and Lub Oil
tanks and in closed tanks such as de-aerator, condenser hot well, boiler drum and L.P. & H.P.
heaters are to be made. Gauge glasses and floats are used for local indication of levels and the
transmitters used for measuring the differential pressure are used along with the secondary
instruments for remote level measurements.

The measurement of the boiler drum poses many problems because of varying pressure and
temperature and many computations and corrections are to be made in order to get correct levels.
A recent development in this area is the ‘Hydra step’. Though it is very costly it improves the
accuracy and the reliability of this measurement.
Other problem area is the solid level measurement where the coal bunker levels and dust
collector hopper level are required. In both these cases continuous level measurement is not
possible. However fairly reliable and accurate provisions are available to indicate the extreme
level on either directions (low or high). The nucleonic level gauges or the capacitance and
resistance type sensors serve in these areas very well.
FLOW MEASUREMENTFlow measurement of solids, liquids and gases are required in Thermal Power Stations. Though
the liquid flow measurements are made very accurately, the gas flow measurement cannot be so,
water flow measurements are done fairly easily and accurately whereas steam flow measurement
requires density correction under varying pressures. The air and flue gas flow measurements
suffer accuracy and reliability due to variation in pressure, temperature, duct leakage, dust
accumulation etc. The solid flow measurement is very difficult and only on a rough area is
arrived at about the P.F. flow through inferential means. In Power stations flow measurement are
based on inferential principles. Differential pressures are created by placing suitable throttling
devices in the flow path of the fluids in the pipes/ducts. The throttling devices are suitably
selected depending upon the media, flow quantity etc. from among office, venture, flow nozzle
dall tube etc. the differential pressure developed across such sensing devices is proportional to
the square of the flow quantity. The differential pressure is measured by the devices discussed in
9 with additional square root extraction facilities.
ANALYTICAL INSTRUMENTS
Apart from the above there are few quality measurements necessary in thermal power generation
plants of high capacities. These include feed water quality measuring instruments such as
conductivity, pH, dissolved oxygen, and sodium instruments, steam quality measuring
instruments, such as conductivity, silica and pH analyzers. The combustion quality is accessed
by the measurements of the percentage of oxygen, carbon monoxide or carbon dioxide in the fuel
gases. The purity of the oxygen inside the generator housing is measured by utilizing the thermal
conducting capacity of the hydrogen gas.

The water and steam purity is measured as the electrolytic conductivity by electronic bridge
method in which one arm form the electrodes of conductivity cell dipped into the medium.
The volume percentage of oxygen in combustion gases is made utilizing the paramagnetic
properties of oxygen. The carbon monoxide percentage is measured by the ‘Absorption of
Electromagnetic radiation’ principle.
Both these gas analyzers require elaborate sampling and sample conditioning system resulting in
poor reliability and availability of these measurements. Recent developments in these fields have
brought out on line ‘in-situ’ instruments for these two parameters where the problem of sampling
is dispensed with.
The ‘Analytical Instruments’ as the above instruments had been the neglected lot so far in the
power stations. But now the authorities seem to think their importance for the process.
TURBOVIBORY INSTRUMENTS
The turbovibory instruments have become very important in modern day turbines where the
materials have been stressed nearer to the yield points and the internal clearance have become
the minimum .Shaft eccentricity, vibration (both shaft and bearing pedestal) differential
expansion of shaft and cylinders, overall some of the turbovibory measurements. These all
measurements are interrelated and interdependent.
LIST OF INSTRUMENTS
All these measurements discussed above and their correct interpretation enables the operators to
check and watch the behavior of the process and the equipments and take necessary corrective
actions in time.
A typical list of important measurements carried out in Thermal Power Stations is given below:
Temperature
a) Steam temperature at boiler outlet, super heater stages, steam legs before ESVS, CVS
after ESVS, IVS and at turbine Curtis wheel-indicators/indicator-cum recorders with
alarm and protection facilities in control room.
b) Steam temperature at turbine HP cylinder outlet, hot reheat and exhaust hood
temperatures.

c) Metal temperature of turbine casing and metal temperature of super heaters and reheaters-
indicators, indicator cum recorder in U.C.B. with multipoint selection.
Other temperature measurement in various zones of boiler indicator
a) Flue gas temperature measurement in various zones of boiler indicator and indicator cum
recorder in control room.
b) Air temperature at inlet and outlet of air pre-heater.
c) Turbine bearing oil drain temperature-indicator cum recorder in U.C.B.
d) Generator winding and core temperature-indicator cum recorders in control room.
e) Temperature of auxiliary equipments bearing such as mill ID, FD and P.A. fans etc
indicator cum recorder in U.C.B.
Pressure
a) Condensate pressure after condensate pumps and before the ejectors-indicator in U.C.B.
b) De-aerator pressure-indicator cum recorder in U.C.B with electrical contacts for
interlocking facilities.
c) Feed water pressure after feed pumps-individual indicators for each pump.
d) Feed water pressure before and after feed regulating stations-indicators in U.C.B.
e) Drum pressure indicator cum recorders in U.C.B. with alarm signaling facilities.
f) Super heater steam pressure at boiler outlet 2 Nos. indicators one for each side in U.C.B.
and at local with alarm protection facilities. Measurement is done at the outlet of super-
heater and before boiler stop valves.
g) Steam pressure – 1 No. indicator cum recorder, one of the lines before turbine stop valves
in U.C.B.
h) Steam pressure at emergency stop valves and TVS.
i) Steam pressure after control valves indicators in local panel for Pressure of each valve.

j) Steam pressure at Curtis wheel indicator cum recorder in U.C.B. with alarm contacts.
k) Steam pressure in H.P. turbine exhaust indicator in U.C.B. for cold reheat steam.
l) Vacuum in condenser indicator cum recorder in U.C.B. with alarm facilities and separate
vacuum relay for protection.
m) Hot reheat pressure indicator in U.C.B. with signaling contacts.
n) Steam pressure at the exhaust of I.P. cylinders-indicators in local panel.
Pressure: Fuel and Lubricating Oil
a) Heavy oil pressure indicators in U.C.B. with signaling contacts. Measurement is made
before and after pressure regulating valves.
b) Light warm up oil pressure indicators in U.C.B. with signaling contacts. Measurement is
made before and after the flow control valves.
c) Ignition oil pressure indicator in U.C.B.d) Governing oil pressure-indicator in U.C.B. with signaling contacts.
e) Lubricating oil pressure-indicator in U.C.B. Measurement is made after oil coolers.
Pressure: Air Flue Gas
a) Air pressure indicators in U.C.B. before and after air heater for secondary air.
b) Indicators in U.C.B. before and after air heater for primary air.
c) Wind box pressure indicators in U.C.B.

d) Furnace draft-indicators and recorders in U.C.B. Measurement is made averaging left and
right side drafts.
e) Flue gas draft before and after economizer-indicators in U.C.B.
f) Draft after air heaters two indicators in U.C.B. one for each air heater.
g) ID fan suction – 2 Nos. indicators in U.C.B. one for each fan.
LEVEL MAESUREMENT
a) Drum level indicators and indicators cum recorders (total 3 Nos from different tapping)
in U.C.B. with alarm and protection facilities. Normally 3 types of measurement are
adopted:
i) Local gauge glass
ii) Remote gauge glass and
iii) Remote indirect measurement
b) Drip level in H.P. and L.P heaters-indicators in U.C.B. with alarm and
protection facilities.
c) Condensate level-indicator in condenser-indicator in U.C.B. with alarm and protection
facilities.
d) De-aerator level-indicator in U.C.B. with signaling contacts for alarm.
e) The various storage tank level such as D.M. water, fuel oil, lubricating oil etc. are
measured by the local direct gauge glasses.
Flow
a) Condensate flow to de-aerator-indicator/recorder in U.C.B. with integrator unit for totalizing in two locations (i) between air ejectors and L.P. heater No. 1 and (ii) between the final L.P. heater and de-aerator.
b) Feed water flow indicator/recorder in U.C.B. with integrator unit. Measurement is made
between final H.P. heater and feed regulating valves.

c) Super heated steam flow – 2 Nos. indicators cum recorders one for each pipe with
integrator unit in U.C.B.
d) Re-heater steam flow –2 Nos. indicators cum recorders one for each side of the boiler.
Measurement is made at the inlet to re-heater.
e) Air flow-2 Nos. indicators cum recorders one for each FD fan in U.C.B. and
measurement is made at the discharge of th FD fans.
f) Fuel Flow
The fuel oil flow to the unit is given by two indicators cum recorders in U.C.B., one
measuring the oil in the incoming line and the other in the return line. Normally the coal
flow is measured for the whole station by the belt conveyor weighers.
AUTOMATIC CONTROL
The importance of maintaining a balance in the process was discussed under section 1 whenever
the process gets disturbed due to the deviation of process elements behavior; they are to be
brought back to the balance condition. Since a lot of process elements are involved and
disturbances are very frequent, the correction can be carried out efficiently and quickly only by
the introduction of automatic control system eliminating any possible human error. The
following are the important automatic control loops in the thermal power station.
Automatic Boiler Control
i) Steam pressure always called as Boiler Master
ii) Combustion control
iii) Furnace draft control
iv) Boiler feed regulation or drum level control
v) Super heater/ re-heater steam temperature control

vi) Auxiliary steam pressure control
vii) Mill group control
Turbine Automatics
i) Condenser hot well level regulation
ii) Drip level control in L.P. and H.P. heaters.
iii) Feed pump speed control
SEQUENCE CONTROL AND INTERLOCKING SYSTEM
A power station is a combination of many individual equipments and systems and for better
performance it relies upon the performance of these individual equipments. These equipments
are interdependent and interrelated with each other, and therefore they are to operate in
coordination with each other. Electrical interlock systems connect these individual equipments
and operate then with required sequences. For example Boiler is a system comprising milling
plant, ID fans, FD fans, PA fans etc. these equipments are interlocked in such a way that they are
started / shut down in specific sequences in order to avoid damage to equipments and men. For
example in a milling system the coal feeder is interlock such a way that it will not start unless it’s
succeeding system to crush and discharge the coal into the furnace such as exhauster / P.A fan
and mill are in operation. These schemes may very little with different manufacturers but
generally all P.F and oil fired boilers have common sequences.
Also equipment is so interlocked that in case the failure of the running equipment to deliver the
good, automatically the reserve one is put in to service. For example in case a feeds pump which
is running fails to meet the demand of the boiler, the interlock system will put the reserve pump
into service to meet the demand. As the unit size increases the number of interdependency of
operations increases. A system of automatic sequence control simplifying the operator’s duty has
come into existence.

REMOTE CONTROL AND OPERATION OF EQUIPMENTS
As discussed earlier that power station comprises many types of equipment, it become necessary
to operate them from a centralized room. Moreover as the capacity of plant increases its
operating electrical supply potential, also increases which is very dangerous on safety point of
view. As a result the indirect way to remote operations came into practice. A very low voltage
level such as 110 V or 240 V AC/DC is used to close a breaker of the electrical motor of 3.3 or
6.6 KV voltage level. The low voltage switches are usually provided on the operating desks in
the control room. Where D.C is used for station batteries are provided as standby.
DATA ACQUISITION AND DATA LOGGING
The conventional central control room is rather a cumbersome system. Large number of
instruments must be observed to know what is happening inside the plant. The data acquisition
simplifies this job by collecting all the measurements transmitted from the process, converting
them into digital term and storing in the memory bank. The periodic loggings of parameter by
the operators are dispensed with after the introduction of data acquisition system, which prints
out the periodic conditions on predetermined time intervals. All the important measurements at
one time are printed along a row. Data loggers thus reduce the use of graphical recorders.
Since data logging gives too many measurements at a time, it cannot be easily digested by the
control staff. Now data reduction systems are finding their use where only the process quantity
deviated from normal value is shown.
VISUAL DISPLAY UNIT (V.D.U)
Visual display units go along with the data acquisition system. In V.D.U pre selected schemes,
flow paths with parameters, running alarm conditions etc. can be brought on color television
tubes on demand. This gives the life picture of the happening inside the plant making the
operation easy and effective.

AUTOMATIC TURBINE RUN UP
Turbine start up is the most difficult operation. Each start up will be different. many parameters
and procedures should be scrupulously adhered to where an error in human decision will result in
heavier damage to the unit. Therefore modern day machines of higher capacity or machines
which are to be frequently started are to be provided with automatic run up, synchronizing
loading gears.
Under normal condition this gear will accelerate the turbine from having gear speed to full speed
uninterrupted at a rate determined by the initial turbine temperature conditions. Under hot start
conditions, this run up period may be of the order of 5 to 10 minutes and comprise two zones, the
first half is relatively slow rate upto 1000 rpm, the second half is a fast rate from 1000 to 3000
rpm (a range which includes critical speed). In the event of abnormal conditions this program of
acceleration is temporarily held (except in the regions of critical speed), or in more severe
conditions, reserved or tripped.
The abnormal conditions are monitored by the turbo-visory instruments discussed earlier.
Automatic synchronizing is also effected by the gear if selected for the function. This scheme
matches the frequency voltage and time phase of the generators out put to that of existing busbar
and close the circuit breaker.
Automatic loading gear enables the machine to be loaded automatically at the selected rate
through the control of governor speed motor. The supervisory gear also will be in use during this
function. The rate of loading various widely from 5% per minute during the initial block loading
to 20% M.C.R.
SCANNING SYSTEMS
In the complex process extending over a considerable area lot of massages are transmitted to and
from the process. These transmission channels are quit expensive and there may be danger of
loss of data owing to confusion of signals by extraneous electrical noises. In cases of coded
transmission less sensitive to such noise is found useful. Hence all the process signals in

Analogue from scanned in sequence one at a time converted into digital form and transmitted to
the central information system for display or control purposes.
BURNER MANAGEMENT
For higher capacity boiler, fuel firing rate is also higher. Explosion occurs within 1 to 2 secs of
fuel accumulation. Therefore leaving the management of fuel firing to the operators will lead to
explosion because human reflexes will be little slower. A complete automatic burner
management system called furnace safeguard supervisory system ‘FSSS’ in short has been
introduced to manage the present day boilers.
This system takes care that every increment of fuel input corresponds to the available ignition
energy inside the furnace.
The following functions are entrusted to such an automatic burner management system:
i) Furnace purge supervision
ii) Igniter control
iii) Warm up oil control
iv) Pulverize control
v) Secondary air damper control
vi) Flame scanner intelligence
vii) Boiler trip protection
The above discussion gives some synopsis of the instrumentation in thermal power station.

CHAPTER 5 Interpretations of Instrument Readings
5.1 INTRODUCTION
To give the operation engineers a correct picture of the happenings inside the
plants enormous numbers of instruments are required to be installed. Also those
instruments are to be mounted in panels in centralized locations to avoid many
personals watching the readings and interpreting on their own way. Also these
instruments are to be arranged in such a way that they give plant behaviors in a
systematic way and with minimum complexity. Here comes the aesthetic and
ergonomics view of the installation.
TELEMETERING
For the centralized instrumentation remote indication facility is required and
consequently telemetering was introduced. The method of placing the
instruments at a distance from the measuring point is called telemetering. This
type of metering is very common in power stations as nearly all the instruments
for measuring and controlling the power flow are centrally mounted on a panel.
Electrical instruments are now widely used for this purpose because they are
convenient to install, reliable and reasonably accurate. Also it is cheaper to
transmit an electrical signal by a cable than pipe lines in case of pneumatic.
Transmission lag is very negligible. However if the telemetering is required for a
short distance, pneumatic system is used.
INTERLOCKING SYSTEM
A power station is a combination of many individual equipments and systems
and for better performance relies upon the performance of these individual
equipments. The equipments are interdependent and interrelated with each other,
and therefore they are to operate in coordination with each other. Electrical
interlock systems connect these individual equipments and operate them with a
required sequence. For example boiler is a system comprising milling
plant, ID fans, FD fans, PA fans etc. These equipments are interlocked in such a way that they
are started / shut down in specific sequences in order to avoid damage to equipments and men.
For example in a milling system the coal feeder is interlock such a way that it will not start
unless its succeeding system to crush and discharge the coal into the furnace such as exhauster
and mill are in operation. These schemes may very little with different manufacturers but
generally all P.F and oil fired boilers have common sequences.
Also equipment is so interlocked that in case the failure of the running equipment to deliver the
good, automatically the reserve one is put in to service. For example in case a feeds pump which
is running at time, fails to meet the demand of the boiler, the interlock system will put an
idle/reserve pump into service to meet the demand.
ANNUNCIATORS
The operation Engineer’s attention should be drawn towards a parameter which deviates much
from the desired value. This is done by the annunciators installed in the control panels in front of
him by audio, visual or both means. Whenever the system deviation occurs, a relay gets
energized by the signal received from the deviated system which sets up a flashing light, an
audible alarm. These are to be received by the operator till then they continue to be on. It
becomes necessary for him to take necessary remedial action to correct the deviation.
REMOTE OPERATION OF EQUIPMENTS
As discussed earlier that power station comprises many types of equipment, it become necessary
to operate them from a centralized control room. Moreover as the capacity of plant increases its
operating electrical supply potential also increases which is very dangerous on safety point of
view. As a result the indirect way of remote operations came into practice. A very low voltage
level such as 110 V or 240 V AC/DC is used to close a breaker of the electrical motor of 3.3 or
6.6 KV voltage level. The low voltage switches are usually provided on the operating desks in
the control room. Where D.C is used for station batteries are provided as standby. Circuit
breakers are provided with protection relays.

INTERRELATION OF INSTRUMENTS
In order to have stable generating conditions the heat energy supplied through the fuel must
balance the electrical energy output of generator plus the normal losses. But often this balance is
disturbed due to fluctuations in temperature, pressure, steam flow or electrical output. A large
number and variety of instruments are required to measure and indicate the cause and amount of
disturbance so that steps can be taken to keep the energy flow in balance. Each instrument has its
own function to perform but the value of its measurement often depends on the accuracy of the
other instruments associated with it. The interdependent and interrelations of these instrument
readings play very significance roll in the stability and efficiency of the heat energy balance.
Furnace Draught
The balance between the induced and forced draught fans is produced by measuring and
controlling the furnace suction. Balance draught usually occurs when there is slight suction
inside the combustion chamber. This is achieved by properly adjusting the speed or the dampers
of the fans. Disturbances in the draught can cause unstable combustion and this in turn will affect
the readings on many of the other instruments associated with the boiler.
CO2, CO, and O2 Measurement
These instruments are valuable guides to know:-
1) The quantity of air supplied.
2) The variation in the quality of the fuel being burnt.
3) The performance of the automatic control if in circuit.
The percentage of CO2 may not necessarily be an indication of efficient combustion. It may be
showing an optimum value yet the combustion must be incomplete due to the variation in non-
carbon combustibles such as hydrogen, sulpher and chlorine.
Therefore the reading of the O2 may be a correct percentage according to the reading yet, it may
be found still in excess. Therefore in modern day practice the CO measurement is taken

as valuable information regarding the combustion. Air is adjusted till we get some traces of ‘CO’
in the flue gases.
Temperature
Accurate measurement of steam temperature is very important because of the high degree of
superheat used and boilers are operated with critical temperature margins. Steam temperature
measurement itself is comparatively easy but its control is more complicated due to the time log
and thermal inertia inherent in the system.
There will be wide variation in the moisture content of the coal flowing through the mill. Air
with varying temperature is to be sent to dry out that moisture. But the primary air temperature
variation affects the stability of the combustion, steam temperature, exit gas temperature etc.
Fuel Measurement
It is easy to measure the liquid fuel by the conventional instruments in volume quantities. In case
of solid fuel such as P.F. the measurement is not possible with conventional type of instruments.
Therefore their quantities are determined indirectly by measuring the quantities of primary air.
But a certain volume of fuel does not always have the same amount of heat units due to the
variation in calorific value moisture and ash contents. Variations in quality and quantity of fuel
affected the steam, air and gas flow as well as temperature pressure, CO2, O2 and power output.
However the variations can be easily adjusted in the fuel flow system.
Measurement of Air And Gas Flow
Since boiler handles large volume of air/gas, it is difficult to measure the quantity correctly due
to the variation in pressure, Temperature, casing leakages, dust laden etc. The measurement of
the air/gas is used as a means of establishing the correct fuel/air ratio.
Normally measurement of air flow is very easy as compared to gas flow because of accumulation
dust, slag and varying temperature etc.

Turbovisory Measurements
The turbovisory readings such as differential expansion eccentricity, vibration, and temperature
differentials give a fairly clear picture of the behaviours and clearances and also the eccentricity.
Eccentricity in turn give a picture of vibrational level. All these parameters are interdependent
and interrelated.
AUTOMATIC CONTROL
Whenever the balance gets disturbed due to the deviation of process elements behaviour they are
to be brought back to the balance condition. Since lot of process elements are involved and
disturbances are very frequent, the correction can be carried out efficiently and quickly on by
introducing automatic system for elimination any possible human error. Thus automatic control
was established to maintain the system balance.
For example when an operator has to fire the boiler by regulating the fuel to the burners and at
the same time to adjust the position of dampers or the speed of the fans for the control of air
supply, haw well he does this depends of the type of fuel and his own ability. His mistakes in
assessing the things in a correct proportion will aggravate the disturbance. But an automatic
combustion control does this job, more quickly, efficiently and smoothly. Automatic control
system detects the changes signal and direct the regulator accordingly to correct the deviation.
Advantages Of Automatic Control System Are:
a) The values of the process elements such as steam pressure, temperature flow are kept
close to the desired value.
b) Combustion efficiency is improved resulting in:
i) Fuel Economics
ii) Reduction in boiler fouling
iii) Less atmospheric pollution
iv) Less carbon in ash and grit
c) Metal fatigue is reduced by maintaining stable metal temperatures.
d) The operator is relieved of continuous tedious operations.
e) Increased safety both to men and equipment since human error is eliminated.
f) Operator has more time to spend in regular operation and routine inspection.
Disadvantages
a) The equipment has to be much reliable.
b) The standard setting should have to be watched and adjusted to suit the varying
characteristics of fuel etc.
c) Sometimes control action goes on the reverse direction due to the time lag in the
measurement.
d) Control equipments are very expensive and require periodic maintenance.
COMPUTERS
With the increasing size of modern plant, the distances between items of plant run of four to five
hundred yards away from the centralized control rooms. Also large number of equipments
necessitate large number of instruments. It becomes very difficult to watch these many
instruments and supervise the operation of such a large number of equipments. A computer
relieves the operator from routine tasks leaving him free to concentrate on the overall inspection.
The operator cannot always watch every instrument and at the same time make the necessary
adjustments to suit the constantly varying conditions. However a computer can be programmed
to make all the necessary adjustment as and when required.
The starting up operations of a large unit involves somewhere around 1000 separate steps
including nearly 500 switching operations to bring on load. All those steps are to be carried out
in short time and in correct sequence. These all activities become cumbersome and any mistake
will lead to disastrous end. Computer fed with correct programme, performs these duties will.

It is very difficult by the operation engineer to keep a constant watch on these temperature
gradients. For a computer it is very easy job. In many cases computers are exclusively used to
run up a turbine. It allows the steam into the set at the appropriate temperature and accelerates
the set after monitoring the internal clearances temperature differentials and other mechanical
aspects, runs upto speed and synchronise the set. In the computers facilities are available to
check the efficiency of the plan then and there. The evolution of computer can be compared to
teaching animals to do tricks. Every trick has to be acquired by much study and experimentation
on a slow progressive basis.
DATA LOGGING
The conventional central control room is rather a cumbersome system. Large number of
instruments must be observed to know what is happening inside the plant. The data logging
simplifies this job by collecting all the measurements transmitted from the process, converting
them into digital form and printing them on the log sheets. All the important measurement at one
times are printed along a row. Data loggess thus reduce the use of graphical recorders.
Since data logging gives too many measurements at a time, it cannot be easily digested by the
control staff. Now data-reduction systems are finding their use where only the process quantity
deviated form normal value is shown.
SCANNING SYSTEMS
In a complex process extending over a considerable area, lot of messages are transmitted to and
from the process. Theses transmission channels are quite expensive and there may be danger of
loss of data owing to confusion of signals by extraneous electrical noise. In such case some
coded transmission, less sensitive to such noise is found useful. Hence all the process signals in
analogue form scanned in sequence one at a time converted into digital form and transmitted to
the central information system for display control purposes

CHAPTER 6 PRESSURE MEASUREMENT AND MEASURING INSTRUMENTS
6.1 PRESSURE MEASURMENTPressure measurements are one of the most common measurements taken and recorded in the
Power Station ranging from very low, i.e. condenser vacuum to very high i.e. hydraulic pressures
in some actuator systems. Between these two limits of say 30-40 millibar absolute to 300 bar are
to be the measurements of different process media-steam, water, oil, air, gas etc. and each with
varying degree of accuracy and reliability.
6.2 PRESSURE MEASURING DEVICES
The common pressure measuring devices are-
1. Manometers using water, mercury and other liquids of known density for low pressure
measurement.
2. Diaphragm, Capsule bellows for measuring medium pressures.
3. Bourdon tube gauges for measuring medium and high pressures.
4. Transducers of different types for measuring pressures of all ranges for telemetering
purposes.
Of these above, the manometers are mainly used in laboratories for calibration purposes and as
such, the diaphragms, Capsule bellows have taken its place for site use.
6.2.1 Manometer Elements
The manometers are mostly used in laboratory for calibration purposes as these are the
fundamental type of instruments. At site they are mainly used for test purposes, in the low ranges
0-1000 mm with mercury as manometers liquid maximum being.

If one end is sealed, then the manometer can be used for absolute pressure measurement. If the
area of one of the limb is made considerably greater then the other, then the measurement of the
differential pressure is represented by the height of the liquid column in the smaller tube with
negligible error. Such system is called the single limb manometer or cistern manometer since the
larger area pipe is in the form of a metal cistern. The manometer liquid normally used is water.
Sometime colored water is used to distinguish the column. The other liquids used are
i) Transformer oil having specific gravity 0.864
ii) Mercury having specific gravity 13.56
iii) Blended Paraffin liquid
Industrial type high pressure ‘U’ tube manometers are available having metallic tubing. These
manometers employ a secondary system of linkages / leverages for indication purposes. Inclined
tube manometers are the special development to give increased length of column for less
differential pressure. The inclined tube carries the scale. Manometers are available with
adjustable inclination depending upon the range required. Fig. 6.1 to 6.2 shows a system of
manometers.
Figure 6.1 a)

Figure 6.2 a)
Figure 6.1 b)

Figure 6.2 b)
6.2.2 Diaphragm, Capsule and Bellows
The present days low pressure to medium pressure applications are met with diaphragms. Also
the introduction of these elements as greatly helped in remote measurement and control of
pressures even of very low range (0-4 mm wcL).
Material and Range of Measurement
The various types of diaphragm and below elements are made of steel of special composition,
phosphor bronze, nickel silver and beryllium copper etc.
Bellows and multistack are made from 80-20 brass, phosphor bronze, stainless steel and
beryllium copper.
For very low pressures, the diaphragms are required to be extremely flexible. For these
applications materials like colon leather, gold beater skin, nylon rubberized fabric etc. are used.
These groups of sensors are used for the measurement of very low pressure upto 20-25 kg/cm2

6.2.3Bourdon Tube Gauges
This is the oldest instrument introduced initially to the measure pressures from medium to high
ranges. But present days these are used almost for every range of pressure measurement.
However their application is limited to measure “Gauge Pressures” only.
It consist of a metal tube approximately elliptical in cross section formed into a ‘C’ shape, a long
spiral (helical) or to a flat spiral by special machines one end of the tube is closed and sealed and
the opposite end is left open and terminated to a block where the process pressure is applied. If
the pressure inside the tube is more than that existing outside, the elliptical section changes its
shape and it begins to straighten out, with the result that the free end deflects is an arc. The
deflection is proportional to the pressure difference between inside and outside pressures since
the outside pressure is atmospheric. These gauges measure ‘Gauge pressure’ as shown in Figure
6.3.

Ranges of Pressure
Burdon tube gauges are in use from the range 0-0.5 kg/cm2 to 6,000 kg/ cm2 and even higher
ranges occasionally. The practical range for each type of listed below.
Helical boundon - 0-0.5 Kg/cm2 upto 0-6000 kg/cm2
‘C’ Type boundon - upto 700 kg/cm2
Flat spiral bourdon - low ranges upto 0-70 kg/cm2
Materials
Materials like phosphor bronze, steel, berrylium copper etc. are used depending upon the pressure
range and the media’s corrosiveness. The chart given in Table I give more details of bounden tube
materials and their pressure ranges
MaterialComposition
JointsHeat range
Pressure
Percentage Treatment kg/cm2
Phosphor Copper 95 Soft None 1-70Bronze Tin 5 Soldered(Drawn) Phosphorus
TraceBeryllium Beryllium 1.8 Brazed Precipitation 03-350Copper Cobalt 0.3 hardened(drawn)Alloy Carbon 0.26/ Screwed Quenched 650-5500Steel 0.32, Chromoum and(machined) 0.8/1.1, tempered
Molybdenum0.15/0.25
K. Monel Nickel 66 Screwed Precipitation 70-1350(Machined) Copper 29 hardened
Aluminium 2.75Iron 0.9
Stainless Chromium 16/18 Welded Stress 2-70Steel Nickel 10/14 relieved(machined) Molybdenum 2/3
The simplicity and ruggedness of a Bourdon gauge makes it the most frequently used pressure
gauge. The reference pressure in a Bourdon gauge is atmospheric pressure. Hence, the dial
reading gives gauge pressure.
ERRORS IN BOURDON TUBE GAUGES
Errors that may occur in Bourdon gauge are zero error, range error, angularity error, and
hysterisis. For zero error the pointer is adjusted, for range errors the quadrant screw is adjusted,
for angularity error the linkage screw is adjusted. In case of error due to hysterisis the tube
should be replaced if the error goes beyond the specified value.
Hystersis is the difference in the indicated value of the gauge for an applied pressure during
the increasing cycle and during the decreasing cycle of pressure.
TESTING A BOURDON PRESSURE GAUGE
1. Gauge is tested at 5 points up and down before adjusting anything. Divisions
corresponding to about 10%, 30%, 50%, 70%, 90% are chosen.
2. About 1% pressure is applied then zero is set by removing and replacing the pointer to
read the pressure applied.
3. About 90% scale pressure is applied if necessary the range is adjusted by loosening
the shoulder screw and moving the linkage along the slot in the quadrant (towards the
pivot to increase the range, away from pivot to decrease the range).
4. Step 1 and 2 are repeated until gauge is correct at both points.
5. When zero and range are correct then angularity is adjusted if necessary. Half full
scale pressure is applied to the gauge, angularity adjustment screw is loosened and
adjustable linkage is slided until the angle formed by the quadrant and linkage is right
angle.
6. Approximately five points of the scale are checked with pressure increasing, the
readings are tabulated.
7. The same five points with pressure decreasing are checked and result tabulated.
8. Result from 6 and 7 are used to check for hysteresis.
9. Gauge is assembled. Pointer should not foul the glass over any part of its travel.
10. Result sheet is made the final condition of the gauge as a % of full scale. Gauge
should be within 1% of full scale.
Zero Error
A zero error can be observed easily by quickly testing at the cardinal points. A zero error will
have exactly the same amount of deviation at all points. in this type of error the pointer is
reset.
Applied Pressure kg/Cm2 10 30 50 70 90
UP 9 29 49 69 89Gauge Reading
DOWN 9 29 49 69 89

CALIBRATION OF BOURDON TUBE GAUGES
Pressure gauges in industrial process must be accurate so that any time the process pressure is
known. This helps to achieve accurate control of the industrial process. The pressure gauges
described till now required regular calibration. The calibration is possible if one is sure what
pressure is being applied to the gauge.
Hydraulic calibrator is one such device which used in calibrating the pressure gauges. The
hydraulic units dealt with in this chapter use oil for application of pressure.
The principle of operation, setting up and maintenance of two calibrators’ viz. comarator and
deadweight tester is given here. In both the devices the pressure that is being applied is
known. In a comparator the applied pressure is indicated in a standard weight placed on the
instrument.
DIFFERENTIAL PRESSURE GAUGE
Fig. 6.5 is a differential pressure gauge with a dual bourdon system. The two tubes are
connected to the single pointer. Tube 1 forms port 1 and tube 2 forms port 2
Ports 1 and 2 are connected to the process whose differential pressure is to be measured. The
deformation of tube 1 causes the pointer to rotate anticlockwise via link cradle and quadrant.
The deformation of tube 2 causes the pointer to rotate clockwise via link and quadrant. The
movement of the pointer is opposite for the individual pressures and hence the gauge reads
the differential pressure-
A typical application of this unit is the measure of differential across filters to indicate
blockages or end of life of filter.
During installation of this unit due consideration must be given to overloads. A differential
unit must always be accompanied by an equalizing unit shown in Fig No.6.6.

6.5
To remove the gauge, first valves A and B and closed, valve C is opened to equalized
pressure in both the part P1 and P2. The gauge is removed now. To check zero on plant the
same procedure is followed, but the gauge is now removed.
To restart the unit is installed with valves A, B and C losed. After installation value C and B
are opened. Then C is closed and A is opened.
SNUBBER
This is a protection device for pressure measuring instrument from violent pressure surges
and pulsation. Snubbers also known as deadners reduce the effect of pulsating pressure. They
result in the instrument indicating or recording an average pressure, instead of recording each
individual surge or pulse. Snubbers are used in pipe lines leading to the instrument.
In general, these snubbers reduce the velocity of fluid to the instrument and thus prevent
sudden extreme change in pressure from reaching the measuring element too rapidly. The
reduction in velocity can be achieved by several methods. The body consist of two parts, the
lower part and the upper part, lower part is connected to the pipe line. It contains a piston.
The pin piston assembly rises and falls with the pressure impulses and absorbs the effect of
shock and surge. Owning to the rise and fall of the piston the snubber is self cleaning. The
upper part of snubber is screwed to the lower part, on one side and to the pressure instrument
on the other. The upper part has a stop for piston. The stop has a hole in the centre for the
process fluid to pass to reach the instrument from the pipe line and vice versa.

GAUGES WITH ALARM CONTACTS
These types of gauges give alarm when the pressure reaches a set level. The working of
gauge in which the alarm contact is to be made when the pressure reaches a set higher limit is
given here.
The gauge has a pressure setting needle. This needle is set via a knob through the centre of
the glass of the gauge. The glass is generally of acrylic. The needle has a projection where
contact will be made. The needle is connected to a wire.
The pointer is also connected to a wire. It has a projection when it touches the projection on
the setting indicator a contact is made. When the pressure reaches the set value then the
gauge pointer touches the projection on the setting needle. The pointer and setting needle
behave like an open switch till the set limit is reached. The gauge can be connected to relay,
hooter or lamp for alarm or control. Sometimes a magnet is provided on the needle to enable
quick closing of contact Thereby avoiding chances of sparking.
In a similar manner alarm controls can be made at two points one for a low pressure limit and
the other for a higher pressure limit. If the working pressure reaches the low set limit or the
high set limit alarm contact is made.
DIGITAL PRESSURE GAUGES
Digital pressure gauges working with integral or remote pressure sensing transducers are now
becoming more easily available and these are usually of a very high accuracy. This means of
course that they can be used for calibration purposes or for efficiency monitoring. The
following pages describe two such devices and they have proved in practice to be very
valuable calibration standards for the Eggbrough commercial instrumentation In particular
the device is used for checking the transmitters which measure the condenser absolute
pressure.
The system for measuring condenser vacuum has had to be investigated at great length
initially, one tapping into the condenser steam space was used. Following test it was found
necessary to use one from each LP T/A exhaust in to the condenser and average the pressure
via a common manifold. This system now gives a representative average absolute pressure in
the condenser.
And all readings which originally disagreed because they tapped in to different points on the
condenser now agree.
Calibration over the full range 0-100 mbar absolute is achieved by use of the condenser’s
own vacuum when the T/A is on load and the use of a vacuum pump in series with the gauge
tapping.
DRAUGHT GAUGES
Draught gauges are used extensively throughout the Power Station to measure air and gas
pressures through the boiler and mills. The draught gauge is basically a diaphragm pressure
gauge with an elongated scale.
The readings are all transmitted as (0-10 mA) standard signals, if the process medium is not
allowed in the control room.
The foregoing comments on pressure gauge installation is appropriate to draught gauges also,
and since they are measuring relatively low pressures it is important that the pipe work is
installed very carefully with the added provision of a blow down facility to clear the lines of
dust.
For suction gauges it has been found that the drilling of a small hole in a draught gauge line
near the tapping point can give an automatic cleaning of the lines without loss of reading or
sensitivity.
Calibration of draught gauges is best achieved with a manometer. Manometers of reasonable
accuracy and the correct range can be obtained from various manufacturers. It is important
when calibrating a draught gauge in this way that the correct type of manometer is used
6.2.4. TRANSMITTERS FOR PRESSURE AND DIFFERENTIAL PRESSURE MEASURMENT
A transmitter has a process signal such as pressure, flow, level or temperature as its input and
an electric or pneumatic signal as its output.
PRFLOWLEVEL TRANSMITTER ELECTRIC/PNEUMATICTEMP OUTPUT SIGNAL
Thus the basic function of a transmitter is to proportionally modulate an electric / pneumatic
signal in response to the process parameters. We shall confine our discussion to electronic
transmitters. These transmitters sense the change in process variable within a certain range
and produce an output current within a range. The output range is standardized to bring
uniformity in the construction of secondary instruments as well as to facilitate the test and
calibration work. The prevent output signal ranges are:
A. 4 – 20 MA DC
B. 0 - 20 MA DC
C. 10 - 50 MA DC
Transmitters are generally connected in a measurement loop according to one of the
following methods:
a. Four Wire Transmitters
In this method four conductors are led to the transmitter. One pair is used to carry the power
supply, which may be 220 VAC or 24 VDC. The other pair is used for signal transmission as
shown in Fig. No 6.7.
Figure 6.7

b. Two Wire Transmitters
This is presently the most widely used method for transmitter connections. There are three
basic elements in this loop, namely a/c power supply, transmitter and the receiving
instrument. They are connected in series and the transmitter acts as a current regulator in the
series circuit. The current in the series circuit changes with respect to change in process
parameters as shown in Fig. No6.8.
Thus only two wires are needed for connecting one element to another. This simplifies
cabling and reduces erection and cable costs.
Being a series circuit, the input resistance of the receiving instrument plays an important
role, as higher input resistance will generally limit the loop current. For this purpose
transmitter manufacturers generally provide a load drive capacity curve for the transmitter.
Referring to Fig. 6.9 we find that, this curve gives the maximum value of input resistance that
can be connected at the operating power supply voltage, without affecting the output current
of the transmitter
Figure 6.9
COMPARISON OF DIFFERENT TRANSMITTERS

The force balance transmitter is one of the early designs of two wire transmitters and is still
used widely. It has inherently rugged construction and is of simple design. However it has a
very large number of mechanical linkages and moving parts. This inherently reduces its
accuracy and makes it prone to errors due to hysterises, deadband. It also make it very bulky
and heavy. The zero and span adjustments are also mechanical and as such achieving good
calibration accuracy is not very easy.
The capacitance type and strain gauge type are definitely of superior design. They have
virtually no moving parts and hence are very accurate and have a good repeatability. They are
lightweight in construction and much smaller in size. Also al the adjustments such as zero,
span, damping are electronic therefore calibration becomes very easy
CHAPTER 7 Level Measurement and Measuring Instruments
7.1 INTRODUCTIONIn the most power station applications level can be defined as ‘the height of a liquid or solid
above a reference line’.
If the dimensions of a vessel are known then the volume or mass of its contents can be
determined by measuring the level. Hence the vessel contents can be directly displayed in
units of level (meters), volumes (litters) or mass (Kilograms).
There are three main reasons for making measurements of solid particles or liquid level; of
the three, safety of personnel and plant is the most important.
7.2 LEVEL MEASURMENT – METHODS
There are many methods of measuring level, the selection of a particular system is largely
determined by the practical consideration already mentioned together with capital cost
(equipment and installation), reliability, maintenance cost and degree of expertise required by
maintenance personnel.
The method to be considered can be classified as follows:
1. Floats and liquid displacers
2. Head pressure measurement
3. Electrical / electronic
4. Ultrasonic
5. Nucleonic
6. Direct viewing
7.2.1 Floats and Liquid Displacement
The use of a float enables the level of liquid to be measured when direct viewing is
impracticable. The float material may be of hollow metal, a plastic material, or molded
rubber.
Float and Counterweight Type
This method consist simply of a large area float connected by a chain type or cable to a
counterweight which passes in front of a scale and acts as an index.
The float should have the largest possible area in order to reduce the errors owing to friction
and out of balance forces of the cable or chain. If the surface of the liquid under measurement
is turbulent, a guide will have to be set up to stop the float moving around in the tank and
causing errors.
Rigid Arm Float
With the further development of attaching the float to a pivoted arm, the total energy
available can be increased due to the moment of force of the buoyance factor acting on the
float at a distance from pivot point. With this arrangement the total force can therefore be
regulated by changing the size of the float and also the length of the float arm as shown in
Figure 7.1.
A rigid arm float has the advantage of being completely self contained and may be fitted to
open or close tanks in virtually any position, though its range is much smaller than that of the
cable-and-pulley type. Remote indication may be built in as in the other type.

Figure 7.1
The float movement is limited to about 120o as a maximum, the motion being transmitted to
the pointer by a worm drive or similar arrangement. If the gauge is mounted below the liquid
level, there must be some seal between the gauge and the tank. Some gauges use a
magnetic method or pointer transmission.
Float Operated Switches
Where it is required to initiate an alarm, start or stop a pump or open or shut a valve at a high
or low level the magnetically operated switch or air pilot may be used. The float assembly
carried with a permanent magnet which is opposed by a similar magnet which operates the
switch, or air pilot valve. These adjacent poles of the two magnets are of the same polarity so
that they repel each other, thus giving the mechanism a snap action. In the level switch
mechanism the contracts change over with snap action when the float passes the mid position.
In the air pilot valve, a compressed air supply is led into the unit, and when the float is in its
highest position the air valve permits the passage of air to the diaphragm or piston-operated
value causing the valve to close. A fall in liquids level causes the air valve to change over,
shutting off the air supply and venting the air in the diaphragm valve to atmosphere
permitting the valve to open
Figure 7.2
LIQUID DISPLACER SYSTEMS
This gauge, embodying a displacer, relies on Archimedes principle for its operation.
According to this principle if an object is weighed in air and then in a liquid there is apparent
loss of weight which is equal to weight of the displaced liquid. The displacer is a long hollow
cylinder loaded to remain partially submerged, and is suspended in the liquid in the vessel or
in an adjacent small diameter chamber connected to the vessel. The apparent weight of the
displacer will decrease as the level of the liquid rises.
7.2.2 Head Pressure Measurement Systems
These system use the principle that a column of liquid will exert pressure whose value
depends only on the weight of liquid, density of liquid and acceleration due to gravity and is
totally independent of the cross-sectional area of the column as shown in Fig.7.3.
Figure 7.3

If the density of the liquid remains constant then the height of liquid above a datum (tapping)
point is directly proportional to the pressure measured at that datum point. Thus a pressure
measuring device can be used scaled in units of level.
Measurement of Liquid Level In Open Vessels
Since the static pressure at a chosen point of measurement (datum line) will vary directly
with the head of liquid above it, it can be seen this pressure can be measured and the gauge
calibrated directly in head of liquid. The tapping point is always taken above the sediment
level. The gauge will read directly the total depth of liquid in the tank.
The gauge can be pressure measuring device, for example, bourdon tube, bellows, U tube,
enlarged leg manometer etc.
Measurement of Liquid Level In Closed Vessels
With closed vessels in most cases the vessel is closed because the system is to be pressurized,
or to operate conditions other than atmospheric as per Fig. 7.4.
Figure 7.4

In these cases it is necessary to see that the same conditions exist on the reference side of the
indicator as inside the container, so the reference limb is fed back into the top of the vessel.
Closed Vessel With Condensable Vapour
With closed vessels a further condition that may produce errors is when the pressure in the
tank contains vapour and these vapours then to condense on top of metering fluid in reference
limb, again causing the pressure factor which must be taken into account.
To offset this condition condensing chambers are used, these are chambers with a
considerably greater area than the meter chambering areas, so that the level of liquid in it
does not change much when the metering liquid moves in the manometer. The whole line will
thus be filled with condensate, thus forming a pressure head of relatively constant value, any
additional condensation now overflowing back into the vessel.
Figure 7.5

Figure 7.6

Liquid Seals
When there is a danger that the liquid whose level is being measured will, due to its nature,
adversely affect, the manometer fluid or transmitter diaphragm material then liquid seals
should be used.
The sealing liquid must not mix with the vessel liquid, be attacked by it, absorb corrosive
elements from it. Of course it also must have no adverse effects on the manometer fluid or
diaphragm material.
Gas Purge System of Level Measurement
Basically this method consists of a tube which is inserted into a liquid whose depth is to be
measured. An air pressure is applied to the tube and the air pressure is built up until bubbles
just begin to escape from the bottom of the tube. Bubbles will only form only when the
pressure in the tube is negligibly higher than the pressure exerted on the bottom of the tube
by the height of the liquid above the bottom of the tube as per Fig.7.6.
When bubbles from the pressure in the pipe P = gh. When the density of the liquid is known
the pressure will be proportional to the height of the liquid above the bottom of the tube.
Therefore if the pressure in the tube is measured by the pressure gauge or U-tube the scale
can be calibrated in terms of depth of liquid on into any units required such as the volume or
weight of the liquid in the tank.
Air Trap System
In some cases where measurement of level is required, such as strong corrosives or at
working temperatures unsuitable for diaphragm, the air trap system can be used.
The box is covered by a plate with a small hole just large enough to allow liquid to enter. As
the level of liquid in the tank rises, the pressure on the air trap increases, liquid flows into the
trap and compresses the gas in the trap. When the air pressure plus the head of the liquid in
the trap is equal to the head of liquid above the trap no more liquid above the trap, no more
liquid enters the trap. The air pressure set up can be measured by a suitable indicator or
recorder which can be calibrated directly in terms of level.
Figure 7.7 Air Trap System
Bellows Type

In the above type of diaphragm box is replaced by a box containing a bellows of synthetic
material. Changes of pressure within the bellows due to changing levels are communicated to
the measuring bellows by copper tubing having a fine bore. The bellows are filled with air at
a pressure slightly above atmospheric pressure. As the level increases the measuring bellows
is compressed – this increases the pressure in the system and the detecting bellows detects the
change in pressure and indicates it on a gauge, calibrated directly in units of level. In
common with other instruments, its reading of depth will be in error due to the change in
density of the tank contents with change in temperature.
Figure 7.8
Diaphragm Stack System
As the level increases the diaphragm stack is compressed, this compresses the air in the
system which creates which creates an increase in pressure. This increase in detected by
suitable indicator which is calibrated in terms of liquid level, volume or weight.
7.2.3. Electrical/electronic Methods Of Level Measurement And Control

Electrical methods for level measurement are very useful as generally where there is
minimum limitation on transmission distances between transducer and display or control
devices. Their speed of response is often better than pneumatic systems and they are very
useful when measuring the levels of vessels containing the solids.
Conductivity Methods-Levels Measurement
The system consists of number of conductors of different lengths connected together by a
series of resistors. As the level increases more and more conductors are shorted together, so
shorting out the resistors joining them, thus the overall resistance will decrease. See Fig. 7.9.
Figure 7.9
If a constant voltage is applied across the terminals, then as level increase, resistance
decrease, hence the current flowing in the circuit will increase. Therefore current will be
proportional to the level. If an ammeter is placed in series with the circuit, then it will
indicate the current flowing in the circuit. Since the current is proportional to level the
ammeter can be calibrated directly in terms of level.
This method can be adapted for use in manometer level measurement system by locating the
electrodes in the mercury of one of the limbs.
Conductivity’ Methods – Hydrastep System

The hydrastep system is probably the most common system used for boiler drum level
measurement. It has three main advantages over traditional gauge type systems
a. Smaller errors incurred due to change in liquid densities.
b. The output supplied to a conventional analogue level controller can be easily checked
for error using level indicating lamps.
c. Digital outputs for computer or microprocessor control/logging can be readily provided.
Density Errors
In the sight gauge and head pressure manometer it has been assumed that the density of the
liquid remains constant throughout, but this is not necessarily true. If the temperature of the
liquid in the limbs varies then its density varies thus errors in level indication will occur.
The hydrastep vessel uses a side-arm method of attachment to the drum, and carries a number
of separate electrodes spaced vertically at intervals, usually of 25 – 50 mm (1-2 in), each of
which is associated with a separate channel of the electronic indicating system. The design of
the vessel, however, gives a very much reduced density error. The conventional visual gauge
body has a small cross – sectional area and a small bore, with only a small flow of
condensate. A by pass tube is often fitted so that condensate from the stemp, pipework is
diverted from the gauge. Because of the small cross section, the heat flow in to the gauge
body occurs more or less equally from both the steam and the water, and because of the slow
flow, the temperature gradient of the water column is large.
The hydrastep vessel has a metallic cross-section some four times that the visual gauge, and a
bore cross-section of about 10 times. The reduced thermal resistance vertically permits a
substantial quantity of heat required by the lower half of the vessel to be supplied from the
steam space, which is of course maintained at saturation temperature. In addition to providing
a larger surface area for heat exchange purpose in the steam space, the large boar reduces the
turbulence of high condensate flow and encourages the formation of a significant boundary
layer on the inside of vessel well below the water/steam interface, and this layer acts as a
partial thermal insulator. Instead of the mean water column temperature for a half-full gauge
being about 90oC below saturation temperature, as in the visual gauge the hydrastep vessel
exhibits only about 8oC mean drop, which results in a density error of only one-sixth of the
visual gauge.

Basic Principle of the Hydrastep System
The principle upon which the Hydrastep is based is that of the differing electrical resistivities
of water and steam. Accepting for the moment that this difference exists, the vertical
arrangement of electrodes in the vessel, each of which is connected to a separate detector
vessel, each of which is connected to a separate detector circuit, enables the level to be
determined at which the transition occurs between water and steam values.
Each electrode, with its associated portion of the vessel, forms a cell in which the resistance
measured is a function of the contents of the cell. Except at the interface, each cell is filled
either with steam, (high resistance) or with water (low resistance); at the interface for a
continually falling water level (gradually increasing cell resistance) the corresponding
channel of the detector follows the curve shown. As the output voltage reaches about +4.5
VDC, the corresponding logic circuit changes to indicate steam. A small amount of hysteresis
is built in so that in the reverse direction the change back to water occurs at about +3.5 V DC,
to avoid excessive operation due to insignificance level fluctuations.
At the time that the use of a direct electrical measurement was first considered for the
determination of drum level, little was known of the resistivities of water and steam at
elevated temperatures as exhibited in a dynamic system with continuous condensate flow
through a side-arm vessel from the boiler drum. A series of measurements was made,
therefore, using the vessels designed for the field trial equipments, on boiler in the 110 and
183 bar groups. These measurements are presented and show that up to 360oC, the water
resistivty was always less then 10 6ohm.cm and steam resistivity always greater then 5 x 10⁷
ohm.cm (and almost always greater then 108 i.e. a differential of two orders of magnitude
from cold to 360oC ).

Figure 7.10
Other work shows that an adequate differential for Hydrastep exist between the resistivities
of the water and the stream in a side arm–gauge at boiler pressures up to about 216.5 bar
(3140 lb. f / in2, Tsat 372.8oC).
The switching band for the Hydrastep electronic circuits also shows superimposed at
approximately midway between the water and steam resistivities. The anomaly shown at
140– 180oC concerned the related water and steam readings taken during a severe steam
valve leak which resulted in steam entrainment in the vessel water column and water droplets
in the steam space.
To ensure absolute safety to personal the maximum voltage which appears at an electronic
terminal is 10v rms, and its maximum short circuit current is 10 uA, 50 Hz. Each electrode
circuit. therefore meets the requirements for intrinsically safe apparatus with a margin of
safety of five orders of magnitude in respect of current. At 10 uA, the maximum electrode
current is only one-fortieth of the 0.55% human perception current at 50 Hz. The mechanical
design of the electrode is such that its centre be ejected from the vessel in the event of the
failure of the ceramic insulation, and a guard is fitted to deflect any steam jet which may arise
from a faulty electrode or seal.
The potential on each electrode is applied to its own individual discriminator channel to
control an output electromagnetic relay carrying six sets of changeover contacts.

One set of contacts is used for display purpose in the control room of either water or steam,
as appropriate, for each channel or the electronics, each display module being arraigned in the
order corresponding to the disposition of the associated electrodes in the vessel. Two further
sets of contacts on each relay are used in a logic matric to raise an alarm should a fault. Occur
such that any channel is ‘out-of-step’, i.e. that it gives an indication which is physical
impossibility such as “water above steam” or “steam below water”.
The three remaining contact sets are available for high or low level alarm purposes, or for
additional logic configurations to provide validated control signals, alarms and / or
emergency tripping of the generator and its auxiliaries.
Figure 7.11 THERMAL CHARACTERISTICS
Further ‘fail–operative’ safe guards are provided by the connection of alternate channel of
electrodes on any one vessel to electrically separate power supplies, providing an interleaved

system. The loss of one power supply will still allow even a single Hydrastep to operate
within the terms of the Factory Inspectors’ Certificate of Approval, and the instrument can be
repaired with the generator still on load.
Failure characteristics
The appearance of the display under normal conditions is shown in the left hand column of
the drawing. A colour change principle is used for each display module to avoid the
ambiguity possible between a true fault and a burnt out lamp where a simple on–off
arrangement is used.
A power supply failure appears in either column 2 or 3, and the failure of a signal channel as
in the column 4 to 11. In no case of an electronic fault does the indication error exceed one
step. It is simple matter to include an automatic comparison between adjacent steps, on the
premise that water cannot exist about steam in the vessel in sufficient quantity to cause such
an indication (column 4 and 8). This comparison may be performed quit easily by means of
additional contacts on the relays controlling the display lamps. The usual station annunciator
operates when a connection is made between the alarm bus–bars. In the logic
matrix,wherever the water/steam interface may be, all channels above it should show steam
with their contacts in the upper position and all below should show water. If a fault should
indicate water more then one channel above the interface - for example, as shown doted on
channel 11 – the bars are shorted through 8 and 7, causing an alarm. Other logic systems, and
techniques other than relay circuitry could be used, including station computer if spare
capacity is available.
Although electrically separate, the odd and even logic drive circuits are physically adjacent
for ease of inter-connection and are mounted with the power supplies close to the display
unit in the control room.
A design of colour change module using sub-mioiature long-life filament lamps has enabled
a small graphic display to be used, which could be mounted directly into the control console.
Two-Gauge Hydrastep

In the simplest multi-gauge instrument vessel A Carries the odd numbered electrodes and
vessel B the even, when the whole of the electronic system may be identical to that already
described for the single Hydrastep. Separate pipework for the two vessels is essential so that
pressure variations caused by a fault on one vessel will not affect the performance of the
other, and so that either may be shut off independently. Since the water steam interface
within the drum is not a plain surface under operating conditions, the inner ends of the
waterside pipes must terminate at substantially the same point in the drum so that the same
head of drum water is applied to both manometers. This prediction is not required for steam
connection.
It is worth noting that a leak or blockage on either the steam or the water side of a vessel or
its pipe-work will result in a fractional pressure drop in the vessel concerned, the manometer
will then rebalance the vessel showing a higher level than for the non-faulty one. This means
that the faulty half of a two-gauge Hydrastep arrangement may be identified and switched
out, so that the gauge still remains operative using the sound vessel. The only exception to
this condition occurs with a leak of such proportions that water cannot remain in the vessel.
Such a leak would normally have developed comparatively slowly from a minor leak which
should already have been recognised; but in any case, the operation of a low level alarm with
one half of the Hydrastep showing a level within normal tolerance will identify the fault.
Twin Hydrastep
The standard twin Hydarstep gives additional security by the provision of identical Hydrastep
units, A and B operating from both ends of the drum.
Not only does this extra redundancy permit the shut down of a complete end (e.g. to
exchange a faulty electrode or valve packaging), with the generator on load , but under
normal conditions the adjacent arrangements of the two electrically separate displays from
the drum ends gives the operator valuable information concerning end–to-end level variations
either cyclic or static, which can occur under certain plant running conditions

Figure 7.12
Four–gauge Hydrastep (Twin Two–gauge)
All Hydrastep System are self validating by the continuous comparison between adjacent
channels and the “water–above–steam” logic matric alarm, which gives an immediate alert to
the operator should a gauge fault cause a reading error in excess of ±1 step (normally ±50
mm). Considerably higher security can be provided, even against double concident Hydrastep
faults, where a Hydrastep installation is to be used for control purposes, and in particular in
those installation which are required to provide an automatic emergency trip for the complete
generator set, in that event a minimum water level is reached at either end of the drum. It
should be appreciated that on a typical 500MW unit at full load, approximately 14 seconds
are available for shut down to be initiated after the minimum level is reached before internal
pipe work is subjected to damaging conditions. Because of the possible end–to-end level
difference, each drum end must be separately protected and reliance can not be placed upon
cross-validation between Hydrastep at opposite ends of the drum. Further more, because of
the very close timing sequence for the start up of standby feeds pumps or the opening of
alternative feed water valves, it is necessary that a trip must not be initiated before the
minimum level is reached. This is basically an economic consideration: if a trip should be
initiated while the situation could still be saved by the stand by plant, a loss of revenue could
result from the need to use lower efficiency plant to meet demand during the period (i.e. .. the
penalty for an “unwanted action” occurring). On the other hand if a trip is not initiated at the
required minimum level widespread damage could be caused to the boiler, furnace, turbine
and generator (i.e. the penalty for failure of a “wanted action”). It is essential in this
application that the security of the Hydrastep must be maintained and that the ±one step
tolerance must be eliminated even in the presence of the gauge fault, since there is no
permissible deviation from the “wanter” trip level. Such characteristics can be achieved using
a four vessel Hydrastep in which the water side pipe work for both vessels at either drum end
terminate at substantially the same point (about 100 mm apart) within the drum.
Figure 7.13
The relay logic matrix is connected to give a ‘three-out-of–four’ system, that is three out of
four gauges have to indicate a low level before a trip is initiated.
Hydrastep – Display Unit
Instead of a sliding box as in the rest of equipment, the display unit uses a hinged door from
construction, with a removable rear cover. Sufficient clear space around the unit must be left
to allow access. The philosophy of continuous comparison between adjacent channels by the
logic matrix ensures that the indication presented to the operator has been fully verified. The
channels at either end of one vessel (i.e. channels 1 and 12 of both drum and indicators in the
case of the standard Twin Hydrastep) can each be verified on one side only, since channels 0
and 13 do not exist. If, for example, the case of steady falling water level is considered in
conjunction with a fault on channel 1 such that water is permanently indicated, it would
appear to the operator that some water still existed in the gauge although, in fact, the fall in

level had continued past this point. Had a channel 0 existed below channel 1, as the level
continued to fall, a “water above steam” condition would have appeared and the fault on
channel 1 would have been recognised. Without channel 0, therefore, channel 1 cannot be
fully verified and is not presented to the operator since it could be misleading; similarly
channel 12 could be suspect without a channel 13 for verification. To ensure that no
misinterpretation can occur, therefore, only channels 2 to 11 inclusive is displayed in normal
operation, channel 1 and 12 being covered by the hinged outer panel. This outer panel,
however, may be opened by the Instrument Engineer to gain access to the remote test
switches and telephone socket, when the indication from these channels can also be observed.
Because of the level differences between drum ends which can occur in normal operation, it
is impractical in a Twin Hydrastep to cross validate any channel on one vessel and the
corresponding channel on the other, and the restriction in the previous paragraph must apply
to both columns of the duel display. However, in the special case of the four gauge system,
whether or not the automatic tripping facility is connected, cross-validation may be
incorporated at all the available corresponding levels between the two vessels at the same end
of the drum and all indication including the extremes may be then presented to the operator.
Capacitance Methods
A capacitor is a device for storing electrical energy. In its simplest form it consists of two
plates of area, separated by a distance. The air between the plates is called the dielectric.
When a voltage is applied across the plates on electrical charge is stored proportional to the
applied voltage.

Figure 7.14
Capacitance level measurement involves the use of an electrode which extends the full length
of the tank and form a capacitance between itself and earth where earth may be the vessel, the
contents or a concentric cylinder around the electrode, depending on the type of electrode
involved.
A variation of capacitance will occur when the depth of the medium in the vessel alters
therefore the capacitance change will be proportional to level.
By this method the level of liquids, powders or granular solids may be measured.
Conducting Mediums

When the medium is a good conductor of electricity then the system works as a variable area
capacitance transducer. The electrode is one ‘plate’ of the capacitor and is insulated with a
material that is compatible with the medium, the insulation forming the dielectric. The
medium in the vessel from the other ‘plate’ of the capacitor. Thus, as the level changes, the
area of the capacitor ‘plates’ varies. If level falls then area decreases and capacitance
decreases.
Non-Conducting Mediums
When the medium is non-conducting the electrode is not insulated and the system works as a
variable – dielectric capacitance transducer. The dielectric is made up of, say, liquid in the
tank and the air or gas in the space above the liquid thus the electric constants will be
different (normally those of liquids are much greater then gases). As the liquid level varies
then the overall capacitance will change due to change in dielectric. A rise in level ill increase
capacitance and fall in level will decrease capacitance.
7.2.4. ULTRASONIC METHODS
Ultrasonic
Ultrasonic beams are a form of energy transmitted by means of mechanical vibrations and
carried through the transmitting converting one type of energy into mechanical vibrations
which are received by a device which detects the ultrasonic beams converting them into a
more readily usable form of energy. Above a certain frequency (20 kHz) it is known as ultra
sound or ultrasonic sound. For level switching a range between about 36 and 40 kHZ is used.
Ambient noises or their harmonics are ineffectual in this range.
Principle of Operation of the Sensors
When certain materials, mainly nickel, iron and cobalt, are placed within a magnetic field,
their lengths will very by an amount dependent on the strength of the magnetic field.
The fundamental generator is a nickel tube which carries the coil and bias magnet. The
current through the coil either weakens or strengthens the field, depending on the direction of
the current. Application of an alternating current causes the length of the tube to increase and
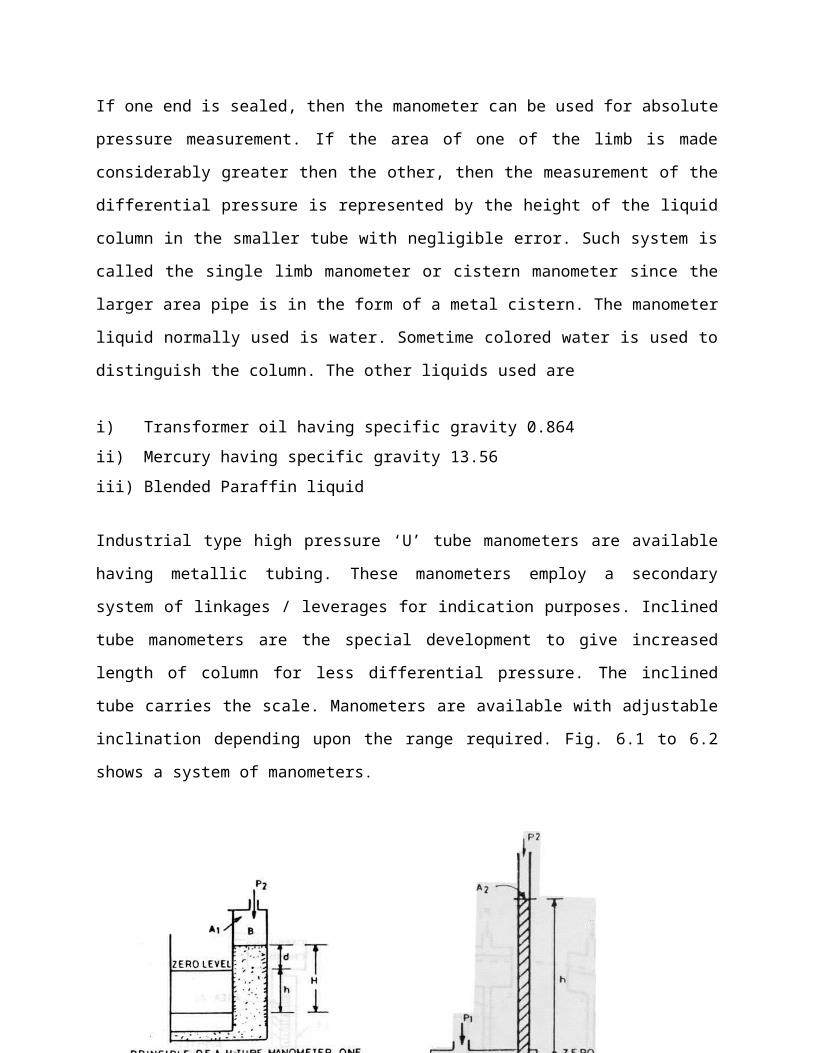
decrease at the supply frequency. owing to the mechanical properties of the tube it will tend
to oscillate longitudinally as a half-wave resonator.
Similarly with the receiver, a sound wave impinging on the diaphragm will cause a relatively
large amount of movement in the nickel tube, if within the band path’s frequency, virtually
non if outside. Changing the length of the tube will cause a change in the magnetic strength
of the bias magnet, thereby generating an e.m.f within the coil. Hence the same cant be used
as either a transmitter or a receiver.
The system is unaffected by dirt, vapour, moisture etc. The sensors are temperature-sensitive;
the resonant frequency falls as the temperature rises but there is no effect if both sensors are
at the same temperature. Very little maintenance is required.
7.2.5 NUCLEONIC METHODS
Nucleonic
Since the advent of nuclear reactors and the ready availability of radioactive materials,
nuclear techniques have been employed for the extension of some of the more conventional
methods of level measurement, as well as the invention of new methods. The special
advantage of nuclear gauges is that they can operate entirely from outside the containing
vessel. They may be designed to provide on/off control at the fixed level in the vessel, or to
provide continuous indication of level over a given range.
The nucleonic type level instruments involve in radioactive source, a radiation detector and
electronic measuring circuits.
DIRECT VEIWING
Sight Glass
The sight glass is a very useful as a simple arrangement whereby a section of the liquid is
brought outside the vessel and displayed alongside a main scale. If the diameter of the bore of
the sight glass is not small enough to introduce errors due to capillary action, the liquid will
stand at the same level in the sight glass and the vessel, provided the top of the sight glass is
subjected to the same pressure as the top of the vessel. It can be used for open or closed
vessels.

The system is analogous to a U-tube manometer where the vessel is one limb and the sight
glass the other limb.
Sight glasses are usually installed with two isolating valves and a blow down valve for
cleaning purposes. The tube material is generally pyrex or armoured glass. Reflex glass is
sometimes used to improve readability, the division between the liquid and gas region being
made very pronounced. Other sight glasses include a float market to improve readability
especially if the meniscus at the liquid/gas interface is obscured by scum or scale.
In high level installation such as boiler drum the gauge is usually fitted with an automatic cut-
off-so that if the sight glasses breaks, the danger of anyone being injured by the contents of
the vessel will be minimized. The cut-off-device usually consists of two ball bearings which
normally hang lose in the connecting pipes, but if the glass breaks the flow of steam and hot
water forces the balls against valve seats so cutting off the escaping flow.
Impurities in the liquid are one of the problems of sight glasses systems as the glasses
becomes discolored and obscures the liquid meniscus.
Regular cleaning of the gauge glass is the common maintenance task. Other problems are
broken glass tubes or leaks and / or blockages at the connections.
The range of sight glasses largely depends on the nature of the liquid, the static pressure and
the temperature involved. Ranges of 0.2 to 2 metres are typical.
If the density of the liquid is constant then sight glasses are simple, accurate devices for level
measurement they can be calibrated by comparison with a dipstick or the addition of a known
volume of liquid.
WATER GAUGE WITH CLOSED CIRCUIT
Television (C.C.T.V.) Remote Display
One of the obvious problems with a simple sight glass system for, say, boiler drum level
measurement is that local indication only is provided. The use of a special type of side glass
(water gauge) with an associated c.c.t.v. system allows level display to be remotely located in
the Control Room as shown in Figure No. 25

Figure 7.15
The gauge is vertical tube of triangular wedge cross-section. Two faces of the three sides are
made up of glass and mica divided up into small compartments. Illumination is projected
through the gauge and the light is bent by the medium. The degree of bent depends on
whether the medium is water or steam. Because of the prismatic arrangement either the
‘water’ windows or ‘steam’ windows are illuminated thus the level of water in the drum can
be determined.
A C.C.T.V. camera is mounted a few feet away from the gauge and is carefully aligned with
the light path through it. The camera and lens system being fully protected against fuel dust
and ash. The C.C.T.V. monitor is located in the Control Room.

This system is more difficult to operate with high steam pressures (120 bars) because the
refractive index of water closely approaches that of steam thus angular deflection of the light
paths is very small making level indication difficult. At pressures of 166 bars it is almost
impossible to accurately determine water level by direct level viewing means.
The problem can be overcome by gauge rear illuminators using quartz iodine lamps and by
using an optical magnifier to enlarge the small differential in the refractive index of the two
mediums.
The main problem with this system are that of faulty alignment, hostile environmental
conditions which affect the reliability of the camera and high degree of technical expertise
required for C.C.T.V. maintenance.
CHAPTER 8 Flow Measurement and Measuring Instruments
8.1 FLOW MEASUREMENT Introduction
Fluid flow in industrial undertakings occur in two general forms: either as a flow in a pipe or
conduit or, in the case of liquids only, as a flow in an open channel. In both cases, the rate of
flow is of primary importance, and, in a large number of plants, the totalized flow over a
specified period is required in addition. The rate of flow measuring instruments will be
examined first.
8.2 Rate Of Flow Measuring Instruments:
This class may be broadly subdivided into:
a. Differential pressure flowmeters
i. Orifice pattern
ii. Venturi and nozzle pattern
iii. Pitot tube pattern
iv. Dall tube pattern

b. Variable area flowmeters
c. Displacement and interfrential flowmeters
d. Electromagnetic flowmeters
e. Ultrasonic flowmeters
8.2.1 Differential pressure flowmeters
A) CONCENTRIC ORIFICE PLATES
A universally used method of making an abrupt change in the cross-sectional area of fluid
stream flowing in a pipe is the concentric orifice plate. This involves a circulate metal plate
with a central hole or orifice centric with the circumstance of the place. It is fixed between
the pipe flanges and is located by the flange bolts. The orifice is then concentric with the
internal bore of the pipe.
It will be convenient before describing particulars to see what occurs when an orifice plate is
inserted in a fluid stream in a pipe, and a liquid flow is considered. Fig. 8.1 illustrates the
action in a simplified manner.
ILLUSTRATING THE VARIATION OF STATIC PRESSURE UPSTREAM AND
DOWNSTREAM OF THE ORIFICE
FIGURE 8.1
Suppose that tubes are inserted through the pipe wall at the position shown in the diagram,
the pipe liquid will rise in these until the pressure due to the column of liquid in each tube is

equal to the static pressure at that position. The column heights are then a measure of the
pressure and from observing the different values we may trace the pattern of the pressure
changes as we proceed along the pipe. At position 1 and 2 there is no pressure change worth
specifying.
At 3 and 4, just before the orifice, we find a slight increase in pressure. The stream is then
constrained to flow through the smaller size of the orifice, from which it issues as a jet. At
position 5 and 6 there are lower pressures then at the up stream position due to the change in
the stream sectional area. Since this is similar the velocity has increased, and the pressure has
fallen. The stream or jet cross section decreases in area after leaving the orifice until it
reaches a point, indicated as 7 in the diagram, where it is a minimum and the velocity a
maximum. This is mainly due to the liquid being directed inwards as it approaches the
orifice, and, through inertia effects, persisting in this direction for a distance after it leaves the
orifice. The static pressure also reaches it minimum value at this position, which is known as
the vena contracts. The distance from the orifice varies with the ratio of orifice diameter to
pipe diameter but an average value be about one half the pipe diameter. From the vena
contracts, the steam station expends until it reaches the pipe diameter at 8. Two facts emerge
from the study of Fig.8.2. one is that the downstream static pressure never recovers its
upstream value. This would appear to be caused by the velocity changes being accompanied
by considerable turbulence with resulting dissipation of energy involving a pressure loss.
Taking a typical value of 0.6 for orifice to pipe diameter ratio, the percentage loss works out
a 65 percent of the differential pressure. Where pressure loss is important this factor should
be borne in mind.
The second point which emerges is that there appears to be a variety of positions at which to
take pressure trappings or connections for obtaining the differential pressure.
The following are the main tapping positions (shown diagrammatically in fig.8.2 and 3
Figure8.2

Figure 8.3
D And D/2 Taps (Radius Or Throat Taps)
The upstream pressure tapping is taken at one pipe diameter D, upstream from the face of the
orifice face, and the downstream pressure tapping is taken at one half pipe diameter, D/2,
downstream from the orifice face, approximately the vena contracta position.
Corner Taps
Corner tapping are taken via holes cut obliquely through a flange or boss on pipe, bringing
the inside openings of the holes adjacent to the orifice positions.
Plate Taps
In this variety connecting holes are actually bored in the orifice plate itself each hole
communicating with one face.
Flange Taps
These are situated 1 inch from the upstream and 1 inch from the downstream face of the
orifice plate, with the tapping bored through the flanges.
Vena Contracta Taps

The upstream tapping is 1 pipe diameter from the upstream face, and the downstream tapping
is determined from the curve relating the required dimension to the radio of orifice to pipe
diameter. These are very similar to the D and D / 2 taps.
Pipe Taps
These may be 2.5 pipe diameter upstream and 8 diameters downstream from upstream face of
the orifice plate.
Carrier Ring
Where it is not desirable to drill or tap actual pipes, bosses, or flanges, a self contained orifice
assembly may be inserted between pipe flanges. It consists of a metal ring holding the orifice
plate, with tapping drilled through the ring to communicate with the upstream and
downstream sides of the orifice. Fig. 8.3 shows diagrammatically a carrier ring assembly.
One advantages of this type is that drillings etc. are carried out at the manufacturers works
and the errors due to site operations are eliminated.
Having established the possibilities of a definite constructive device, for fluid flow
measurement under ideal conditions, we must now examine what modifications are necessary
in practice.
Turbulent Flow
In practically all cases of the flow in pipes for industrial purposes the flow is turbulent, that is
the particles of the fluid do not follow paths parallel to the direction of flow. Some, if not all,
of the particles have a transverse motion as well as longitudinal one and form little eddies or
swirls giving rise to turbulence. Stream line or laminar flow formulae will not apply here
without modification and a new set of equations must be derived.
Discharged Coefficient
Due to friction and velocity distribution, the practical flow figures do not line up with
theoretical ones. Observe that the stream area contracts after leaving the orifice to the vena
contracts position. The cross-sectional area there may only be about 0.6 that of the orifice.
Orifice materialsMaterials used for orifice plates include mild steel, stainless steel, monel, phosphor bronze,
gunmetal, depending on the application. A rough classification would be:

Water metering : Gunmetal, bronze, stainless steel
Air metering : Gunmetal, monel, mild steel
Steam metering : Stainless steel, monel,
Sewage, fuel oils, coal gas : Stainless steel
Venture Tube
We have seen the effect of inserting an orifice plate in a fluid stream, causing a abrupt change
in stream area to produce a differential pressure. The operation can be accompanied by a
fairly high permanent pressure loss, and where pressure loss is important, it is necessary to
turn to other method of producing differential pressures. Let us consider devices with a
gradual change in area. The first of these is the venture tube
Figure 8.4
Constructional Features
To some extent, the construction of the Venturi tube depends on the application. For normal
uses, the section would be of gun-metal, cast iron, or Mechanite, and smoothly machined
liners of gunmetal or stainless steel inserted at the inlet and throat pressure tappings. The use
of gun metal or stainless steel reduces the risk of corrosion. To facilitated construction work a
victualic joint is sometimes inserted in the downstream cone. The extreme end of the cast
section are flanged to match with the pipe flanges, and with the adjacent section, and pressure
tappings are arranged for screw in or flanged connections depending upon the particular
installation condition.
For high pressure hot water flow as in boiler feed water in power station, the design is used,
and the gun metal lining is inserted. The lining is made in three sections: inlet cone, throat,

and outlet cone, profiled as for a standard Venture. This design is suitable for pressures up to
1400 lb/in2. Another pattern has a maximum working pressure of 2000 lb / in =2.
The Venturi tube possesses a big advantage over the orifice is that its section need not be
circular. Square or rectangular shapes have been used for measuring large volumes of fluid
flow. The non circular section lends itself to constructional materials other than metal, and
concrete has even been used for one or two very large flows. Note that the design renders the
tube useful for fluids containing suspended matter because of its gradual area changes.
Nozzles
The nozzles falls between the venturi tube and the orifice plate as a means of flow
measurement. Its approximates to a venturi tube with the curved form of approach, giving a
gradual change of sectional area and has the same order of discharge Coefficient. But the
absence of a downstream expansion core brings the pressure loss in to the same region as that
for an orifice plate. It is cheaper than a venturi tube, and at high velocity flow it is use in
place of an orifice plate may be necessary. See Figure 8.5
Figure 8.5
C)PITOT TUBE
Let us study the effect of placing a blunt object in a fluid stream as an obstruction to the flow
(Fig. 8.7). As the fluid approaches the object, the velocity will decrease until it reaches zero

at the point where it impinges on it. From the previous, a declaration should mean an increase
in pressure. This would follow from Bernouilli’s Theorem.
It is very convenient to be able to measure the static pressure in the close neighborhood of the
tube and standard Pitot tubes. Both designs consist basically of inner and outer tubes. The
inner one leads from the impact hole to one construction of the differential measuring
instrument. The outer tube, referred to, sometime, as the static tube, has a series of holes
bored into it so that its interior connects to the out side surface to be in contact with the static
pressure. This tube is joined to the second connecting of the measuring instrument.
The pitiot tube can only measure velocity at one position in the cross-section of a pipe. Now a
velocity of a fluid in a pipe, taken across the section, is not uniform, varying from zero at the
pipe surface to a maximum at some point (not necessarily the centre) along the diameter. To
find the mean velocity it is necessary to make a traverse of the pipe with the tube, taking the
differential pressure at certain specified positions. An ideal distribution curve is shown in fig.
8.7. For Reynolds numbers above 100 000, the ratio of average velocity to velocity at the
centre of the pipe is frequently specified as 0.82 or 0.83. Whereas this value would apply for
ideal cases for as curve of the type in Fig. 8.7, the actual curve may be different. The
desirability of carrying out a traverse, therefore, is obvious. Once having determined the ratio
value, the Pitot tube may be placed at the pipe centre and the instrument calibrated in terms of
average velocity.
Another theoretically possible means of determining the average velocity is to select a
position where the velocity corresponds to the average value. This has some practical
drawbacks. The location may be near the wall of the pipe a very approximate value being
0.25 of the radius in form the wall. It could be at a point where the velocity curve slope is
fairly steep and any misplacement could lead to significant errors in velocity determination.
At the centre of the pipe, by comparison, the curve is normally flatter and errors in location
are not so serious.
Figure 8.6
Figure 8.7
Two other types of Pitiot tube deserve mention. One is the double, tip pattern shown in
Fig.8.7. in which there are two holes, one facing upstream and the other downstream, the
former measuring the impact head and the latter the section head. The differential pressure
obtained is greater than with the standard types, but is not double the value. Actually, the
increase is between 35 per cent and 40 per cent depending on the position of the tube in the
pipe. The other type is the Pitot-Ventury. It is a combination of two concentric venturi tubes,
the out let cone of the inner one terminating in the throat of the outer. The throat pressure of
the inner tube and the impact pressure on an impact hole in the supporting tube give 7–10
times the differential produced with the normal types under the same conditions.
D) DALL TUBE
The principle features of the Dall Tube are indicated in Fig. 8.8. It involves two truncated
cones separated by a narrow throat. The throat length is between 0.3d and 0.1d where d is the
throat diameter. The inlet cone has an included angle between 40o and 50o, the out let cone
between 12o and 17o. The mouth diameter Dm, the inlet pipe diameter D and throat diameter
d are connected by the following relation

Dm4 – d4 = K (D4 – d4 )
Where K = 0.5 to 0.75
Observe the diameter of the inlet cone is less then that of the pipe, resulting in a sharp step.
This creates an impact pressure which is additional to the static pressure existing at the step.
The high or upstream connection is made just in front of the step. The other connection is
made at the throat where the relativity abrupt change in area results in a marked static
pressure depression. The original patent specification No. 689, 474 claims a pressure loss
expressed as 5% or 6% of the differential pressure. This compares with a loss of between 2
and 3 times this value with a normal venturi tube. In addition, the Dall tube has the advantage
of being considerably shorter than the normal venturi.
GLASS TYPE
The basic feature of this type of meter is the conical section glass tube. For accuracy, the
diameter of this must be maintained at very close limits. Clear borosilicate glass is used
which is highly resistant to thermal shock and chemical action, and the method of its
manufacture enables tolerances of I/10 000 of an inch to be observed. The use of glass
introduces the question of a safe working pressure for the fluid being measured. At present
this is about 500 lb/in2 and applies to the smaller diameter tubes. For larger sizes the safe
working pressure falls from this figure. (The normal diameters range from 2 mm to 60 mm
depending on the flow to be measured.) The tube is normally clamped in a metal frame, the
inlet and outlet being sealed into connections as required, e.g. flanged or screwed. Where
danger may occur from flying glass resulting from a fractured of the tube, “Armour Plate”
glass protection windows encase the instrument.
Figure 8.8
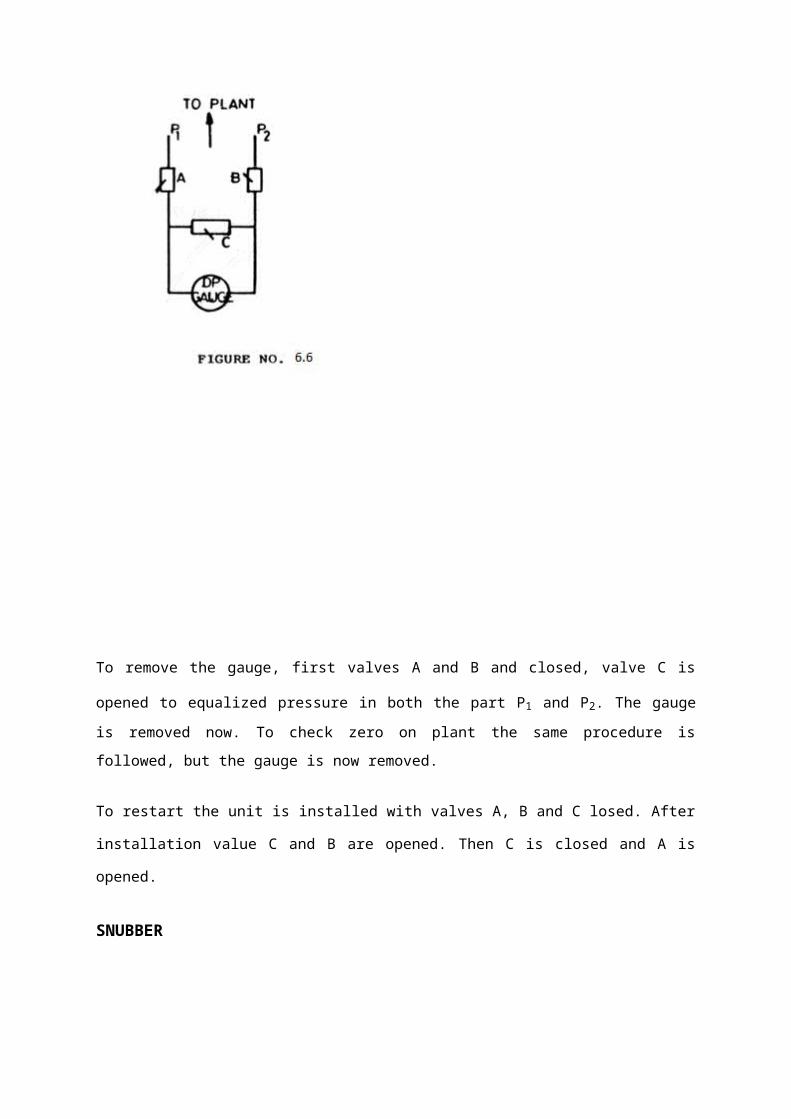
The standard float shape is indicated in Fig. 8.8, and is perfectly free. Viscosity immune
floats, however, may demand a guide, as the float disturbe the equilibrium of the liquid. In
one pattern, the guide is a central rod around which the float is made to rotate, so that visual
evidence that the float is moving freely is obtained.
The glass tube type measures from 2 cc/min up to 3000 liters/min of gas, and 0.5 cc to 225
liters/min of liquid.
The pressure drop will depend on the type of float being used and the nature of the fluid, but
varies between about 0.2 cm (0.078 in) w.g. for small gas flows and 3.5 cm (1.38 in) w.g. for
liquid flows.
METAL TUBE TYPESFor larger flows than the glass type tubes can accommodate, a conical metal tube pattern is
introduced. Here, the metal body is of gun metal, cast iron or stainless steel with a stainless
steel float. The latter is carried on a rod which moves between two guides, one at the lower
end and the other at the upper end of the tube. The guide rod passes through the upper part of
the tube in to a compartment with a glass scale, the end of the rod acting as an indicator (Fig.
8.9). This type of meter has typically ranges from 250 to I 20 000 liters/min of gas flow and
20 to 7000 liters/min of liquid. The maximum fluid working pressure is 500 lb/in2. When
used with opaque liquids, a compressed air supply may be connected to the top of the scale
unit and the level of liquid depressed, so that a clear view of the indicator is obtained. Opaque
liquids may also be metered by the high pressure version.
Fig 8.9
8.2.2 ELECTROMAGNATIC FLOWMETERS

The principle of the electro magnetic flow meter may be understood better if we first consider
a very thin disc of an electrically conducting liquid moving with a velocity V along a pipe of
internal diameter d. An external magnet system directs a magnetic field of strength H across
the section of the pipe so that it acts at right angles to the direction of motion of the disc.
Now, by Faraday’s Law of indication, when an electrical conductor of length L moves
through a magnetic field of strength H at a velocity V in a direction at right angles both to the
magnetic field and its length, an e.m.f. is generated of value.
E=K H L V ……… (I)
WHERE K = a constant
Our disc liquid is a conductor obeying the general requirements of Faraday’s Law, and it can
be seen without much difficulty that L in equation (I) is replaced by d, the diameter of the
disc. If, now, there is an indefinite number of such moving disc continuous to one another, we
have the equivalent of a conducting liquid stream flowing continuously through the pipe
The stream will satisfy the following equation
E = K H V d ….(ii)
In (II) d is constant and if H remains constant
E = K V ….(III)
Where K = a general constant
Alternatively, since Q = V A where A is the area of the pipe,
E = C Q . . . . . . . . (IV) C being a general constant
Figure 8.10

ADVANTAGES OF THE ELETROMAGNETIC FLOWMETERS
1. Linear relation between flow rate and measuring signal as compared with the square
law relation of differential pressure devices. This results in a range ability of the order of
100/1.
2. The measuring instrument can be arranged with a centre zero for measuring flow in
either direction. Alternatively the electrode leads may be changed over to measure a reverse
flow.
3. The only pressure loss is that due to the length of tube, forming the meter. But a
pressure loss would be present with the same length of ordinary pipe so that the introduction
of the meter cannot be said to involve significant additional pressure losses.
4. There is no obstruction to flow which renders the meter suitable for liquids containing
suspended matter. Abrasion may be avoided by choosing a suitable lining material. Wood
pulp and paper mill stocks, cement slurries, sewage, food pulp are but a few difficult fluids
which may be metered.
5. The design lends itself to the metering of corrosive liquids since parts on contact with
the fluids may be made of corrosion-proof materials.
6. It is not affected by velocity profiles, since the e.m.f. is at all points proportional to the
velocity of flow across the diameter.
DISADVANTAGES OF THE ELCROMAGNETIC FLOWMETER
1. It is not suitable for measuring gas or vapour flows.
2. The normal design is not suitable for hazardous areas
3. Liquids to be metered must be conductors of electricity.
4. There is minimum value of conductivity which is related to the lengths of the cable
leads to amplifiers and the size of the meter. The readings are unaffected by increases
in conductivity above the minimum value, but decreases cause the meter to read flow.
5. If concentric build up of deposit of much different conductivity to that of the liquid
takes place, significant errors may be introduced. Values will be found in the paper by
B.W. Balls and K.J. Brown. Note that it is possible for non conductive deposits to
insulate the electrodes. Where the concentric deposit is of the same conductivity as
the metered liquid the meter continuous to read correctly.
A meter has been constructed of 1/10 in. diameter with a flow range 0.002 to 0.2
gal/min. In contrast, a typical large diameter meter has been 42 in. covering a range
500 to 50,000 gal/min.

8.2.3. ULTRASONIC FLOWMETER
1. Consider Fig. 35 in which a fluid is flowing at a velocity V a transducer T1
transmits a beam of sound to receiving transducer T2 situated at a distance d
downstream. If C is the speed of sound through still fluid, t the time for sound to
travel from T1 to T2 is
d
t = ----------- ………. (I)
C+V
with no flow,to = d / c ………… (II)
The difference between t and to, t, is given by
Vd
t = ………….. …………. (III)
C (C + V)
C for most fluids is of the order of 1500 meters/sec. whilst V for most industrial application
would be a few metres/ sec equation (III) then reduce to
Vd
t = …………. ………….. (IV) C2

Figure 8.11
1. This suggest that t could provide a measurement of V. But it involves a knowledge of to,
not readily measurable, and C, which varies with temperature and pressure. To
eliminate to, the differential arrangement shown in Fig.8.11 may be used.
Two sets of transducers, T1 and T2 and T3 and T4, are installed in the pipe, the distance
between T1 and T2 and T3 and T4 being d. A beam of sound is transmitted from T1 to T2
downstream and from T3 to T4 upstream, both being of the same frequency. The time for the
beam to travel from T1 to T2 is

dt1 = --------------- . . . . . . . . (V)
C + VWhere C = the velocity of sound under the temperature and pressure conditions existing
in the pipe, and from T3 to T4.
dt2 = ------------- . . . . . . . . (VI)
C – V
The difference between t1 and t2 is
2 Vd
t1 = t2 = t = -------------------- . . . . . . . .(VII)
C2 – V2
If (V) is small compared with C; (VII) can be reduced to
2 V d
t = ----------------------- . . . . . . . .(VIII)
C2
3. The measurement of t now involves some problems. It may be solved by pulse
techniques or a continuous wave beam may be used. In the latter case, the transmitting
transducers are driven from a common source and the phase difference between the
two received signals measured. The phase difference Ø is given by
2 wvdØ = ---------------- . . . . . . . . (IX)
C2Where W = the angular frequency.
4. Observe that it all the methods considered, C the velocity of sound is present. This can
be eliminated if the methods of Fig. 35 is adopted. A short pulse is emitted from
transducer T1 and is received by T2. The arrival of the pulse from T2 triggers another
one
from T1. The time between pulses is
dt1 = --------------- . . . . . . . . (X)
C + V
The pulse repetition frequency is f1 and since f1 = I / t1
C + V f1 = ------------- . . . . . . . . (XI)
d

A similar pulse is transmitted from T3 to T4 and calling the repetition frequency here f2,
C - Vf2 = -------------- . . . . . . . . (XII)
d
f1 – f2 = f = 2 V / d . . . . . . . .(XIII)
Equation (XIII) is independent of C.
5. A further techniques used has been a differential arrangement across the pipe. It can
be shown that a beam of sound can be deflected in the downstream direction in the
traversing a pipe from one to the other. The deflection x is approximately
given by x = V d / C . . . . . . . . (XIV)
Which of the methods outlines is most suitable for industrial applications?
There are several factors to consider.
1. In the phase difference method the phase difference is given by
Ø = 2 WVd / C . . . . . . . . (XV)
Ø is proportional to the operating frequency W and is suggests that W should
be as high as possible.
Measurements of Ø above 2 n are not desirable, from the point of view of
interpretation, but Ø should be as large as possible below this limit. But the
higher frequency the greater the attenuation since it is a function of the square
of the frequency. Thus, already we have two conflicting factors. There is yet a
third effect: that of the beam width. This is a function of the velocity of sound
in the liquid, the radiating area of the transducer and the operating frequency.
There may have to be a compromise between all the factors involved.
In the frequency difference method, care must be taken to avoid coupling between
neighboring circuits carrying frequencies relatively close to one another

The frequency difference f is dependent on the flow rate V and may be of extremely
low value, e.g. 10 c/s or 20 c/s unless the flow rate is relatively high.
3. The beam deflection method suffers from the fact that the deflection is proportional to
flow rate and at low flow rates, may not be sufficient for accurate measurement.
CHAPTER 9 Temperature Measurement and Measuring Instruments
Several methods are available to measure the temperature. Appropriate method is to be
selected for any particular measurement. The selection of the type of measurements is based
on the following consideration.
i) The accuracy required
ii) The range of temperature
iii) The corrosive action of the process media on the sensing element
iv) The catalytic phenomena of the sensing element on measuring media.
v) The layout conditions and restrictions
vi) Facilities available for the calibration of the instrument
THEORY OF TEMPERATURE MEASUREMENT
Temperature rise in a substance is due to the resultant increase in modular activity of the
substance on application of heat which increases the internal energy of the material.
Therefore there exist some observable properties of the substance which change with its
energy content. The temperature measurement is based on this very fact. The changes may be
observed in the substance which itself or in a subsidiary system in thermodynamic
equilibrium with it, and it is called the testing body while the system itself is called the hot
body.
THERMAL EXPANSION OF TESTING BODIES
On application of heat, testing bodies either in the form of solids liquids or gases expand
almost proportional to the rise of temperature and this principle is utilized in various
thermometers.

EXPANSION OF SOLIDS
The expansion of solids is utilized by means of bimetallic strip to measure temperatures. Two
or more layers of metallic alloys having different co-efficients of thermal expansions are
coiled in the form of (a) spiral (b) helical or (c) multiple helical depending upon the range
temperature. One end of the coil is fixed on to the bulb to be used as a test body and the other
and free to move carrying the pointer over a scale calibrated in degrees.
A simple bimetallic strip composed of a layer of brass (high expanding material) and a layer
of invar (low expanding material) will deflect when subjected to a change of temperature and
if the strip is coiled its angular motion will be given by CTL/t where C=length of strip in
CMS and t=thickness in CMs Fig .36 shows the typical bimetallic gauge
Figure 9.1

Figure 9.2 PRINCIPAL TYPES OF ELEMENTS USED IN BIMETAL THERMOMETERS
(A) FLAT SPIRAL (B) SINGLE HELIX (C) MULTIPLE HELIX
EXPANSION OF LIQUIDS
Changes in volume of a liquid by the application of heat enclosed in a test body is utilised to
measure the quantity of temperature. The liquids normally used are, mercury and hydro-
carbons such as ethylalcohol, for low temperature, metaxylene for medium range
temperature, tetrahydro naphthalene (tetralene) for higher temperature
Figure 9.3
The test bodies (bulb) are either glass or of steel material.
The liquid filled system, consists of an element sensitive to temperature change (i.e. bulb), an
element sensitive to volume change (bourden, bellow of diaphragm), means of connecting
these two and a device for measuring and indicating.
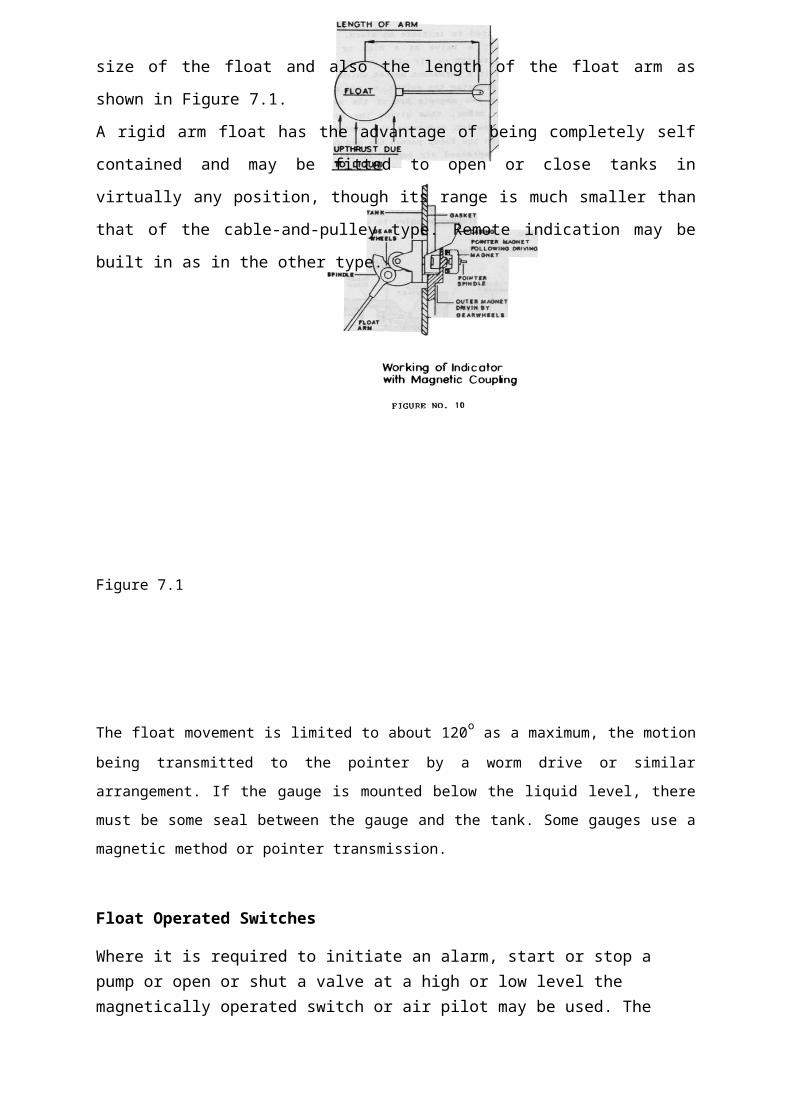
The liquids filled in a bulb from which a capillary is drawn which ends in a bourden or
bellow or a diaphragm. The entire system is filled completely with the liquid at 0o C at high
pressure of the order of 1000 PSI. When the temperature rises, the volume of the liquid
increases thereby tending to enlarge the enclosure. As a result a mechanical motion is
achieved which is transmitted to the dial indication by lever arrangement or rack and pinion
arrangement. Instead of capillary connection, a short solid stem is also used. There is also a
possibility that the metal enclosed (bulb & capillary) also may increase in volume due to
thermal expension which will add to the error of the system. To remove this error, a
compensation means is provided.
COMPENSATING LINK
This method used two metals with different co-efficients of expansions. Instead in the
capillary as a link-chamber. The chamber contains a core of Invar having negligible co-
efficient of expansion. The wall of the chamber is made of the steel material. The space
between the core and the wall is filled with the system liquid. If the size of the chamber and
volume of the Invar material are carefully proportioned, then on any change in ambient
temperature, the volume of the angular space, due to the expansion of the outer wall is
sufficient to accommodate any variation in volume of the liquid in the capillary and so
prevent it exerting an effect on the bourdon tube.
DOUBLE CAPILLARY
The second method used a second capillary of the same diameter as the first one filled
with the same liquid under the same condition. This second capillary and is sealed off without
the bulb and run along the first capillary and connected to a second bourdon. This bourdon is
made to act on the instrument points in an opposite sense to that of the main bourdon.
Since both capillaries and bourdon tubes are subjected to the same conditions it can be seen
that the ambient temperature effect in the main system is counteracted by that of the second
system.
Bulb Design

All manufacturers keep the change of bourdon volume for all ranges in their production a
constant for commercial reasons. This leads to varying bulb sizes for various ranges.
Therefore for higher range smaller bulb volume is required.
EXPANSION OF GASES
Here the changes in pressure of the gases filled in test bodies (bulbs) of constant volume on
changes of temperature is utilised as means of measurement of the temperature. The gas used
normally is nitrogen. The system works on the gas law PV= RT. Therefore the pressure of the
gas is proportional to the temperature. The bulb is evacuated and filled by the gas at a
required pressure and then the system is sealed. Rest of the system is the same as the liquid
filled system and here the bourdon becomes sensitive to pressure changes.
EXPANSION OF VAPOUR
This works on the basic principle that all enclosed liquids at a given temperature will create a
definite vapour pressure if the liquid is only partially filled. This vapour pressure will
increase with temperature and this property is utilized in measurement.
The advantages of the filled system are:
I. Simple and self contained system.
II. Sensitity, response time and accuracy are comparable with other methods, of
temperature measurements.
III. No auxiliary power needed for the operation of these instruments.
The system has the following shortcoming too :
I. Limited up to certain temperature say upto 500o C.
II. Bulb size is too large to be accommodated in similar space for example to measure
the bearing temperature winding temperature etc.
III. In case of failure the entire system are to be changed.
IV. Remote indication and other telemetering are impracticable.

THERMO ELECTRICITY
Thermocouples
Thermocouple consists of two wires of suitable materials which are joined together at the end
by twisting together and then joining the tipe by brazing or welding. The wires selected
should have the following characteristics.
i. They must physically withstand the temperature for which they are selected, rapid
changes in temperature and the effect of corrosive atmospheres.
ii. Their composition should not change at this temperature range.
iii. They should posses reasonably liner temperature e.m.f relation ships throughout the
range.
iv. They should develop an e.m.f per degree change of temperature that is detectable with
standard measuring equipment.
v. They should not change its characteristics by physical fatigue caused by some
materials.
Very few combination of wires are developed so far satisfying the above conditions.
They are:
a. Iron-Constant Type J range up to 760 o C
Composition of constantan (equivalent to that of copel) Cu. 56-57% Ni 43-44%
constantan has got bright appearance and non-magnetic.
b. Chromel Alumel
Type K range upto 1260 o C composition:
Chromel : Ni; 89% Cr. 9.8% Fe 1% Cobalt 0.2% Dull appearance, non-magnetic
Alumel : Ni 94.5% Al 2% s 1.0%., Mn 2.5%
Glossy surface and slightly magnetic.
c. Copper Constantan
Type T range - 180 o C to +370 o C
d. Chromel Copel
Type E range 0-870 o C
e. Platanium –R Hodium – Platinum
Range 0-1480 o C with 10% Rhodium type S and with 13% Rhodium type R.

Selection of Thermocouple Wire Size And Length
Though there is no general rule for the selection of wire size but, it is suggested to select a
smaller gauge wire where sensitivity is desired and heavier size wire is preferred for longer
life and higher temperature applications.
The length also should be sufficient to minimize the effect of condition. Insufficient
insertion causes low readings. Though there is no rule for length a conventional method is
devised that the length should be 4 times outer dia or protectingtube.
Protecting Tube
Maximum accuracy and sensitivity are obtained if we use bare THERMOCOUPLE wires.
But the possibilities of corrosive action and mechanical injuries call for a protecting tube
thermocouple both metallic and ceramic tubes are used.
Extension Wire
Since it becomes extremely costly to take the thermocouple wires up to the measuring
instrument located at far of places some substitute wires are used to connect the
thermocouples to the instruments. These wires posses the same characteristics as that of
thermocouple wires but up to a lesser temperature. These wires are termed as compensating
leads.
Also ordinary copper wires are used as extension wires after compensating the e.f.m. at the
thermocouple terminals, the difference in temperature of the terminals and the cold junction
using a bridge circuit utilizing the law of intermediate temperatures.
Cold junction compensation circuit is a wheat stone bridge consisting of three arms with
constant resistance of mangan due to the temperature changes and the fourth arm with copper
wire wound resistance which is sensitive to temperature. This bridge is supplied with 4 volt
D.C and is balanced at the temperature of reference junction (say at 27 oC) when the
temperature change unbalance occurs due to change in resistance copper wire across diagonal
which adds or substracts the thermocouple e.m.f. accordingly. Other method of providing
cold junction compensation are by means of constant temperature oven or ice box in which
the reference junctions are kept inside a constant temperature oven.

Resistance Thermometers
The material selected for resistance thermometers should have the following properties:
i) Stable temperature-resistance relationship.
ii) The specific resistance should be within the limit for easy construction.
iii) Little change in the resistance due to non- temperature methods such as strains etc.
IV) Change in resistance w.r.t temperature should be large.
v) Commercially available with consistent quality.
Three resistance thermometers are available having above properties. They are Nickle,
Copper and Platinum.
Figure 9.4
NICKEL RESISTANCE THERMOMETERS
Its characteristics are not linen throughout the range but is frequently used to its specific
resistance and less cost specific resistance 6.38 micro-cm., Temperature Co-efficient .0066
ohm/ohm (oC)
Copper Resistance Thermometers
It has got a linear characteristics; specific resistance of copper is very less of the order of 1.56
micro ohm-cm. Temperature co-efficient 53 ohm.
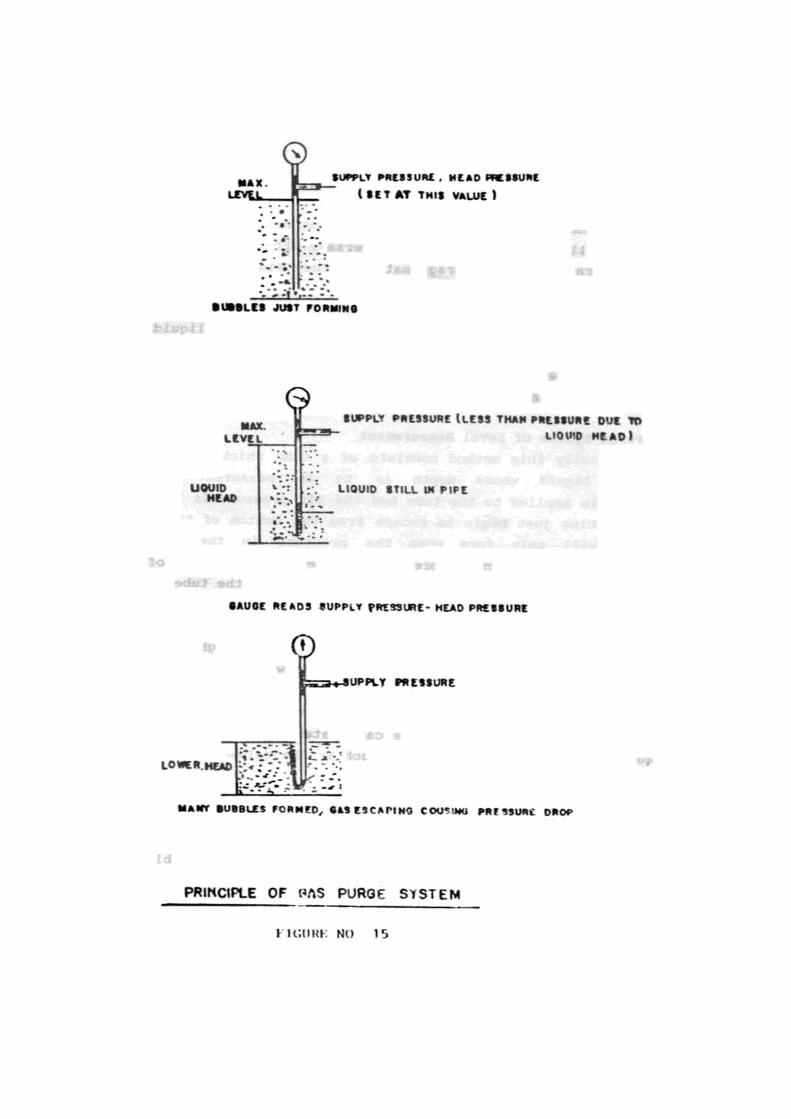
Platinum Resistance
Through costly platinum is more suitable than either copper or nickel. It’s usage is restricted
to jobs that cannot be properly handled by the other two types of thermometers.
Specific resistance 9.38 microohm-cmTemperature co-efficient 0.00385 ohm/ohm oC
Construction Details
The different types of wires are employed in different way depending upon the ranges and the
measuring media normally wire size 0.05 top 0.07 mm dia is used.
i. Platinum wire element wound on mica strip and protected by the mica strip.
ii. Coiled wires mounted on ceramic mendrals and casted in ceramic.
iii. Copper or Nickel element wound on an ebonite plate or on mental mendral.
iv. The coiled element wound on a mica cross.
The sensing elements wound as above are provided with porcelain beads, and inserted inside
a protecting sheath and the terminals brought to the porcelain blocks. The sheath is provided
with a head and cover where the block is kept.
Measuring Circuits
The change in resistance of the temperature sensitive resistance element can be measured by:
i. Cross coil indicators (CI) called ratiometer.
ii. Wheat stone bridge
a. Null balance method,
b. Deflection galvanometer type.
Ratiometer
The ratiometer consists of two crossed moving coiled placed in the field of permanency
magnet at an angle of 20oC approximately and connected detector of a wheat stone bridge
with the resistance thermometer constructing its own arm.
The current flowing through the crossed coils create deflecting and restoring moments. The
change in resistance of thermometer with temperature causes change in current through the

crossed coil producing deflecting moment to the pointers in such a way that the deflection is a
function of ratio of the two currents and measures the temperature on the scale.
To lead in and out the currents through the coils and to bring the pointer to zero in off conditions
– two hair springs are connected. See Fig.9.5.
Figure 9.5Wheat Stonebridge
a. Null Balance Method:
In the null balance instruments, the unbalance voltage across the bridge which is proportional
to the change in resistance, is fed to a phase sensitive amplifier and after amplification feeds
to the control winding of the servomotor which operates and adjust the slider to balance the
bridge.
At balance the pointer coupled to the servomotor indicate the temperature value
Figure 9.6

b. Deflection Galvanometer Types
Here the unbalance is directly fed to galvanometer whose deflection is proportional to the
change of temperature and calibrated in terms of temperature.
Compensation for Lead Wire Resistance
Since the resistance element is generally far away from the secondary instrument, the
resistance of the lead wire also will be included alongwith the element resistance to the arm.
Since the lead wire will be of copper which has high temperature co-efficient, it will cause an
appreciable error in the readings. In order to eliminate the error, 3 wire or 4 wire systems are
employed which include the lead wire resistance in the opposite arms and thus cancels the
effects.
Advantage of Resistance Thermometers Over Thermocouples
i. Thermocouples requires that the reverence junctions temperature should be
maintained constant or a suitable compensation is to be applied. It is very difficult to
applied. It is very difficult to maintain the reference junction temperature constant
since it is in the instruments which has many heat dissipation. Also compensation
cannot be practically provided perfectly. But in resistance thermometer the
measurement of temperature is absolute measurement, and no reference is required.
ii. Resistance thermometer have greater sensitivity because the change of resistance per
oC is much larger hence is more easily measured than the microscopic change of
voltage per oC in thermocouples
Disadvantages
Thermistors are semi conductor material having resistance values which vary by a ratio of
10,000,000 from - 100oC to +450oC. thermistors due to their thermoresistive characteristics,
stability, and high sensitivity have become more versatile tool for temperature measurement.
Their temperature co-efficient varies from 1 to 5 per oC the semi-conducting materials of
which the thermistors made are metal oxides and their mixtures like oxides of cobalt copper,
iron etc.

Optical Pyrometer
The radiant energy is measured by photometric comparison of the relative brightness of the
object of unknown temperature with a source of standard brightness such as the tungsten
filament of an electric lamp.
Radiation Pyrometer
The radiation from the target a portion of the object whose temperature is being measured is
focussed by lens arrangement on thermopile (a number of small thermocouples connected in
series). This thermopile generates an e.m.f proportional to them amount of energy falling
upon. This e.m.f fed to a millivolmeter or poteniometer which indicates the temperature.
The radiation pyrometer is ideally suited for:
i) When very high temperature are involved, temperature beyond the practical beyond
the practical range for thermocouple measurement.
ii) Where furnace atmosphere is detrimental to thermocouples and cause erratic
measurement and short life.
iii) Where for other reasons, it is impractical to contact the material whose temperature is
to be measured.
CHANGE OF STATE OF TESTING BODIES
For pure chemical element or compounds change of state viz from solid to liquid to gaseous
etc. takes placed at a fixed temperature and this property thus gives a method to measure the
temperature.
Fusion Method
Fusion of different metals takes place at different temperature. Pyrometric comes are made
for different temperature and ar placed inside the furnace which will indicate the temperature
when the rated fusion temperature is attained.
Vapourisation Method
Vapourisation temperature of different volatile liquid are different. This property is utilised to
measure the temperature.
CHAPTER 10 PNEUMATIC INSTRUMENTS
10.1 INTRODUCTION
Pneumatic instrument systems were the main method of controlling and monitoring industrial
plant. Electrical instrument systems, with fast response times and ease of installation, have
already overtaken pneumatic systems and are now used for most applications previously
considered to be the duty of their pneumatic counterpart.
The slow response and costly installation problems of a pneumatic system are, however,
accepted when the prevailing conditions make electrical systems unacceptable.
Pneumatic instruments also find service in the smaller one off control system, where
transmission lags are small due to the size of the loop
FLAPPER/NOZZLE
Pneumatic instruments relay on the accurate conversion of mechanical movement to a
proportional pneumatic signal. In most cases this conversion is achieved with the use of a
transducer known as flapper/nozzle.
Air is supplied at a pressure of 1.5 bar. Due to the fact that the nozzle orifice is three times
larger than that the restrictor orifice air can, in fact, exhaust faster than it can pass through the
restrictor. This will result in gauge reading zero
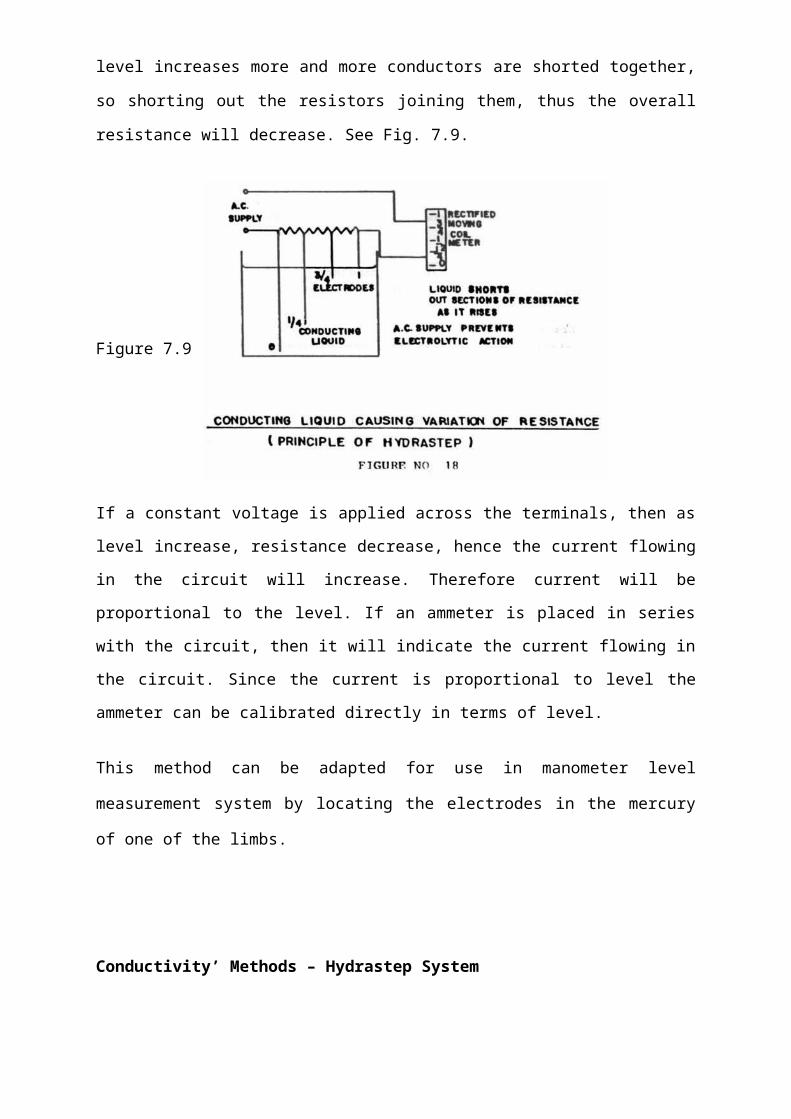
Figure 10.1
If the flapper is now positioned so as to seal off the nozzle, the pressure will build up to the
supply pressure and be indicated on the gauge. In actual practice the flapper would be
connected through some form of linkage to the measuring element and it would be the
movement of the measuring element that moved the flapper. It follows that movement of the
measuring element changes the flapper relative to the nozzle and will, therefore, change the
air output pressure in a similar manner to that shown in the graph.
The flapper movement required to change the output from maximum to minimum is very
small, the actual movement/pressure change ratio will depend upon nozzle and restrictor sizes
but is usually about 0.02 mm.
Provided the flapper nozzle output is restricted to the straight line portion of the graph we can
say that output will be proportionately to measuring element movement.
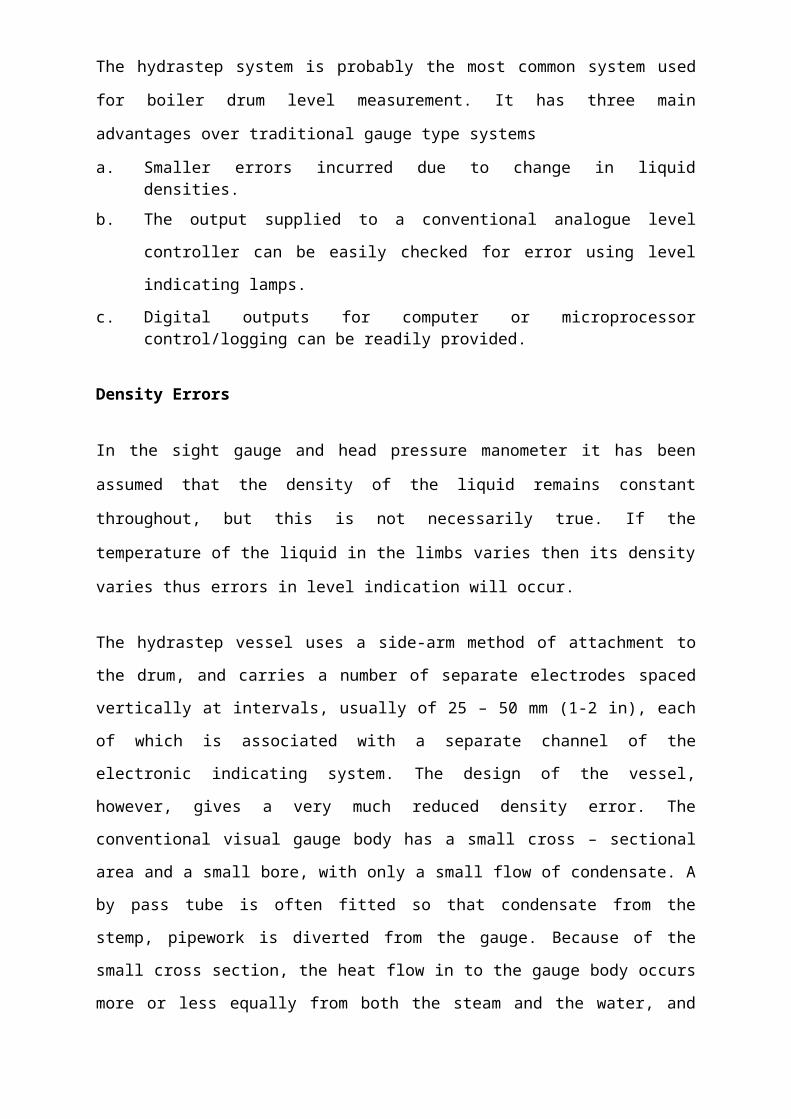
While in principle the single flapper/nozzle is an effective transducer it does have some
serious drawbacks, for instance any change in supply pressure would affect the output
pressure and also since the amount of flapper movement is so small even the slightest amount
of wear on pivots or linkages would render the system useless. The difficulties may be
overcome by the use of negative feedback bellows. The feedback can be used to oppose the
measuring element force (force balance) or it can be used to change the position of the
flapper relative to the nozzle (position balance).
POSITION BALANCE – PRINCIPLE
The flapper now flat and can be moved by the feedback bellows are well as the measuring
element. Assume the measuring element moves the flapper towards the nozzle, the output
pressure will increase and the feedback bellows will expand. The upper end of the flapper
will, therefore, be moved away from the nozzle and the effective movement of the flapper
about the nozzle is reduced. This increases the amount of measuring element movement
needed to give the complete range of output pressure and gives a proportional relationship
between measuring element movement and the corresponding output pressure. Small changes
in supply pressure will not effect the output. If the measuring element is in the position where
the out put pressure should be 0.6 bar for example, and the air supply suddenly increased, the
output pressure would tend to increase, but the increase in pressure would expands the
bellows, pushing the flapper away from the nozzle until 0.6 bar is again obtained. This
technique is used extensively in pneumatic proportional control. As shown Fig. 10.2
Figure 10.2

FORCE BALANCE PRINCIPLE
The force balance principle also uses negative feedback but not, as in the position balance, to
move the flapper. The force created by the feedback bellows is used to oppose the force of
the measuring element. Consider a change in the measured variable that causes the flapper to
move closer to nozzle, this would result in an increased output. The increase in output would
also cause the feedback bellows to expand until the force created by it balances the force of
the measuring element, when at such time there will be no further increase in pressure and
hence no further increase in output. See Fig. 10.3
Figure 10.3
When the movement of the measuring element cause the flapper to move away from the
nozzle the drop in pressure cause the feedback bellows to reduce the force in opposition to
the measuring element force, until equilibrium is again established.

RELAY VALVES OR AMPLIFIERS (BOOSTER RELAYS)
All flapper and nozzle systems are usually operated together with a relay valve, this is
intended to reduce any lag or sensitivity which the introduction of the feedback bellows may
produce, and it is also necessary where a large volume of air is involved in connecting
pipework to the secondary element.
If the nozzle alone carries out the transmitting operation, all the air supply must come from it
and the inflation and deflation of the various volumes (receiving elements and pipe works)
may take some time, causing delay in the signal, getting to the receiver, therefore, again
creating a loss of sensitivity.
A relay valve is, therefore, used to improve the response factor and it is also a pneumatic
amplifier of volume as well as sometimes a pressure amplifier i.e. the variation in output
pressure and quantity of air may be greater but proportional to flapper and nozzle movement.
In general use there are two basic forms of relays.
a. continuous bleed type
b. non-bleed type
Continuous Bleed Repay (Reverse Acting)
The nozzle pressure enters the diaphragm chamber and adjusts the position of the valve in
relation to the valve seats of the valve chamber. The air continuously escapes via the vent and
the rate of leakage determines the back pressure in the output chamber and thus the output
pressure will increase as the nozzle pressure decreases. See Fig 10.4
Figure 10.4

Continuous Bleed Replay (Direct Acting)
The nozzle pressure enters the diaphragm chamber and adjusts the position of the double seat
valve in relation to the valve seats of the valve chamber. If the nozzle pressure increases the
force on the diaphragm moves the double seat valve to the left. This results in the output
pressure increasing proportionately. A drop in nozzle pressure would cause the double seat
valve to move to the right, this seals off the supply and causes a drop in the output, excess
pressure vents through the vent hole. It therefore, follows that any increase in nozzle pressure
results in an increased output. See Fig. 10.5
Figure 10.5
Since, with both the reverse and direct acting continuous bleed relay, output pressure is
maintained by venting excess air to atmosphere there is a continuous consumption of air.
Typically this will be about 0.5 cubic feet/minute and can be overcome by the use of a non-
bleed type relay.
Non-Bleed Relay
The noozle pressure is applied to the exterior of the large outer bellows.
The control line pressure is exerted on the interior of the small bellows ‘B’ and when the
forces due to the two are equal, a balanced condition exists. The relay flapper ‘C’ the covers
both the exhaust nozzle ‘D’ and the supply nozzle ‘E’.See Fig.10.6.
Figure 10.6

If the primary nozzle pressure increases the larger bellows are deflected downwards carrying
with it the smaller inner bellows. Exhaust nozzle ‘D’ forces the flapper ‘C’ away from month
of the supply port ‘E’, but remains closed itself. Air is admitted to the control line and the
interior of ‘B’. The force supplied to ‘B’ increases and the bellows assembly is now moved
upwards until ‘C’ is back to its original position and the support ‘E’ is closed.
With a decrease of primary pressure the outer bellows move upward taking below ‘B’
upwards. The exhaust nozzle now comes into operation because of its mouth is uncovered in
the action of moving away from ‘C’ relay flapper. Air bleeds away from the interior of
bellows ‘B’ and also the control line via port ‘F’. Pressure is reduced and the bellow
assembly begins to move downwards until nozzle ‘D’ meets the relay flapper ‘C’ and the
exhaust passage is closed.
With this type of relay it should be noted that a dead spot may occur if a spring type of relay
flapper ‘C’ is used to provide a positive closing force on the two ports ‘D’ and ‘E’. Any
increase in primary nozzles pressure must overcome this spring pressure and so tend to
reduce the response time of the relay. In practice this is reduced to minimum by using an
outer bellows of an area as large as possible
ELECTRICAL/PNEUMATIC CONVERSION
Because of the modern trend towards electronic control and display equipment it is frequently
necessary to convert pneumatic signals to a proportional electrical signal or to convert an
electrical signal to a proportional pneumatic signal.
This is achieved by the use of a pneumatic/electrical converter as shown in fig. 10.7.
Figure 10.7

Electro pneumatic converts are also used where transmission signals cover great distances or
to improve response times of existing pneumatic equipment.
THE FIELDEN E/P CONVERTER
This Fielden E/P converter is a force balance device without feedback. Because of the lack of
feedback the setting up of the nozzle is critical. The device is supplied with air at 1.5 bar and
has restrictor and nozzle size ratios similar to be a conventional flapper nozzle system i.e 3:1
The beam is pivoted at one end whilst the other end is attached to a permanent magnet, the
plug of the primary valve is also connected to the bream. Zero adjustment is achieved by
varying the/ spring tension and positioning the primary valve plug relative to its seat (nozzle).
Current is applied to the coil and a magnetic field is set up, (the strength of which depends
upon the valve of current) the permanent magnet is forced down which brings the primary
valve closer to its seat, pressure builds up and forces the diaphragm down which seals off the
exhaust valve and opens the secondary valve, resulting in an increase in output pressure. If
the value of current falls the permanent magnet will rise relieving the pressure on top of the
diaphragm which closes the secondary valve in. Excess pressure is vented through the
exhaust, resulting in a drop in pressure. Oil damping is provided on the magnet to give
smooth operation. See fig.,10.8.
Figure 10.8

DIAPHRAGM AIR MOTORS
It consists of a motor unit which contains a flexible diaphragm. The diaphragm virtually seals
the chamber into two parts, the upper sections receiving the pneumatic signals from the
controller via the air input. The input signals deflect the diaphragm which is fixed to the
thrust plate. The spindle attached to the thrust Plate extends downwards into the body of the
valve. The deflection is opposed by the range spring whose, rating determines the extent of
travel of the spindle for a given pressure range and effective diaphragm area. Since the
spindle is connected to the valve plugs we have the means of automatically adjusting the
orifice area in response to action from the controller and thereby altering the flow of the
medium through the valve. See Fig. 10.9
Figure 10.9
PNEUMATIC CYLINDER MOTORS
Although position control of pneumatic cylinders is possible, in practice it is seldom done
without using some form of feedback. A theoretical type of cylinder positioning, without
feedback as shown in Fig 10.10.
Fig 10.10

The output pressure of the regulator is fixed at say 3 bar. The air operated pressure regulator
will accept inputs between 0.2 and 1 bar, 1 bar input resulting in 3 bar output. The range of
output would be dependent upon piston specification and condition and would, therefore, be
set up in situ. It follows, therefore, that by varying the pressure on top of the piston we can
effectively position the piston rod anywhere within its length of travel.
A control valve must be capable of responding smoothly and rapidly to small changes in the
controller output signal. The quality of control will be impaired if any force; for example, that
due to friction of working parts, oppose the movement of the spindle and the valve plug. This
can be overcome by emplying mechanical feedback in the form of a positioner.
THE VALVE POSITIONER
The primary function of a valve positioner is to ensure that the control valve plug position is
always directly proportional to the value of the controller output pressure, regardless of glad
friction, actuator hysteresis, off-balance of forces on the valve plug etc. This is usually
achieved by incorporating a feed back lever that acts in opposition to the movement to the
input bellows.
The system can be either a position or force balance system but in practice force balance
systems are more common. Positioners can be incorporated into diaphragm, or cylinder type
actuators. See fig. 10.11
Figure 10.11
The controller output signal does not directly actuate the valve stem but is fed to a bellows
unit. Assume that the system is in equilibrium and then the controller output increases

slightly. The flapper is moved towards the nozzle and the relay output pressure beings to
increase.
This output pressure continuous to increase until the valve spindle moves, mechanical
feedback then restores the equilibrium. Thus the force applied to move the valve spindle is
sufficient to overcome the effect of all forces, no matter what the origin, which tend to
oppose the spindle movement. Without the positioner the slight change in controller output
signal may have been too small to initiate any corrective action/ The matching of input signal
range to valve travel range is achieved by changing the ratio of bellows/nozzle distance to
feedback arm/nozzle distance.
Positioners incorporate into pneumatic cylinders generally operated on a pilot valve principle
of which two are shown in Fig 10.12 and 10.13.
KENT MARK IV
The controller output acts upon the bellows, the pilot valve spool is attached to the bellows
via a connecting link. Assuming an increase in the controller output the bellows will expand,
unbalancing the spool of the pilot valve. Air is then admitted to the top of the piston and it
begins to move down. In doing so it takes the cam with it, as the cam moves down the bell
crank level turns about its pivot and through the spring opposes the movement of the bellows
and restores the spool of the pilot valve to its original position. The system is the back in
equilibrium. An equalizing valve is included to enable manual positioning of the piston
Figure 10.12

BAILEY CONTROL DRIVE
The controller output acts on the bellows the spool of the pilot valve is attached to the pilot
beam at one end whilst the other end is anchored and pivoted. Assuming an increase in the
controller output the bellows will expand and push the pilot beam up against the restraining
force of the spring. This unbalances the pilot valve and causes ait to be admitted to the top of
the piston. The piston, therefore, begins to move down, this results in the positioner drive arm
turning the cam which puts more tension on the spring and so restores the pilot beam to its
original position.
Figure 10.13
PNEUMATIC SEQUENCE CONTROL
Sequence control is essentially the carrying out of a series events in a logical progressive
manner.
The actual even is usually the carrying out of some physical work utilising the movement of
an actuator. In pneumatic sequenced control compressed air can provide power through either
linear motion or rotary motion i.e. diaphragm valves, pneumatic cylinders or air motors.
Since the pneumatic cylinder is by far the simplest form actuator it shall be used as the basis
for the following notes, although the principle can be applied to any actuator.
TYPES OF CYLINDER
The simplest type is the single acting cylinder (Figure 54).With this type air is used to make
the unit out stroke or extend (+). Once the pressure has been removed, the return or in stroke
(-) is achieved by mechanical means, in this case a spring. The cylinder can be air to extend
(application of a signal will push the piston out) or air to retract (application of a signal will
push the piston in).
Figure 10.14
In the double acting cylinder, if air is applied to P1 (with P2 open to exhaust) the piston will
outstroke (+); and if air is applied to P2 (with P1 open to exhaust) the piston will in-stroke (-).
The symbols + and – are often used as a shorthand notation to indicate movement of the
cylinder, particularly when describing the sequence of operation of a circuit. For example,
there may be three cylinders A, B and C which operate in the sequence A+, B+, B-, A-, C+,
C-.
PNEUMATIC CYLINDER CUSHIONING
On high pressure systems, piston speeds can be in the order of 450 mm/sec. and impact forces
at the ends of the stroke can be great. In order that damage may not be cased by sudden
contract between the fast moving piston and the cylinder end housing, some form of buffer or
cushioning can be used. This does not limit the piston travel but allows gradual declaration in
the last 25 mm or so of travel, this is achieved as shown in fig 55
Figure 10.15
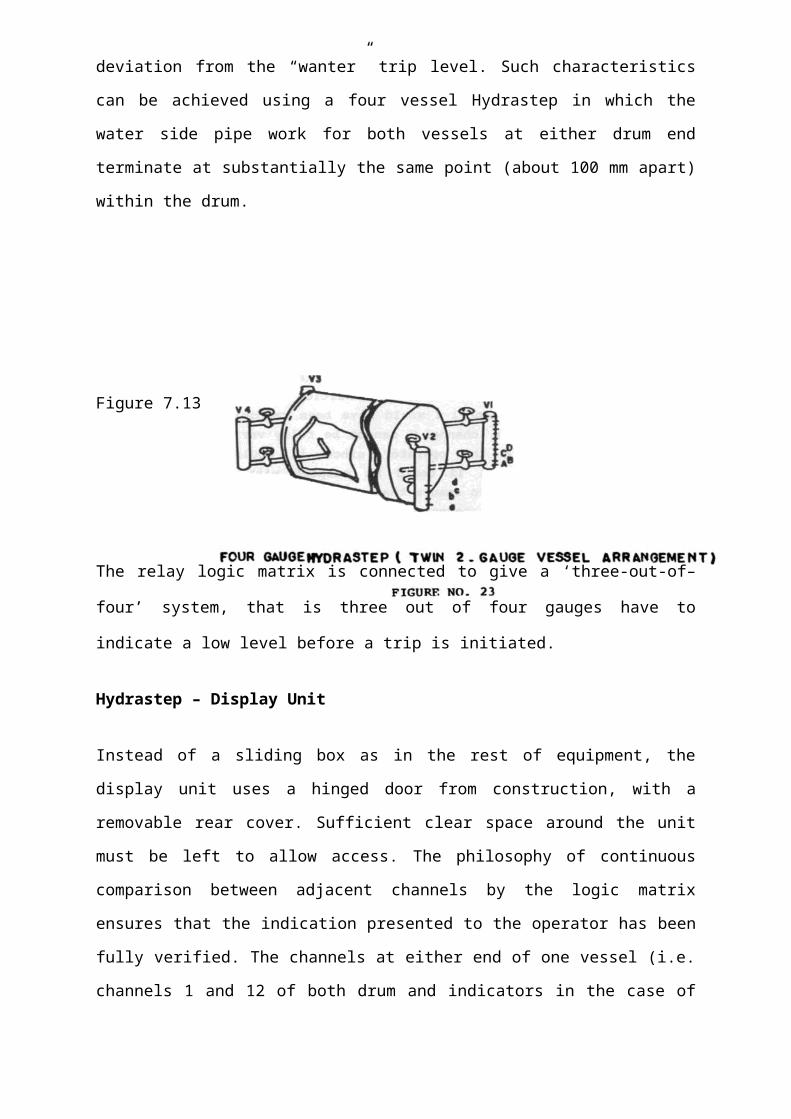
As the cylinder outstrokes under the action of applied pressure air is displaced from the other
side of the piston to atmosphere through the main part and needle valve. When the cushioning
boss enters the cushioning seal, the main port is blocked off, air can, therefore, only escape
through the needle valve at a much slower rate thereby causing the piston to slow down for
the premium period of travel. This results in the cushioning effecting shown in Fig.10.16
Figure 10.16
SEQUENCE CONTROL VALVES
An ordinary on off valve has one inlet and outlet. However, for sequence control applications
facility must be made to exhaust any unwanted signal. The two most common types of valve
used in sequence control are three port and five port types.
THREE PORT RELAYS
The basic three port valve consists of a two lobe spool running in a surface ground cylinder,
compressed air can be switched to the outlet by the application of a force to the spool.
The force can be removed and the outlet will remain connected to the air supply.
The application of a second force will return the spool to its original condition, main air will
then be isolated and the device connected to the outlet will exhaust from part 3.
FIVE PORT RELAYS
The basic construction of the five port relay is the same as the three port relay, the only
difference being the use of a three lobe spool. Compressed air can now be routed through the
valve whilst the same time a signal can be exhausted through it. The direction of force will
determine the routing of supply and exhaust

LIST OF TABLES
Table 1: Installed Capacity of NTPC
Table 2: Coal Based Power Stations owned by NTPC
Table 3: Coal Based Power Stations owned by Joint Ventures
Table 4: Gas Based Power Stations
Table 5: Hydro Based Power Projects
Table 6: Solar Energy Projects

LIST OF FIGURES
Figure 2.1: Flow Diagram depicting Process of Conversion of Natural Gas to Electricity
Figure 2.2: View of Air Intake System
Figure 2.3: Sectional View of Air Compressor
Figure 2.4: Cross sectional View of a combustor used in combustion chamber
Figure 2.5: Gas Turbine
Figure 2.6: Turbine Blades
Figure 2.7: Turbine and Generator mounted on a single shaft
Figure 2.8: step up Transformer
Figure 2.9: An auxiliary Transformer
Figure 2.10: A steam Turbine
Figure 2.11: Condenser
Figure 2.12: Constructional view of HRSG
Figure 2.13: View of steam Turbine Generator
Figure 2.14: Step up Transformer
Figure 2.15: De-aerator
Figure 3.1: Pipelines of gas source
Figure 3.2: Naphtha Specifications
Figure 3.3: Naphtha Storage Tanks
Figure 4.1: Control & Instrumentation Department
Figure 6.1 to 6.2: Manometers
Figure 6.3: Bourdon Tube
Figure 6.4: Graph
Figure 6.5: Differential Pressure Gauge
Figure 6.6: Equalizing unit
Figure 6.7: Four Wire Transmitter
Figure 6.8: two wire Transmitter
Figure 6.9: load Capability Characteristics
Figure 7.1: right Arm Float
Figure 7.2: float operated switch
Figure 7.3: Head Pressure Measurement system

Figure 7.4: Measurement of liquid in closed Vessel
Figure 7.5: Measurement of liquid in closed vessel with condensed vapor
Figure 7.6: Gas Purge System
Figure 7.7: Air Trap System
Figure 7.8: Bellow Type Tank Gauge
Figure 7.9: Conducting liquid causing variation of resistance
Figure 7.10: Hydrastep-Drum Installation
Figure 7.11:Thermal Characteristics
Figure 7.12: Twin Hydrastep replacing Visual Gauges- block diagram
Figure 7.13: Four Gauge Hydrastep
Figure 7.14: capacitance methods
Figure 7.15: Water Gauge with closed circuit- C.C.T.V. remote display
Figure 8.1: Concentric orifice Plates- illustrating variation of static pressure upstream and
downstream of orifice
Figure 8.2,8.3: Main tapping positions
Figure 8.4: Elements of Venturi Tube
Figure 8.5: Nozzle Unit
Figure 8.6: Pitot Tube
Figure 8.7 Double tip pattern Pitot tube
Figure 8.8: Dall tube, diagram of glass body variable area meter
Figure 8.9: diagram of metal body variable area meter
Figure 8.10: Electromagnetic flowmeter & measuring circuits
Figure 8.11: Differential arrangements
Figure 9.1: Industrial bimetallic Thermometer
Figure 9.2: Principal Type of elements used in bimetallic thermometers
Figure 9.3: Typical liquid expansion Thermometer
Figure 9.4: Platinum Industrial Resistance Thermometer assembly
Figure 9.5: Wheatstone Bridge
Figure 9.6: Null Balance Method
Figure 10.1: Flapper/Nozzle
Figure 10.2: Position Balance – Principle

Figure 10.3: Force Balance Principle
Figure 10.4: Continuous Bleed Repay( reverse action)
Figure 10.5: Continuous Bleed Repay( direct action)
Figure 10.6: non bleed repay
Figure 10.7: electrical/pneumatic converter
Figure 10.8: fielden E/P converter
Figure 10.9: Diaphragm Air motor
Figure 10.10: Pneumatic Cylinder motor
Figure 10.11: Valve Positioner
Figure 10.12,13: Pneumatic Cylinder operating on a pilot valve principle
Figure 10.14: types of cylinders
Figure 10.15: Pneumatic Cylinder Cushioning
Figure 10.16: Results of cushioning efficiency

BIBLIOGRAPHY
www.ntpc.co.in
Wikipedia
NTPC guide manual
Sample report
Power plant engineering-A.K.Raja, Manish dwivedi