Embed Size (px)
Citation preview

Ife Journal of Science vol. 18, no. 1 (2016)
HYDROCARBON GENERATIVE POTENTIAL OF CRETACEOUS SEDIMENTS OF KANADI-1 WELL, BORNU BASIN, NIGERIA
Nton, M. E. and Ekom, J. C.Department of Geology, University of Ibadan, Nigeria
Email: [email protected]; Phone Contact: +2348023417013th th(Received: 9 Jan., 2016; Accepted: 18 Feb., 2016)
The hydrocarbon potential and paleodepositional environment of Cretaceous sediments from the Borno Basin, Nigeria, were assessed by Rock-eval pyrolysis and biomarker geochemistry. The Total Organic Carbon (TOC), soluble organic matter (SOM) and genetic potential (GP) values ranged from 0.52 – 0.82wt%, 455.64 – 1003.04 ppm and 0.23 – 0.63 mg/g, respectively. These values suggested that the sediments were moderately rich in organic matter. The Hydrogen Index (HI) values (19 – 85 mgHC/gTOC) and cross plots of Hydrogen Index (HI) versus Oxygen Index (OI), classified the sediments as types 111 and IV organic matter which had potential
oto generate mainly gas. The T and Production Index (PI) values ranged from 339 – 436 C and 0.08 – 0.32 max
while the Production Index (PI) ranged from 0.08 – 0.32, respectively, suggesting low maturity. Biomarker data revealed the presence of C to C steranes and oleanane which indicated organic matter from mixed sources with 27 29
more terrigenous contribution. The dominance of C over C and C also supported higher terrigenous input. 29 28 27,
Various thermal maturity parameters computed from the terpanes and steranes distributions in the sediments indicated low thermal maturity. The C /C – C Homohopane index and Pr/Ph values ranged from 0.06-0.24 35 31 35
and 0.23 – 2.52 respectively. These values suggested organic matter deposited under anoxic to suboxic conditions. The results of this study showed that the sediments had potential to generate mainly gas at appropriate thermal maturity.
Keywords: Bornu Basin, Biomarkers, Hydrocarbon Potential, Paleodepositional Environment
ABSTRACT
229
INTRODUCTIONThe Bornu Basin, which represents the Chad Basin in Nigeria, is one –tenth of the total area extent of the Chad Basin and extends to Niger Republic, Chad and Cameroon (Okosun, 1995). The Bornu Basin corresponds to the south-western arm of the Chad Basin and lies between
o olongitudes 8 21'49''E and 14 40'22''E and o o
latitudes 11 N and 13 43'38''N in north-eastern Nigeria (Fig.1). Occurrences of oil and gas “shows” in the eastern and western parts of the Chad Basin in the neighbouring Chad and Niger Republics (Bignell, 1977:, Whiteman, 1982:,
Schlumberger, 1985:, Genik, 1992; 1993) have led to intensive exploration activities in the Bornu Basin. In addition, the similarities in tectonic evolution between Libya's petroleum producing Sirte Basin (ASGA – UNESCO, 1963), Benue Trough (Frankl and Cordry, 1967; Whiteman, 1971) and Chad Basin, attest to a possible petroleum potential in the Bornu Basin. Whiteman (1982) reported on the likely prospect for hydrocarbons especially for the Turonian rocks which were laid down when the southern end of Bornu Basin was connected via Gongola arm with the Benue Trough.

230
Olugbemiro et al. (1997) have investigated the petroleum potential of the Bornu Basin and deduced that the Fika shale has good source rock potential but of low thermal maturity. They also deduced that the Gongila Formation is organically lean while the argillaceous member of the Bima Formation could be a good source rock but situated in a rather high thermal regime that is likely to vaporize such generated hydrocarbon. They proposed the continental Bima sandstone as the possible reservoir rock. Nton and Arowosegbe (2012) have examined the s ed imen to log i c a l cha r a c t e r i s t i c s and hydrocarbon potential of subsurface sediments of Kinasar-1 Well within the Bornu Basin. Their study revealed that the siliciclastics are products of continental block provenance from the Zambuk Ridge and/or the north central basement and deposited in fluvial environment while the organic matter is immature to slightly mature and of terrestrial precursor with prospects to generate gas.
At present, Nigeria's current national reserve asset (proven) put at 38 billion barrels of oil and about 190 trillion standard cubic feet of gas, is derived solely from the Niger Delta (Obaje et al., 2011). In recent times, efforts have been geared towards the development of other sedimentary
basins outside the Niger Delta. This study therefore examines the sediments of Kanadi- 1 Well for biomarker distribution in order to deduce the hydrocarbon potential and palaeodepositional environment of the Cretaceous sediments of the Bornu Basin, northeast Nigeria, in line with current understanding. Findings from this study no doubt, will provide additional information that will be useful to explorationists and researchers. Description of the Study Area and Geology The Kanadi-1 well, which was drilled in 1980's by the Nigerian National Petroleum Cooperation (NNPC), is located in the Bornu Basin, northeastern Nigeria and lies within longitude
o ' o '12 25E and latitude 13 25N (Fig. 2). Various hypothesis have been put forward for the evolution of the Bornu Basin (Carter et al., 1963; Ajakaiye and Burke, 1973; Avbovbo et al., 1986) among others. The Bornu Basin, which represents the Chad Basin in Nigeria, is a part of the Western Central African Rift System (WCAS) that was formed in response to the separation of the African crustal blocks in the Cretaceous (Genik, 1992). The basin belongs to the West African Rift Subsystem (WAS) component of WCAS. The tectonic model and the different phases of evolution of the basin have been reported by Genik (1992).
Figure 1: Geological Map of Nigeria Showing the Inland Basins, Location of Bornu Basin and Kanadi Well (After Obaje et al., 2004)
Nton and Ekom: Hydrocarbon Generative Potential of Cretaceous Sediments

231
The stratigraphic units represented in the Nigerian sector of the Chad Basin ranges from Albian to Recent, where deposition took place under varying conditions. The stratigraphy of the Bornu Basin from oldest to youngest is as shown below: The Bima Sandstone is the oldest stratigraphic unit in the Bornu Basin which lies unconformably on the basement complex (Okosun, 1995). It is made up of continental, poorly sorted, sparsely fossiliferous, thickly bedded, cross-stratified fine to coarse grained feldspathic sandstones and conglomerates. Thin bands of claystone and siltstone, varying in colour from red to grey or brown, occur as intercalations within the sandstone. Odusina et al (1983) reported that the Bima Sandstone is wholly continental in the northern part of the basin, while in the south, shale occurs in the lower part. This formation is diachronous and is from Albian –Turonian age (Carter et al, 1963).
Overlying the Bima Sandstone is the Gongila Formation. It is a transitional sequence between the underlying continental Bima Sandstone and the overlying Fika Shale (Carter et al., 1963; Avbovbo et al., 1986). Okosun (1995) described
the Gongila Formation as consisting thin to moderately thick intervals of shale, silty sandstone and sandstone. The shale is grey to dark-grey while the sandstone is of variable colours; ranging from brown through white, yellow to purple and grey. Volcanic intrusives, occurring as diorite sills, are present at several horizons within the formation (Okosun, 1995; Olugbemiro, 1997). Carter et al. (1963) reported the presence of numerous Cenomanian-Lower Turonian ammonites from the basal shaly facies in outcrops of the formation. The Gongila Formation marks the onset of marine incursion into the Chad Basin in the Turonian (Obaje et al., 2004).
The Fika Formation overlies the Gongila Formation and was deposited during the marine transgression in the Turonian-Coniacian (Carter et al., 1963). It comprised blue-black gypsiferous shale with thin intercalations of limestone. There are reported occurrences of volcanic intrusions at numerous horizons of the formation which affects the thermal alteration of the adjacent shale. The formation varies in thickness from the southwest part of the basin to the northwest part. It may be suggested that the older Cretaceous beds thicken towards the centre of the basin
Fig. 2: Location Map of Northeastern Bornu, Showing Kanadi-1 Well
Nton and Ekom: Hydrocarbon Generative Potential of Cretaceous Sediments

232
(Avbovbo et al., 1986).
Overlying the Fika Shale is the Gombe Sandstone and is made up of sequences of estuarine and deltaic sandstone, siltstone, shale, claystone, thin coal beds and intercalating limestone. The formation is best developed in the southwestern portion of the basin, where a thickness of 350 m has been reported and gets thinner towards the Lake Chad in the northeast (Matheis, 1976). The sandstone and siltstone are cross-bedded. The formation has been assigned a Maastrichian-Paleocene age.
Successively overlying the Gombe Formation is the Kerri-kerri Formation, which consists of thin to thick beds of sandstone siltstones and claystone. This formation appears similar in lithology to the Bima Sandstone, except for the lower proportion of feldspar (Carter et al., 1963). The sandstones are cross-bedded and lignite bands occur at the base of the formation. The Kerri Kerri Formation is of Paleocene age (Adegoke et al., 1973).
The Chad Formation is the youngest stratigraphic unit in the Bornu Basin and overlies the Kerri-Kerri Formation. It is made up of Quaternary lacustrine and fluviatile thick bodies of claystone, separating three major sand bodies with lenses of diatomite, up to a few meters thick (Wright et al., 1985). Feldspathic sandstone dominates the lower portion, which is overlain by gravels and a thick stratum of greenish-grey claystone with fine grained sandstone. The Chad Formation is a product of erosion from the watershed into the Chad Basin accompanied by episodic and sporadic uplift and volcanism (Burke, 1976). The formation was dated Pliocene-Pleistocene by Carter et al. (1963).
MATERIALS AND METHODS OF STUDYSamplesThe ditch cuttings from Kanadi -1 well were obtained from the Nigerian Geological Survey Agency (NGSA), Kaduna. The samples covered a depth range of 850 m – 3047 m. The detailed lithological description of the samples is shown in Figure 3.The lithologic description sequence is made up of a lower fine to medium grained,
poorly sorted brown sandstone. This is overlain by dark to black shale sequence and overlain by dark gray sandy shale in the middle part. A thick dark shale unit caps the sequence in the upper part.
Analytical TechniquesTotal Organic CarbonThe samples were pulverized and approximately 0.10 g of each was treated with dilute Hydrochloric acid (HCl) to remove carbonates for Total Organic Carbon (TOC) determination. The samples were left in the acid for a minimum of two hours and later drained off with a filtration apparatus fitted with a glass microfiber filter. The filter was placed in a LECO crucible and dried at
o110 C for a minimum of one hour. After drying, the samples were analyzed in a LECO 600 Carbon Analyzer for the Total Organic Carbon content.
Rock Eval Pyrolysis
100 mg of each sample was progressively heated o o
to 600 C at 25 C/min heating rate. This computerized system output the pyrograms as well as the calculated parameters. Both the Total organic carbon and Rock eval pyrolysis were carried out at the Weatherford Laboratories, Texas, U.S.A with the same instrumentation.
Soluble Organic Matter (SOM) extraction and fractionationAbout 30-50 g of each pulverized shale sample was soxhlet extracted for 24 hrs using methylene chloride/methanol mixture for Soluble Organic Matter (SOM) extraction. After the extraction, the solvent was distilled and the soluble organic matter was then weighed. The extracts were fractionated on silica gel column chromatography into saturate, aromatic, polar (NSO) fractions by success ive e lus ion with n-hexane, n-hexane/dichloromethane (4:1, v/v) and dichloromethane/methanol (1 :1 , v/v) , respectively.
Gas Chromatography -Mass SpectrometryThe saturate and aromatic fractions were analyzed f o r t h e i r b i o m a r k e r s b y g a s chromatography/mass spectrometry (GC/MS) using the selected ion monitoring mode (SIM) with an Hp 6890 gas chromatograph fitted with
Nton and Ekom: Hydrocarbon Generative Potential of Cretaceous Sediments

233
DISCUSSION OF RESULTSOrganic Matter QuantityThe Total organic carbon (TOC) contents for the samples range from 0.52-0.82 wt. % (Table 1). These values are slightly higher than the minimal 0.5 wt. % required for clastic source rock (Hunt, 1995; Tissot and Welte, 1984). The soluble organic matter (SOM) values range from 455.64 – 1003.04 ppm (av. 669.94 ppm, Table 2) and imply
that the organic matter is adequate. The saturated hydrocarbons (SHC), total hydrocarbon (THC) and genetic potential (GP) values range from 16 – 237 ppm (av.158 ppm), 35 – 405 ppm (av. 271 ppm) and 0.23 – 0.63 mg/g (av. 0.41mg/g), respectively. These values are lower than the expected values to generate oil except for gas (Tissot and Welte, 1984).
Nton and Ekom: Hydrocarbon Generative Potential of Cretaceous Sediments
DB-5 silica capillary column (30 m x 0.25 mmID, 0.25 um film thickness) coupled with Hp 5973
o MSD. The oven temperature was held at 60 C for o o5 min and programmed from 60 C to 300 C at
o40 C/min (held for 10 min). Helium was used as the carrier gas at constant flow rate of 1.0 ml/min. The mass spectrometer was operated at electron energy of 70Ev, an ion source temperature of
o o250 C and separation temperature of 250 C. The chromatographic data were acquired using Ms Chemstation software, version G1701BA for Microsoft NT ®. Detailed analytical techniques can be found in Ekom (2011). This analysis was carried out at the Exxon Mobil Geochemical Laboratory, (QIT) Ibeno, Eket , Nigeria.
Fig. 3: Lithological Profile of Kanadi -1 Well

234
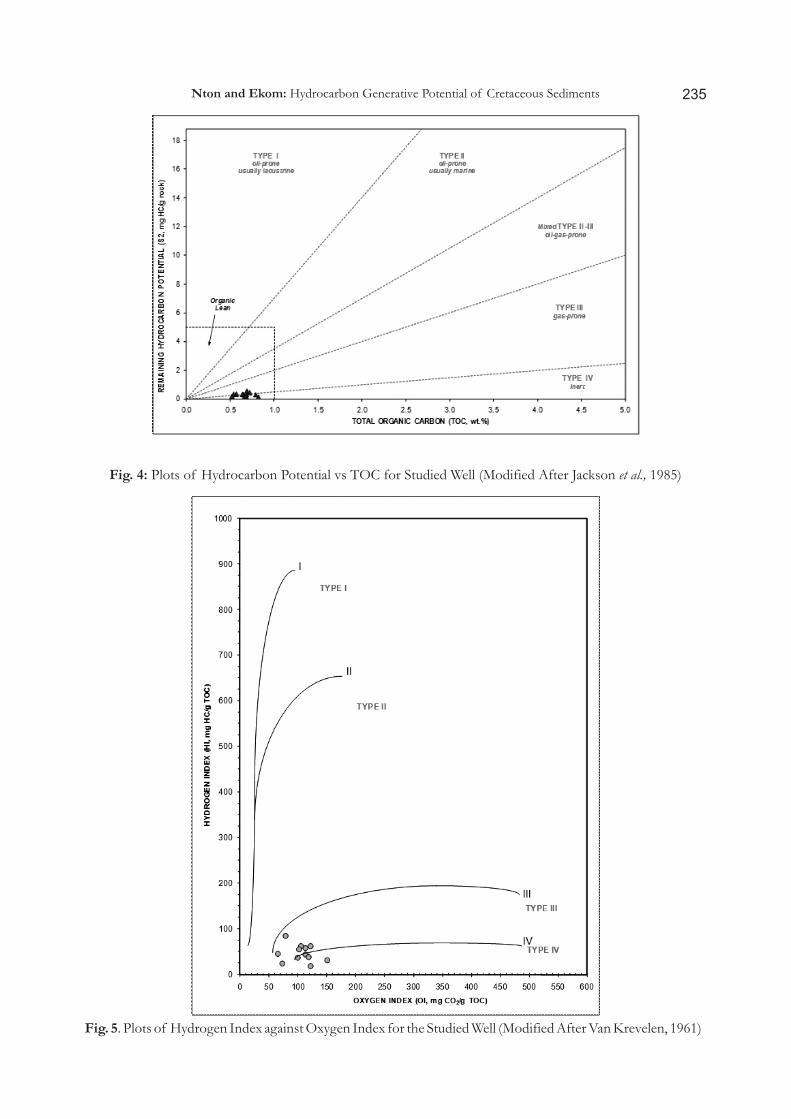
Organic matter typeThe plot of remaining hydrocarbon potential (S ) 2
versus total organic carbon (Fig. 4) shows that the majority of the sediments fall within types III and IV kerogen. The cross plot of hydrogen index against oxygen index (Fig. 5) also indicates types III and IV kerogen , suggesting greater input of terrestrial organic matter and gas prone. The
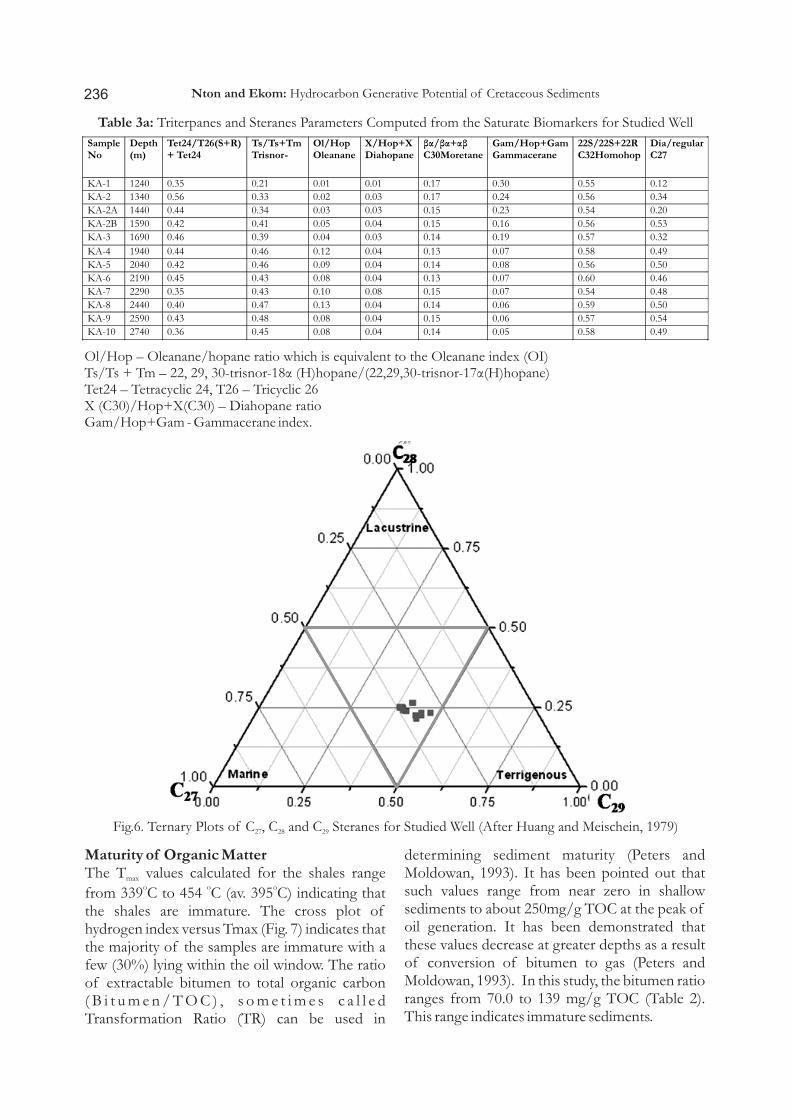
presence of oleananes (Table 3a) which is a marker for higher plants, (angiosperms) strongly supports a terrestrial precursor for the samples in this study (Ekweozor and Udo, 1987). A ternary plot of steranes C , C and C (Fig.6), shows a 27 28 29
dominance of C over C and C (C <C <C ), 29 27 28 27 28 29
which is an indication of high terrigenous input (Huang and Meischein, 1979).
TABLE 1: Results of the TOC and Rock-Eval Pyrolysis of Kanadi -1 Well Sediments
Sample No.
Depth(M)
TOC(wt. %)
S1
(mg/
g)
S2
(mg/g)
S3
(mg/g)
S1 + S2
(mg/g)
S2/S3 S1/TOC *100
HI OI PI PC TMax
(o
C)
SOM/TOC(mg/g)
KA-1 1240
0.69
0.05
0.58
0.54
0.63
1.07
7
85
79
0.08
0.05
434 103
KA-2 1340
0.57
0.05
0.33
0.65
0.38
0.51
9
58
114
0.13
0.03
436 90
KA-2A 1440
0.54
0.05
0.34
0.57
0.39
0.59
9
63
106
0.13
0.03
436 111
KA-2B 1590
0.65
0.06
0.30
0.43
0.36
0.70
9
46
66
0.17
0.03
432 70
KA-3 1690
0.68
0.08
0.30
0.77
0.38
0.39
12
44
113
0.21
0.03
435 75
KA-4 1940
0.68
0.07
0.16
0.50
0.23
0.32
10
24
74 0.30
0.02
342 107
KA-5 2040
0.66
0.10
0.21
1.00
0.31
0.21
15
32
151 0.32
0.03
339 91
KA-6 2190 0.82 0.07 0.16 1.00 0.23 0.16 9 19 122 0.30 0.02 454 95
KA-7 2290 0.72 0.15 0.45 0.88 0.60 0.51 21 62 122 0.25 0.05 359 139
KA-8 2440
0.79
0.11
0.29
0.79
0.40
0.37
14
37
100
0.28
0.03
356 91
KA-9 2590
0.52
0.06
0.20
0.62
0.26
0.32
12
39
119
0.23
0.02
358 114
KA-10 2740 0.64 0.06 0.36 0.65 0.42 0.55 9 56 102 0.14 0.04 354 124
Average 0.66 0.08 0.29 0.70 0.38 0.48 11.33 47 106 0.21 0.03 395 101
Table 2: Data of Fractionated Parameters and Geochemical Ratios for Studied Well
SampleNo.
Depth (m)
TOC (wt.%)
SOM (ppm)
SHC (ppm)
AHC (ppm)
THC (ppm)
NSO (ppm)
ASPHA (ppm)
UNREC
(ppm)
SOM/TOC (mg/g)
SHC/TOC(mg/g)
THC/TOC(mg/g)
KA-1 1240 0.69
711.21
198
66
264
287
153
7
103
29 38
KA-2 1340 0.57
512.48
120
157
277
62
171
3
90
21 49KA-2A 1440 0.54
599.97
151
136
287
207
101
5
111
28 53KA-2B 1590 0.65
455.64
146
60
206
165
82
3
70
23 32KA-3 1690 0.68
512.12
152
78
230
192
88
2
75
22 34KA-4 1940 0.66
706.77
206
101
307
269
129
2
107
31 46KA-5 2040 0.82
747.49
207
171
378
191
158
20
91
25 46KA-6 2190 0.72
684.04
160
141
301
199
178
6
95
22 42KA-7 2290 0.72 1003.0 16 19 35 50 788 127 139 2 5KA-8 2440 0.79 718.02 150 255 405 173 136 4 91 19 51KA-9 2590 0.52 592.24 158 87 245 196 145 6 114 30 47KA-10 2740 0.64 796.20 237 82 319 282 193 2 124 37 50Average 0.66 669.94 158 113 271 189 194 16 101 24 41
TOC = Total Organic Carbon, SOM = Soluble Organic Matter, SHC = Saturated Hydrocarbon, AHC = Aromatic Hydrocarbon, THC = Total Hydrocarbon, NSO = Heterocompounds, ASPHA = Asphathenes, UREC = Unrecovery.
Nton and Ekom: Hydrocarbon Generative Potential of Cretaceous Sediments
235
Fig. 4: Plots of Hydrocarbon Potential vs TOC for Studied Well (Modified After Jackson et al., 1985)
Fig. 5. Plots of Hydrogen Index against Oxygen Index for the Studied Well (Modified After Van Krevelen, 1961)
Nton and Ekom: Hydrocarbon Generative Potential of Cretaceous Sediments
236
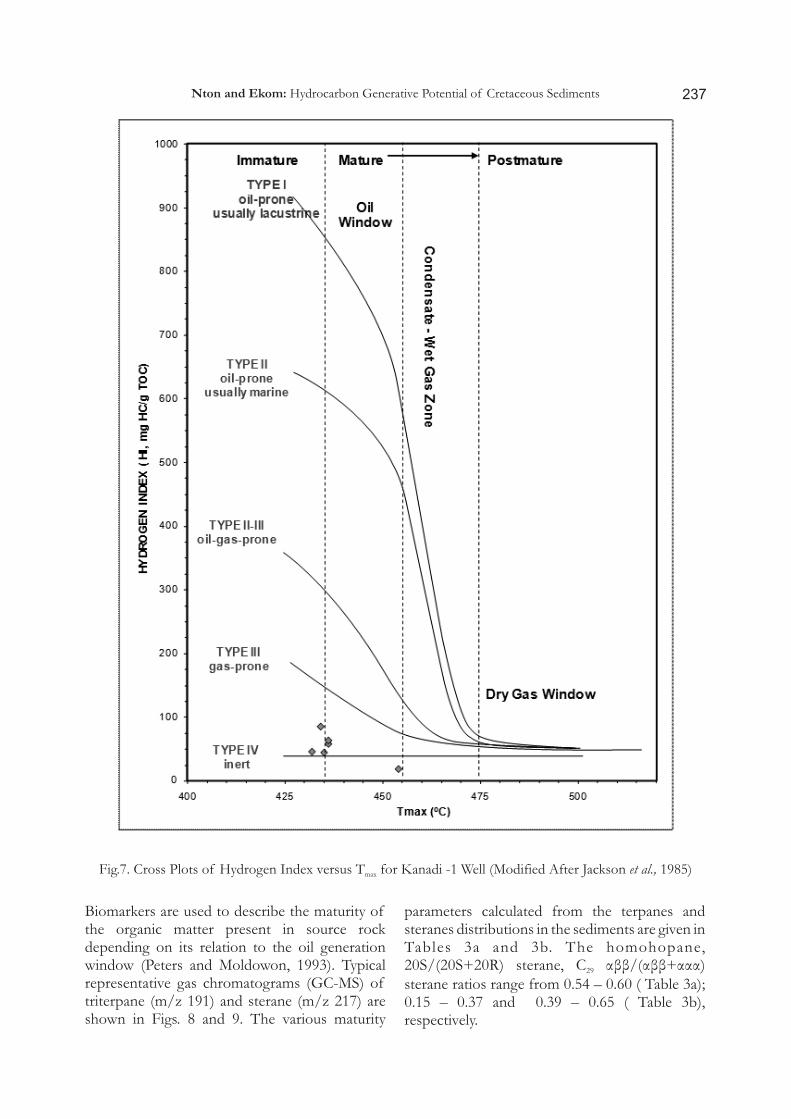
Maturity of Organic MatterThe T values calculated for the shales range max
o o ofrom 339 C to 454 C (av. 395 C) indicating that the shales are immature. The cross plot of hydrogen index versus Tmax (Fig. 7) indicates that the majority of the samples are immature with a few (30%) lying within the oil window. The ratio of extractable bitumen to total organic carbon ( B i t u m e n / T O C ) , s o m e t i m e s c a l l e d Transformation Ratio (TR) can be used in
determining sediment maturity (Peters and Moldowan, 1993). It has been pointed out that such values range from near zero in shallow sediments to about 250mg/g TOC at the peak of oil generation. It has been demonstrated that these values decrease at greater depths as a result of conversion of bitumen to gas (Peters and Moldowan, 1993). In this study, the bitumen ratio ranges from 70.0 to 139 mg/g TOC (Table 2). This range indicates immature sediments.
SampleNo
Depth(m)
Tet24/T26(S+R) + Tet24
Ts/Ts+Tm
Trisnor- Ol/Hop
Oleanane X/Hop+X
Diahopane βα/βα+αβ C30Moretane
Gam/Hop+Gam
Gammacerane 22S/22S+22R C32Homohop
Dia/regularC27
KA-1 1240 0.35 0.21
0.01
0.01
0.17
0.30
0.55 0.12
KA-2 1340 0.56 0.33
0.02
0.03
0.17
0.24
0.56 0.34
KA-2A 1440 0.44 0.34
0.03
0.03
0.15
0.23
0.54 0.20
KA-2B 1590 0.42 0.41
0.05
0.04
0.15
0.16
0.56 0.53
KA-3 1690 0.46 0.39
0.04
0.03
0.14
0.19
0.57 0.32
KA-4 1940 0.44 0.46
0.12
0.04
0.13
0.07
0.58 0.49
KA-5 2040 0.42 0.46
0.09
0.04
0.14
0.08
0.56 0.50
KA-6 2190 0.45 0.43 0.08 0.04 0.13 0.07 0.60 0.46
KA-7 2290 0.35 0.43 0.10 0.08 0.15 0.07 0.54 0.48
KA-8 2440 0.40 0.47 0.13 0.04 0.14 0.06 0.59 0.50
KA-9 2590 0.43 0.48 0.08 0.04 0.15 0.06 0.57 0.54
KA-10 2740 0.36 0.45 0.08 0.04 0.14 0.05 0.58 0.49
Table 3a: Triterpanes and Steranes Parameters Computed from the Saturate Biomarkers for Studied Well
Fig.6. Ternary Plots of C , C and C Steranes for Studied Well (After Huang and Meischein, 1979)27 28 29
Ol/Hop – Oleanane/hopane ratio which is equivalent to the Oleanane index (OI)Ts/Ts + Tm – 22, 29, 30-trisnor-18α (H)hopane/(22,29,30-trisnor-17α(H)hopane) Tet24 – Tetracyclic 24, T26 – Tricyclic 26 X (C30)/Hop+X(C30) – Diahopane ratioGam/Hop+Gam - Gammacerane index.
Nton and Ekom: Hydrocarbon Generative Potential of Cretaceous Sediments
237
Biomarkers are used to describe the maturity of the organic matter present in source rock depending on its relation to the oil generation window (Peters and Moldowon, 1993). Typical representative gas chromatograms (GC-MS) of triterpane (m/z 191) and sterane (m/z 217) are shown in Figs. 8 and 9. The various maturity
parameters calculated from the terpanes and steranes distributions in the sediments are given in Tables 3a and 3b. The homohopane, 20S/(20S+20R) sterane, C αββ/(αββ+ααα) 29
sterane ratios range from 0.54 – 0.60 ( Table 3a); 0.15 – 0.37 and 0.39 – 0.65 ( Table 3b), respectively.
Fig.7. Cross Plots of Hydrogen Index versus T for Kanadi -1 Well (Modified After Jackson et al., 1985)max
Nton and Ekom: Hydrocarbon Generative Potential of Cretaceous Sediments

238
Fig. 8: Partial m/z 191 Mass Chromatogram (hopanes) for Sample KA-1 of Studied well
Fig. 9: Parial m/z 217 Mass Chromatogram (regular steranes) for Sample KA-1 of Studied well
Nton and Ekom: Hydrocarbon Generative Potential of Cretaceous Sediments
239
All the analysed samples have low Ts/(Ts+Tm) ratio ranging from 0.21 to 0.48 and the moretane/hopane ratio exceeding 0.15 (Table 3a). These values reflect the thermal immaturity status of all the shales (Seifert and Moldowan, 1986; Waples, 1985; Waples and Machihara, 1991; Mackenzie et al., 1980; Spiro, 1984; Seifert and Moldowan, 1980; Grantham, 1986).
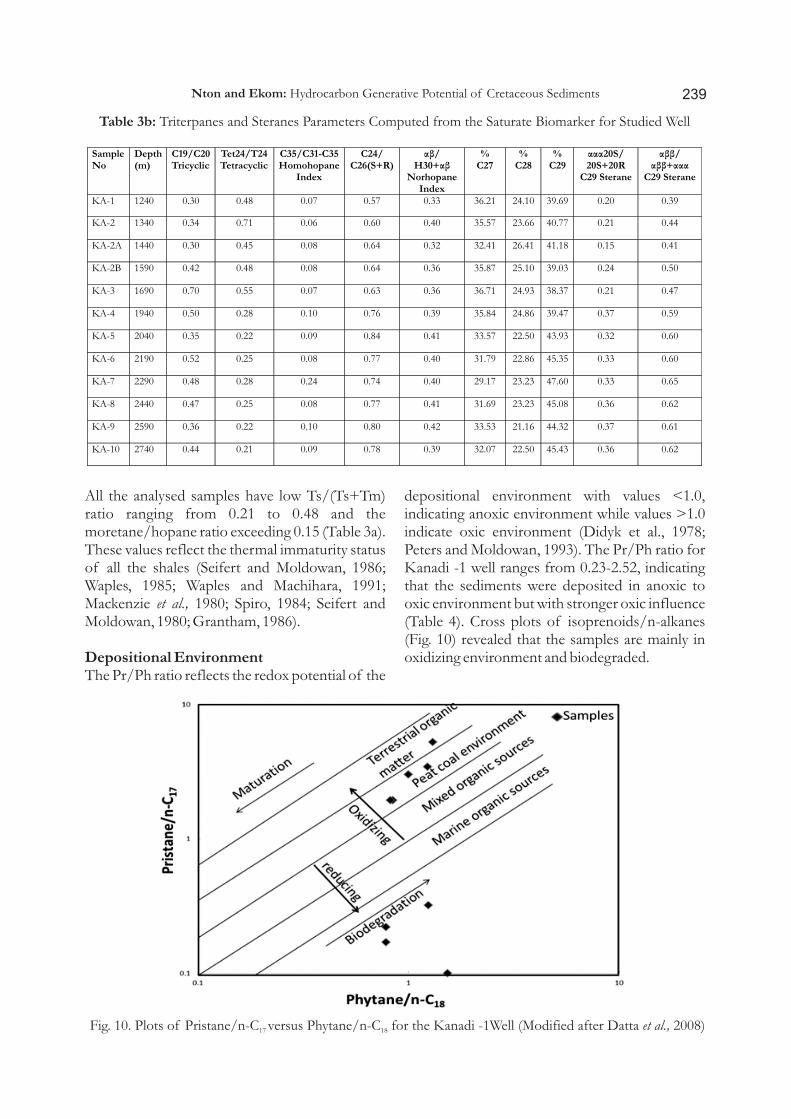
Depositional Environment The Pr/Ph ratio reflects the redox potential of the
depositional environment with values <1.0, indicating anoxic environment while values >1.0 indicate oxic environment (Didyk et al., 1978; Peters and Moldowan, 1993). The Pr/Ph ratio for Kanadi -1 well ranges from 0.23-2.52, indicating that the sediments were deposited in anoxic to oxic environment but with stronger oxic influence (Table 4). Cross plots of isoprenoids/n-alkanes (Fig. 10) revealed that the samples are mainly in oxidizing environment and biodegraded.
Table 3b: Triterpanes and Steranes Parameters Computed from the Saturate Biomarker for Studied Well
SampleNo
Depth(m)
C19/C20 Tricyclic
Tet24/T24 Tetracyclic
C35/C31-C35 Homohopane
Index
C24/ C26(S+R)
αβ/
H30+αβ Norhopane
Index
% C27
% C28
% C29
ααα20S/20S+20R
C29 Sterane
αββ/αββ+ααα
C29 Sterane
KA-1 1240 0.30 0.48
0.07
0.57
0.33
36.21
24.10
39.69
0.20 0.39
KA-2 1340 0.34 0.71
0.06
0.60
0.40
35.57
23.66
40.77
0.21 0.44
KA-2A 1440 0.30 0.45
0.08
0.64
0.32
32.41
26.41
41.18
0.15 0.41
KA-2B 1590 0.42 0.48
0.08
0.64
0.36
35.87
25.10
39.03
0.24 0.50
KA-3 1690 0.70 0.55
0.07
0.63
0.36
36.71
24.93
38.37
0.21 0.47
KA-4 1940 0.50 0.28
0.10
0.76
0.39
35.84
24.86
39.47
0.37 0.59
KA-5 2040 0.35 0.22
0.09
0.84
0.41
33.57
22.50
43.93
0.32 0.60
KA-6 2190 0.52 0.25 0.08 0.77 0.40 31.79 22.86 45.35 0.33 0.60
KA-7 2290 0.48 0.28 0.24 0.74 0.40 29.17 23.23 47.60 0.33 0.65
KA-8 2440 0.47 0.25 0.08 0.77 0.41 31.69 23.23 45.08 0.36 0.62
KA-9 2590 0.36 0.22 0.10 0.80 0.42 33.53 21.16 44.32 0.37 0.61
KA-10 2740 0.44 0.21 0.09 0.78 0.39 32.07 22.50 45.43 0.36 0.62
Nton and Ekom: Hydrocarbon Generative Potential of Cretaceous Sediments
Fig. 10. Plots of Pristane/n-C versus Phytane/n-C for the Kanadi -1Well (Modified after Datta et al., 2008)17 18

240
Biomarkers provide information about the type of depositional environment of organic matter, the conditions during deposition and the lithology in which the organic matter is present (Peters and Moldowan, 1993). The 17α (H)-homohopane distributions can provide information about the palaeoenvironment (Waples and Machihara, 1991). Homohopane index (C35) is very low for all the shale samples, ranging from 0.06 to 0.24 (av.0.10) (Table 3b). The low homohopane index values is an indications of suboxic depositional environment (Moldowan et al., 1986; Hunt, 1995).Gammacerane is a typical biomarker in lake and sea sediments of high salinity (Waples and Machihara, 1991; Hunt, 1995; Peters and Moldowan, 1993). The values of gammacerane index in the studied samples range from 0.05 – 0.30 (Table 3a). Furthermore, the tetracyclic terpane -Tet24/(T26(S+R)+Tet24, another indicator of salinity (Connan et al.,1986), is present in the Kanadi Shale samples with values ranging from 0.35 to 0.56 ( Table 3a). Peters and Moldowan (1993) assigned tetracyclic terpane values > 1 to be hyper salinity while < 1, indicate
low salinity. The average value of 0.42 (Table 3a) in this study however indicates low salinity.
The C25/C26(S+R) tricyclic terpane ratio has been reported as a valuable tool in distinguishing marine from non-marine environments (Burwood et al., 1992; Hanson et al., 2000). Values higher than 1.0, indicate a marine environment, while values lower than 1.0, reflect non-marine environment. The C25/C26(S+R) ratios in the samples range from 0.57 – 0.84 (Table 3b) and indicate that the samples were deposited in non-marine environment or terrestrial environment.
SUMMARY AND CONCLUSIONSHydrocarbon generative potential and paleodepositional environment of subsurface sediments of the Kanadi-1 well, Bornu Basin, Nigeria were carried out. The source rocks are moderately rich in organic matter and are mainly types 111 and 1V organic matter . The dominance of C over C and C , indicates organic matter of 29 28 27
mainly terrigenous input and were deposited in environment ranging from anoxic to oxic
Pr – Pristane, Ph – PhytaneLong/short – ratio of long chain n-alkanes/short chain n-alkanes = (nC + nC + nC )/(nC + nC + nC ), Odd/even = (nC + 6nC + nC )/(4nC + 4nC27 29 31 15 17 19 21 23 25 22 24
Nton and Ekom: Hydrocarbon Generative Potential of Cretaceous Sediments
Sample No.
Depth
(m)
Pr/Ph
Pr/nC17
Ph/nC18
Odd/Even
Ratio
Long/ShortChain
KA-1
1240
0.23
0.10
1.53
1.19
0.12
KA-2
1340
0.45
0.22
0.78
0.95
0.51
KA-2A
1440
0.57
0.17
0.79
1.06
0.35
KA-2B
1590
-
-
1.30
1.01
-
KA-3
1690
0.54
0.32
1.24
0.96
0.13
KA-4
1940
1.63
1.93
0.82
1.01
0.10
KA-5
2040
1.81
3
1
1.04
-
KA-6
2190
1.74
2.24
0.84
1
0.03
KA-7
-
-
-
-
-
-
KA-8
2440
2.52
5.23
1.30
1.02
-
KA-9
2590
-
-
-
-
-
KA-10 2740 1.37 3.43 1.23 1.03 -
Average 1.20 1.85 1.10 1.03 0.21
Table 4: Gas Chromatographic Data Showing values of Isoprenoids, Isoprenoids/n-alkane Ratios and other Parameters for Kanadi-1 Well

241
conditions with greater oxic influence. The various thermal maturity parametes computed from terpanes and steranes distributions in the sediments indicate low thermal status. The study shows that the sediments have potential to generate mainly gas at appropriate thermal maturity.
ACKNOWLEDGEMENTSThe authors are grateful to the Nigeria Geological Survey Agency (NGSA), Kaduna, Nigeria, for provision of samples for this study. We are grateful to the Management and staff of Exxonmobil, Eket, Nigeria for permission to use its laboratory facilities for some aspects of this work. The authors are particularly grateful to Dr. Chidi Eneogwe and Late Dr. (Mrs) Margaret Inyang o f Geochemica l Labora to r y, ExxonMobil, QIT, Eket for technical assistance and useful discussions. We also appreciate the support and technical assistance of the staff of Weatherford Laboratory, U.S.A. for aspects of laboratory analyses. The assistance offered by Prof. Dayo Sonibare of Chemistry Department, University of Ibadan, Nigeria is invaluable.
REFERENCESAdegoke, O. S., Jan Du chene, R. E., Agamanu, A.
E. and Ajayi, P. O. 1973. Palynology and age of the Kerri-kerri Formation, Nigeria. Rev. Espan: Micropal, 10(2), 267 - 283.
Ajakaiye, D. E. and Burke, K. E. 1973. A Bouger gravity map of Nigeria. Tectonophysics, 16, 103-115
ASGA-UNESCO, 1963. Carte Geologique de L' Africa. 1:5,000,000. Feuille No. 2. Paris
Avbovbo, A. A., Ayoola, E. O. and Osahon, G. A. 1986. Depositional and structural styles in Chad Basin of North-eastern Nigeria. American Association of Petroleum Geologists Bulletin, 70, (12), 1787 - 1798.
Bignell, R. 1977. Petroleum developments in central and southern Africa. American Association of Petroleum Geologists Bulletin, Vol. 61 pp 1746-1794
Burke, K., 1976. The Chad Basin: an active intra-continental basin. Tectonophysics, 36, pp 197-206
Burwood, R., Leplat, P., Mycke, B., Paulet, J. 1992. Rifted margin source rock deposition: A carbon isotope and biomarker study of a
West African Lower Cretaceous "Lacustrine" section. Org. Geochem. Vol. 19, No. 1-3. pp. 41 – 52.
Carter, J.D., Barber, W. and Hones, G.P. 1963. The geology of parts of Adamawa, Bauchi , Bornu Provinces in North-Eastern Nigeria. Bulletin of Geological Survey, Nigeria. Vol. 30, 109p
Connan, J., Bouroullec, J., Dessort, D., and Albrecht, P. 1986. The microbial input in carbonate –anhydrite facies of a sabkha palaeoenvironment from Guatamala: a molecular approach. Organic Geochemistry Vol. 10 pp 29-50
Datta, G. C., Sivan, P., Jyoti, G., and Singh, R.R. 2008. Study of migration pathways of Mumbal high DCS oil through aromatic heterocyclic compounds, western offshore basin, India. Extended
thAbstracts, AAAPG, 7 International Conference and Exhibition on Petroleum Geochemistry and Exploration in the Afro-Asian Region, pp 138-147
Didyk, B. M., Simoneit, B. R. T., Brassell, S. C, Eglinton, G. 1978. Organic geochemical indicators of palaeoenvironmental conditions of sedimentation. Nature Vol. 272, No. 5650. P. 216 – 222.
Ekom, J. C., 2011. Hydrocarbon potential and paleodepositional environment of subsurface Cretaceous sediments from Kanadi Well, Bornu Basin, NE. Nigeria. Unpubl ished MSc. Disser tat ion, Department of Geology, University of Ibadan, 191p
Ekweozor, C. M. anf Udo, O. T. 1987. The Oleananes: Origin, maturation and limits of occurrence in southern Nigeria sedimentary basins. In: L. Mattavelli, L. Novelli (eds.). Advances in Organic Geo-chemistry. Oxford: Pergamon Press, 1988. P. 131 – 140.
Frankl, E. J. and Cordry, E. A. 1967.The Niger Delta oil province: Recent developments onshore and offshore , Proc. Seventh World Petroleum Congress, pp 195-209
Genik, G. J. 1992. Regional framework, structural and petroleum aspects of rift basins in Niger, Chad and the Central African Republic ( C.A.R). Tectonophysics, 213, 169-185
Nton and Ekom: Hydrocarbon Generative Potential of Cretaceous Sediments

242
Genik, G. J. 1993. Petroleum Geology of Cretaceous - Tertiary rift basins in Niger, Chad and Central African Republic. American Association of Petroleum Geologist Bulletin, Vol. 77 (8), 1405 - 1434.
Grantham, P.J. 1986. The occurrence of unusual C and C sterane predominances in two 27 29
types of Oman crude oil. Organic Geochemistry, 9, pp 1-10
Hanson, A. D., Zhang, S. C., Moldowan, J. M., Liang, D. G., and Zhang, B. M. 2000. Molecular organic geochemistry of the Tarim Basin, Northwest China II. American Association of Petroleum Geologist Bulletin Vol. 84. Pp 1109-1128
Huang, W. Y and Meischein, C. W. 1979. Sterols as ecological indicators. Geochem. Cosmochem Acta. Vol. 43, pp. 739 – 745.
Hunt, J. M. 1995. Petroleum Geochemistry and Geology. - New York: W. H. Freeman and Company.
Jackson, K. S., Hawkins, P. J., Bennet, A. J. R. 1985. Regional facies and geochemical evolution of southern Dension Trough, APEA Journal, Vol 20 pp 143-150
Mackenzie, A. S., Patience, R. L., Maxwell, J. R., Vandenbroucke, M. and Durand, B. 1980. Molecular parameters and maturation in the Toarcian shales, Paris Basin, France -1. Changes in the configurations of a cyclic isoprenoid alkanes, steranes and triterpanes. Geochem. Cosmochim. Acta. Vol. 44, No. 2 pp 1709-1721
Matheis, G. 1976. Short review of the geology of the Chad Basin in Nigeria. In: Kogbe, C.A. (Ed). Geology of Nigeria, Elizabethan Publishing, Nigeria, p. 289 - 294.
Moldowan, J. M., Sundararaman, P. and Schoell, M. 1986. Sensitivity of biomarker properties to depositional properties and/or source input in the Lower Toarcian of S.W. Germany. Organic Geochemistry, 10,915-926
Nton, M. E. and Arowosegbe, W. P. 2012. Sedimentological characteristics and aspects of hydrocarbon potential of Kinasar-1 well sediments, Bornu Basin, NE Nigeria. Mineral Wealth, 165, pgs27-44
Obaje, N. G., Moumouni, A., Goki, N. G. and Chaanda, M. S. 2011. Stratigraphy ,
paleogeography and hydrocarbon potential of the Bida Basin in North Central Nigeria. Journal of Mining and Geology Vol. 47 ( 2) pp 97-113
Obaje, N. G., Wehner, H., Scheeder, G., Abubakar, M.B. and Jauro, A. 2004. Hydrocarbon prospectivity of Nigeria's inland Basin: From the viewpoint of organic geochemistry and organic petrology. American Association of Petroleum Geologist Bulletin, Vol.88 (3), pp. 325 – 353.
Odusina, A. A., Mubarak, S. O. Beka, F. T. and Nwangwu, U. 1983. Geology and Petroleum Potential of the Nigerian Sector of the Chad Basin. Research Bulletin, Vol. III, Exploration Research Section(R & D), Project No. ER/RD/43, N. N. P. C., Port-Harcourt, Nigeria. 47p.
Okosun, E. A. 1995. Review of the Geology of Bornu Basin. Journal of Mining and Geology, Vol. 31(2) pp. 113 – 122.
Olugbemiro, R. O. 1997. The Hydrocarbon Potential , thermal maturity and paleoenvironments of the Cretaceous series in Bornu Basin, N.E. Nigeria. Ph.D Thesis. Institut und Museum fur Geologie and Palontologie der Universitat Tubingen, Germany.
Olugbemiro, R. O., Ligouis, B. and Abaa, S.l., 1997. The Cretaceous series in the Chad Basin northeastern Nigeria: source rock potential and thermal maturity. Journal of Petroleum Geology. Vol. 20(1), pp 51 – 68.
Peters, K. E. and Moldowan, J. M. 1993. The Biomarker Guide: Interpreting Molecular Fossils in Petroleum and Ancient Sediments. New Jersey: Prentice-Hall.
Schlumberger. 1985. Well evaluation Conference, Nigeria, 290pp
Seifert, W K. and Moldowan, J. M. 1980. Paleoconstruction by biological markers. Geoche. Cosmochem. Acta. Vol. 45, No. 6. Pp. 783 – 794.
Seifert, W. K. and Moldowan, J. M. 1986. Use of biological markers in petroleum exploration. In: Johns, P.B. (ed.). Methods in Geochemistry and Geophysics. Vol. 24; Elsevier, Amsterdam, Pp. 261 – 290.
Spiro, B., 1984. Effects of the mineral matrix on the distribution of geochemical markers in thermally affected sedimentary
Nton and Ekom: Hydrocarbon Generative Potential of Cretaceous Sediments

243
sequences. Org. Geochem. Vol. 6, pp. 543 – 559.
Tissot, B. P. and Welte, D. H. 1984. Petroleum ndFormation and Occurrence. 2 Ed. Springer-
Verlag, Berlin, Heidelberg, New York, Tokyo.
Van Krevelen, D. W. 1961. Coal typology, chemistry, physics and consti tution . Elservier, Amsterdam, 514p
Waples, D. W. 1985. Geochemistry in Petroleum Exploration, Boston: D. Reidel Publ. Comp.
Waples, D. W. and Machihara, T. 1991. Biomarkers for geologists: A Practical Guide to the Application of Steranes and Triterpanes
in Petroleum Geology. American Association of Petroleum Geologists Methods in Exploration, 9.
Whiteman, A. J. 1971. Compilation on Petroleum Geology of Nigeria. Ibadan University Library
Whiteman, A. J., 1982. Nigeria: Its Petroleum Geology, Resources and Potential. Graham and Trotman Publication. London. pp 1 – 394.
Wright, J. B., Hastings, D. A., Jones, W. B. and Williams, H.R. 1985. Geology and Mineral Resources of West Africa. George Allen and Unwin, London. 171pp
Nton and Ekom: Hydrocarbon Generative Potential of Cretaceous Sediments