Embed Size (px)
Citation preview

© 2014 Navigant Consulting, Inc.
NSTAR Smart Grid Pilot
Final Technical Report
Prepared for:
U.S. Department of Energy
On behalf of NSTAR Gas and Electric Corporation
Prepared by:
Stuart Schare, Director
Erik Gilbert, Director
Bethany Glinsmann
Mike Sherman
Jane Hummer
Brian Eakin
Navigant Consulting, Inc.
1375 Walnut Street
Suite 200
Boulder, CO 80302
303.728.2500
www.navigant.com
June 30, 2014
NSTAR Smart Grid Pilot– Final Technical Report Page i June 30, 2014
Table of Contents
Preface ........................................................................................................................................ iii
Executive Summary ................................................................................................................. iv
1 Scope .................................................................................................................................... 1
1.1 Objectives ............................................................................................................................................. 2
1.2 Recipient Team Overview .................................................................................................................. 2
2 Technical Approach and Pilot Program Description ................................................. 4
2.1 Alternative Rate Structures ................................................................................................................ 5
2.2 Smart Grid Technology ...................................................................................................................... 6
2.3 Data Collection .................................................................................................................................. 10
2.4 Analysis of Energy Savings Benefits .............................................................................................. 12
3 Impact Assessment ......................................................................................................... 13
3.1 Peak Period Load Impacts ............................................................................................................... 14
3.2 Event Impacts .................................................................................................................................... 18
3.3 Energy Impacts .................................................................................................................................. 23
3.4 Bill Impacts ......................................................................................................................................... 26
3.5 DOE Metrics and Benefits Reporting ............................................................................................. 27
4 Program Processes ........................................................................................................... 29
4.1 Marketing and Recruitment ............................................................................................................. 30
4.2 In-Home Equipment Installation .................................................................................................... 37
4.3 Systems Integration and Billing ...................................................................................................... 40
4.4 Program Operation ........................................................................................................................... 42
5 Technology Assessment ................................................................................................ 49
5.1 Customer-Facing Technology ......................................................................................................... 49
5.2 System Infrastructure ....................................................................................................................... 58
5.3 Effective Functionality of the AMR/HAN/Broadband Architecture.......................................... 64
6 Conclusions ...................................................................................................................... 66
6.1 Key Takeaways .................................................................................................................................. 66
6.2 Implications for the Future .............................................................................................................. 68
6.3 Looking Ahead .................................................................................................................................. 69

NSTAR Smart Grid Pilot– Final Technical Report Page ii June 30, 2014
Appendices under Separate Attachment
Appendix A Impact Analysis Data Requirements and Methodology
Appendix B Impact Analysis Detailed Results
Appendix C Marketing and Recruitment Plan
Appendix D Customer Group Assignment Process
Appendix E Customer Perspectives

NSTAR Smart Grid Pilot– Final Technical Report Page iii June 30, 2014
Preface
Navigant Consulting, Inc. has prepared this evaluation of NSTAR’s Smart Grid pilot in fulfillment of
reporting requirements for the U.S. Department of Energy’s (DOE’s) Smart Grid Demonstration grant
program. The format of this document follows DOE’s Technical Performance Report guidelines (June 17,
2011). Much of the information contained in this report also fulfills requirements and expectations of the
Massachusetts Smart Grid Collaborative Technical Subcommittee, as put forth in the Collaborative’s
Common Evaluation Framework (March 23, 2011). For example, the impact tables in Appendix B present
findings broken down by demographic subgroup (e.g., low-income, homes with presence of a senior),
which is not a DOE requirement.
NSTAR began recruiting participants to the pilot in 2010 and expanded participation throughout 2011
and into the first half of 2012. For purposes of DOE’s Smart Grid Demonstration, the official beginning of
the 24-month pilot was January 1, 2012. Thus, the billing data used for estimation of energy and peak
period load reductions covers the period January 2012 through December 2013.

NSTAR Smart Grid Pilot– Final Technical Report Page iv June 30, 2014
Executive Summary
NSTAR Electric & Gas Corporation (“the Company”, or “NSTAR”) developed and implemented a Smart
Grid pilot program beginning in 2010 to demonstrate the viability of leveraging existing automated
meter reading (AMR) deployments to provide much of the Smart Grid functionality of advanced
metering infrastructure (AMI), but without the large capital investment that AMI rollouts typically
entail. In particular, a central objective of the Smart Energy Pilot was to enable residential dynamic
pricing (time-of-use [TOU] and critical peak rates and rebates) and two-way direct load control (DLC) by
continually capturing AMR meter data transmissions and communicating through customer-sited
broadband connections in conjunction with a standards-based home area network (HAN).
The pilot program offerings to customers consisted of 1) a set of new rate options and 2) a set of
technologies to enable interval metering, provision of enhanced customer information about pricing and
electricity consumption, and (for some participants) automated load response. Each of four customer test
groups in the pilot received a unique combination of rates and technologies in order to test hypotheses
regarding the impact of technology on load reduction, energy consumption, and the interaction of
various technologies and rate structures. Table ES-1 presents a summary description of the four test
groups, including the number of participants in each group.
Table ES-1. Smart Grid Pilot Customer Test Groups
Test Group Description of Test Groupa AC Load Controlb
Number of Participants
1 Enhanced Information Access to information on energy consumption only; standard rate
1,021
2 Peak Time Rebate $5 rebate for automated participation in “critical peak” events via NSTAR control of a smart thermostat; standard rate
422
3 TOU Rate plus Critical Peak
Pricing (CPP) c
TOU rate with CPP; smart thermostat controlled by NSTAR during CPP events
380
4 TOU rate with CPP 894
Total 2,717
Source: NSTAR a All groups received an Internet gateway and an in-home energy display. b Air-conditioning (AC) load control refers to remotely raising temperature set-points of programmable communicating thermostats controlling participants’ central AC systems. c NSTAR established peak period TOU and CPP rates significantly above NSTAR’s standard residential basic service rate in order to provide an effective price incentive for customers to shift usage off-peak. The TOU peak supply price was more than double the standard supplier charges, while the off-peak rate was approximately 60% of the otherwise applicable supply rate. The CPP rate was significantly higher still, at more than ten times the standard supply rate during critical events.

NSTAR Smart Grid Pilot– Final Technical Report Page v June 30, 2014
By January 2012 when the 24-month pilot operation period officially began for purposes of the U.S.
Department of Energy (DOE) Smart Grid Demonstration project, NSTAR had enrolled approximately
3,600 customers and ultimately installed the enabling Smart Grid equipment at roughly 2,700 homes. As
of the end of the pilot, approximately 1,500 customers remained enrolled, or roughly 57% of initial
participants.
Evaluation Methods
The data collection and analysis approach was developed to meet the needs and regulatory requirements
of both process and impact evaluation. Because of the technology demonstration goals, data collection
was enhanced to include information to help understand the performance, reliability, and effectiveness
of the Smart Grid technology. Thus, data collection was intended to meet the needs of multiple
constituencies, including the DOE, the Massachusetts Department of Public Utilities, and NSTAR itself.
To meet these diverse needs, data collection consisted of three different data sources:
1. Interval meter data provided by the pilot technology along with demographic, weather, and
other data needed to perform a statistically significant impact evaluation
2. Survey data collected from participants at various points in time throughout the pilot and
addressing a variety of topic areas including use and acceptance of the technology, experience
with installation, and overall views toward the program
3. Technology data generated by, or developed to track the performance of, various elements of
the technology platform to help better assess the performance of the technology itself
The estimation of the consumption impacts of all four test groups used hourly and/or monthly meter
data collected for each participant as well as for the control group. The evaluation treated all of the
individual time series as a single panel (or longitudinal) data set; that is, a data set that is both cross-
sectional (including many different individuals) and time series (repeated observations for each
individual). The consumption impacts of all four groups were then estimated using fixed-effects
regression analysis with weather normalization.
Energy and Peak Demand Savings
The purpose of the impact analysis was to quantify changes in energy consumption and peak period
demand resulting from participation in each of the four test-group components of the pilot program.
Based on participant consumption data from January 2012 through December 2013, major findings of the
impact analysis include the following:
» Peak period load impacts. Customers on the TOU/CPP rates (Groups 3 and 4) reduced summer
peak period loads by approximately 0.2 kilowatts (kW), or about 15% of their average peak
period load. Customers on the standard rate also reduced their load during peak hours, but only
by approximately half as much as customers on the TOU rate (Figure ES-1).

NSTAR Smart Grid Pilot– Final Technical Report Page vi June 30, 2014
Figure ES-1.Average Peak Period Load Reductions
Source: Navigant analysis
» Impacts of critical events. Customers with automated load control of central air conditioning
(Groups 2 and 3) reduced demand by approximately 0.5 kW during events (roughly 20-25%).
Customers on the TOU/CPP rate without automated load control reduced consumption by an
average of 0.13 kW (9%) during events.
» Annual energy impacts. Customers on the TOU/CPP rates reduced their annual energy
consumption by approximately 2%, while customers on the standard rates did not show a
statistically significant change in consumption. The analysis shows that savings have decreased as
the pilot progressed, with summer 2012 savings exceeding summer 2013 savings (roughly 2%
savings vs. no savings across all participants) and changes in winter consumption moving from
a moderate decrease during the first winter (roughly 3%) to a similar increase in the last three
months of 2013.
Customer Interest, Energy Impacts, Technology Performance, and Participant
Engagement
Several broad themes emerged from the evaluation, based on the specific findings of the impact
evaluation and a review of pilot program processes, technology performance, and customer viewpoints.
Key takeaways from the pilot with respect to customer interest, energy impacts, technology
performance, and participant engagement are as follows:
1. Smart Grid offerings may appeal to only a limited segment of the population—principally
educated, affluent, and technologically savvy customers—absent long-term education efforts
and innovative marketing approaches to pique the interest of the broader customer base.
Customer interest in the pilot was relatively strong initially, with response rates to NSTAR’s
direct mail and email marketing efforts of 4% and 7%, respectively, compared to the 2% to 4%
90% Confidence Interval
Peak Period Load Reductions

NSTAR Smart Grid Pilot– Final Technical Report Page vii June 30, 2014
response rates typically seen in Smart Grid program recruitment.1 While the overall response
rate was high, customers expressing interest and enrolling in the pilot were primarily highly
educated, affluent households, often with an expressed or demonstrated interest in technology.
Despite concerted efforts by NSTAR to market all customers in the pilot territory, low-income
customers did not enroll in high numbers, as evidenced by only about one percent of
participants being on the R2 rate and roughly four percent reporting income below 60% of the
median level for their household size.
2. Pilot impacts on energy consumption were consistent with industry experience in several
respects (e.g., peak period reductions from TOU rates and load control), but were inconclusive
with regard to whether the pilot’s provision of energy usage information enables significant
reductions in overall energy consumption. The pilot’s technology and rate offerings were
designed to enable three types of reduced consumption: 1) peak period load reductions, 2) load
curtailments during critical events, and 3) overall reduction in energy consumption
(monthly/seasonally/annually). Consistent with industry experience, the pilot successfully
demonstrated peak period reductions, particularly for customers on TOU rates. NSTAR
specifically designed peak rates to be significantly higher than off-peak rates in order that
participants could reduce their electricity bills by shifting load away from peak hours.2 Load
curtailment during critical events was also successful, particularly where long-established DLC
of central air conditioners was employed.3 Less certain is whether the Smart Grid’s provision of
access to energy consumption information successfully encourages and enables customers to
save energy over the long term. Energy savings was minimal (2% on average for those on TOU
rates, and a statistically insignificant change for others), with all groups showing a marked
decline in savings after the first nine months of the pilot.
3. The pilot demonstrated that the technology architecture is capable of AMI-like features
through the collection of interval meter data, but that it is not yet viable for the widespread
provision of customer information and dynamic rate tariffs. While the pilot generally
demonstrated the capability to deliver on these objectives for many customers, most of the time,
the lack of reliability remains a major functional limitation. The following are among the
significant reliability issues that must first be addressed before a similar system is deployed on a
large scale as an alternative to revenue-grade metering:
a. Usability of the technologies, from the thermostat that was difficult to install, to the
accessibility of customer data, which was not available on mobile applications;
1 Smart grid marketing response rates are based on market research conducted by Navigant for the NSTAR Smart
Grid Pilot Implementation and Marketing Plan, March 2010 (see Appendix C).
2 Over the past decade, many utilities have developed TOU and CPP rates with much larger peak- to off-peak price
differentials than in previous years. See Schare, S., “TOU Rates as TOU Rates As If Prices Mattered: Reviving an
Industry Standard for Today’s Utility Environment,” American Council for an Energy-Efficient Economy (ACEEE)
Summer Study, August 2008.
3 The pilot was among a small minority of demand response programs in its use of customer broadband to
communicate load control signals to participants. However, the achievement of consistent load reductions from
direct load control, typically via radio frequency or very-high-frequency (VHF) paging, is well established in the
industry.

NSTAR Smart Grid Pilot– Final Technical Report Page viii June 30, 2014
b. Data intermittency from HAN system disconnections and temporary failure of back-end
systems, both of which led to gaps in meter data that rendered TOU rates incomplete
and resulted in defaults to the flat rate;
c. Complexity and inconsistency of meter data validation/estimation process, which caused data
gaps and mis-alignment of intervals, resulting in differences in monthly consumption
estimates between the interval data from the pilot architecture and the monthly drive-by
reads from NSTAR’s standard meter reading procedures.
Advances in technology since the initial pilot Soft Launch in 2010—such as wireless gateways
using IP, extended on-site storage of information, and mobile phone apps—suggest that at least
some of the issues raised by the pilot may be substantially resolved and that a similar approach
to reading the AMR meters but leveraging these newer technologies might be more effective,
and possibly lower cost.
4. Participant perspectives on the pilot were generally positive, but the trend of diminishing
interest over time raises questions about the long-term impacts of a future offering, especially
if provided to all customers on an opt-out basis. The positive customer reviews of the pilot are
a testament to the strong delivery and positive messaging that NSTAR put forth from initial
marketing to final closeout of the pilot. However, this is offset by the decline in enrollment by
more than one-third over less than two years, and the decline in participant engagement (even
among those who remained in the pilot, as evidenced by declining energy impacts and reduced
use of the web portal and in-home displays). The implication is that a program requiring
sustained engagement may not be for all customers; even those initially enthusiastic may lose
interest over time.
Implications for the Future
Taken collectively, the above takeaways have several broad implications for the future of a possible
customer-facing Smart Grid offering at NSTAR based on AMR meters and customer broadband:
1. The pilot achieved its “technology validation” objective, including verification that “smart
meter” functionality can be achieved without deployment of an advanced metering
infrastructure. The general pilot architecture approach, after improvements in technology
and data management, can be an effective, low-cost way for NSTAR or other utilities with
AMR meters to enable energy information and TOU rates for customers who want it, without
investing in new metering infrastructure for all customers.
a. The residential sector is limited as a source of reducing peak load costs to lower costs
for all ratepayers. As a group, residential customers are not the driver of peak loads
within NSTAR’s service territory. The ISO New England system peak occurs between
1pm and 5pm, before many residential customers return from work outside the home.
This is part of the reason that residential customers account for only about 38% of
NSTAR summer peak load,4 and it implies that targeting the residential sector en masse
4 Source: NSTAR and Massachusetts Residential Appliance Saturation Survey (RASS), prepared by Opinion
Dynamics Corp. for NSTAR and four other Massachusetts utilities, April 2009. The RASS study found a central AC
saturation of 32%, a figure that NSTAR estimates has now reached 38%.

NSTAR Smart Grid Pilot– Final Technical Report Page ix June 30, 2014
could be a high-cost/low-impact approach—especially if many customers do not actively
respond to the technology and rate offering.
b. Only a narrow segment of the population is likely to participate or contribute to
savings. The pilot demonstrated that interest among customers is predominantly among
more affluent and educated customers, with the relatively few low-income participants
showing an interest or ability to conserve energy. These demographic groups represent
only a small share of the population. In addition, NSTAR survey research revealed that
nearly half of customers who did not respond to the pilot offering would not be
persuaded regardless of what NSTAR offered. Even the most subscribed TOU rates in
the country have attracted no more than half of the residential population, and DLC
programs only about 25-30% of eligible customers.
c. Savings will come from larger customers with discretionary loads. NSTAR’s vision is
to track technological progress and when appropriate deploy a more robust version of
the pilot architecture. Target markets would be customers who express interest in
reducing and shifting loads and those with large discretionary loads—particularly those
with central air conditioning (roughly 38% of NSTAR’s residential customer base) or
pool pumps, who have the greatest opportunity to change their energy usage patterns.
2. The market offering must communicate to customers that they have an important role to play
in ensuring the system functions as designed. Customers have a reciprocal role in that NSTAR
will need customers to help maintain the operability of the in-home devices and broadband
communications in order for NSTAR to provide usage information and to bill customers on
dynamic rates.
3. A successful offering of dynamic rates and visibility into customer usage information will
require an aggressive and intelligent marketing effort to reach customers and engage them to
act over a sustained period of time. The pilot demonstrated that only a relatively narrow
segment of the population tends to be interested in the technology and rate offerings embodied
in the pilot, and many of these customers lost interest during the course of their participation.
Keeping customers engaged after the initial few months or first year of a Smart Grid offering
will likely require the incorporation of apps for mobile devices where energy information is
more readily accessible and occasional push messaging and event notifications can engage
customers without their having to initiate the engagement.5 To make a similar program a
success, NSTAR is in a position to draw on its long history as an energy efficiency program
administrator, leveraging innovative marketing approaches to reach the targeted customer base.
A decision to invest in a future rollout of similar Smart Grid architecture and program offerings should
be assessed based on the costs relative to the achievable benefits. An important consideration will be
who bears the costs and to whom the benefits accrue—to NSTAR, its participating customers, all NSTAR
ratepayers, or all electricity consumers in the region.
5 Some participants asked for mobile apps via the pre-pilot and mid-point surveys, but the pilot technology suite
had already been established.

NSTAR Smart Grid Pilot– Final Technical Report Page 1 June 30, 2014
1 Scope
NSTAR Electric & Gas Corporation (“the Company” or “NSTAR”) developed and implemented a Smart
Grid pilot program beginning in 2010 to demonstrate the viability of leveraging existing automated
meter reading (AMR) deployments to provide much of the Smart Grid functionality of advanced
metering infrastructure (AMI), but without the large capital investment that AMI rollouts typically
entail.6 In particular, a central objective o f the pilot was to enable residential dynamic pricing (time-of-
use [TOU] and critical peak rates and rebates) and two-way direct load control (DLC) by continually
capturing AMR meter data transmissions and communicating through customer-sited broadband
connections in conjunction with a standards-based home area network (HAN). This enabled recording of
interval consumption data and transfer of data to NSTAR via a two-way communications pathway,
which was also used for sending load control signals and measuring demand response load impacts.
By January 2012 when the 24-month pilot operation period officially began for purposes of the U.S.
Department of Energy (DOE) Smart Grid Demonstration project, NSTAR had enrolled approximately
3,600 customers and ultimately installed the enabling Smart Grid equipment at roughly 2,700 homes. As
of the end of the pilot, approximately 1,500 customers remained enrolled, or roughly 57% of initial
participants.7 The pilot sampling design, including alternative rates and enabling technologies, allows
for data useful to utilities across the country regarding the interaction of rates and technology to yield
optimal levels of load reduction and customer acceptance.
In developing this pilot plan, the Company adhered to the following principles:
» Leverage recent technology investments. AMR meters were recently deployed throughout the
Company’s service territory. The cost savings and other benefits of the deployment help
improve customer service and provide other operational efficiencies. The Smart Grid pilot
employs broadband technology that can utilize the existing infrastructure to provide two-way
communication and interval metering more economically than via investment in AMI.
» Maintain flexibility for future Smart Grid technology. The pilot was designed to retain
flexibility to potentially integrate with other future Smart Grid technology. The in-home
communications hardware and load control equipment use a common, standards-based,
nonproprietary (Internet Protocol [IP] and ZigBee) HAN protocol that are compatible with
foreseeable alternatives to the proposed Smart Grid architecture. Thus, if the pilot rate structures
and technology functionality proved to be worthy of a more widespread deployment, the
6 In its 2008 report to Congress on advanced metering, the Federal Energy Regulatory Commission (FERC)
cautioned regulators and utilities to protect against functioning, non-depreciated assets (such as AMR investments)
from becoming obsolete. See FERC, 2008 Assessment of Demand Response and Advanced Metering, Staff Report,
December 2008, p. 21. U.S. utilities have already invested in tens of millions of AMR meters, accounting for
approximately 25% of all meters nationwide and 80% of meters in the Northeast. Source: Dr. Howard Scott, The Scott
Report: Worldwide Deployments of Automated Metering Services, May 2009.
7 Enrolled customer counts are recorded in a Tendril data file “showRegUsers.” The final showRegUsers file dated
November 30, 2013 (prior to the beginning of de-enrollment in December 2013) listed 1,549 customers enrolled.

NSTAR Smart Grid Pilot– Final Technical Report Page 2 June 30, 2014
Company could then select from among the latest IP and HAN technology offerings to enable
the Smart Grid of the future.
1.1 Objectives
Specific objectives for the pilot included the following:
» Validate technology objectives, including the verification that two-way communications,
“smart meters,” and embedded automated load management can be achieved by using currently
deployed AMR infrastructure in conjunction with technology from the preferred vendor and
customers’ broadband Internet service.
» Identify customer perceptions and views on pilot offerings. Customer views were obtained by
reviewing technical data on load reductions and critical event overrides, through call center
records, and via evaluation surveys conducted at several phases of the pilot.
» Provide sound technical, economic, and marketing information that can be used to inform the
Company’s future Smart Grid investment decisions. As part of its pilot, the Company gathered
data in order to be able to answer a variety of research questions addressing program designs,
rate structures, technology offerings, and implementation approaches.
» Meet load reduction targets, which included reduction of usage during the peak period by a
minimum of 5% for participating customers.
» Assess the impact on low-income customers and the manner in which this customer group
used the information to modify energy usage, if any. Various participant demographic data,
including income, were analyzed in the pilot evaluation in order to inform if and to what extent
low- income participants used this information to modify energy usage.8
1.2 Recipient Team Overview
Key members of the Smart Grid project team included the following:
NSTAR. Several organizations of the Company have been actively engaged in this project, including
Engineering, Customer Care, Accounting, Information Technology, Corporate Relations, and more.
Much of the work to implement the project was performed by NSTAR’s contracting partners, as
described below.
Tendril Networks. Tendril delivered its hardware solution to NSTAR according to the final rollout plan.
A major role for Tendril was to work with NSTAR, both remotely and on-site, to establish the back-office
system integration. Data protocols were refined to ensure that AMR data was successfully converted to a
nonproprietary IP that can be communicated via customers’ broadband connections to Tendril servers.
From there, the data format was modified to ensure compatibility with NSTAR Customer Information
Systems (CIS) and billing systems such that NSTAR could use the new interval data (as opposed to
monthly single-point reads) to calculate TOU-based bills.
8 As of the time of this report, NSTAR is in the process of conducting focus groups with low-income participants to
further inform the findings for this segment.

NSTAR Smart Grid Pilot– Final Technical Report Page 3 June 30, 2014
Tendril also served as the implementation contractor assisting in developing the overall customer value
propositions and associated messages and literature formats for customer recruitment, enrollment, and
installation processes. Tendril and its subcontractor oversaw the scheduling and execution of equipment
installation at participants’ homes, tracking contacts with customers who agreed to participate and
reporting back to NSTAR in order that program managers and marketing staff could monitor progress.
The Tendril team also arranged for on-site visits to install the equipment where necessary and to educate
customers about the program, use of the equipment, and common actions that may be taken to reduce
consumption in general and during peak periods or critical peak events. Where appropriate, the Tendril
team also ensured that in-home displays were receiving meter and cost data and that customers had
access to the web portal to view more detailed information and could adjust thermostat settings (for
those participants receiving smart thermostats).
Navigant Consulting, Inc. (Navigant) had the role of evaluating the program’s impacts, technical
viability, and processes. Impact Evaluation addresses the changes in total energy consumption, peak
period loads, and customer bills resulting from participation in the program. Changes in total energy
consumption were calculated by comparing meter data from the various participant groups to data from
a control group. Changes in peak demand were estimated using statistical regression modeling and
comparing the expected peak usage with the actual peak usage based on interval meter data. Technology
Assessment addresses the reliability and customer acceptance of the various technologies associated
with the Smart Grid architecture. Process Evaluation encompasses a review of how well the Company is
administering the program and how customers perceive the program.

NSTAR Smart Grid Pilot– Final Technical Report Page 4 June 30, 2014
2 Technical Approach and Pilot Program Description
The pilot program offerings to customers consisted of 1) a set of new rate options and 2) a set of
technologies to enable interval metering, provision of enhanced customer information about pricing and
electricity consumption, and (for some participants) automated load response. Each of four customer test
groups in the pilot, as described below, received a unique combination of rates and technologies in order
to test hypotheses regarding the impact of technology on load reduction, energy consumption and the
interaction of various technologies and rate structures. Table 2-1 presents a summary description of the
four test groups, including the number of participants in each group.9
Table 2-1. Smart Grid Pilot Customer Test Groups
Test Group Description of Test Groupa AC Load Controlb
Number of Participants
1 Enhanced Information Access to information on energy consumption only; standard rate
1,021
2 Peak Time Rebate $5 rebate for automated participation in “critical peak” events via NSTAR control of a smart thermostat; standard rate
422
3 TOU Rate plus Critical Peak
Pricing (CPP) c
TOU rate with CPP; smart thermostat controlled by NSTAR during CPP events
380
4 TOU rate with CPP 894
Total 2,717
Source: NSTAR a All groups received an Internet gateway and an in-home energy display. See subsections below for a more detailed description of the rates and equipment provided to the various test groups. b Air conditioning (AC) load control refers to remotely raising temperature set-points of programmable communicating thermostats controlling participants’ central AC systems. c NSTAR established peak period TOU and CPP rates significantly above NSTAR’s standard residential basic service rate in order to provide an effective price incentive for customers to shift usage off-peak. The TOU peak supply price was more than double the standard supplier charges, while the off-peak rate was approximately 60% of the otherwise applicable supply rate. The CPP rate was significantly higher still, at more than ten times the standard supply rate during critical events.
The first two subsections below present the alternative rate structures and technology options used in
the experimental design. The third subsection provides detail on the various data collection approaches
used to understand and evaluate the results of the pilot.
9 NSTAR’s initial goals were to attract approximately 700 participants to each of the four groups. However,
participation in Groups 2 and 3 required that customers have a one-zone central air conditioning system and that
they be willing to replace their thermostat with the pilot thermostat. Consequently, since many participants did not
have central air conditioning, many were assigned to Groups 1 or 4, resulting in higher participation levels for these
groups.

NSTAR Smart Grid Pilot– Final Technical Report Page 5 June 30, 2014
2.1 Alternative Rate Structures
In place of the standard electricity rate, most participants in the pilot received service under one of the
following two new rate designs:
1. A new TOU rate with CPP for events called by NSTAR
2. A critical peak rebate overlaid on the standard applicable rate, with a pre-established rebate
amount awarded to customers who utilized automated thermostat controls or an automated AC
load control switch to reduce load during critical peak events
There was also one customer segment that received a base suite of in-home technology but stayed on
their otherwise applicable standard rate, which allowed NSTAR to assess the achievable load reductions
from a technology-only option that did not require customers to change rates.
2.1.1 Time-of-Use Rate with Critical Peak Pricing
Table 2-2 presents an example of the total electricity rate for TOU, including delivery charges and the
variable electricity supply price for participants on the TOU with CPP rates. For customers on the TOU
with CPP rate structure, the peak supply price was more than double the standard supplier charges, and
the CPP rate was roughly ten times the standard charges. The off-peak rate provided roughly a 40%
discount off the standard charges. Note that the rate differential applied to the supplier charge portion of
the bill; the delivery portion of the bill remained unchanged for customers taking service under this rate.
Table 2-2. Illustrative TOU and CPP Rate Periods and Prices
Note: Actual supplier charges and total prices were recalculated periodically throughout the program in order to maintain the relative price differentials for each period and ensure revenue neutrality (pilot rates vs. standard rates) based on then-current supply costs. The “Total Electricity Price” and “Approximate Price Ratios” presented here applied to customers on the standard rate.
Source: NSTAR
2.1.2 Critical Peak Rebate
As compared to the TOU/CPP rate, the critical peak rebate was a no risk alternative intended to address
peak demand by providing a financial incentive for customers to reduce load during critical events
called by NSTAR. Supplier charges under this rate were according to each participant’s standard
applicable rate; however, when a critical event was in effect, participants were eligible for a rebate. All

NSTAR Smart Grid Pilot– Final Technical Report Page 6 June 30, 2014
customers participating in the critical peak rebate offering were required to have central air conditioning
and were provided a smart thermostat that enabled automated load control by adjusting AC
temperature during events.
Participants agreed to allow a temperature increase of between 1 and 6 degrees (the amount varied by
event, as determined by NSTAR), and they had the option to override the setting. All participants who
did not override the load control setting during a given event received a $5 rebate for that event. Rebates
were cumulative and were reflected as a reduction on the customer’s monthly bill. Customers who
overrode the temperature setting (i.e., lowered the temperature during the event) did not receive the
rebate for that event but were eligible for rebates during subsequent events.
2.2 Smart Grid Technology
The technology architecture was designed to leverage existing, deployed AMR meters by connecting
these meters to NSTAR and the relevant NSTAR internal processes through a set of in-home, cloud-
based, and back-office technologies. In this way, the AMR meters were intended to provide AMI-like
capabilities—such as the ability to provide billing information for CPP programs as described above or
providing interval consumption data to participants—but without the cost of a complete AMI
infrastructure deployment.
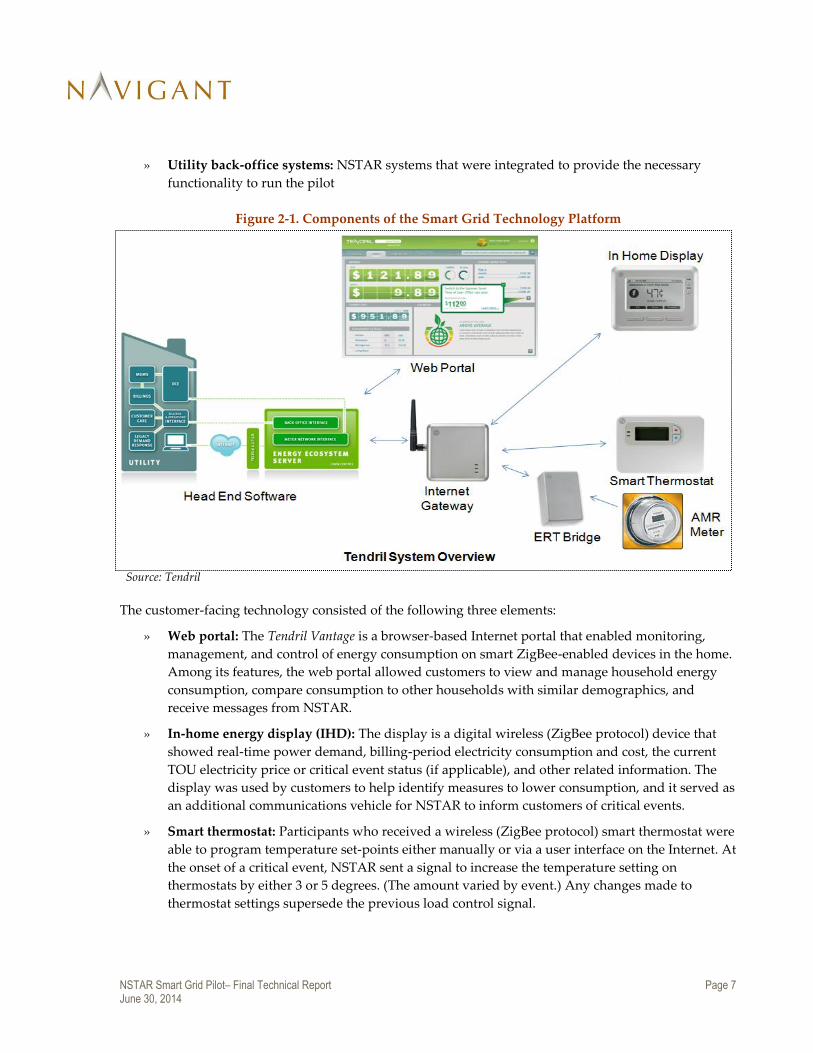
The technology deployed to provide these capabilities is shown in Figure 2-1. The architecture consisted
of several pieces of in-home technology that communicated with each other wirelessly—including the
customer’s AMR meter—and which then connected to a cloud-based technology platform via customer-
provided broadband. The cloud-based technology platform in turn connected to NSTAR via a secure
Internet connection and was integrated with several of NSTAR’s back-office systems to provide the
required capabilities for the Demonstration. The in-home equipment and technology platform were
provided by Tendril.
This technology infrastructure was intended to establish a reliable backhaul communications pathway
from the meter to NSTAR’s internal systems and allow meter reading resolution suitable for TOU and
CPP rate plans. The deployed equipment also enabled automated load control of central air conditioning
and provided customer information via in-home displays and an Internet-based web portal.
The technology shown in the figure can be divided into the following functional categories:
» Customer-facing technology: These are elements that allowed direct communication with pilot
participants and provided consumption, pricing, and other information to the participants.
These elements were the focus of much of the customer survey work performed in the
evaluation.
» In-home infrastructure: These are elements that enabled the communication pathways within
the home via ZigBee low-power radio connectivity and provided communication, via the
customer- provided broadband, to the cloud-based platform capabilities and the NSTAR back-
office systems.
» Cloud-based platform: Provided the central control and management functionality for the pilot
system
NSTAR Smart Grid Pilot– Final Technical Report Page 7 June 30, 2014
» Utility back-office systems: NSTAR systems that were integrated to provide the necessary
functionality to run the pilot
Figure 2-1. Components of the Smart Grid Technology Platform
Source: Tendril
The customer-facing technology consisted of the following three elements:
» Web portal: The Tendril Vantage is a browser-based Internet portal that enabled monitoring,
management, and control of energy consumption on smart ZigBee-enabled devices in the home.
Among its features, the web portal allowed customers to view and manage household energy
consumption, compare consumption to other households with similar demographics, and
receive messages from NSTAR.
» In-home energy display (IHD): The display is a digital wireless (ZigBee protocol) device that
showed real-time power demand, billing-period electricity consumption and cost, the current
TOU electricity price or critical event status (if applicable), and other related information. The
display was used by customers to help identify measures to lower consumption, and it served as
an additional communications vehicle for NSTAR to inform customers of critical events.
» Smart thermostat: Participants who received a wireless (ZigBee protocol) smart thermostat were
able to program temperature set-points either manually or via a user interface on the Internet. At
the onset of a critical event, NSTAR sent a signal to increase the temperature setting on
thermostats by either 3 or 5 degrees. (The amount varied by event.) Any changes made to
thermostat settings supersede the previous load control signal.

NSTAR Smart Grid Pilot– Final Technical Report Page 8 June 30, 2014
The other in-home infrastructure consisted of the following elements:
» AMR meter: The customer’s automated meter reading meter—already deployed at the customer
site prior to the pilot—measures customer consumption and transmits the readings via Encoder
Receiver Transmitter (ERT)10 radio signal at frequent intervals so that they can be picked up by
drive-by utility trucks for monthly readings.
» ERT bridge: This element was able to read the ERT signal from the AMR meter to get household
consumption data, and translate that signal into ZigBee radio signal to communicate with the
other in-home devices, which all communicate via the ZigBee protocol.
» Internet gateway: All participating homes were equipped with an Internet gateway connected to
a wireless (ZigBee protocol) Home Area Network (HAN). This gateway transmitted
consumption data from the meter to NSTAR via the ERT bridge and allowed communication
back to in-home energy displays.
These technologies constituted the Smart Grid from the customer perspective. They provided feedback
on energy consumption (via an in-home display or a web portal) and offered participants the
convenience of remotely controlling household temperature. The automated response to critical events
was intended to allow for greater load reductions and bill savings.
The utility head-end and back-office elements consisted of the following elements, also shown in Figure
2-1.
» Tendril Energy Ecosystem Server: Provided the central control and management functionality
for the Tendril system, including Internet connectivity to the participant household equipment
and to the NSTAR back-office systems via secure connection. It also performed such functions as
enrolling and tracking status of pilot participants, collecting consumption data, and managing
demand events.
» Utility Back-Office Systems: These are production systems as well as pilot-specific systems at
NSTAR that were integrated to perform necessary functions for the pilot, including using pilot
data for billing and managing participant calls at the call center.
10 ERT is low-power radio operating in the 900-megahertz (MHz) ILM band and designed specifically for drive-by
meter reading applications. ERT is a trademark of Itron, Inc.

NSTAR Smart Grid Pilot– Final Technical Report Page 9 June 30, 2014
A more utility-centric view of this functionality is shown in Figure 2-2, which shows the various
communication pathways between the utility and the home. The Tendril platform provided the
capability of utilizing the customer’s existing Internet connection as the communications backhaul.
Figure 2-2. Communications Pathway to and from the Customer Home
Existing AMR meters
allow “drive-by” meter reads
NSTAR is now
intercepting the AMR signal
and sending load data back
to the utility using the internet
NSTAR can provide
organized billing information
back to the customer
DR events can also be
called via broadband; and
evaluated with the
available customer data
Source: Tendril, adapted by Navigant
As shown in Figure 2-2 (see numbered items):
1. The AMR meters transmit ERT radio signals that allow meters to be read by trucks driving by.
2. Alternatively, using this new platform, the meter readings were gathered continuously and
transmitted to NSTAR via customer broadband and secure Internet connection. In addition,
since the wireless meter readings are transmitted much more frequently (from 8- to 30-second
intervals) than trucks typically drive by (once per month), these time-stamped wireless readings
could track the meter consumption readings with much more time granularity.
3. The broadband connection also provided the pathway for NSTAR to communicate directly to
the customer via secure Internet connection, and provided consumption, bill estimation, or event
notification to the participants.
4. The technology was used to issue demand response (DR) control signals to smart thermostats for
those participants in one of the load control groups.

NSTAR Smart Grid Pilot– Final Technical Report Page 10 June 30, 2014
This technology architecture was intended to allow NSTAR’s existing AMR meters to provide many of
the key capabilities delivered by the newest AMI systems, without undergoing the cost and disruption
of upgrading to a new AMI system and retiring the AMR assets before the end of their useful life.
2.3 Data Collection
The data collection and analysis approach was developed to meet the needs and regulatory requirements
of both process and impact evaluation. Because of the technology demonstration goals, data collection
was enhanced to include information to help understand the performance, reliability, and effectiveness
of the Smart Grid technology. Thus, data collection was intended to meet the needs of multiple
constituencies.
» DOE, as part of its Smart Grid Demonstration grant funding of the pilot, required development
of a Metrics and Benefits Plan for the pilot, which established a variety of data types to be
collected as well as agreed analyses of various aspects of the technology and program operation
to assess effectiveness of the original pilot goals.
» The Massachusetts Department of Public Utilities (DPU) requires a regulatory evaluation of
the program to conform to the guidance of the Massachusetts Smart Grid Collaborative
Technical Subcommittee’s Common Evaluation Framework.
» NSTAR seeks to understand the effectiveness of these new technologies, and what the potential
is for using them in its broader service territory to provide greater capabilities to its customers
and its internal operations at lower costs than other types of investment might require.
To meet these diverse needs, data collection consisted of three different data sources:
1. Interval meter data provided by the pilot technology along with demographic, weather, and
other data needed to perform a statistically significant impact evaluation
2. Survey data collected from participants targeting different pilot areas at various points in time
throughout the pilot, and interview data with program managers and technologists responsible
for various aspects of the pilot
3. Technology data generated by, or developed to track the performance of, various elements of
the technology platform to help better assess the performance of the technology itself
The first two of these efforts are traditional in evaluation of demand-side management (DSM) programs
for energy efficiency or DR, so the target meter/billing data for impact evaluation and survey data for
process evaluation were very well understood at the outset. The third item, data generated by the
technology itself, is a relatively new area without established methodologies and standards. This
technology data has provided a richer set of information than has been traditionally been available in
demand-side and pricing program evaluation.
2.3.1 Impact Data Collection
The technology platform was used to provide 15-minute interval data that was converted to hourly and
used in both peak load and energy impact assessment. Interval data from a limited set of load control

NSTAR Smart Grid Pilot– Final Technical Report Page 11 June 30, 2014
customers was also collected to serve as part of the control group. Weather, demographic, and other data
needed to perform the impact evaluation were also collected.
2.3.2 Survey Data Collection
NSTAR obtained customer feedback using surveys that covered a variety of topic areas, including use
and acceptance of the technology, experience with installation, and overall views toward the program.
NSTAR incorporated a standard question set contained in the Common Evaluation Framework (see
above) and also customized the surveys by adding questions of particular interest and relevance to its
pilot program. Customer acceptance and satisfaction in the program were solicited at several points in
the pilot, to provide NSTAR with feedback on the pilot’s progress and to characterize participants’ final
views. Table 2-3 lists each of the survey efforts.
Table 2-3. Customer Survey Efforts
Survey Effort Number of Completes
Pre-pilot survey, administered immediately following sign-up 2,027
Post-installation survey, administered immediately after technology was installed in participants’ homes
1,341
Decline-to-participate survey of customers receiving marketing materials but who did not respond
60
Post-event survey, administered after each of five events 334
Midpoint survey conducted at the end of 2011* 353
Dropout survey of participants who dropped out of the pilot 120
End of pilot survey 305
Low-income survey of low-income customers, primarily non-participants
302
* At the time of the midpoint survey, most respondents had been in the pilot for at least two months, and many for more than six months. For purposes of DOE’s Smart Grid Demonstration, the pilot did not officially begin its 24-month duration until January 1, 2012.
Source: Navigant survey data
2.3.3 Technology Data Collection
One of the new, and key, aspects of Smart Grid technologies is that they promise to provide a much
greater level of data and information than has been previously available. Analysis of this information
can help to better understand and manage the power delivery system and customer-sited systems and
activity as well as to inform customer communications. One of the key questions when planning for the
technology assessment was whether, and to what degree, information generated by the technology itself
could be made available for meeting the evaluation objectives of assessing reliability, understanding
customer acceptance, and understanding other operational benefits or limitations of the technology.
Among the data elements available for the evaluation were the following:
» Interval data in various stages of processing
» Installer data information

NSTAR Smart Grid Pilot– Final Technical Report Page 12 June 30, 2014
» HAN equipment responses to events
While some information originally sought was difficult (or not possible) to obtain, the information that
was provided yields insights beyond those traditionally possible without the data and information
generated by the technology. These insights are elaborated in Section 5, Technology Assessment.
2.4 Analysis of Energy Savings Benefits
The combination of time-variable rates and enabling technologies allows for testing of various
hypotheses regarding the energy savings impact of individual rate structures and technologies. For
example, Test Groups 3 and 4(TOU/CPP rates) can be compared to the control group to assess the impact
of a TOU rate on peak period consumption as well as the impact of the high-priced critical peak event
relative to normal peak hours. Comparing Test Groups 2 and 3 then allows for measurement of how a
critical peak rebate influences consumption relative to a critical peak price.
Control groups served as benchmarks for purposes of estimating load impacts. The analysis employed
the following control groups (Table 2-4), each selected to best serve the intended purpose.
Table 2-4. Control Group Specification
Control Group Purpose in Evaluation Rationale
Existing interval-metered load research sample*
Peak load and time-of-day impacts
Evaluation requires interval data from prior years in order to assess time-varying impacts adjusted for weather, economic, and other macro factors.
Monthly bill customers* Annual, seasonal, and
monthly impacts
Monthly billing data is readily available and allows for a large control group; interval data is not needed for impacts at monthly or lower granularity.
Participants’ own interval data
Impacts of load control and CPP events
Customers are their own best-matched control group. Since events occur a finite number of times for relatively short durations, participants’ own interval data from non-event days and hours constitute a strong basis for comparison.
*The evaluation used a sub-sample of each control group population to serve as the comparison group, based on matching of energy consumption patterns with the participant group.
Source: Navigant
The estimation of the consumption impacts of all four test groups required hourly meter data collected
for each participant as well as for the control group. The evaluation team consolidated the individual
time series into a single panel (or longitudinal) data set; that is, a data set that is both cross-sectional
(including many different individuals) and time series (repeated observations for each individual). The
consumption impacts of all four groups were then estimated using fixed-effects regression analysis with
weather normalization. For more detail on the analytic methods, see Appendix A.

NSTAR Smart Grid Pilot– Final Technical Report Page 13 June 30, 2014
3 Impact Assessment
The purpose of the impact analysis was to quantify changes in energy consumption and peak demand
resulting from participation in each of the four test-group components of the pilot program. The pilot
design was intended to affect both the amount of energy consumed and the timing of consumption (on-
peak or off-peak). A specific objective was to achieve the 5% savings goal of the Green Communities Act,
which NSTAR defined as applying to the summer peak periods from June through September on non-
holiday weekdays between noon and 5 p.m.11 Other impact metrics included seasonal and annual energy
savings, and load reductions during critical events, both with and without a CPP price in effect and with
and without load control of air conditioners.
Based on participant consumption data from January 2012 through December 2013, major findings of the
impact analysis include the following:
» Peak load impacts. Customers on the TOU/CPP rates(Groups 3 and 4) reduced summer peak
loads by approximately 0.2 kilowatts(kW), or about 15% of their average peak period
consumption. Customers on the standard rate also reduced their consumption during peak
hours, but only by approximately half as much as customers on the TOU rate.
» Impacts of critical events. Customers with automated load control of central AC (Groups 2 and
3) reduced demand by approximately 0.5 kW during events (roughly 20-25%).Customers on the
TOU/CPP rate without automated load control reduced consumption by an average of 0.13 kW
(9%) during events.
» Annual energy impacts.
o Customers on the TOU/CPP rates reduced their annual energy consumption by
approximately 2%. Customers on the standard rates showed about a 1% increase in
annual consumption, although these latter impacts are not statistically different from
zero at a 90% level of confidence.
o Savings appear to have decreased as the pilot progressed, with summer 2012 savings
exceeding summer 2013 savings (roughly 2% savings vs. no savings). Winter months
showed a similar pattern, with a modest savings in January through May 2012 becoming
a modest increase by fall 2012.
» Bill impacts. Customers on TOU/CPP rates saved the most on their energy bills, averaging
approximately $60 in annual savings, or about 4% of their electric bill. Customers on the
standard rates did not experience a significant change in bills compared to what they would
have been absent participation in the pilot.
The remainder of this section will discuss the impact findings in greater detail, covering each of the four
topic areas above. Navigant also estimated impacts by several demographic characteristics, including
11NSTAR Smart Grid Pilot Plan Filing, submitted to the Massachusetts DPU, March 31, 2009.

NSTAR Smart Grid Pilot– Final Technical Report Page 14 June 30, 2014
low-income, high-income, low-usage, high-usage, presence of a senior citizen, small homes, and large
homes. Appendix B contains detailed results for each demographic subgroup.
3.1 Peak Period Load Impacts
Pilot participants in Groups 3 and 4 were placed on a TOU rate, in which customers were charged a
higher rate during the peak period and a lower rate during the off-peak period (all non-peak hours). The
peak period is defined as non-holiday weekdays from 12-5 p.m. in the summer (June to September) and
4-9 p.m. in the winter (October to May). The rate is intended to encourage participants to shift a portion
of their peak period load to the off-peak period. The peak period and time-of-day impact analysis
quantified the amount of load shifting that occurred in response to the pilot.
Navigant found that peak period load reductions are greatest for participants on the TOU rate.
Participants on the TOU rate (Groups 3 and 4) reduced their peak demand by between 16% and 18%,
depending on the Group and season. Participants on the flat rate (Groups 1 and 2) reduced their peak
demand by between 3% and 11%.12
Table 3-1 provides the average peak period reductions for summer and winter for each pilot group.13
Figure 3-1 displays this data with 90% confidence intervals.
Table 3-1. Average Peak Period Load Reduction, by Group and Season
Pilot Group
Peak Period Demand Reduction, January 2012 - December 2013
Summer Weekdays, 12-5 pm Winter Weekdays, 4-9 pm
% kW % kW
1 Enhanced Information 6% 0.06 11% 0.09
2 Peak Time Rebate + LC 3% 0.04 10% 0.11
3 TOU/CPP + LC 16% 0.21 18% 0.18
4 TOU/CPP 17% 0.17 16% 0.14
Source: Navigant analysis
12 The average summer peak demand reduction across all participants was 10.6% of load, as weighted according to
the Group assignments of the 2,717 original participants presented in Table 2-1.
13Navigant did not include event days in the analysis of peak period load reductions and dropped observations
where the interval length was less than 45 minutes or more than 75 minutes, since the model was based on hourly
data. Demand reductions were calculated as the difference in load between pilot participants and matched control
customers from NSTAR’s load research sample.

NSTAR Smart Grid Pilot– Final Technical Report Page 15 June 30, 2014
Figure 3-1. Average Peak Period Load Reductions, by Group and Season
Source: Navigant analysis
90% Confidence Interval
Peak Period Load Reductions

NSTAR Smart Grid Pilot– Final Technical Report Page 16 June 30, 2014
Figure 3-2 and Figure 3-3 display the average weekday load curves (excluding event days) and baselines
for summer (June–September) and winter (October–May), respectively. The lower red line represents the
average load for pilot participants and the higher blue line represents the baseline, based on the load for
matched controls. The difference between the participant load and the baseline is determined by the
participation variables and indicates the predicted impact of the pilot according to Navigant’s regression
modeling.
Although the winter peak period is defined as 4-9 p.m., load reductions also occur during the afternoon
hours (11 a.m.-4 p.m.) for all groups. This could indicate that pilot participants do not adjust their
thermostat settings according to the winter peak period, instead relying on settings tailored to the
summer peak period from 12–5 p.m.
Figure 3-2. Average Load Curves and Baselines, Summer Non-Event Weekdays
Fla
t R
ate
CP
P R
ate
0
0.2
0.4
0.6
0.8
1
1.2
1.4
1.6
1 2 3 4 5 6 7 8 9 10 11 12 13 14 15 16 17 18 19 20 21 22 23 24
Av
erag
e L
oad
(k
W)
Hour Ending
CPP Group, Summer Weekdays
Baseline Participant Group
0
0.5
1
1.5
2
1 2 3 4 5 6 7 8 9 10 11 12 13 14 15 16 17 18 19 20 21 22 23 24
Av
erag
e L
oad
(k
W)
Hour Ending
Enhanced Info. Group, Summer
Weekdays
Baseline Participant Group
0
0.5
1
1.5
2
1 2 3 4 5 6 7 8 9 10 11 12 13 14 15 16 17 18 19 20 21 22 23 24
Av
erag
e L
oad
(k
W)
Hour Ending
CPP LC Group, Summer Weekdays
Baseline Participant Group
0
0.5
1
1.5
2
2.5
1 2 3 4 5 6 7 8 9 10 11 12 13 14 15 16 17 18 19 20 21 22 23 24
Av
erag
e L
oad
(k
W)
Hour Ending
Rebate Group, Summer Weekdays
Baseline Participant Group
Source: Navigant analysis

NSTAR Smart Grid Pilot– Final Technical Report Page 17 June 30, 2014
Figure 3-3. Average Load Curves and Baselines, Winter Non-Event Weekdays
Fla
t R
ate
CP
P R
ate
0
0.2
0.4
0.6
0.8
1
1.2
1.4
1.6
1 2 3 4 5 6 7 8 9 10 11 12 13 14 15 16 17 18 19 20 21 22 23 24
Av
erag
e L
oad
(k
W)
Hour Ending
CPP Group, Winter Weekdays
Baseline Participant Group
0
0.5
1
1.5
1 2 3 4 5 6 7 8 9 10 11 12 13 14 15 16 17 18 19 20 21 22 23 24
Av
erag
e L
oad
(k
W)
Hour Ending
Enhanced Info. Group, Winter
Weekdays
Baseline Participant Group
0
0.5
1
1.5
2
1 2 3 4 5 6 7 8 9 10 11 12 13 14 15 16 17 18 19 20 21 22 23 24
Av
erag
e L
oad
(k
W)
Hour Ending
CPP LC Group, Winter Weekdays
Baseline Participant Group
0
0.5
1
1.5
2
1 2 3 4 5 6 7 8 9 10 11 12 13 14 15 16 17 18 19 20 21 22 23 24
Av
erag
e L
oad
(k
W)
Hour Ending
Rebate Group, Winter Weekdays
Baseline Participant Group
Source: Navigant analysis
Navigant also tested for differences in peak load reductions in various demographic subgroups. Results
of this analysis are provided in Appendix B.
NSTAR Smart Grid Pilot– Final Technical Report Page 18 June 30, 2014
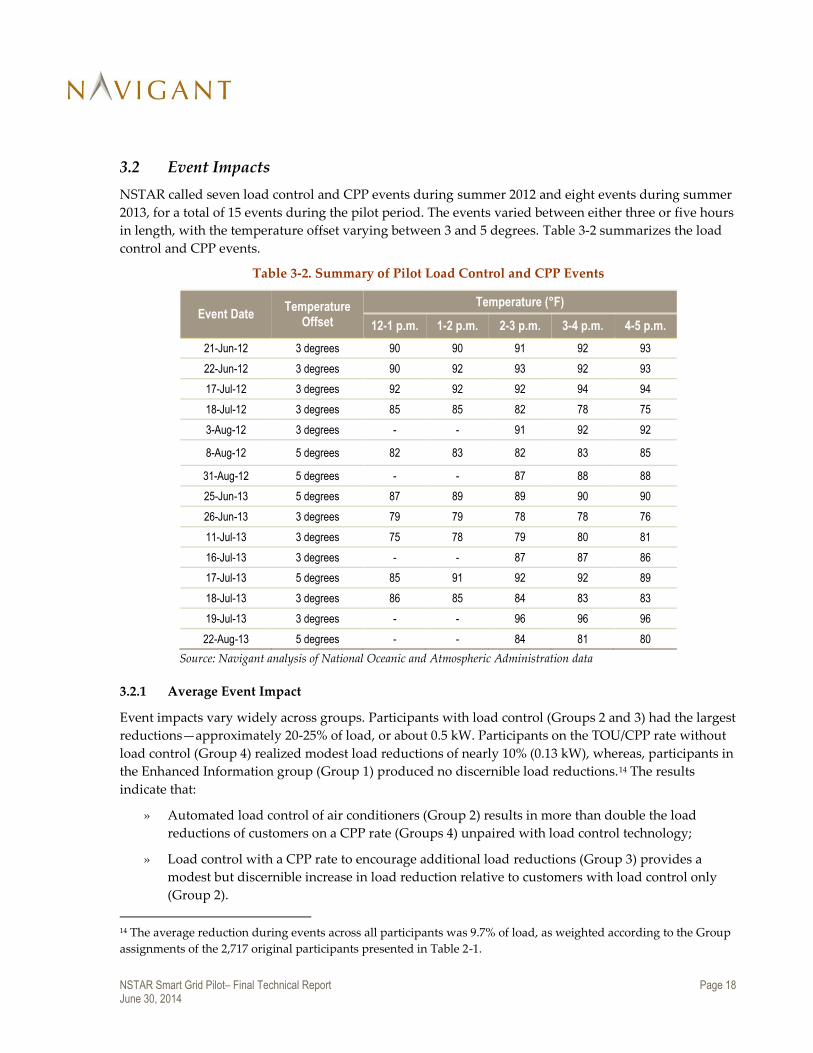
3.2 Event Impacts
NSTAR called seven load control and CPP events during summer 2012 and eight events during summer
2013, for a total of 15 events during the pilot period. The events varied between either three or five hours
in length, with the temperature offset varying between 3 and 5 degrees. Table 3-2 summarizes the load
control and CPP events.
Table 3-2. Summary of Pilot Load Control and CPP Events
Event Date Temperature
Offset
Temperature (°F)
12-1 p.m. 1-2 p.m. 2-3 p.m. 3-4 p.m. 4-5 p.m.
21-Jun-12 3 degrees 90 90 91 92 93
22-Jun-12 3 degrees 90 92 93 92 93
17-Jul-12 3 degrees 92 92 92 94 94
18-Jul-12 3 degrees 85 85 82 78 75
3-Aug-12 3 degrees - - 91 92 92
8-Aug-12 5 degrees 82 83 82 83 85
31-Aug-12 5 degrees - - 87 88 88
25-Jun-13 5 degrees 87 89 89 90 90
26-Jun-13 3 degrees 79 79 78 78 76
11-Jul-13 3 degrees 75 78 79 80 81
16-Jul-13 3 degrees - - 87 87 86
17-Jul-13 5 degrees 85 91 92 92 89
18-Jul-13 3 degrees 86 85 84 83 83
19-Jul-13 3 degrees - - 96 96 96
22-Aug-13 5 degrees - - 84 81 80
Source: Navigant analysis of National Oceanic and Atmospheric Administration data
3.2.1 Average Event Impact
Event impacts vary widely across groups. Participants with load control (Groups 2 and 3) had the largest
reductions—approximately 20-25% of load, or about 0.5 kW. Participants on the TOU/CPP rate without
load control (Group 4) realized modest load reductions of nearly 10% (0.13 kW), whereas, participants in
the Enhanced Information group (Group 1) produced no discernible load reductions.14 The results
indicate that:
» Automated load control of air conditioners (Group 2) results in more than double the load
reductions of customers on a CPP rate (Groups 4) unpaired with load control technology;
» Load control with a CPP rate to encourage additional load reductions (Group 3) provides a
modest but discernible increase in load reduction relative to customers with load control only
(Group 2).
14 The average reduction during events across all participants was 9.7% of load, as weighted according to the Group
assignments of the 2,717 original participants presented in Table 2-1.

NSTAR Smart Grid Pilot– Final Technical Report Page 19 June 30, 2014
Table 3-3 provides the average load reduction across all events, according to pilot group and event
duration/temperature offset.15 The groups with load control achieved larger load reductions during the
three-hour events compared to the five-hour events, and average reductions were larger for events with
a 5 degree temperature offset compared to a 3-degree temperature offset.
Figure 3-4 displays the average load reductions with the 90% confidence interval for each group.16
Table 3-3. Average Event Load Reduction, by Pilot Group and Event Type
Average Event Reductions, %
All 3hr, 3deg 3hr, 5deg 5hr, 3deg 5hr, 5deg
1 Enhanced Information No discernible load impact
2 Peak Time Rebate + LC 20% 22% 26% 19% 21%
3 TOU/CPP + LC 26% 28% 30% 24% 27%
4 TOU/CPP 9% 11% 9%
Source: Navigant analysis.
15Only 1,277 participants had sufficient data to be included in the analysis. Navigant dropped observations where
the interval length was less than 45 minutes or more than 75 minutes, since the model was based on hourly data.
Accounts were completely excluded from the analysis if they were missing 25% or more of event-day observations.
16 On average, participants in all groups had higher load on event days compared to non-event days. For the
Enhanced Information group (Group 1), the regression analysis was unable to attribute the entirety of the increased
load on event days to more extreme weather, resulting in a model estimation of a 5% increase in load as a result of
pilot participation. However, this finding is likely because many of the AMR meters currently in use have a
relatively low resolution that only registers a change in consumption for each kilowatt-hour that a customer has
used. As a result, the hourly load values obtained from the meters and used in the impact analysis are discrete
integer values, and many are zeroes for customers with demand of less than one kilowatt. For Group 1 participants,
which tend to be low-usage customers with no discernible change in consumption during events (see load shapes
below), there are more zero values than for other groups, and there is a significant decline in the number of zero
values on hotter event days (when usage is higher) compared to non-event days. This difference in zero values is a
likely cause for the model to inadequately control for weather, resulting in the appearance of the pilot increasing
customer usage during events.

NSTAR Smart Grid Pilot– Final Technical Report Page 20 June 30, 2014
Figure 3-4. Average Load Reductions During Events
Source: Navigant analysis
The event impacts for Groups 2, 3, and 4, as well as the lack of impact for Group 1 are illustrated in
Figure 3-5, which displays the average hourly load curves for the five-hour events on event days and the
corresponding non-event days. The gray highlighted area indicates event hours; the higher, solid red
line indicates the average load for participants on the event days, and the lower blue line indicates the
average hourly load on non-event days. The difference between the average non-event day (blue) and
average event-day load (red) is the average difference before adjusting for weather. The event days were
hotter on average, but Navigant’s regression models include parameters to control for the variations in
weather conditions and isolate the impact of the event.
Event Load Reductions
90% Confidence Interval
No discernible load impact

NSTAR Smart Grid Pilot– Final Technical Report Page 21 June 30, 2014
Figure 3-5. Average Usage, Five-Hour Events
Flat Rate CPP Rate
No
Lo
ad C
on
tro
lA
uto
mat
ed L
oad
Co
ntr
ol,
3D
egre
e O
ffse
t
0
0.5
1
1.5
2
2.5
0 1 2 3 4 5 6 7 8 9 10 11 12 13 14 15 16 17 18 19 20 21 22 23
kWh
Enhanced Info. Group
Event Hour INFO GROUP - NON-EVENT DAY INFO GROUP - EVENT DAY
0
0.5
1
1.5
2
0 1 2 3 4 5 6 7 8 9 10 11 12 13 14 15 16 17 18 19 20 21 22 23
kWh
CPP Group
Event Hour CPP - NON-EVENT DAY CPP - EVENT DAY
0
0.5
1
1.5
2
2.5
3
3.5
0 1 2 3 4 5 6 7 8 9 10 11 12 13 14 15 16 17 18 19 20 21 22 23
kWh
CPP LC Group
Event Hour CPP LC - NON-EVENT DAY CPP LC - EVENT DAY
0
0.5
1
1.5
2
2.5
3
3.5
4
0 1 2 3 4 5 6 7 8 9 10 11 12 13 14 15 16 17 18 19 20 21 22 23
kWh
Rebate Group
Event Hour REBATE ROUP - NON-EVENT DAY REBATE GROUP - EVENT DAY
Source: Navigant analysis
Customers with load control (Groups 2 and 3). The hourly load curves displayed in Figure 3-5 indicate
that customers with automated load control demonstrated a sudden drop in their load at the start of the
event. Reduced load persisted throughout the event, although the reduction decreased as the event
progressed. Snapback occurred immediately after the event period for the customers with automated
load control and was larger for the events with a 5 degree offset than for events with a 3 degree offset.
CPP customers (Group 4). Load reductions during events and snapback immediately after also occurred
for the CPP group, but were smaller in magnitude than the effects for customers with load control.
Enhanced Information participants (Group 1). Unlike Groups 2 through 4, the Enhanced Information
group exhibited no discernible change in load at the start of events or at any time during the events.
3.2.2 Impacts by Event Hour
Estimated load impacts vary slightly by hour of the event, as shown in Figure 3-6, but most of the
hourly impacts are not statistically significantly different from the average event impact at the 90%
confidence level. For participants in the Rebate with Load Control group (Group 2), impacts fade as the
event progresses, for all event types. At the time of installation, Tendril technology was not capable of
ramping the curtailment, for example, by increasing the thermostat set-point by one degree per hour.
Instead, the thermostat set-point was increased at the start of the event and remained constant for the

NSTAR Smart Grid Pilot– Final Technical Report Page 22 June 30, 2014
event duration. The result is that load impacts are largest in the first hours of the event and then start to
fade as more homes reach the set-point and the air conditioners begin to run. However, for participants
in the CPP with Load Control group (Group 3), impacts persist at nearly the same level as in the first
hour of the event. This indicates that participants in this group are taking actions to curtail their load
during events in addition to the automated temperature offset. For participants in the CPP group (Group
4), impacts increase throughout the event, then taper off slightly in the last event hour.
Figure 3-6. Average Event Reductions by Hour, Five-Hour Events
Results are based on data from 5-hour events with 3-degree offset; Group 1 did not demonstrate a discernible load impact.
Source: Navigant analysis

NSTAR Smart Grid Pilot– Final Technical Report Page 23 June 30, 2014
3.3 Energy Impacts
While the previous set of results addressed reduced consumption during peak periods, another major
purpose of the pilot program was to encourage energy conservation during all hours through increased
information about energy consumption, provided by the in-home display and the web portal. The
energy impact analysis described below presents estimated changes in energy usage because of pilot
participation.
Navigant found that participants on the TOU rates (Groups 3 and 4) realized energy savings of nearly
2% on average, while the standard rate participants in Groups 1 and 2 saw little change in consumption
or an increase in usage (Table 3-4).17 All of the results have sufficient statistical uncertainty around the
estimates to limit generalizations about whether and how much the pilot led to changes in consumption.
Table 3-4. Annual Energy Savings, by Group
Pilot Group
Annual Reduction in Electricity Consumption
% kWh
1 Enhanced Information -0.3% -21
2 Peak Time Rebate + LC -2.5% -244
3 TOU/CPP + LC 1.7% 157
4 TOU/CPP 1.8% 148
Negative savings imply an increase in consumption.
Source: Navigant analysis
17 Average annual energy savings across all participants was 0.3% of consumption, as weighted according to the
Group assignments of the 2,717 original participants presented in Table 2-1.

NSTAR Smart Grid Pilot– Final Technical Report Page 24 June 30, 2014
Figure 3-7 displays the average energy impacts with the 90% confidence interval for each group. The
relatively wide confidence intervals (crossing or coming close to the zero line that implies no change in
consumption) is driven by two factors:
» The low number of monthly bills available for analysis. At most, there were only eight summer
billing periods and 16 winter periods; and
» The fact that the point estimates of energy savings are relatively small—between 0 and 2.5%
savings. This suggests that even a model that can estimate energy savings to within 2% of total
consumption will still show an uncertainty band roughly as large as the savings estimate itself.18
Figure 3-7. Annual Energy Savings
Source: Navigant analysis
18 Estimation of energy savings from “behavior” programs, such as the Smart Energy Pilot typically utilizes sample
sizes in the tens of thousands in order to achieve more precise estimates of impacts.
Annual Energy Savings
90% Confidence Interval

NSTAR Smart Grid Pilot– Final Technical Report Page 25 June 30, 2014
Energy savings were similar for the summer and winter seasons (see Appendix B for seasonal findings).
However, savings declined over time, with significant savings in the first winter (January to May 2012)
and summer (June to September 2012), but diminished savings for the remainder of the pilot. The TOU
groups (Groups 3 and 4) sustained energy savings in the second summer (albeit at a lower level), but all
groups showed greater consumption in the final winter months (October to December 2013) relative to
their predicted usage in the absence of the pilot. Figure 3-8 shows the average energy impacts for the two
summers and three (portions of) winters of the pilot period.
Figure 3-8. Average Energy Reductions Over the Course of the Pilot
Source: Navigant analysis

NSTAR Smart Grid Pilot– Final Technical Report Page 26 June 30, 2014
3.4 Bill Impacts
Energy reductions and customer rebates from pilot participation hold the opportunity for customers to
save on their monthly electricity bills. On average, customers in the TOU groups (Groups 3 and 4) saved
the most on their bills, reducing their annual electricity expenditures by more than 4% compared to their
expected usage under the standard rate in the absence of the pilot. These bill savings reflect a
combination of the customers’ roughly 2% reduction in energy consumption (see Section 3.3 above) and
their roughly 15% reduction in load during the peak periods when TOU rates are highest (see Section
3.1).19These results are averaged across all participants on TOU rates; inevitably, some customers will
save more and some less. It is expected that some customers would pay more under TOU rates,
particularly those that tend to have high consumption during peak hours and are unable (or unwilling)
to shift load off-peak.
Customers in the Enhanced Information group (Group 1) saw little change in their bills (reflecting little
change in energy consumption, as discussed in Section 3.3). Bills for Rebate group participants increased
by less than 1%, reflecting participants’ increase in energy consumption, partially offset by CPP event
rebates averaging approximately $30 per year. Table 3-5 presents the bill savings amounts and
percentage savings by pilot group, and Figure 3-9 illustrates the relative savings across groups.20 Bill
impacts were similar for the summer and winter seasons (see Appendix B for seasonal findings).
Table 3-5. Seasonal Bill Impacts
Group Annual Bill Impacts*
% $
1 Enhanced Information 0.3% $4.51
2 Peak Time Rebate + LC 0.6% $9.60
3 TOU/CPP + LC -4.4% $(67.99)
4 TOU/CPP -4.1% $(55.68)
* Negative values indicate decreased bills, corresponding to bill savings.
Source: Navigant analysis
19 NSTAR designed its TOU/CPP rate such that an average residential customer on the rate would see no change in
their annual bills if they continued to consume energy in the same amounts and with the same load shape. The true
bill savings from load shifting and energy conservation may be somewhat higher or lower than estimated here
because pilot participants’ usage prior to the pilot did not necessarily match average customers’ usage from the
baseline year that was used in setting the bill-neutral rate tiers.
20 The cost of the program and its possible impact on rates is not reflected in this bill impact analysis. Discrepancies
between the energy savings percentage from Section 3.3 above and the bill savings percentage for each group are a
result of several factors, including: 1) some customers were excluded from the bill savings analysis due to arrears
balances in their billing data; and 2) the fixed component of monthly bills does not vary with energy consumption,
which means that—all things equal—a given percentage reduction in consumption yields a slightly lower
percentage reduction in bills.

NSTAR Smart Grid Pilot– Final Technical Report Page 27 June 30, 2014
Figure 3-9. Average Bill Impacts by Pilot Group
Negative values indicate decreased bills, corresponding to bill savings
Source: Navigant analysis
3.5 DOE Metrics and Benefits Reporting
In addition to energy and bill savings, NSTAR’s Metrics and Benefits Reporting Plan for the DOE
identified the possibility of deferred investments in generation capacity and the distribution system. For
the reasons described below, the pilot did not lead to any deferred investment, although the technology
and rate offering demonstrated the possibility that a future, larger scale rollout could achieve some level
of investment deferral if participation and benefit levels were significant enough.
3.5.1 Deferred Generation Investments
At the level of the independent system operation, the New England ISO, generation capacity is required
to meet projected system peak demand with a reserve margin. Since peak loads typically last only a few
hours and there is a sharp drop-off in peak loads across the top 40 or so hours of the year, any program
that can reduce loads significantly for three to five hours for five to ten occurrences per summer can
theoretically contribute to deferral of generation capacity.
The Smart Energy Pilot’s CPP rates (Groups 3 and 4) and AC load control (Groups 2 and 3) appear able
to provide the load reductions necessary to assist in deferral of generation capacity. At the participation
levels of the pilot, however, the load reductions are not significant enough to affect ISO planning. Even
at full enrollment prior to customer dropouts, the roughly 800 load control participants were able to
contribute approximately 400 kW of peak load reduction (at roughly 0.5 kW per participant) and the
nearly 900 CPP participants in Group 4 were able to provide 120 kW. Thus, in total, the potential
contribution of the pilot to peak load reduction was just ½ megawatt—not enough to be considered on a
system that exceeds 25,000 MW in peak demand.

NSTAR Smart Grid Pilot– Final Technical Report Page 28 June 30, 2014
3.5.2 Deferred Distribution Investments
While NSTAR is not responsible for generation planning, the utility must ensure that the distribution
system can meet the future requirements for supplying power to customers. As the loads at substations
and other distribution system assets reach their limits, NSTAR must invest in system upgrades or
manage power flows and demand in order to maintain functioning of the system. There are examples
where U.S. utilities have utilized demand response to help manage distribution system assets, most
notably Con Edison’s Distribution Load Relief Program. In NSTAR’s case, however, two limitations
prevent the pilot from contributing to deferral of distribution system investments:
1. The magnitude of the load reductions is too small—whether the reductions from critical events or the
peak period reductions from TOU rates. At less than 1 MW, the impacts are too small to affect
NSTAR’s capital plans.
2. Load reductions need to be location specific to address the needs of the distribution system. Unlike
generation planning, distribution system planning requires capacity or load management to be
callable at specific locations on the grid, where local contingencies drive investment needs. Thus,
reductions from Smart Grid must be concentrated in pockets of need and must have the
operational flexibility to meet the specific temporal needs of each asset for which the Smart Grid
might help defer investment.
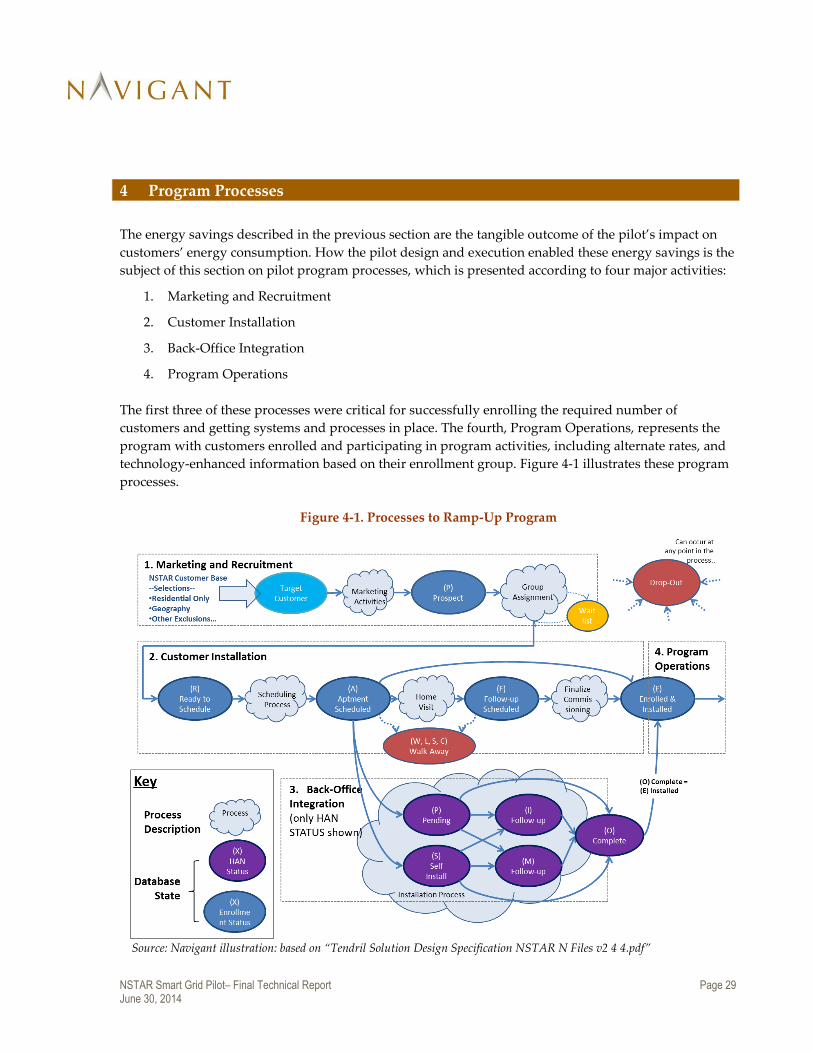
NSTAR Smart Grid Pilot– Final Technical Report Page 29 June 30, 2014
4 Program Processes
The energy savings described in the previous section are the tangible outcome of the pilot’s impact on
customers’ energy consumption. How the pilot design and execution enabled these energy savings is the
subject of this section on pilot program processes, which is presented according to four major activities:
1. Marketing and Recruitment
2. Customer Installation
3. Back-Office Integration
4. Program Operations
The first three of these processes were critical for successfully enrolling the required number of
customers and getting systems and processes in place. The fourth, Program Operations, represents the
program with customers enrolled and participating in program activities, including alternate rates, and
technology-enhanced information based on their enrollment group. Figure 4-1 illustrates these program
processes.
Figure 4-1. Processes to Ramp-Up Program
Source: Navigant illustration: based on “Tendril Solution Design Specification NSTAR N Files v2 4 4.pdf”

NSTAR Smart Grid Pilot– Final Technical Report Page 30 June 30, 2014
Each of the four major program processes is discussed in the four respective subsections below.
4.1 Marketing and Recruitment
NSTAR developed a two-step plan to flush out technology and process issues, gain initial insight, and
minimize deployment risk prior to scaling up recruiting and installations for the pilot itself. The first step
involved installation at NSTAR employee homes, and the second involved a limited deployment (“Soft
Launch” at a small number of customer homes).
» Employee test installations. A small number of employees—less than 50— were recruited, and
the technology was installed and commissioned at their homes. The installation experience and
performance of the system were carefully monitored by the pilot project team and participating
employees were interviewed about the experience. The step provided initial insights into the
functioning of the technology, the format of the energy information provided by the system, and
overall participant experience. One of the key takeaways from the employee test installations
was that, due to complexities with self-installations, it was preferable to have a qualified
technician install and register the Tendril devices to maximize the installation success rate.
» “Soft Launch.” With this experience in hand, NSTAR expanded to a limited “Soft Launch”
within the customer base to understand the additional complexities that came with actual
customer deployment. This process allowed testing of the actual recruiting process, as well as a
limited-scale installation and commissioning of equipment. Figure 4-2 details the recruiting
process including stages of offer and response, culminating in 200 installations.
Of the emails actually received by customers,
almost 10% found the program attractive enough
to enroll (527), and 75% of those customers (395)
were accepted into the program21 after the
qualification process.22 Approximately 70% of
these accepted customers actually signed the
participation agreements (273). Finally, 200
customers eventually had equipment installed.
Customers may have dropped off after signing
the agreement, after home inspections and
qualifications to make sure the equipment could
be used within their homes (e.g., for those
customers assigned to the rebate group,
determination that program thermostats were
compatible with their heating, ventilation, and air
conditioning [HVAC] system), or due to lack of
21 Because NSTAR was trying to limit the size of the initial Soft Launch to approximately 250 customers, NSTAR did
not initially allow all 527 participants into the program. However, those customers who enrolled but were not
initially accepted were put on a waitlist and contacted again once the pilot advanced to full deployment.
22 Customers were disqualified if they indicated during enrollment that they did not have broadband Internet, that
they were moving within six months, or if they were not currently in NSTAR’s pilot eligibility database.
Figure 4-2. “Soft Launch” Recruiting Process

NSTAR Smart Grid Pilot– Final Technical Report Page 31 June 30, 2014
response to attempts to schedule the installation appointment. Fifty-one percent of customers accepted
into the trial resulted in actual equipment installation.
The “Soft Launch” process provided a valuable preview of the issues and challenges involved with
rolling out the pilot to scale. One key learning from the Soft Launch was that, given the diversity of
HVAC system configurations in the region, Programmable Controllable Thermostats (PCTs) were
difficult to install and had a low rate of installation success. The PCT required a certain wiring
configuration, which was not always available in a given home and depended on a variety of factors. In
order to mitigate the impact of this for the full launch, Tendril and NSTAR introduced a newer
generation PCT that allowed the same pilot functionality, but was compatible with a wider range of
home wiring configurations, thus increasing the success rate.
NSTAR was also able to make improvements to the enrollment process as a result of the Soft Launch to
increase the success rate. Namely, the Company identified process improvements in the enrollment
sequence so that customers experienced the shortest delay possible from the time of enrollment to the
time of first contact for installation scheduling. In addition, during the Soft Launch NSTAR noted higher
than anticipated drop-off in the period between ”enrollment” and ”acceptance.” During the Soft Launch,
enrollment was a two-step process: 1) customer enrollment and 2) after acceptance into the program, the
customer was required to reply to a second email to complete an acceptance form. In order to improve
the success rate for the full launch, NSTAR consolidated this into one step, so that the acceptance form
was completed during the initial enrollment process.

NSTAR Smart Grid Pilot– Final Technical Report Page 32 June 30, 2014
4.1.1 Target Geography
The pilot geography initially encompassed three specific communities within NSTAR’s service territory,
offering high density of broadband connectivity and the ability to reach a diverse set of customer
demographics and construction types. These communities, identified in Figure 4-3, included two
primarily middle- to upper-middle-income suburban areas (Newton and Hopkinton) and one Boston
neighborhood, Jamaica Plain, which has historically been a mixed-income neighborhood and was
included with the hope of increasing the diversity of the participant pool and home type. The pilot
geography was ultimately expanded to include Waltham and Framingham, in order to meet the pilot’s
enrollment targets after the initial marketing campaign (see Section 4.1.3, Customer Enrollment below).
Figure 4-3. NSTAR Service Territory and Targeted Communities
4.1.2 Marketing to Customers
NSTAR recruited customers using a variety of channels, including direct mailings, postcards, and
several waves of emails to customers in the targeted communities. Recruitment was targeted to help
ensure that customers invited to participate were eligible and lived within one of the designated
Newton
Jamaica Plain
Framingham
Hopkinton
Waltham

NSTAR Smart Grid Pilot– Final Technical Report Page 33 June 30, 2014
communities. Consequently, mass media, such as radio and television, were not used. Rather, the
marketing campaign consisted of direct mail and email to those customers meeting the initial eligibility
criteria. Bill messages and inserts were also used, as was local newspaper advertising, where
appropriate. The marketing and recruitment material described how the pilot program would help
NSTAR to develop a “Smart Grid” that will improve the reliability and lower the cost of electricity
supply. A more complete description of NSTAR recruitment efforts is contained in The NSTAR Smart
Energy Pilot Marketing and Recruitment Plan (Appendix C).
In addressing the customer value proposition, NSTAR emphasized specific benefits, including the
following:
» The NSTAR Smart Energy Pilot would put the control in customers’ hands, providing them with
a home energy management system that delivered information on how they were consuming
energy. It could help them make decisions that can add up to real savings.
» The system was a $400 value that customers receive for signing up.
» The system could help customers make a real difference for themselves and their community.
» Participation would also help NSTAR better understand how customers consume energy for
years to come.
Examples of direct mail and email recruiting pieces to customers can be found in Appendix C, which
details the NSTAR Smart Energy Marketing Plan.
Prior to inviting participation, the Company established the recruitment criteria including demographic,
geographic, usage identity, and rate information. One specific requirement was that participants had a
functioning broadband Internet connection and that they commit to maintaining broadband service for
the duration of the pilot program. The broadband connection is essential for the Company to leverage its
existing infrastructure investments in AMR meters to obtain interval meter data.
4.1.3 Customer Enrollment
Enrollment rates were relatively high, with response rates to NSTAR’s direct mail and email marketing
efforts of 4% and 7%, respectively, compared to the 2% to 4% response rates typically seen in Smart Grid
program recruitment. 23 However, converting customers from “enrollment” to “installation” was a
challenge, as was retaining those customers active in the pilot. Customers were randomly assigned to
groups based on a process designed to meet several objectives, such as filling the load control and rebate
groups with customers with central air conditioning and offering low-income customers an opportunity
to participate in the rebate group. Appendix D provides a detailed overview of the process used to
assign interested customers to the four participant groups.
23 Smart grid marketing response rates are based on market research conducted by Navigant for the NSTAR Smart
Grid Pilot Implementation and Marketing Plan, March 2010 (see Appendix C).

NSTAR Smart Grid Pilot– Final Technical Report Page 34 June 30, 2014
The results of NSTAR’s program marketing and recruitment efforts can be seen in Figure 4-4, as
analyzed using the system enrollment data.
Figure 4-4. Marketing Time Line and Customer Enrollment
Source: NSTAR data
The different colors show the various treatment groups, and the gray band in the upper right shows
program un-enrollments that begin to occur later in 2012. The constant, small number of enrollees in
2010 and much of the first part of 2011 represent participants that started in the “Soft Launch” early
enrollment trial in the summer of 2010. The vertical lines overlaying the graph represent different
marketing, newsletter and outreach, and demand response events.

NSTAR Smart Grid Pilot– Final Technical Report Page 35 June 30, 2014
Geography of Pilot Participation. Figure 4-5 presents the geographic location of the participants. More
than one-third (41%) were located in Newton and surrounding towns; 19% were located in the Jamaica
Plain neighborhood of Boston, and the remainder were located in the other suburban areas targeted by
the pilot.
Figure 4-5. Geographic Location of Smart Energy Pilot Participants
Newton*, 41%
Jamaica Plain /
Boston, 19%
Framingham, 16%
Waltham, 13%
Hopkinton, 10%
Other, 2%
Source: Pre-pilot survey, n=2,027.

NSTAR Smart Grid Pilot– Final Technical Report Page 36 June 30, 2014
Income and Education Level of Participants. As demonstrated in Figure 4-6, participants in the pilot
tended to have high levels of education and income, with 59% of participants earning more than
$100,000 per year, compared to about one-third of utility customers in Massachusetts.24 Nearly two-
thirds of participants had a post-graduate education, and the participant population appears to be
technologically savvy, with 43% of participants having three or more computers in the home.
Figure 4-6. Income and Education Levels of Participants
34%
25%
13%
12%
5%
0%
0% 10% 20% 30% 40%
$150,000 or more
$100,000 to $149,999
$75,000 to $99,999
$50,000 to $74,999
$10,000 to $49,000
Less than $10,000
65%
26%
4%
1%
0.1%
0% 10% 20% 30% 40% 50% 60% 70%
Postgraduate College
College Graduate
Some College/Trade/Vocational School
High School Graduate
Elementary (Grades 1-8)
Source: Pre-pilot survey, n=2,027.
Approximately 25% of customers dropped out prior to having equipment installed (mostly due to failure
to schedule an appointment) and were never counted in pilot participation figures; and another 30% of
those active in the pilot dropped out within a year.
4.1.4 Reasons for Not Participating
Navigant conducted a survey of 213 people who did not respond to solicitation or who declined to
participate in the pilot. In this process 153 (or 72%) were not given the whole survey because they did
not recall receiving any communication about the pilot. The 60 customers who recalled the
communication but declined to participate had a range of reasons for this choice. Sixty-eight percent
(68%) of respondents read the communication; however, 29% of those who read it did not recall
anything about the program from what they read.25 Forty-four percent of respondents recalled a message
of “Monitoring/smart meter” and 12% recalled “Ability to save money on electric bills.” As shown in
Figure 4-7 below, the most common reasons for not participating include not being a homeowner, an
upcoming or possible move, and a perception that it would take too much time to learn about the
program and sign up for it.
24 Source: Massachusetts Residential Appliance Saturation Survey (RASS), prepared by Opinion Dynamics Corp. for
NSTAR and four other Massachusetts utilities, April 2009.
25 Recipients of the post card were less likely to have read it (53%) compared to direct mail (81%) and email (69%),
and there was especially low recall among post card recipients (63% didn’t recall anything).

NSTAR Smart Grid Pilot– Final Technical Report Page 37 June 30, 2014
Figure 4-7. Reasons for Declining to Participate
Source: Decline-to-Participate Survey: n=60 respondents who recalled receiving an NSTAR solicitation for
the Smart Grid pilot
The most common suggestion for improving the program was to open it up to renters (10%), but almost
half (46%) of all respondents said there was nothing NSTAR could have done to persuade them to sign
up.
4.2 In-Home Equipment Installation
Once NSTAR had recruited customers to the pilot customers, the Company—through its technology
vendor Tendril and a local installation contractor—scheduled and completed installation of the Smart
Grid equipment in participant homes. During the installation process, the installer educated customers
about the program, use of the equipment, and the actions they could take to reduce consumption in
general and during peak periods or critical peak events. The installation technicians also ensured that
customers had access to the web portal to view more detailed information and to adjust thermostat
settings (for those participants receiving smart thermostats).

NSTAR Smart Grid Pilot– Final Technical Report Page 38 June 30, 2014
The initial installations occurred among the “Soft Launch” participants in 2010. When the full pilot
ramp-up was underway in mid- to late 2011, NSTAR was conducting approximately 300 installations per
month (Figure 4-8). By May 2012, NSTAR had completed all pilot installations, having outfitted more
than 2,700 customers with Smart Grid equipment.
Figure 4-8. Equipment Installations by Month
Source: NSTAR Internal Smart Grid Update Briefing, November 19, 2012
4.2.1 Installation Challenges
A number of issues created delays in the installation process and cancellation of some enrollments.
NSTAR and its partners addressed these issues during the course of the installation process, to varying
degrees of success. Among the issues were the following:
Installation Processes
» Delays between enrollment and installation. In some cases, there was more than a week
between a customer’s enrollment in the program and scheduling of the installation, resulting in
customers losing interest in the program, and causing scheduling difficulties for the installers.
To help resolve this issue, NSTAR used smaller marketing “bursts” that allowed a more
continuous flow of enrollee names being fed to the installer process, reducing the large
installation queue that built up after some of the initial marketing efforts.

NSTAR Smart Grid Pilot– Final Technical Report Page 39 June 30, 2014
» Inefficient hardware inventory management. The use of multiple storage sites for the in-home
devices resulted in inefficient inventory management for installers. As a result, the installation
teams performed multiple inventories of the hardware, which was time consuming and at times
inaccurate. To remedy this situation, NSTAR’s primary vendor engaged a national installer with
a logistics person on-site that scanned all hardware as it entered the facility. A more
sophisticated inventory control/management system helped to reduce the occurrence hardware
losses.
» Insufficient installation procedures. Early in the installation process, Tendril and NSTAR noted
instances of HANs being offline after the installation was complete. In some cases, this was due
to installers not following instructions on the proper placement and configuration of the HAN in
order to maximize the success rate of the installations. To address some of these issues, NSTAR
implemented additional installation procedures and installers were retrained to ensure they did
not install hardware in locations that hindered communication (e.g., basement locations where
radio communications were sometimes difficult). The pilot team learned that, in certain
instances, communication was being lost with the HAN because customers were inadvertently
unplugging the HAN equipment, causing the devices to lose communication with the Tendril
and NSTAR back-office. To correct this, NSTAR placed stickers on the gateway devices to warn
customers not to unplug them. These measures resulted in a smoother and more efficient
installation process with fewer nonfunctioning systems.
» Slow online data entry system for installers. Tendril developed a custom online site to help
installers input information in real time into the system during installation. However, the
installation vendor found the system slow to load, which delayed the installation process. As a
result, installers often entered their information at the end of the day, after they may have
forgotten some of the information, or transcribed it incorrectly. This resulted in a high level of
missing data from installations. To help remedy this, the NSTAR team redesigned the tool for
ease of use, including redeploying the tool in phases so the installers could provide feedback
and fix things that they felt were not relevant. In addition, the Tendril devices required firmware
updates when first connected. This was an automated process, but was often a time consuming
process that frustrated installers and customers who were waiting for the devices to update
during the installation period. To remedy this, the project team pre-loaded the firmware updates
in an effort to minimize the amount of time needed for this process during installation.
Technology Issues
» Delayed meter communication with the In-Home Display. In some cases it took several hours
before the in-home displays successfully communicated with the customers’ meters. In those
cases where it was not practical for the installation technician to wait for that communication
link, the customer was educated on the program, including receiving the education materials,
but additional follow-up action (via phone or, in some cases, additional visits) was required in
some cases to troubleshoot.
» Incompatibilities between thermostats and in-home wiring. During the Soft Launch, NSTAR
found a high number of incompatibilities between the PCT and the HVAC wiring in many
residences. The installation process was modified for those enrollees who were candidates for
PCTs so that the initial visit installed and commissioned equipment other than the PCT, and the

NSTAR Smart Grid Pilot– Final Technical Report Page 40 June 30, 2014
HVAC system was assessed for PCT compatibility. If determined to be compatible, a second
visit was scheduled to install the PCT.
4.2.2 Participant Views of the Installation Process
Participants were highly satisfied with the overall installation process, with an average rating of 6.3 on a
7-point scale (as shown in Figure 4-9). Satisfaction with the professionalism, cleanliness, and efficiency of
the installer is particularly high. The component with the lowest participant satisfaction is the
“usefulness of the informational materials left behind,” though it still has an overall favorable rating.
Figure 4-9. Participant Satisfaction with Installation Process
5.6
5.9
6.1
6.2
6.3
6.4
6.5
6.6
6.7
6.3
1 2 3 4 5 6 7
Usefulness of the informational materials left behind
Resolution of any installation or other problems
Directions for getting help with the equipment or other…
Explanations about how the equipment worked
Quality of the installation
Keeping to the scheduled appointment time
Time it took to complete the installation
Cleanliness of the site after the work was completed
Installer’s professionalism and courtesy
Overall satisfaction with the installation process
Average 1-7 rating, 7 is "highly satisfied"
Source: Post-installation survey
Thus, despite several challenges in ramping up the installation process, participants were, on average,
quite satisfied with their experience. Overall, the enrollment and installation process was successful in
getting the targeted number of participants into the pilot.
4.3 Systems Integration and Billing
Two important efforts for making the new technology work included integration with existing NSTAR
systems, and appropriate bill calculation and processing.
4.3.1 Integration with Existing Back-End Office Systems
As part of this pilot project, NSTAR had to integrate the AMR meters utilizing the Tendril infrastructure
with a number of back-office applications for handling transactions, such as customer enrollments,
various customer inquiries related to billing, operation of equipment, and declaration of critical pricing
events. NSTAR integrated the AMR/Tendril cloud-based head-end functionality—in some cases this

NSTAR Smart Grid Pilot– Final Technical Report Page 41 June 30, 2014
meant merely providing the Tendril system aggregated data--to the following major back-office
applications:
» Customer Information Systems
» Customer Relationship Management
» Bill Presentment and Payment
» Corporate Website
» Interactive Voice Response
» A newly developed Smart Grid database application to integrate with the existing billing system
and other systems
Significant effort was devoted to end-to-end testing, ensuring availability of accurate and timely meter
reads, accurate provisioning of the in-home displays, and customer portal with current and historical
data. It was a significant testing effort by NSTAR and Tendril to ensure that customers were billed
accurately and on a timely basis, based on the rates established for the Smart Grid pilot. In addition,
charges and rebates such as the ones associated with the CPP were tested extensively to ensure they
were being calculated properly and presented consistently over the multiple channels available to the
customer (i.e., IHD, web portal, and electronic and paper bill). NSTAR also built safeguards into the
process and tested extensively to ensure that, in the event of missing or incomplete interval data, the bill
would automatically default to bill generation using the otherwise applicable rate and monthly kWh
consumption reading as measured by the drive-by metering system.
4.3.2 Bill Calculation, Rendering, and Payment
For customers taking service under the pilot TOU rates, NSTAR calculated the bill using the DPU-
approved rates currently in effect at the time of billing and the interval usage data captured by the
Tendril in-home technology. Prior to producing a bill, NSTAR’s systems compared the total kWh of
monthly interval data provided by Tendril to the kWh reading obtained from the drive-by meter reads.
If the total consumption of the interval data did not match the total consumption of the drive-by meter
reading (outside an acceptable tolerance level; see below), NSTAR produced the bill using the otherwise
applicable basic service rate (i.e., if the interval data did not match the drive-by data, NSTAR did not use
the interval data for billing but instead billed the customer on the otherwise applicable flat rate).
For most of the pilot, NSTAR billed using the applicable TOU rates whenever the sum of the interval
reads was within 2 kWh of the monthly drive-by value; when the discrepancy in the kWh values was
more than 2 kWh in a given billing month, NSTAR billed the customer according to the customer’s
standard rate. In 2013 NSTAR moved to a threshold of 10 kWh per month in order to increase the
success rate for billing on the TOU rates. Customers who were actively engaged in the pilot and on the
TOU rates often called when they were billed on the flat (rather than the dynamic) rate. By increasing the
acceptable tolerance level, NSTAR intended to improve participant satisfaction by using the interval data
more frequently.

NSTAR Smart Grid Pilot– Final Technical Report Page 42 June 30, 2014
4.4 Program Operation
Once enrollees had equipment successfully installed, they entered the operation phase of the pilot. This
was a state where customers had the appropriate equipment for their particular pilot group (e.g., IHDs,
PCTs, and gateways) running in their homes; they were on a new rate plan, if applicable; and they had
access to their specific energy information via the web portal and IHD. Generally, the program operated
as it was intended, and NSTAR made adjustments as needed; however, there were a number of notable
challenges faced—and mainly overcome—during operation.
One of the major operational aspects of the pilot was collection of meter data and the billing function,
which was discussed in System Integration and Billing above. Other key operations functions included:
1. Customer support services
2. Declaration and initiation of critical peak events
3. Equipment and system maintenance
4. Customer retention
4.4.1 Customer Support Services
Customer Care resources were available to address various customer inquiries related to the operation of
customer-facing equipment, billing and payment, and other inquiries. These services encompassed a
range of activities including operation of a call center, responding to requests to repair malfunctioning
equipment, and communicating to participants through targeted mailings and messaging to the in-home
displays and web portal. Call center support was provided by both Tendril and NSTAR, depending on
the nature of the inquiry. In general, Tendril support was available to respond to equipment- and pilot-
related inquiries while NSTAR support was available for billing inquiries.
One of the principal customer issues that arose was the HAN’s going offline. During program
operation, many of the HANs ceased communicating via the Internet. In most cases, this issue was
resolved by Tendril instructing customers to power-cycle the ERT bridge “Transport” device (i.e.,
turning it off and then back on). Initially this was not occurring frequently enough to require a defined
process. However, as the pilot progressed and more participants were brought on, this started
happening with greater frequency and required a more structured process in order to keep participants
engaged and enrolled. Ultimately, the NSTAR support team took over the process of managing the
emails to participants, explaining how to get their devices back online. As a result, NSTAR was able to
have better visibility into the volume and priority of support cases.
The program’s communications and information are one of the primary areas of concern for participants
and a common theme among former participants’ reasons for dropping out of the program. The most
common suggested improvements to the program related to improving communications (mentioned by
18% of participants) and offering better technologies (mentioned by 13% of participants).26 At 2011 year-
end, 69% of participants who recalled receiving any informational materials said that they were
26 Customer perceptions about the specific technologies (in-home display and web portal) are discussed in Section 5,
Technology Assessment.

NSTAR Smart Grid Pilot– Final Technical Report Page 43 June 30, 2014
“somewhat helpful.” The most common complaint about informational materials was a lack of specifics
on how rates would change and the reasons for critical events being called.
4.4.2 Critical Peak Events
NSTAR called seven critical events during summer 2012 and eight events during summer 2013, for a
total of 15 events during the pilot period. The events varied between either three hours or five hours in
length, with the temperature offset for load control participants varying between three degrees or five
degrees. The events were scheduled a day ahead of time, based on weather/temperature forecast and
NSTAR’s day-ahead load forecast for the next day. Participants in the load control groups (Groups 2 and
3) could opt out using the web portal or via their programmable controllable thermostat.
Nearly two-thirds of participants in the load control groups took advantage of the flexibility to opt out of
at least one event, and they opted out of an average of about 2-1/2 events per summer. On a per-event
basis, customers opted out of about 15% of the 3-hour events and 23% of the 5-hour events.27 Many
customers opted out of no more than one event per summer, but about one in ten customers opted out of
10 or more events during the course of the pilot, and several opted out of every event (Figure 4-10).
Figure 4-10. Frequency of Event Opt-outs by Participant
Source: Event opt out information reported fromTendfril
The following results are taken from participant surveys that were fielded as part of the Process
Evaluation. In post-event surveys fielded immediately after five critical events occurred, nearly all (94%)
27 Opt-out summary statistics were calculated based on the number of opt-outs and the starting enrollment in
Groups 2 and 3. These statistics do not account for the effects of participant attrition.

NSTAR Smart Grid Pilot– Final Technical Report Page 44 June 30, 2014
of participants were aware that an event had occurred, and 84% of those who were aware took energy-
saving actions.
Survey Results on Event Notifications. Participants responded that they were notified by both email and
the in-home display (49%) or by email only (45%). Nearly all felt that they had received adequate
notification of the event (94%). When asked how event notifications could be improved, 78% had no
suggestions or felt that the current methods were fine. The most common suggestions for improvement
include:
» Improve email content (6%): Participants want to see consistent formatting and explicit details
on the timing of the event and the rate that they will be charged, and they do not want emails
that simply tell them to check their in-home display
» Provide earlier notification of events (4%)
» Improve in-home display/thermostat functionality (4%): Participants noted problems with
accessing messages on the in-home display as well as accepting/acknowledging notifications
» Send text messages (3%)
» Provide better explanation of the need for events (2%): Several participants wanted to know
why events were being called and the typical criteria for event days (e.g., is there a specific
temperature threshold that triggers event days?)
Although most participants felt that event notification was adequate, participants were less satisfied
with NSTAR’s efforts to educate them on how their rates would change during events. In
communications, NSTAR did not explicitly state the rate; however, links to the rate tables were included
in most newsletters from May-August. In addition, prior to events NSTAR sent an email to participants
explaining the price increase and letting them know where in the portal to see the rate they were
currently being charged. There was also a link in the portal to the rate table.
In the survey responses, over one-quarter (26%) did not feel that they receive adequate education on the
rate structure. Many participants on the CPP rate felt that it was much higher than they expected based
on NSTAR’s communications during the enrollment phase. Suggestions on how to improve customer
education about rates focused on transparent comparison between the pilot rates and the standard
customer rates, providing the exact rates in email notifications about events, and providing estimates of
energy savings from specific actions (e.g., setting their thermostat 3 degrees higher vs. 5 degrees higher).
Several participants questioned whether other, non-participating NSTAR customers were paying the
same CPP rates, and felt they were being “penalized” for participating in the pilot.

NSTAR Smart Grid Pilot– Final Technical Report Page 45 June 30, 2014
Survey Results on Actions Taken. The most common strategy for reducing electricity consumption
during the events was limiting the use of air conditioning: nearly half (46%) of participants increased
their thermostat set-point, pre-cooled their home, or turned off their air conditioning altogether during
the event. Just 16% of participants said they did not take any actions to save energy during the event,
and many of those participants noted that there was no need for them to take action because they were
on vacation or at work. Figure 4-11 summarizes the most common actions taken in response to the
events.
Figure 4-11. Actions Taken in Response to Critical Peak Events
Note: Data are those respondents indicating that they took action in response to critical events. Respondents could indicate more than one action.
Source: Post-event surveys, n = 334

NSTAR Smart Grid Pilot– Final Technical Report Page 46 June 30, 2014
Survey Results on Comfort. Relatively few participants experienced significant discomfort during the
critical events. One-third (33%) were not home during the event, and another 30% were home during the
event but did not notice a change in temperature. As shown in Figure 4-12, 27% of participants were
home during the event and noticed a change in comfort that they considered “somewhat less
comfortable” than what they are used to in their homes. Just 7% described the critical event as “much
less comfortable.”
Figure 4-12. Participants' Perceived Change in Comfort During Critical Events
Source: Post-event surveys, participants who noticed a change in temperature during event
only, n=87
4.4.3 Equipment and System Issues and Resolutions
There were several key issues resulting in participant disconnects and/or inability to use some of the
HAN equipment. These issues were generally addressed fairly effectively with various process
modifications and equipment changes.
Database issues: At various points early in the pilot, the Tendril head-end platform had database issues,
resulting in outages and unavailability for portal customers. Tendril was able to use a number of
database patches and alter the timing of various processes to help resolve some of these issues.
Equipment failure was recognized as a significant issue midway through the pilot. By the end of 2012,
51% of customers indicated equipment stopped working properly at some point in the pilot. As
described previously in Section 4.4.1, many of the HANs went “offline,” requiring Tendril or NSTAR
staff to contact the customer via email to power-cycle equipment off and back on.

NSTAR Smart Grid Pilot– Final Technical Report Page 47 June 30, 2014
Data processing. As part of interval meter data processing, Tendril contracted with an energy
management company, Energy ICT (EICT), to do estimation on the raw consumption data that was
being pulled from the meters. This process involved “snapping” the time-stamps of the raw data to the
15-minute interval boundaries, and then doing estimation on the data (the Validation, Estimation, and
Editing [VEE] process). At various points during operations, secure File Transfer Protocol (SFTP)
software stability issues in the head-end caused file transfers to EICT to fail, resulting in meter data to
not be correctly processed. Duplicate files were sent to EICT, resulting in apparent meter “spikes,” with
billing determinant files not transferring or processing. Tendril worked with the SFTP vendor to
understand the root causes and developed methods to mitigate this issue, including adding checks to the
process to understand if data has stopped flowing. It should be noted that these data spikes were, at
worst, a temporary presentation issue on the web portal or in-home display and not a billing issue. As
described previously, NSTAR had safeguards in place to ensure that if there was a data integrity issue,
that the bill would be calculated using the participants’ monthly kWh consumption data collected
through NSTAR’s typical meter reading process and the participants’ otherwise applicable rate.
4.4.4 Customer Retention
More than 800 customers or roughly 30% of initial participants had dropped out of the pilot as of
December 2012. NSTAR proactively reached out to customers to keep them informed of the pilot benefits
and opportunities for savings through various efforts, including sending monthly e-newsletters
designed to keep customers engaged, notify them of seasonal rate changes, provide tips and tricks for
saving energy, and provide insights for using the pilot equipment.
NSTAR was also responsive to incidents of customer equipment unexpectedly going offline. When
communication with the customer equipment could not be established for more than 24 hours, NSTAR
sent emails to those customers notifying them of the situation and suggesting that they check for a
disconnected gateway or other causes, or that they contact the pilot support team to obtain help
identifying and remedying the problem. In many cases the customer self-diagnosed and corrected the
issue, or they received the necessary support from NSTAR and came back online. In other cases, NSTAR
could not reach the customer; after this non-communication (neither via email, phone, nor the gateway),
NSTAR removed the customer from the pilot.

NSTAR Smart Grid Pilot– Final Technical Report Page 48 June 30, 2014
Despite NSTAR’s efforts, the survey findings indicate that improved communication, particularly about
the purpose of the pilot and its expected benefits, may be worthwhile. The most commonly cited reason
for dropping out of the program was that participants were “uncertain what the program was supposed
to accomplish.” Former participants also cited a number of other communications, service, and
technology-related reasons for dropping out of the program, as shown in Figure 4-13.
Figure 4-13. Customer Reasons for Dropout
59%
2%
5%
6%
6%
6%
8%
9%
10%
13%
14%
15%
20%
0% 10% 20% 30% 40% 50% 60%
Other
Couldn’t get service when I needed it
Just not interested
Concerned my bills may increase
My bills increased
Service was not helpful
Concerned about privacy of my information
The thermostat didn’t work right/couldn’t set it/couldn’t read it
Couldn’t get my questions answered
The equipment installed interfered with my Internet, TV, etc.
Too time consuming
Too complicated
Uncertain about what the program’s supposed to accomplish
% of all respondents (n=120)
Reasons for Drop-Out
Note: respondents could select more than one reason. "Other" responses most commonly mentioned problems with equipment incompatibility or malfunctions.
Source: Dropout survey

NSTAR Smart Grid Pilot– Final Technical Report Page 49 June 30, 2014
5 Technology Assessment
The Technology Assessment reviewed the functionality and effectiveness of the customer-facing
elements, and analyzed the pilot architecture performance as an integrated system. Customer-facing
technologies include the web portal, in-home displays, and smart thermostats, but other equipment was
also installed in participants’ homes such as communication gateways and ERT bridges to form the
complete home area network (HAN). Examination of the customer-facing elements leveraged customer
feedback obtained through a series of surveys conducted throughout the pilot period. This information
provided customer perspectives on the perceived usefulness and value of these elements.
Examination of the integrated system performance was primarily performed using data provided by the
Smart Grid technology itself. This review examined system communication success and failure rates,
AMR/ERT meter data collection completeness, processing of meter reads, and use of pilot-generated
meter data for successful customer billing.
The assessment addressed the following areas:
1. Customer-facing technology
2. System infrastructure
3. Effective functionality of the AMR/HAN/broadband architecture
5.1 Customer-Facing Technology
The customer-facing technology—those elements which actually engaged customers and provided
information or interaction—constitute an essential and highly visible component of the pilot technology
architecture. Evaluation and assessment of the customer-facing technology includes the following types
of equipment installed in a participant’s home:
1. Web portal
2. In-home display
3. PCT
5.1.1 Web Portal
The web portal was provided by the Tendril cloud-based platform, and was accessed by the participant
using a computer connected to the Internet via the participant’s broadband Internet connection. Relevant
information from the customer’s meter and other in-home equipment, as well as information from
NSTAR back-office systems, was collected by the cloud-based head-end platform, and provided to the
participant via this path.

NSTAR Smart Grid Pilot– Final Technical Report Page 50 June 30, 2014
A computer was used to set up and commission HAN devices during installation, and then to view
meter readings and other information that was being collected during the operational phase. The user
could log onto the web portal interface and access different types of information, including interval data
from a past day, current energy usage (updated every 15 minutes as long as information was being
transmitted), current electricity price, and projected end-of-month bill. The participant was also able to
receive some helpful energy-saving tips based on their usage patterns and other information (Figure
5-1).
Figure 5-1. Web Portal Interface
Source: NSTAR

NSTAR Smart Grid Pilot– Final Technical Report Page 51 June 30, 2014
The web portal was used infrequently by most participants, though most believe it to be useful and
would sign up for a similar service if offered again. Most participants accessed the web portal at least
once during the pilot (85%), and almost three-quarters (72%) accessed it at least once within the final
year of the pilot. Many participants reported accessing the portal more frequently during the first few
months of the pilot than they did in the last year (44% of all participants).28 By the end of the pilot,
almost half (43%) reported accessing the portal “rarely”, as shown in Figure 5-2. There were no
statistically significant differences in frequency of web portal use between the different pilot test groups.
Figure 5-2. Frequency of Using Web Portal in Past Two Years
More than once a day,
1%
Once a day, 3%
Several times a week, 4%
Once a week, 10%
Every other week, 11%
Rarely, 43%
Don't know, 0%
Not accessed during past
year, but accessed
previously, 13%
Never accessed, 15%
Source: Post-pilot survey of participants, n = 305
There was a small percentage of participants (about 18%) that found the portal useful enough to
continue to visit it once per week or more. These participants might be called an enthusiasts group, and
evidently found value in the information provided on the portal. A much larger group, however
(slightly over 70%) used the portal rarely to never, indicating that there was not enough value in it for
them to frequent the site. To reach this group with future offerings, it is likely that more compelling site
content or engagement would be required.
28 Comparison of various survey results between the midpoint survey and the post-pilot survey confirm that web
portal use declined over the course of the pilot. In the midpoint survey, 19% of all participants used the web portal
daily or several times per week, compared to 8% of participants in the post-pilot survey.

NSTAR Smart Grid Pilot– Final Technical Report Page 52 June 30, 2014
Figure 5-3 shows participant reactions to several aspects of the web portal. Web portal users most often
rate the data accuracy positively (67% positive); the most negative ratings were for data usefulness (18%
negative).
Figure 5-3. Participant Ratings of Web Portal Characteristics
67%60% 59% 58%
7%13% 17% 18%
5%18% 14% 15%
21%9% 11% 9%
0%
10%
20%
30%
40%
50%
60%
70%
80%
90%
100%
Accuracy Usefulness Appearance Navigation
Don't know
Negative (1-3)
Neutral (4)
Positive (5-7)
Source: Post-pilot survey of participants, portal users only, n = 259
More than three-quarters (83%) of all participants would sign up for a similar web portal if it were
offered again at no cost. Participants in the CPP (88%), Rebate (85%), and CPP-LC (83%) groups were
more interested in a future portal offering, relative to the Info group (76%). So, despite infrequent usage,
interest in having this functionality remained high, indicating that a future web portal offering might be
well received.

NSTAR Smart Grid Pilot– Final Technical Report Page 53 June 30, 2014
5.1.2 In-Home Display
The IHD received a subset of information available on the portal, owing to the smaller screen real-estate
available on this device and the functionality offered in the device, but it was designed to be an easily
accessible means of conveying key program and consumption information to participants. The IHD was
approximately 4 inch by 6 inch by 1 inch device with a small LCD black and white screen, as shown in
Figure 5-4. The device was powered from a wall outlet, and connected via the ZigBee wireless HAN
connectivity to the Internet gateway.
The participant could access several different screens of information using buttons on the front of the
device to move from current price information to end of monthly projected bill based on recent usage.
Figure 5-4. In-Home Display-Different Screen Displays
Nearly half (48%) of participants reported using their in-home display “frequently” and another 25%
used it “occasionally”, as shown in Figure 5-5; participants reported very similar usage frequency in the
midpoint survey, indicating that in-home display use has remained fairly consistent over the duration of
the pilot.
Figure 5-5. Frequency of Using In-Home Display
Frequently, 48%
Occasionally, 25%
Infrequently, 18%
Never, 9%
Don't know, 0.3%
Source: Post-pilot survey of participants, n = 305

NSTAR Smart Grid Pilot– Final Technical Report Page 54 June 30, 2014
Participants generally thought the in-home display was useful; 42% of participants describe the in-home
display as “extremely helpful” or “very helpful” in making decisions about electricity usage. There are
no statistically significant differences among treatment groups for this metric.
Figure 5-6. Usefulness of In-Home Display in Making Decisions About Electricity Usage
Extremely helpful,
21%
Very helpful,
21%Somewhat helpful,
33%
Not at all helpful,
24%
Don't know, 1%
Source: Post-pilot survey of participants, n = 305
The most common reason for not using the in-home display more frequently was unreliable Internet
access or no Internet access at all, cited by 20% of participants; 9% prefer to look at the information on
the web portal and another 9% would have preferred a mobile app option. It should be noted that since
the initial pilot design and deployment, Tendril had ceased production of an IHD in favor of a more
user-friendly mobile app.
The IHD provided more consistent access to the key elements of information for a larger percentage of
participants, and use did not decline, as with the portal. As such, the IHD seems to have been a more
effective mode of communication to many participants than the portal. It may be that the ease of
accessing this key information on the IHD is one reason that portal usage dropped off (although we
cannot say for sure), as users were able to get the information they valued from the IHD.

NSTAR Smart Grid Pilot– Final Technical Report Page 55 June 30, 2014
5.1.3 Programmable Communicating Thermostat
As with the IHD, the PCT communicated via ZigBee wireless signal to the gateway, receiving
information via the cloud-based head-end platform. The PCT (shown in Figure 5-7) was a principal
means to control and manage household energy use over the course of the pilot, and was also essential
for NSTAR’s execution of automated load control during CPP events.
Figure 5-7. Programmable Communicating Thermostat
As mentioned in the Program Process section above, some of the equipment installations were difficult
due to thermostat incompatibility with HVAC wiring. In addition, some customers found the
thermostats complex to use and had some characteristics that caused participants to report errors in
certain circumstances. For example, the thermostats flashed a red light-emitting diode (LED) when they
lost connectivity with the HAN and the Internet. Some customers complained about this, and NSTAR
addressed the issue by replacing some of the thermostats. NSTAR anticipated that the blinking light on
the older-model thermostats would cause many complaints once the HAN was shut off at the end of the
pilot. Consequently, NSTAR proactively removed thermostats to help ensure that these customers did
not end the pilot with a negative experience.
In addition, partway through the Pilot, a newer thermostat model became available from Tendril and
NSTAR began installing this new model instead of the original model. The new model was thought to be
simpler to use and was flexible enough to be installed with more home wiring configurations than the
original thermostat.

NSTAR Smart Grid Pilot– Final Technical Report Page 56 June 30, 2014
Participant opinions on the thermostat were mixed. Over one-third (36%) of thermostat recipients
believe that the pilot thermostat was not as good as the one it replaced, often citing difficulty of use, as
indicated in Figure 5-8.
Figure 5-8. Opinions on Pilot Thermostat Relative to Old Thermostat
Much better than the
thermostat it replaced, 20%
Somewhat better than the thermostat it replaced, 18%
About the same as the
thermostat it replaced, 20%
Not as good as the thermostat it replaced, 36%
Don't know, 5%
Source: Post-pilot survey of participants, thermostat recipients only, n = 128

NSTAR Smart Grid Pilot– Final Technical Report Page 57 June 30, 2014
Thermostat recipients who felt that the pilot thermostat was better than their old thermostat most often
liked the programmable feature (20% of all thermostat recipients), and 12% liked the ability to access it
remotely using the web interface (Figure 5-9).
Figure 5-9. Pros and Cons of the Pilot Thermostat
6%3%
12%
2%
20%
1% 1% 2% 1%
32%
1%5%
1%0%
5%
10%
15%
20%
25%
30%
35%Ea
sy t
o u
se
Larg
e d
isp
lay
Ab
ility
to
acc
ess
on
line/
rem
ote
ly
Flex
ibili
ty
Pro
gram
mab
le f
eatu
re
Mo
ney
sav
ings
Ad
dit
ion
al in
fo/c
on
tro
l
Vac
atio
n f
eatu
re
Man
ual
Dif
ficu
lt t
o o
per
ate
Co
uld
no
t co
ntr
ol r
em
ote
lyvi
a ap
p/s
mar
tph
on
e
Bro
ke/p
oo
r q
ual
ity
It w
as o
k
Pros Cons
% o
f A
ll Th
erm
ost
at R
ecip
ien
ts
Source: Post-pilot survey of participants, thermostat recipients only, n = 128
The PCT was a critical piece of technology for actively managing load and energy, and at the same time
one of the most complex and expensive to install and also for the participants to operate.

NSTAR Smart Grid Pilot– Final Technical Report Page 58 June 30, 2014
5.1.4 Customer Perspectives on Equipment Performance
Participants responded to midpoint survey questions on the overall impression of the HAN equipment,
including the customer-facing elements above but also the other elements including HAN Gateway and
the ERT bridge.
One-third of customers responding to a midpoint survey reported no equipment problems. This leaves
more than half having experienced some type of equipment problem, with most of these being an
apparent problem with the device itself (e.g., need to reboot or blank screen). About one in six customers
reported Internet connectivity issues that resulted in nonfunctioning equipment (Figure 5-10).
Figure 5-10. Types of Equipment Problems Experienced by Participants
Addressing device quality issues as well as finding ways to mitigate issues caused by intermittent
connectivity losses will be important issues for future programs.
5.2 System Infrastructure
Many pieces of system infrastructure were leveraged to get meter data, event signals, and other
information to and from the customer-facing equipment. An overview of this system infrastructure is
provided in Section 4.2 above. Some key findings that help provide insights into pilot system operation
are presented below, addressing the following topics:
1. AMR meter data resolution
2. Meter data processing
3. Meter data quality as an indicator of system performance
4. Data use in billing analysis
5. Equipment response to events

NSTAR Smart Grid Pilot– Final Technical Report Page 59 June 30, 2014
5.2.1 AMR Meter Data Resolution
The interval consumption data generated by the system provides a number of insights into system
operation and issues that occur during operation. The raw interval consumption data collected by the
system was available for analysis. One interesting observation in the interval data is that two different
types of meters were used in this service area, each with different kWh resolution capabilities.
The high (10 watt-hour) resolution meters tend to show steadily varying consumption as electrical loads
switch on and off in the home. The lower (1,000 watt-hour, or 1 kWh) resolution meters, however, do not
register increases in consumption until each time the home has used an incremental 1 kWh of electricity;
when the average load in a home is less than 1 kW, this means that an hour can pass with no discernible
change in the meter reading (Figure 5-11).
Figure 5-11. Relative Resolution of Decawatt-Hour and Kilowatt-Hour Meters
0
0.2
0.4
0.6
0.8
1
1.2
1.4
1.6
1.8
2
0:0
0
1:0
0
2:0
0
3:0
0
4:0
0
5:0
0
6:0
0
7:0
0
8:0
0
9:0
0
10
:00
11
:00
12
:00
13
:00
14
:00
15
:00
16
:00
17
:00
18
:00
19
:00
20
:00
21
:00
22
:00
23
:00
Interval kWhAugust 2, 2011
low resolution
high resolution
Source: NSTAR and Tendril meter data
These lower resolution meters were also equipped with lower power radios, which presented a
challenge at times to for the ERT (Translate) devices to receive the consumption information so it could
be transmitted onto the HAN network and collected. In some cases, these lower powered meters were
swapped out for a higher powered one and a HAN connection was successfully made. For customers
looking to in-home displays or web histories to help understand how small changes in behavior affect
electricity usage, the lower resolution data did not reveal the energy consumption impacts as readily,
and in some cases underperformed customer expectations.
5.2.2 Meter Data Processing
The analysis looked at and leveraged consumption data at different stages of processing. The meter
readings taken directly from the meters are referred to here as “raw” data. This data is then “snapped”
to 15-minute boundaries, and finally the data is processed through a VEE process to fill in gaps and

NSTAR Smart Grid Pilot– Final Technical Report Page 60 June 30, 2014
make it appropriate for billing. These three levels of interval data processing are referred to below, and
include:
» “Raw” meter data—readings taken directly off the ERT radio, which are time stamped but not
aligned to 15-minute interval boundaries29
» “Snapped” interval data—which take the “raw” readings and snaps them to a 15-minute time
boundary, creating 15-minute interval data
» “Estimated” interval data—which process the snapped interval data using a VEE algorithm to
fill in gaps, address abnormalities, and prepare the data to be used for billing purposes
The Technical Assessment examined data at these various levels of processing to try and understand if
the process was working correctly. This examination identified certain abnormalities which did not
affect the impact analysis, but they are noteworthy nonetheless.
Figure 5-13 shows some of these abnormalities through a single meter providing data over a period of a
day or more, with the snapped interval data in blue and the estimated data in red. The figure shows a
fairly constant rate of consumption over several days, seen in blue, but the estimated data diverges from
this at two significant points. It is not clear why this happens, but it is likely an error that could be fixed
upon examination and modification of the VEE algorithm being used. One possible explanation is that
the estimated data was processed initially without the full set of actual data, as shown in blue. If the
actual data was received after the estimated data was processed but the estimated data was not then re-
processed, a divergence as seen in Figure 2-14 may result.
Figure 5-12. Estimation Abnormality
Source: NSTAR
29Recall that the ERT readings are received asynchronously, and don’t fall on 15-minute boundaries, but may fall
anywhere within a 15-minute interval. These readings are received by the Tendril system, time stamped, and sent to
the cloud-based head-end. A post-process is used to take this time-stamped data and “snap” it to 15-minute
boundaries, so that it turns into a stream of 15-minute interval data that can be used for TOU billing, etc.

NSTAR Smart Grid Pilot– Final Technical Report Page 61 June 30, 2014
This example illustrates the value of visualizing this information to spot anomalies. The meter data was
run through a number of other tests and checks to spot anomalies and in some cases raw data was
removed from the impact analysis. It should be noted that these data anomalies would not result in a
billing issue to the customer. As described previously, NSTAR had safeguards in place to ensure that if
there was a data integrity issue that the bill would be calculated using the participant’s monthly kWh
consumption data collected through NSTAR’s typical meter reading process and the participant’s
otherwise applicable rate.
5.2.3 Meter Data Quality as an Indicator of System Performance
An objective of the pilot was to understand the degree to which communications using customer
broadband was effective in delivering interval meter data to NSTAR that was suitable for billing
purposes as well as for impact assessment. To perform this assessment, Navigant examined the meter
interval data that was available to the NSTAR utility back-office systems to understand the success rates
of the overall interval data collection. This data provided insight into the operation of the system as a
whole, including broadband communications, the cloud-based, head-end functionality, the meter
interval data estimation process, and the timeframe in which issues occurred. (Note that the analysis
does not allow determination of where the problem occurred in the list above, only when.)30
The results of this assessment are shown in Figure 5-13, which shows several years of interval data
collected and compares interval data at different levels of processing to see what insights can be gained.
Using this view, we can see the points at which significant interval data, both snapped and estimated, is
missing and can speculate about the reasons.
This figure shows the pilot time line on the horizontal axis, and the number of pilot participants on the
vertical axis. Each of the approximately 20,000 vertical lines (too narrow to see each discrete line)
represents a single hour interval period during the pilot. The height of each vertical line (to the top of the
shaded area, including all four color components) indicates the amount of meter interval data that is
theoretically possible to collect for that hour period--all intervals for all participants that have enrolled to
that date (including participants who have dropped out by that date). The color categories then break
that theoretical maximum number of observations for that hour interval into the following four
categories:
» Raw-snapped: As describe above, this is raw interval data collected from the ERT radio
readings, but processed to be “snapped” to a 15-minute interval boundary. The raw-snapped
data was submitted on a daily basis to an external provider of meter data processing services
and VEE processes to perform the estimation process.
» Estimated: Interval data after the VEE process is used on the raw-snapped data above to fill in
missing intervals and make other estimations based on the nature of the data, to prepare it for
billing purposes.
» Missing: This is the amount of interval data “missing” for that hour period (not present in the
system, but which should be present based on the number of currently enrolled
30 The Tendril equipment did not provide link-level protocol success rates on the broadband customer connection.
As such, Navigant conducted this analysis using the process described here.
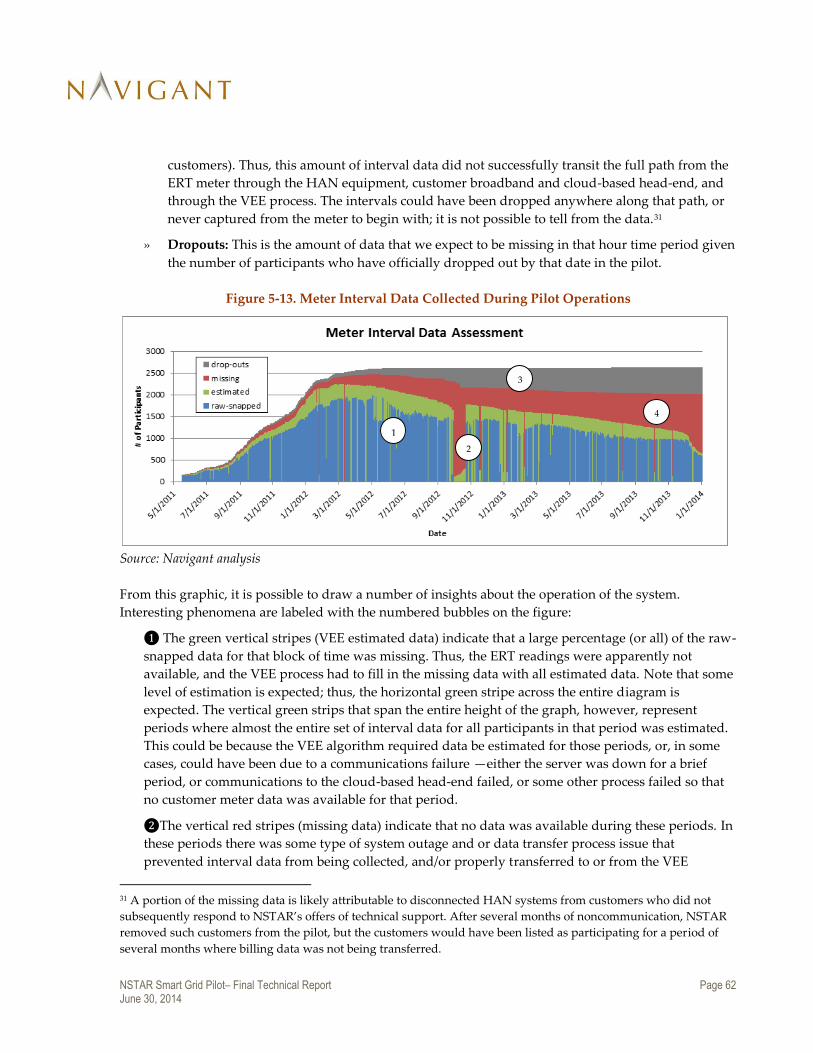
NSTAR Smart Grid Pilot– Final Technical Report Page 62 June 30, 2014
customers). Thus, this amount of interval data did not successfully transit the full path from the
ERT meter through the HAN equipment, customer broadband and cloud-based head-end, and
through the VEE process. The intervals could have been dropped anywhere along that path, or
never captured from the meter to begin with; it is not possible to tell from the data.31
» Dropouts: This is the amount of data that we expect to be missing in that hour time period given
the number of participants who have officially dropped out by that date in the pilot.
Figure 5-13. Meter Interval Data Collected During Pilot Operations
1
2
3
4
Source: Navigant analysis
From this graphic, it is possible to draw a number of insights about the operation of the system.
Interesting phenomena are labeled with the numbered bubbles on the figure:
❶ The green vertical stripes (VEE estimated data) indicate that a large percentage (or all) of the raw-
snapped data for that block of time was missing. Thus, the ERT readings were apparently not
available, and the VEE process had to fill in the missing data with all estimated data. Note that some
level of estimation is expected; thus, the horizontal green stripe across the entire diagram is
expected. The vertical green strips that span the entire height of the graph, however, represent
periods where almost the entire set of interval data for all participants in that period was estimated.
This could be because the VEE algorithm required data be estimated for those periods, or, in some
cases, could have been due to a communications failure —either the server was down for a brief
period, or communications to the cloud-based head-end failed, or some other process failed so that
no customer meter data was available for that period.
❷The vertical red stripes (missing data) indicate that no data was available during these periods. In
these periods there was some type of system outage and or data transfer process issue that
prevented interval data from being collected, and/or properly transferred to or from the VEE
31 A portion of the missing data is likely attributable to disconnected HAN systems from customers who did not
subsequently respond to NSTAR’s offers of technical support. After several months of noncommunication, NSTAR
removed such customers from the pilot, but the customers would have been listed as participating for a period of
several months where billing data was not being transferred.

NSTAR Smart Grid Pilot– Final Technical Report Page 63 June 30, 2014
process. The large vertical red stripe in the October through November of 2012 indicates a sustained
failure that prevented appropriate meter data collection and processing for more than a week.
❸The number of dropouts, as accounted for in the program, is shown in the graph to increase over
time.
❹The amount of meter interval data being collected after a peak in March of 2012 is seen to steadily
decrease over time. The gap between the officially counted dropouts and the number of participant
systems actually reporting meter data widens starting in November of 2012, indicating that the
official account of dropouts may be missing some participants that have effectively dropped out
because the equipment is no longer functioning (possibly unplugged), broadband communications
is not working, or some other problem is preventing the collection of interval data.
Looking at the interval data in this way, it is possible to get an idea of the efficacy of system operation as
a whole over the entire pilot period. The system was able to provide estimated data, suitable for billing,
for much of the pilot period (the exception being the red vertical lines where estimated data dropped
out—with one period of major system dropout). There were many short periods throughout the pilot
where estimated data filled in for a lack of actual raw data collected from the meters (the vertical green
stripes throughout). And finally, the method of counting official dropouts may not account for some
participant attrition as indicated by the declining amount of meter data being collected after the peak
in the spring of 2012.

NSTAR Smart Grid Pilot– Final Technical Report Page 64 June 30, 2014
5.3 Effective Functionality of the AMR/HAN/Broadband Architecture
At the outset of the pilot, it was anticipated that the pilot Smart Meter architecture based on existing
AMR meters and installed HANs would provide many of the features and capabilities of a full AMI
deployment such as remote upgrades, net metering, and meter diagnostics. Table 5-1 presents a list of
the features and capabilities of AMI systems, along with an assessment of how well the AMR/HAN
architecture of the pilot performed with regard to each.
Some, but not all, of these system features were demonstrated as part of the pilot, as shown in the figure.
The first four features shown were examined in detail as part of the pilot evaluation.
Table 5-1. Comparison of Features: AMI vs. Pilot Architecture
Description Pilot Architecture
with HAN (achieved)
System Feature Comparison
Interval Data
15-minute, whole house, interval data for both billing and impact assessment was successfully provided, with some data anomalies, as discussed extensively in the sections above.
Customer Information
Information such as household consumption, current electricity price, and projected monthly bill was successfully communicated to customers, with some interruptions and delays.
Direct Load Control Critical events were successful and achieved the load reductions described in the Impact section.
Temperature Setbacks Setbacks were successfully used as the method of shedding load during demand events, again, as described in the Impact section.
Remote Upgrades
Firmware upgrades of remote devices were successfully achieved, although not at a scale that provides much certainty about the efficacy of this approach to upgrade to new product features in the future. NSTAR did not attempt to push many firmware upgrades as part of the project in order to limit the amount of re-testing required in a limited duration pilot, and in order to keep the customer’s experience as consistent as practical throughout the pilot.
Revenue Protection
The pilot was not designed to test or enable these features.
Net Metering
Meter Diagnostics
Remote Disconnect
Automated Outage Reporting
Source: Navigant analyses
The findings suggest, despite some of the issues discussed above, that the broadband, HAN, and back-
end systems are capable of providing the necessary data transfer for enhanced customer information and
for TOU/CPP billing. However, it also indicates that consistency and reliability improvements are
needed to ensure that NSTAR can provide customers with the Smart Grid rates and services without
having to revert to standard rates when interval data is not available.

NSTAR Smart Grid Pilot– Final Technical Report Page 65 June 30, 2014
Based on the relatively high frequency of customer HANs going offline, any future application of the
Smart Grid architecture to outage detection should assess multiple participant homes on the same feeder
to eliminate false outage indications that are attributable to individual customers disconnecting.
The observations above merit further analysis prior to wide-scale deployment.

NSTAR Smart Grid Pilot– Final Technical Report Page 66 June 30, 2014
6 Conclusions
This evaluation of NSTAR’s Smart Energy Pilot has provided many individual findings related to the
electricity usage impacts, technology performance, and administrative process of NSTAR’s offering the
Smart Grid technology and rate package to customers. Beyond these details emerge broader learnings
that can guide future business and policy decisions related to Smart Grid investments. The following
discussion presents key takeaway from the pilot with respect to customer interest, energy and demand
impacts, technology performance, and participant engagement.
6.1 Key Takeaways
1. Smart Grid offerings may appeal to only a limited segment of the population—principally
educated, affluent, and technologically savvy customers—absent long-term education efforts
and innovative marketing approaches to pique the interest of the broader customer base.
Customer interest in the pilot was relatively strong initially, with response rates to NSTAR’s
direct mail and email marketing efforts of 4% and 7%, respectively, compared to the 2% to 4%
response rates typically seen in Smart Grid program recruitment.32 While the overall response
rate was high, customers expressing interest and enrolling in the pilot were primarily highly
educated, affluent households, often with an expressed or demonstrated interest in technology.
Despite concerted efforts by NSTAR to market to less affluent neighborhoods, low-income
customers did not enroll in high numbers, as evidenced by only about one percent of
participants being on the R2 rate and roughly four percent reporting income below 60% of the
median level for their household size.
2. Pilot impacts on energy consumption were consistent with industry experience in several
respects (e.g., peak period reductions from TOU rates and load control), but were inconclusive
with regard to whether the pilot’s provision of energy usage information enables significant
reductions in overall energy consumption. The pilot’s technology and rate offerings were
designed to enable three types of reduced consumption: 1) peak period load reductions, 2) load
curtailments during critical events, and 3) overall reduction in energy consumption
(monthly/seasonally/annually). Consistent with industry experience, the pilot successfully
demonstrated peak period reductions, particularly for customers on TOU rates. NSTAR
specifically designed peak rates to be significantly higher than off-peak rates in order that
participants could reduce their electricity bills by shifting load away from peak hours.33 Load
curtailment during critical events was also successful, particularly where long-established DLC
32 Smart grid marketing response rates are based on market research conducted by Navigant for the NSTAR Smart
Grid Pilot Implementation and Marketing Plan, March 2010 (see Appendix C)
33 Over the past decade, many utilities have developed TOU and CPP rates with much larger peak- to off-peak price
differentials than in previous years. See Schare, S., “TOU Rates as TOU Rates As If Prices Mattered: Reviving an
Industry Standard for Today’s Utility Environment,” American Council for an Energy-Efficient Economy (ACEEE)
Summer Study, August 2008.
NSTAR Smart Grid Pilot– Final Technical Report Page 67 June 30, 2014
of central air conditioners was employed.34 Less certain is whether the Smart Grid’s provision of
access to energy consumption information successfully encourages and enables customers to
save energy over the long term. Energy savings was minimal (2% on average for those on TOU
rates, and a statistically insignificant change for others), with all groups showing a marked
decline in savings after the first nine months of the pilot.
3. The pilot demonstrated that the technology architecture is capable of AMI-like features
through the collection of interval meter data, but that it is not yet viable for the widespread
provision of customer information and dynamic rate tariffs. While the pilot generally
demonstrated the capability to deliver on these objectives for many customers, most of the time,
the lack of reliability remains a major functional limitation. The following are among the
significant reliability issues that must first be addressed before a similar system is deployed on a
large scale as an alternative to revenue-grade metering:
a. Usability of the technologies, from the thermostat that was difficult to install, to the
accessibility of customer data, which was not available on mobile applications;
b. Data intermittency from HAN system disconnections and temporary failure of back-end
systems, both of which led to gaps in meter data that rendered TOU rates incomplete
and resulted in defaults to the flat rate;
c. Complexity and inconsistency of meter data validation/estimation process, which caused data
gaps and mis-alignment of intervals, resulting in differences in monthly consumption
estimates between the interval data from the pilot architecture and the monthly drive-by
reads from NSTAR’s standard meter reading procedures.
Advances in technology since the initial pilot Soft Launch in 2010—such as wireless gateways
using IP, extended on-site storage of information, and mobile phone apps—suggest that at least
some of the issues raised by the pilot may be substantially resolved and that a similar approach
to reading the AMR meters but leveraging these newer technologies might be more effective,
and possibly lower cost.
4. Participant perspectives on the pilot were generally positive, but the trend of diminishing
interest over time raises questions about the long-term impacts of a future offering, especially
if provided to all customers on an opt-out basis. The positive customer reviews of the pilot are
a testament to the strong delivery and positive messaging that NSTAR put forth from initial
marketing to final closeout of the pilot. However, this is offset by the decline in enrollment by
more than one-third over less than two years, and the decline in participant engagement (even
among those who remained in the pilot, as evidenced by declining energy impacts and reduced
use of the web portal and in-home displays). The implication is that a Smart Grid program
requiring sustained engagement may not be for all customers; even those initially enthusiastic
may lose interest over time.
34 The pilot was among a small minority of demand response programs in its use of customer broadband to
communicate load control signals to participants. However, the achievement of consistent load reductions from
direct load control, typically via radio frequency or very-high-frequency (VHF) paging, is well established in the
industry.

NSTAR Smart Grid Pilot– Final Technical Report Page 68 June 30, 2014
6.2 Implications for the Future
Taken collectively, the above takeaways have several broad implications for the future of a possible
customer-facing Smart Grid offering at NSTAR based on AMR meters and customer broadband:
1. The pilot achieved its “technology validation” objective, including verification that “smart
meter” functionality can be achieved without deployment of an advanced metering
infrastructure. The general Smart Grid architecture approach, after improvements in
technology and data management, can be an effective, low-cost way for NSTAR or other
utilities with AMR meters to enable energy information and TOU rates for customers who
want it, without investing in new metering infrastructure for all customers.
a. The residential sector is limited as a source of reducing peak load costs to lower costs
for all ratepayers. As a group, residential customers are not the driver of peak loads
within NSTAR’s service territory. The ISO New England system peak occurs between
1pm and 5pm, before many residential customers return from work outside the home.
This is part of the reason that residential customers account for only about 38% of
NSTAR summer peak load,35 and it implies that targeting the residential sector en masse
could be a high-cost/low-impact approach—especially if many customers do not actively
respond to the technology and rate offering.
b. Only a narrow segment of the population likely to participate or contribute to
savings. The pilot demonstrated that interest among customers is predominantly among
more affluent and educated customers, with the relatively few low-income participants
showing an interest or ability to conserve energy. These demographic groups represent
only a small share of the population, and NSTAR survey research revealed that nearly
half of customers who did not respond to the pilot offering would not be persuaded
regardless of what NSTAR offered. Even the most subscribed TOU rates in the country
have attracted no more than half of the residential population, and DLC programs only
about 25-30% of eligible customers.
c. Savings will come from larger customers with discretionary loads. NSTAR’s vision is
to track technological progress and when appropriate deploy a more robust version of
the pilot architecture. Target markets would be customers who express interest in
reducing and shifting loads and those with large discretionary loads—particularly those
with central air conditioning (roughly 38% of NSTAR’s residential customer base) or
pool pumps, who have the greatest opportunity to change their energy usage patterns.36
35 Source: NSTAR and Massachusetts Residential Appliance Saturation Survey (RASS), prepared by Opinion
Dynamics Corp. for NSTAR and four other Massachusetts utilities, April 2009. The RASS study found a central AC
saturation of 32%, a figure that NSTAR estimates has now reached 38%.
36 The pilot demonstrated that direct load control (DLC) of central air conditioning using customer-sited broadband
communications is a viable alternative to the most common forms of A/C load control using paging networks.
Impacts were similar to typical DLC programs, accounting for the relatively mild temperatures in NSTAR’s service
territory. Similar to the pilot architecture, new load control efforts across the country are increasingly using two-way
communications—including customer-provided broadband—to improve reliability and identify nonfunctioning
equipment.

NSTAR Smart Grid Pilot– Final Technical Report Page 69 June 30, 2014
2. The market offering must communicate to customers that they have an important role to play
in ensuring the system functions as designed. Customers have a reciprocal role in that NSTAR
will need customers to help maintain the operability of the in-home devices and broadband
communications in order for NSTAR to provide usage information and bill customers on
dynamic rates.
3. A successful offering of dynamic rates and visibility into customer usage information will
require an aggressive and intelligent marketing effort to reach customers and engage them to
act over a sustained period of time. The pilot demonstrated that only a relatively narrow
segment of the population tends to be interested in the technology and rate offerings embodied
in the pilot, and many of these customers lost interest during the course of their participation.
Keeping customers engaged after the initial few months or first year of a Smart Grid offering
will likely require the incorporation of apps for mobile devices where energy information is
more readily accessible and occasional push messaging and event notifications can engage
customers without their having to initiate the engagement.37 To make a similar program a
success, NSTAR will have to draw on its long history as an energy efficiency program
administrator, leveraging innovative marketing approaches to reach the targeted customer base.
6.3 Looking Ahead
NSTAR’s residential Smart Grid pilot has provided a wealth of data on customer perspectives,
technology performance, and programmatic impacts on energy consumption. Collectively, this data can
inform corporate and policy decisions whether and how to pursue similar endeavors in the future. The
pilot has demonstrated the feasibility and promise of residential Smart Grid technologies, while also
revealing their limitations and drawbacks.
In particular, the pilot demonstrated the potential to deliver customer benefits by utilizing existing
metering infrastructure and broadband communications, provided that (1) technology offerings continue
to develop in order to improve usability and reduce data intermittency (2) education and marketing
efforts are robust to be able reach customers and engage them to act over a sustained period of time, and
(3) the solution is targeted to those customers most likely to embrace and benefit from alternative rate
designs and take action by changing their energy usage behaviors.
A decision to invest in a future rollout of similar Smart Grid architecture and program offerings should
be assessed based on the costs relative to the achievable benefits. An important consideration will be
who bears the costs and to whom the benefits accrue—to NSTAR, its participating customers, all NSTAR
ratepayers, or all electricity consumers in the region.
37 Some participants asked for mobile apps via the pre-pilot and mid-point surveys, but the pilot technology suite
had already been established.