Embed Size (px)
Citation preview
NSCLCProgress in the treatmentOptimal Treatment with EGFR-TKI Therapy
Gefitinib vs. Erlotinib
蔡 俊 明蔡 俊 明Chun-Ming Tsai, MDChun-Ming Tsai, MD
Section of Thoracic Oncology Section of Thoracic Oncology Chest DepartmentChest Department
Taipei Veterans General HospitalTaipei Veterans General Hospital
School of MedicineSchool of MedicineNational Yang-Ming UniversityNational Yang-Ming University

EGFR Signaling Biomarkers & Inhibitors
Tumour cellTumour cellproliferationproliferation
PI3K
MAPK
Tumour cellTumour cellsurvivalsurvival
Akt
mTOR
STAT 3/5
Grb-2
Ras
Raf
MEK
ATP
Anti-EGFR AbsCetuximab, Panitumumab, Matuzumab, h-R3, MDX-447
Anti-HER1,HER2,HER4 TKIsGefitinib, Erlotinib, BIBW-2992, PKI-166, GW-572016, CI-1033, AEE788
RAS farnesyltransferase inhibitorsMMS214662, R115777, SCH66336
RAF inhibitorsSorafenib, L-779450
MEK inhibitorsCI-1040, U-0126
mTOR inhibitorsTemsirolimus, RAD001
II
II
II
II
II
II
ATP
SOS
Small molecule Small molecule tyrosine kinase inhibitorstyrosine kinase inhibitors

EGFR Mutations in Adenocarcinoma
33 33
40
29
1013 11
5
0
10
20
30
40
50
60
Ethnicity Gender Smoking Hx Histology
Response Rate vs. Clinical Background
Clinical Background vs. EGFR Mutations
EG
FR
mu
tati
on
(%
)R
R (
%)
32
38
47
30
710
72
0
10
20
30
40
50
60
Ethnicity Gender Smoking Hx Histology
Asian
Non-Asi
an
Femal
e
Mal
e Never
Ever
Adeno
Non-Aden
o
Asian
Non-Asi
an
Femal
e
Mal
e Never
Ever
Adeno
Non-Aden
o
Mitsudomi, IJCO, 2006

Gefitinib- and erlotinib-sensitizing mutations of EGFR
T854A E884KE884K
L747S
D761Y
Mutations associated with drug resistance
Mutations associated with drug sensitivitySharma, et al.
Nat Rev Cancer 2007

100 55 125 288 283 104 102 100 55 125 288 283 104 102
TAX317 TAX320 JMEI IDEAL1 IDEAL2 TAX317 TAX320 JMEI IDEAL1 IDEAL2
2929
Gef
itini
b
7.67.66.56.5
66.866.8 58.658.6
11.811.818.418.4
Gef
itini
b3535
100 55 125 288 283 104 102 100 55 125 288 283 104 102
TAX317 TAX320 JMEI IDEAL1 IDEAL2 TAX317 TAX320 JMEI IDEAL1 IDEAL2
22223131
BS
C
Erlo
tinib
4.74.76.76.7
2828
5353
8.98.9
100 55 125 288 283 104 102 563 1126 243 488100 55 125 288 283 104 102 563 1126 243 488
TAX317 TAX320 JMEI IDEAL1 IDEAL2 ISEL BR21TAX317 TAX320 JMEI IDEAL1 IDEAL2 ISEL BR21
21212727
BS
CG
efiti
nib
5.15.1 5.65.6
3232
4848
88
HR= 0.89HR= 0.89P= 0.087P= 0.087
0.700.70< 0.001< 0.001
~27
~60
~10
~40
428
100 55 125 288 283 100 55 125 288 283
TAX317 TAX320 JMEI TAX317 TAX320 JMEI
1919
30302929 3232 3030
BS
CD
ocet
axel
Doc
etax
el
Pem
etre
xed
4.64.6
7.97.977
5.75.7
8.38.3
1-yr
Sur
viva
l (%
)
MS
(m)
DC
R (%
)1-
yr S
urvi
val (
%)
M
S (m
)
D
CR
(%)
00
44
88
1212
00
1010202030304040
47.347.3
63.463.4
46.646.653.153.1 54.154.1
0
15
30
45
60
75
9.19.18.88.86.76.75.85.8
Doc
etax
el
~~ 7070
~~ 8080
~~ 1414
~~ 4747
117
~60
~27
~10
~40
428
Salvage Treatment in Non-Small Cell Lung Salvage Treatment in Non-Small Cell Lung CancerCancer
Comparison of Comparison of Docetaxel, PemetrexedDocetaxel, Pemetrexed & & EGFR-TKIsEGFR-TKIs GefitinibGefitinib

BR.21 versus ISEL placebo-controlled studies
Favours EGFR TKI Favours placeboHR
0.40 0.60 0.80 1.00 1.20
Erlotinib (BR.21)1
30% reduction in risk of deathp=0.001 Gefitinib (ISEL)2
11% reduction in risk of deathNot significant
1Shepherd FA, et al. N Engl J Med 2005;353:123–322Thatcher N, et al. Lancet 2005;366:1527–37
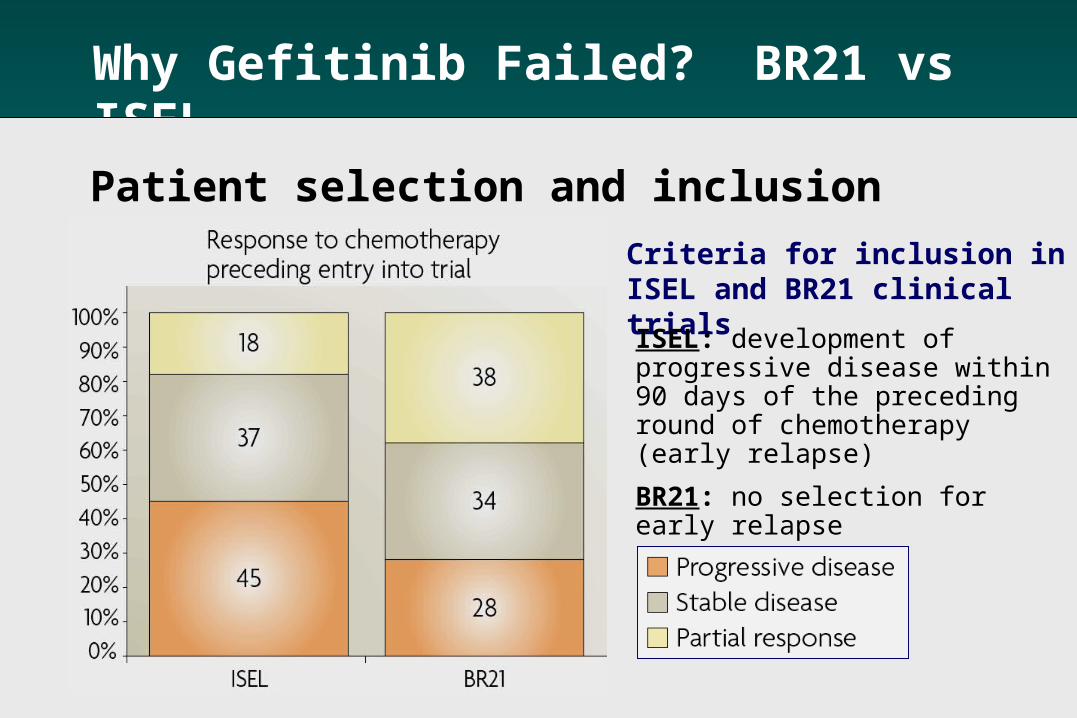
Why Gefitinib Failed? BR21 vs ISEL
Patient selection and inclusion criteria
Criteria for inclusion in ISEL and BR21 clinical trials
ISEL: development of progressive disease within 90 days of the preceding round of chemotherapy (early relapse)
BR21: no selection for early relapse

100 55 125 288 283 104 102 100 55 125 288 283 104 102
TAX317 TAX320 JMEI IDEAL1 IDEAL2 TAX317 TAX320 JMEI IDEAL1 IDEAL2
2929
Gef
itini
b
7.67.66.56.5
66.866.8 58.658.6
11.811.818.418.4
Gef
itini
b3535
100 55 125 288 283 104 102 100 55 125 288 283 104 102
TAX317 TAX320 JMEI IDEAL1 IDEAL2 TAX317 TAX320 JMEI IDEAL1 IDEAL2
22223131
BS
C
Erlo
tinib
4.74.76.76.7
2828
5353
8.98.9
100 55 125 288 283 104 102 563 1126 243 488100 55 125 288 283 104 102 563 1126 243 488
TAX317 TAX320 JMEI IDEAL1 IDEAL2 ISEL BR21TAX317 TAX320 JMEI IDEAL1 IDEAL2 ISEL BR21
21212727
BS
CG
efiti
nib
5.15.1 5.65.6
3232
4848
88
HR= 0.89HR= 0.89P= 0.087P= 0.087
0.700.70< 0.0001< 0.0001
~27
~60
~10
~40
428
Salvage Treatment in Non-Small Cell Lung Salvage Treatment in Non-Small Cell Lung CancerCancer
Comparison of Comparison of Docetaxel, PemetrexedDocetaxel, Pemetrexed & & EGFR-TKIsEGFR-TKIs 100 55 125 288 283 100 55 125 288 283
TAX317 TAX320 JMEI TAX317 TAX320 JMEI
1919
30302929 3232 3030
BS
CD
ocet
axel
Doc
etax
el
Pem
etre
xed
4.64.6
7.97.977
5.75.7
8.38.3
1-yr
Sur
viva
l (%
)
MS
(m)
DC
R (%
)1-
yr S
urvi
val (
%)
M
S (m
)
D
CR
(%)
00
44
88
1212
00
1010202030304040
47.347.3
63.463.4
46.646.653.153.1 54.154.1
0
15
30
45
60
75
9.19.18.88.86.76.75.85.8
Doc
etax
el
GefitinibGefitinib
~~ 7070
~~ 8080
~~ 1414
~~ 4747
117
~60
~27
~10
~40
428

Consistent OS with placebo in BR.21 and ISEL demonstrates similar study populations
Pro
po
rtio
n s
urv
ivin
g
1.0
0.8
0.6
0.4
0.2
00 2 4 6 8 10 12 14 16 18 20 22 24 26 28
Time (months)
Placebo (BR.21)1
Placebo (ISEL)2
1Shepherd FA, et al. N Engl J Med 2005;353:123–322Thatcher N, et al. Lancet 2005;366:1527–37

Why Gefitinib Failed? BR21 vs ISEL
Drug dosing

Erlotinib and GefitinibSimilar structures, Different activity?
• Structural differences may affectStructural differences may affect– plasma, tumour and normal tissue distributionplasma, tumour and normal tissue distribution– metabolismmetabolism– in-vitro activityin-vitro activity– clinical efficacy and toxicityclinical efficacy and toxicity
Erlotinib Gefitinib
O
OO
O
NH
N
N
CI
F
N
O NH
N
O
O
NH
O
O
N
MW 429.2 MW 446.9

Erlotinib is less lipophilic than gefitinib
cLogP = 3.30 cLogP = 3.87
Three-fold difference in lipophilicity Greater susceptibility to metabolism Increased biliary elimination Increased protein binding Reduced free drug plasma concentration
Erlotinib Gefitinib
O
OO
O
NH
N
N
CI
F
N
O NH
N
O
O
NH
O
O
N
MW 429.2 MW 446.9

Differences in activity of major metabolites
Li J, et al. Clin Cancer Res 2007;13:3731–7McKillop D, et al. Xenobiotica 2006;36:29–39
OSI-420 Desmethyl-gefitinib
Activity in cells = Erlotinib ≈ 10% of gefitinib
Activity in xenograft models = Erlotinib Minimal
Gefitinib
CI
F
N
O NH
N
O
O
NH
O
O
N
H
Desmethyl-gefitinibErlotinib
O
OO
O
NH
N
N
OSI-420
H
MW 429.2 MW 446.9
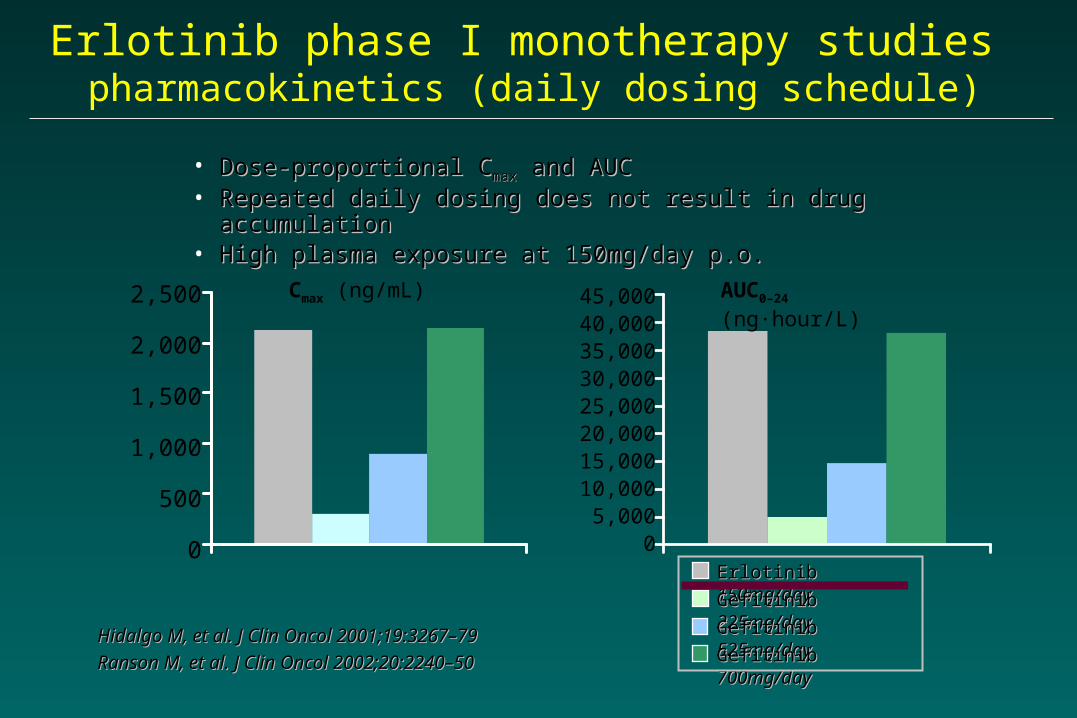
• Dose-proportional CDose-proportional Cmaxmax and AUC and AUC• Repeated daily dosing does not result in drug accumulationRepeated daily dosing does not result in drug accumulation• High plasma exposure at 150mg/day p.o.High plasma exposure at 150mg/day p.o.
Hidalgo M, et al. J Clin Oncol 2001;19:3267–79Hidalgo M, et al. J Clin Oncol 2001;19:3267–79
Ranson M, et al. J Clin Oncol 2002;20:2240–50Ranson M, et al. J Clin Oncol 2002;20:2240–50
Cmax (ng/mL) AUC0–24 (ng·hour/L)
Erlotinib Erlotinib 150mg/day150mg/day
Gefitinib Gefitinib 225mg/day225mg/day
Gefitinib Gefitinib 525mg/day525mg/day
Gefitinib Gefitinib 700mg/day700mg/day
2,500
2,000
1,500
1,000
500
0
45,00040,00035,00030,00025,00020,00015,00010,000
5,0000
Erlotinib phase I monotherapy studies pharmacokinetics (daily dosing schedule)

EGFREGFRL858RL858R is More Sensitive to Gefitinib than EGFR is More Sensitive to Gefitinib than EGFRWTWT
Paez, Science 2004
A549 H1666 H3255Gefitinib (1.0 µM) - + - + - +
PARP
-tubulin
-116 kDa- 89 kDa
Gefitinib induces apoptosis in the H3255
250 mg p.o.250 mg p.o.~ ~ 0.40.4 MM
400-600 mg p.o.400-600 mg p.o.~ ~ 1.1 -1.1 - 1.41.4 MM

Cell lineCell line Cell Cell Type*Type* PgpPgp EGFR mutationEGFR mutation GefitinibGefitinib
ICIC5050 ( (M)M)Ras mutatiRas mutati
on**on**11 H23H23 AA 11 -- 10.676 ± 0.192710.676 ± 0.1927 K-ras 12K-ras 12
22 H125H125 ASAS 00 -- 15.822 ± 0.078915.822 ± 0.0789 --
33 H226H226 SS 00 -- 8.9903 ± 0.68328.9903 ± 0.6832 --
44 H322H322 BACBAC 00 -- 0.2689 ± 0.05540.2689 ± 0.0554 --
55 H358H358 BACBAC 00 -- 6.0863 ± 0.05746.0863 ± 0.0574 K-ras 12K-ras 12
66 H460H460 LCLC 00 -- 10.089 ± 0.23210.089 ± 0.232 K-ras 61K-ras 61
77 H522H522 AA 00 -- 12.679 ± 0.29912.679 ± 0.299 --
88 H647H647 ASAS 00 -- 12.474 ± 0.21512.474 ± 0.215 K-ras 13K-ras 13
99 H820H820 AA 00 del 746-749, T790M, Metdel 746-749, T790M, Met 4.7165 ± 0.01124.7165 ± 0.0112 --
1010 H838H838 ASAS 00 -- 12.372 ± 0.13712.372 ± 0.137 --
1111 H1155H1155 LCLC 177.2177.2 -- 7.0430 ± 0.06007.0430 ± 0.0600 K-ras 61K-ras 61
1212 H1299H1299 LCLC 161.5161.5 -- 6.6.1619 1619 ±± 0.0.08090809 N-ras 61N-ras 61
1313 H3255H3255 AA 00 L858RL858R 0.0042 ± 0.00020.0042 ± 0.0002 --
1414 HCC827HCC827 AA 00 del 746-750del 746-750 0.0025 ± 0.00010.0025 ± 0.0001 --
1515 PC-9PC-9 AA NENE del 746-750del 746-750 0.0235 ± 0.0000
Cell lines with high levels of induced PgpCell lines with high levels of induced Pgp
1515 H23 A0.1H23 A0.1 AA 61.461.4 -- 12.593 ± 0.310412.593 ± 0.3104 K-ras 12K-ras 12
1616 H23 A0.3H23 A0.3 AA 129.4129.4 -- 12.008 ± 0.555012.008 ± 0.5550 K-ras 12K-ras 12
Characteristics of the Tested Cell Lines
* A: adenocarcinoma; AS: adenosquamous carcinoma; BAC: bronchioloalveolar cell carcinoma; LC: large cell carcinoma; S: squamous cell carcinoma* A: adenocarcinoma; AS: adenosquamous carcinoma; BAC: bronchioloalveolar cell carcinoma; LC: large cell carcinoma; S: squamous cell carcinoma** Mitsudomi, et al. Oncogene 1991.** Mitsudomi, et al. Oncogene 1991.

NSCLC cell lines: in vitro surrogates of in vivo drug sensitivity

Gefitinib response of Erlotinib-Refractory Lung Cancer Gefitinib response of Erlotinib-Refractory Lung Cancer Involving Meninges Involving Meninges – – Role of EGFR MutationRole of EGFR Mutation
70 y/o Japanese-American woman, never smoked70 y/o Japanese-American woman, never smokedStage IV adenocarcinoma, RML with rib metastasesStage IV adenocarcinoma, RML with rib metastases
2002/022002/02 Mediastinoscopic LN biopsyMediastinoscopic LN biopsy
2002/042002/04 TRIBUTE trial (TXL+Ca+erlotinib)TRIBUTE trial (TXL+Ca+erlotinib) 42%42%2003/112003/11 WBRT due to brain metsWBRT due to brain mets2004/082004/08 Hemiparesis, diplopia, incontinence Hemiparesis, diplopia, incontinence
(bowel & bladder), wheelchair bound(bowel & bladder), wheelchair boundBrain & spine MRI: leptomengeal Brain & spine MRI: leptomengeal carcinocarcino
matosismatosis
2004/102004/10 Could not tolerated temozolomide+CPT-11Could not tolerated temozolomide+CPT-11in progression. ECOG PS 4in progression. ECOG PS 4
2004/102004/10 On gefitinibOn gefitinibSymptoms: significantly improved in 3 wksSymptoms: significantly improved in 3 wks
2005/022005/02 Ambulating independently with a walkerAmbulating independently with a walker2005/04 2005/04 ECOG PS 2ECOG PS 22005/062005/06 Aspiration pneumonia and died.Aspiration pneumonia and died.
Prior Prior to gefitinib 2 to gefitinib 2 msms
Choong NW, Nature CP Oncol 3:50, 2006Choong NW, Nature CP Oncol 3:50, 2006
Prior to gefitinib 2 ms 4.5 MsPrior to gefitinib 2 ms 4.5 Ms

EGFR Mutations & Their Effects on Sensitivity & EGFR Mutations & Their Effects on Sensitivity &
Resistance Towards Inhibition by EGFR TKIsResistance Towards Inhibition by EGFR TKIs
Choong NW, Nature CP Oncol 3:50, 2006Choong NW, Nature CP Oncol 3:50, 2006
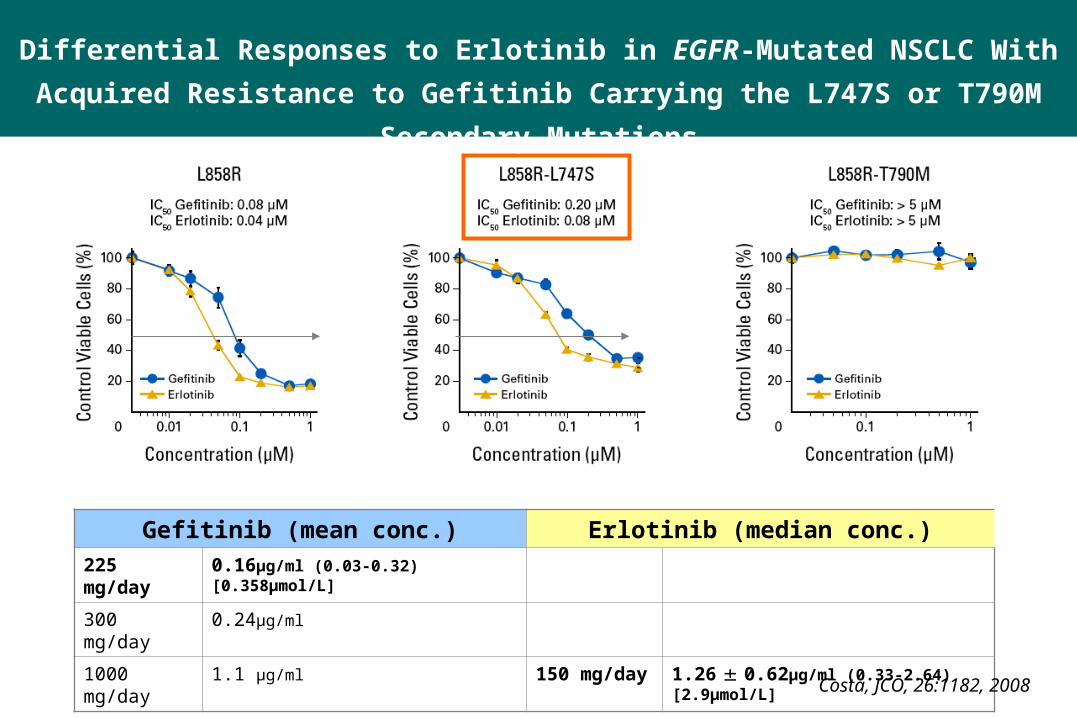
Gefitinib (mean conc.) Erlotinib (median conc.)225 mg/day 0.16μg/ml (0.03-0.32) [0.358μmol/L]
300 mg/day 0.24μg/ml
1000 mg/day 1.1 μg/ml 150 mg/day 1.26 0.62μg/ml (0.33-2.64) [2.9μmol/L]
Costa, JCO, 26:1182, 2008
Differential Responses to Erlotinib in EGFR-Mutated NSCLC With Acquired
Resistance to Gefitinib Carrying the L747S or T790M Secondary Mutations

Costa, JCO, 26:1182, 2008
Differential Responses to Erlotinib in EGFR-Mutated NSCLC With Acquired
Resistance to Gefitinib Carrying the L747S or T790M Secondary Mutations
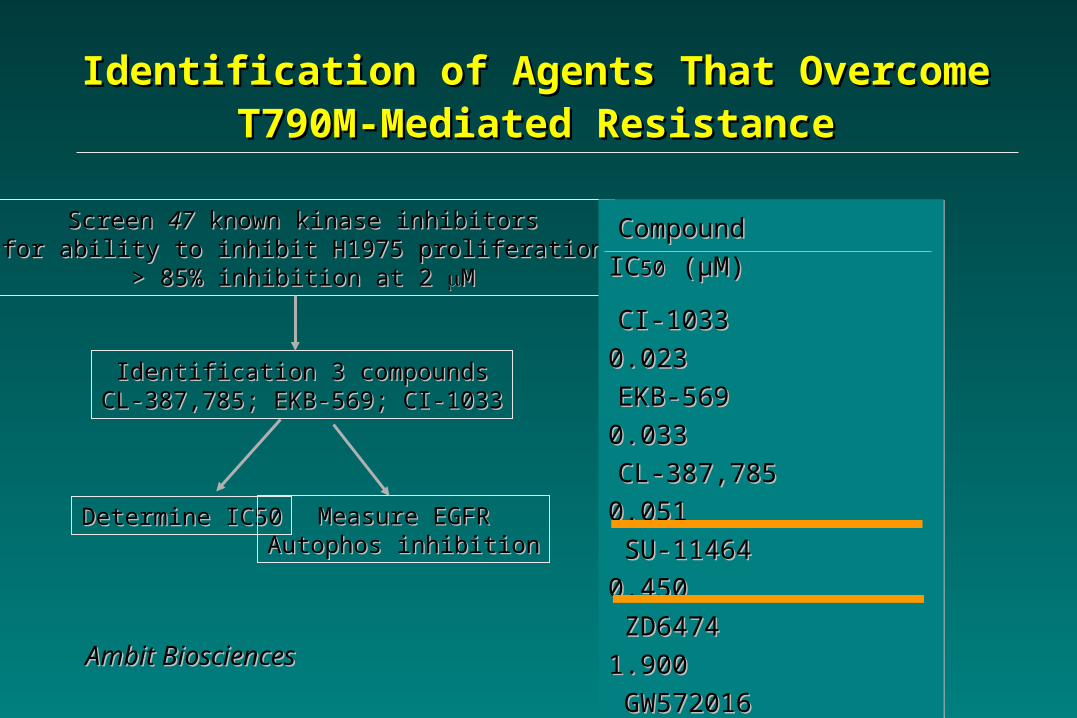
Identification of Agents That Overcome Identification of Agents That Overcome T790M-Mediated ResistanceT790M-Mediated Resistance
Screen Screen 4747 known kinase inhibitors known kinase inhibitorsfor ability to inhibit H1975 proliferationfor ability to inhibit H1975 proliferation
> 85% inhibition at 2 > 85% inhibition at 2 MM
Identification 3 compoundsIdentification 3 compoundsCL-387,785; EKB-569; CI-1033CL-387,785; EKB-569; CI-1033
Determine IC50Determine IC50 Measure EGFRMeasure EGFRAutophos inhibitionAutophos inhibition
Ambit BiosciencesAmbit Biosciences
Compound ICCompound IC5050 ( (µµM)M)
CI-1033CI-1033
0.0230.023
EKB-569 EKB-569
0.0330.033
CL-387,785CL-387,785
0.0510.051
SU-11464SU-11464
0.4500.450
ZD6474ZD6474
1.9001.900
GW572016GW572016
3.5003.500
GefitinibGefitinib
6.6006.600
PKI-166PKI-166
7.7007.700
ErlotinibErlotinib
10.00010.000
Inhibition of H1975 cell proliferationInhibition of H1975 cell proliferation

Erlotinib and Gefitinib: AE profiles*
Incidence of AEs (%)*Incidence of AEs (%)*
Erlotinib (n=485)Erlotinib (n=485) GefitinibGefitinib (n=1,126)(n=1,126)
AllAll Grade 3+Grade 3+ AllAll Grade 3+Grade 3+
RashRash 7676 99 3737 22
DiarrheaDiarrhea 5555 66 2727 33
NauseaNausea 4040 33 1717 11
AnorexiaAnorexia 6969 99 1717 22
VomitingVomiting 2525 33 1414 11
Dry skinDry skin 1212 00 1111 00

Comparison of Erlotinib (TarcevaTM) versus Gefitinib (Iressa®) as Salvage therapy for the
Treatment of Advanced NSCLC Patients: Retrospective Paired matched analysis
Sungkyunkwan University, School of MedicineSamsung Medical Center
Myung-Ju Ahn, M.D.

CharacteristicsGefitinib (N=174)
Erlotinib (N=174)
P-value
AgeMedian (Range) 58.0 (25.0-87.0) 59.0 (20.0-82.0)
≤ 60 years 100 100NA
〉 60 years 74 74
SexMale 111 111
NAFemale 63 63
ECOG0-1 116 116
NA≥ 2 58 58
Histology Adenocarcinoma 125 125
NANon-adenoca. 49 49
No of prior chemo
≤2 145 145NA
2< 29 29
SmokingNever smoker 87 98
0.237Current or Ever 87 76
Gfitinib: 2002-2005; Erlotinib: 2006-2008Gefitinib: 316 vs Erlotinib: 257 (Matched Age, Sex, PS, Smoking, No of PriorTx) Gfitinib: 2002-2005; Erlotinib: 2006-2008Gefitinib: 316 vs Erlotinib: 257 (Matched Age, Sex, PS, Smoking, No of PriorTx)
Ahn et al, Unpublished data
Baseline CharacteristicsBaseline Characteristics
36%36%
72%72%
50-56%50-56%
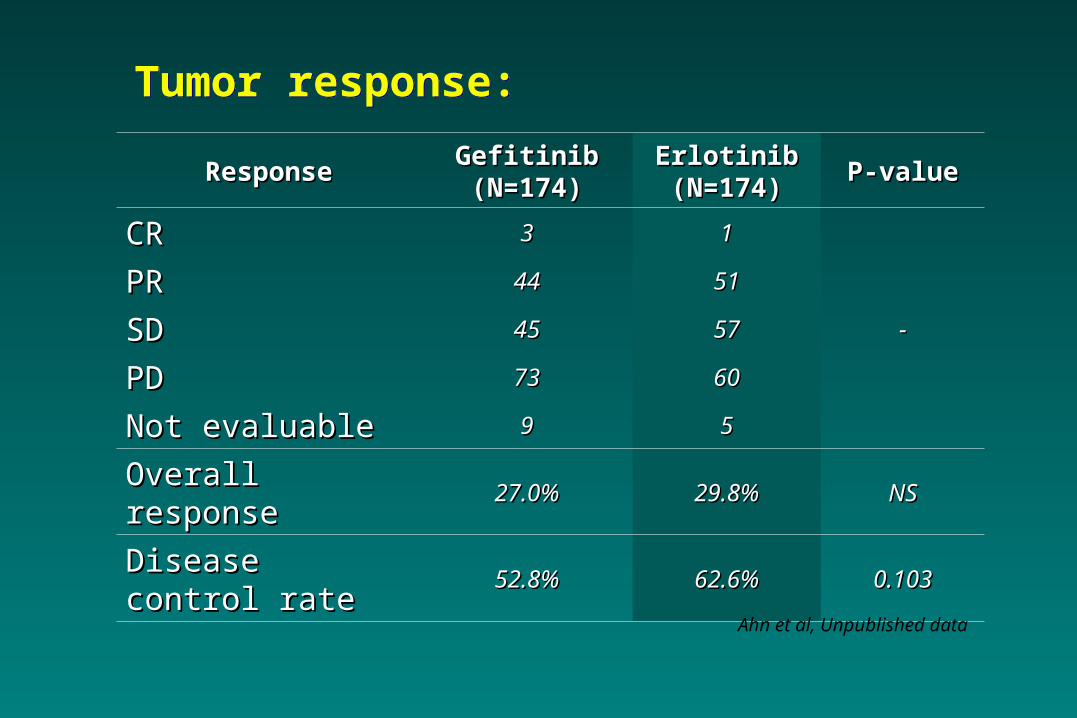
Tumor response: Tumor response:
ResponseResponse Gefitinib Gefitinib (N=174)(N=174)
ErlotinibErlotinib(N=174)(N=174) P-valueP-value
CRCR 33 11
--
PRPR 4444 5151
SDSD 4545 5757
PDPD 7373 6060
Not evaluableNot evaluable 99 55
Overall responseOverall response 27.0%27.0% 29.8%29.8% NSNS
Disease control rateDisease control rate 52.8%52.8% 62.6%62.6% 0.1030.103
Ahn et al, Unpublished data

(A) Kaplan-Meier curves for overall survival in all patients and (B) Comparison Kaplan-Meier curves for overall survival between gefitinib- and erlotinib treated patients
(A) Kaplan-Meier curves for overall survival in all patients and (B) Comparison Kaplan-Meier curves for overall survival between gefitinib- and erlotinib treated patients
0 12 24 36 48 60
Months
0.0
0.2
0.4
0.6
0.8
1.0
Pro
bability (Overa
ll S
urv
ival)
0 12 24 36 48 60
Months
0.0
0.2
0.4
0.6
0.8
1.0
Pro
bability (Overa
ll S
urv
ival)
Gefitinib
Erlotinib
(A) Total OS; Median 10.7 months(A) Total OS; Median 10.7 months
(B) Gefitinib OS; Median 10.0 months Erlotinib OS; Median 12.4 months
(p=0.07)
(B) Gefitinib OS; Median 10.0 months Erlotinib OS; Median 12.4 months
(p=0.07)
Ahn et al, Unpublished data

Study scheme
Statistics Target N =48 for each group
Simon’s optimal two-stage design
P0=10%, P1=25%, α-error 5%, ß-error 20%, 10% drop-out rates 1st stage: responders > 2/18 2nd stage: additional 25 pts
Methods
RANDOMIZATION
Gefitinib250mg/d Q4wKs
Erlotinib150mg/d Q4wks
REEVALUAT ION
REEVALUAT ION
UntilDisease
progression or
Intolerable toxicities
4 w
eeks
8 w
eeks
At least 2 of 3
Adenoca. Female Never smoker
or
EGFR mutant
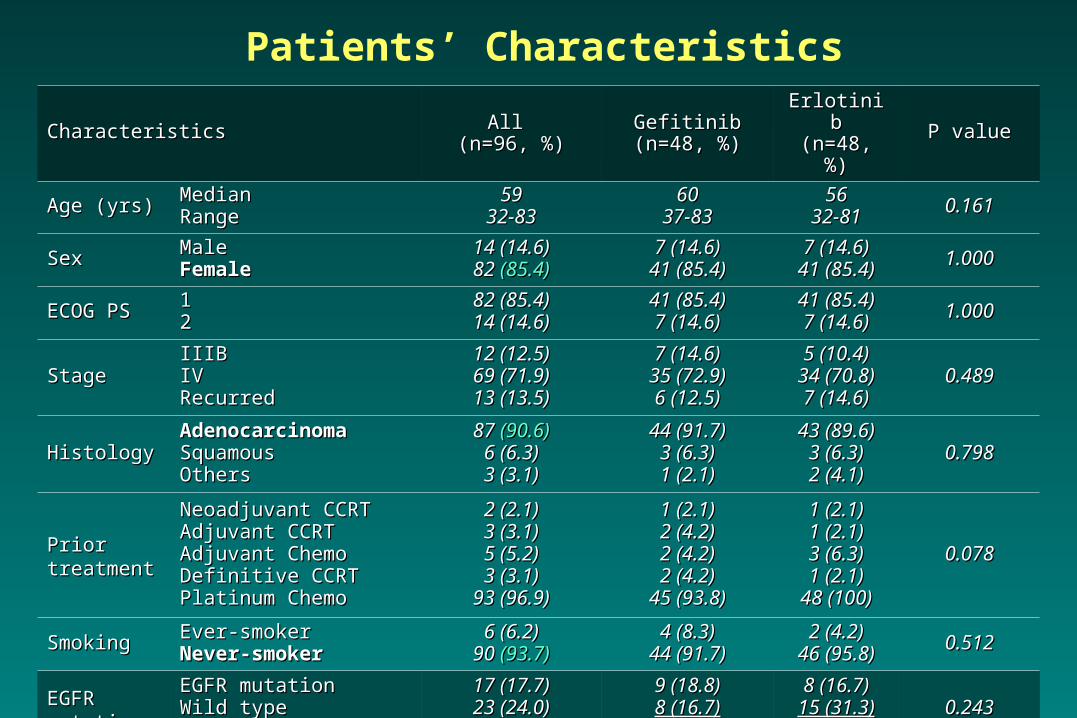
Patients’ Characteristics
Characteristics Characteristics All All (n=96, %)(n=96, %)
GefitinibGefitinib(n=48, %)(n=48, %)
ErlotinibErlotinib(n=48, %)(n=48, %)
P valueP value
Age (yrs)Age (yrs) MedianMedianRange Range
595932-8332-83
606037-8337-83
565632-8132-81 0.1610.161
Sex Sex MaleMaleFemale Female
14 (14.6)14 (14.6)82 82 (85.4)(85.4)
7 (14.6)7 (14.6)41 (85.4)41 (85.4)
7 (14.6)7 (14.6)41 (85.4)41 (85.4) 1.0001.000
ECOG PSECOG PS 1122
82 (85.4)82 (85.4)14 (14.6)14 (14.6)
41 (85.4)41 (85.4)7 (14.6)7 (14.6)
41 (85.4)41 (85.4)7 (14.6)7 (14.6) 1.0001.000
Stage Stage IIIBIIIBIVIVRecurredRecurred
12 (12.5)12 (12.5)69 (71.9)69 (71.9)13 (13.5)13 (13.5)
7 (14.6)7 (14.6)35 (72.9)35 (72.9)6 (12.5)6 (12.5)
5 (10.4)5 (10.4)34 (70.8)34 (70.8)7 (14.6)7 (14.6)
0.4890.489
HistologyHistologyAdenocarcinomaAdenocarcinomaSquamousSquamousOthersOthers
87 87 (90.6)(90.6)6 (6.3)6 (6.3)3 (3.1)3 (3.1)
44 (91.7)44 (91.7)3 (6.3)3 (6.3)1 (2.1)1 (2.1)
43 (89.6)43 (89.6)3 (6.3)3 (6.3)2 (4.1)2 (4.1)
0.7980.798
Prior Prior treatmenttreatment
Neoadjuvant CCRTNeoadjuvant CCRTAdjuvant CCRTAdjuvant CCRTAdjuvant ChemoAdjuvant ChemoDefinitive CCRTDefinitive CCRTPlatinum ChemoPlatinum Chemo
2 (2.1)2 (2.1)3 (3.1)3 (3.1)5 (5.2)5 (5.2)3 (3.1)3 (3.1)
93 (96.9)93 (96.9)
1 (2.1)1 (2.1)2 (4.2)2 (4.2)2 (4.2)2 (4.2)2 (4.2)2 (4.2)
45 (93.8)45 (93.8)
1 (2.1)1 (2.1)1 (2.1)1 (2.1)3 (6.3)3 (6.3)1 (2.1)1 (2.1)
48 (100)48 (100)
0.0780.078
SmokingSmoking Ever-smokerEver-smokerNever-smokerNever-smoker
6 (6.2)6 (6.2)90 90 (93.7)(93.7)
4 (8.3)4 (8.3)44 (91.7)44 (91.7)
2 (4.2)2 (4.2)46 (95.8)46 (95.8) 0.5120.512
EGFR EGFR mutationmutation
EGFR mutationEGFR mutationWild typeWild typeNot testedNot tested
17 (17.7)17 (17.7)23 (24.0)23 (24.0)56 (58.3)56 (58.3)
9 (18.8)9 (18.8)8 (16.7)8 (16.7)
31 (64.6)31 (64.6)
8 (16.7)8 (16.7)15 (31.3)15 (31.3)25 (52.1)25 (52.1)
0.2430.243

Response Rates
Numbers of treatment cycles : median 5 (range, 0.5-20), total 605 cyclesNumbers of treatment cycles : median 5 (range, 0.5-20), total 605 cycles Gefitinib group: median 6 (range, 0.5-19), total 331 cyclesGefitinib group: median 6 (range, 0.5-19), total 331 cycles Erlotinib group: median 4 (range, 0.5-20), total 274 cyclesErlotinib group: median 4 (range, 0.5-20), total 274 cycles
Gefitinib Gefitinib Erlotinib Erlotinib
PP value valueN N (n=48)(n=48) %%
N N (n=48)(n=48) %%
CRCR 11 2.12.1 11 2.12.1
0.9420.942
PRPR 2222 45.845.8 1818 37.537.5
SDSD 1212 25.025.0 1313 27.127.1
PDPD 1212 25.025.0 1515 31.331.3
NENE 11 2.12.1 11 2.12.1
ORRORR 2323 47.9 (33.8-62.0)47.9 (33.8-62.0) 1919 39.6 (25.8-53.4)39.6 (25.8-53.4) 0.4110.411
DCRDCR 3535 72.9 (60.3-85.4)72.9 (60.3-85.4) 3232 66.7 (53.4-80.0)66.7 (53.4-80.0) 0.5050.505
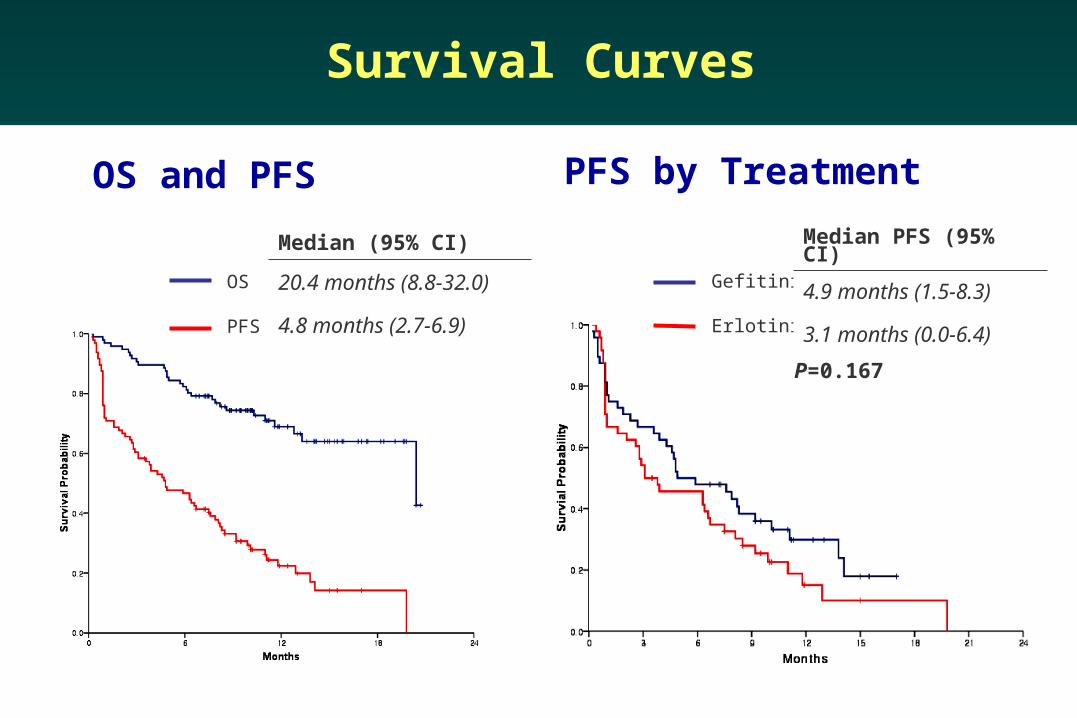
Survival Curves
Median follow-up duration: 11.5 months (range, 6.7-20.8)
Median (95% CI)
20.4 months (8.8-32.0)
4.8 months (2.7-6.9)
Gefitinib
Erlotinib
PFS by Treatment
P=0.167
Median PFS (95% CI)
4.9 months (1.5-8.3)
3.1 months (0.0-6.4)
OS and PFS
OS
PFS

ToxicitiesGefitinib Erlotinib
Toxicity grade Toxicity grade
1 2 3 Total 1 2 3 Total P value
Skin rash 25 (52.1) 4 (8.3) 1 (2.1) 30 (62.5) 14 (29.2) 16 (33.3) 5 (10.4) 35 (72.9) 0.003
Dry skin 8 (16.7) 0 (0) - 8 (16.7) 9 (18.8) 1 (2.1) - 10 (20.9) 0.733
Paronychia 4 (8.3) 1 (2.1) - 5 (10.4) 4 (8.3) 0 (0) - 4 (8.3) 0.767
Diarrhea 8 (16.7) 8 (16.7) - 16 (33.4) 14 (29.2) 3 (6.3) - 17 (35.5) 0.238
Mucositis 1 (2.1) 2 (4.2) - 3 (6.3) 4 (8.3) 1 (2.1) - 5 (10.4) 0.300
Fatigue 0 (0) 0 (0) - 0 (0) 5 (10.4) 3 (3.1) - 8 (16.7) 0.027
Anorexia 7 (14.6) 0 (0) - 7 (14.6) 4 (8.3) 1 (2.1) - 5 (10.4) 0.587
Alopecia 3 (6.3) - - 3 (6.3) 1 (2.1) - - 1 (2.1) 0.463
Neuropathy 2 (4.2) 2 (4.2) - 4 (8.4) 3 (6.3) 0 (0) - 3 (6.3) 0.414
Infection¶ - - 1 (2.1) 1 (2.1) - - 1 (2.1) 1 (2.1) 1.000
ILD - - - - - - - - -
¶ Except 3 mortalities from pneumonia. (2 of gefitinib and 1 of erlotinib)
Clinical Outcomes in Patients with
EGFR Mutations
Pooled Analysis of NSCLC Patients Treated with Pooled Analysis of NSCLC Patients Treated with
Either an EGFR TKI or ChemotherapyEither an EGFR TKI or Chemotherapy
L Paz-Ares, et al.
ESMO/ECCO Berlin 2009J Cell Mol Med 2010 14:51-69

Summary of search strategy
Reports identified from broad literature search (n=564)
Studies retained for full paper review (n=175)
Studies identified from ASCO 2008–9 search (+n=42)
Excluded based on abstract or title: no clinical data
related to question (- n=431)
Excluded (n=121)• PFS/TTP/n not reported for pts with mutations (n=96) • EGFR-TKIs given sequentially or as maintenance or adjuvant therapy (n=10)• Data duplicated in another publication (n=15)
Studies included (n=54)

Summary of data included
Erlotinib Gefitinib Chemotherapy
Pts treated in any line; n 365 1,069 375
Pts treated
in first-line setting57% 57% 95%
Total number of patients = 1,809
(65% treated in first-line setting)
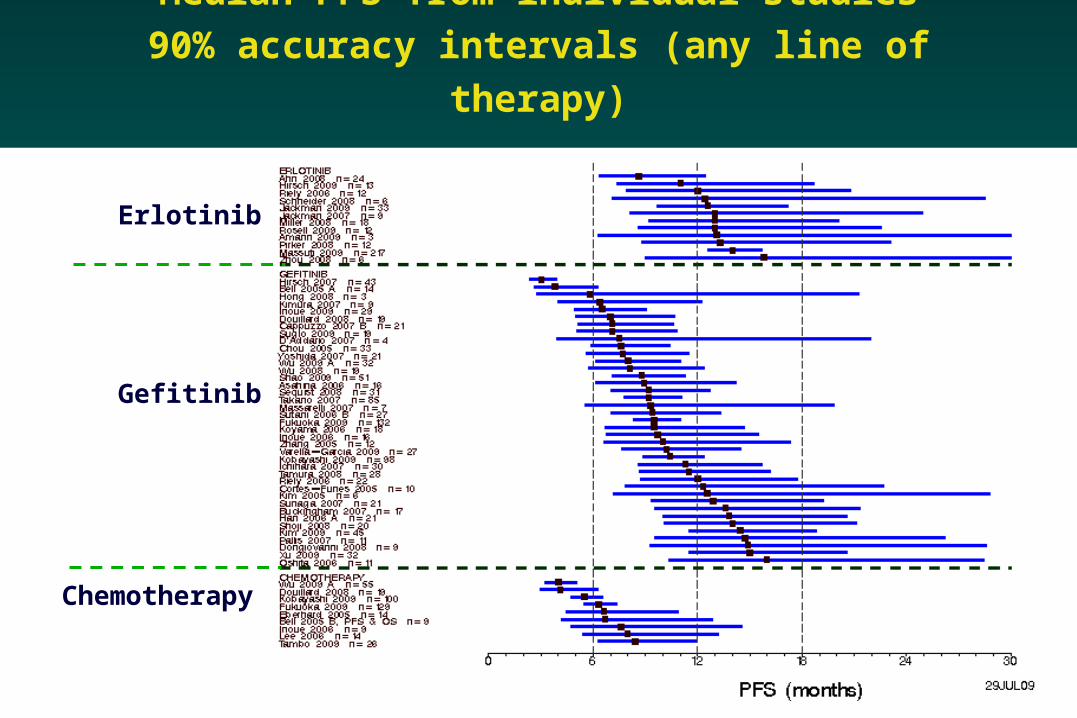
Median PFS from individual studies
90% accuracy intervals (any line of therapy)
Erlotinib
Gefitinib
Chemotherapy
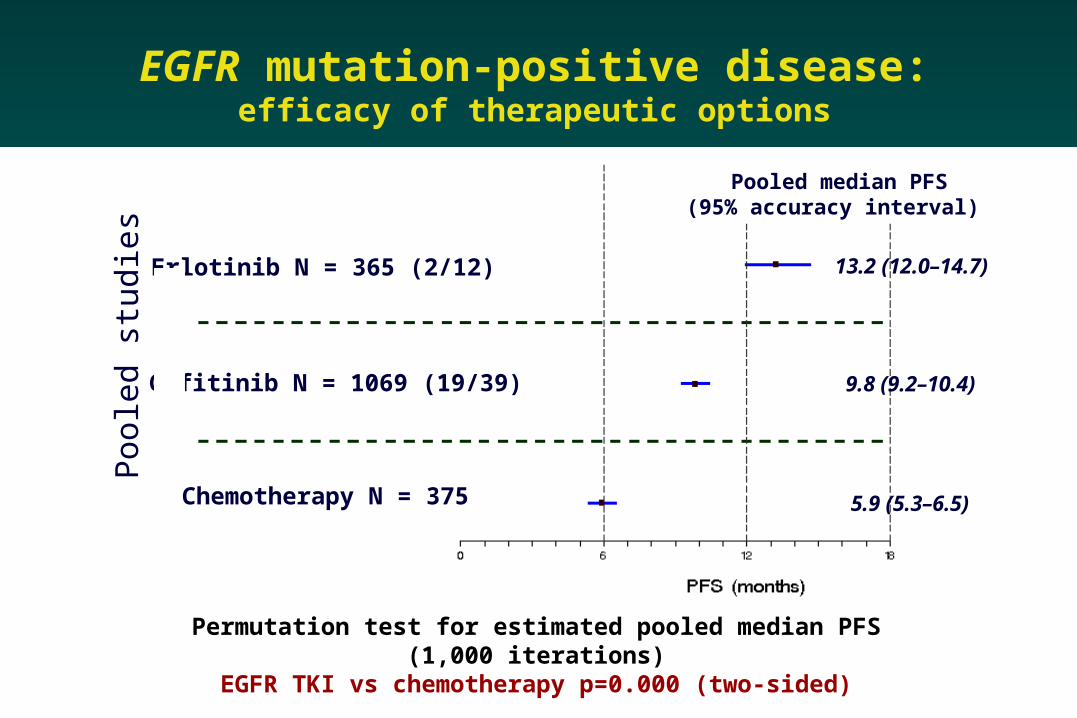
Pooled median PFS(95% accuracy interval)
13.2 (12.0–14.7)
9.8 (9.2–10.4)
5.9 (5.3–6.5)
Permutation test for estimated pooled median PFS (1,000 iterations)EGFR TKI vs chemotherapy p=0.000 (two-sided)
Erlotinib N = 365 (2/12)
Gefitinib N = 1069 (19/39)
Chemotherapy N = 375
Poo
led
stud
ies
EGFR mutation-positive disease:efficacy of therapeutic options

SATURN study design
Stratification factors: EGFR IHC (positive vs negative vs indeterminate) Stage (IIIB vs IV) ECOG PS (0 vs 1) CT regimen (cis/gem vs carbo/doc vs others) Smoking history (current vs former vs never) Region
1:1
Chemonaïve advanced
NSCLCn=1,949
Non-PDn=889
4 cycles of 1st-line platinum-based doublet*
Placebo PD
Erlotinib150mg/day
PD
Mandatory tumour sampling
*Cisplatin/paclitaxel; cisplatin/gemcitabine; cisplatin/docetaxel cisplatin/vinorelbine; carboplatin/gemcitabine; carboplatin/docetaxel carboplatin/paclitaxelEGFR = epidermal growth factor receptor; IHC = immunohistochemistry
Co-primary endpoints: PFS in all patients PFS in patients with EGFR IHC+ tumours
Secondary endpoints: Overall survival (OS) in all patients and those with EGFR
IHC+ tumours, OS and PFS in EGFR IHC– tumours; biomarker analyses; safety; time to symptom progression; quality of life (QoL)

Randomized phase III study of platinum-doublet CT followed by gefitinib vs continued CT in pts with advanced NSCL
C: Results of WJTOG trial LBA#8012

AllOS- Adenocarcinoma
WJTOG 0203 - OS

All Non-Squamous cell ca
SATURN - OS

WJTOG0203: Hazard Ratios for Death according to the Subgroup Analysis
0.4 0.6 0.8 1.0 1.2
Favourserlotinib
Favoursplacebo
HR
Male
Female
Caucasian
Asian
Adenocarcinoma
Squamous-cell
Never smoker
Former smoker
Current smoker
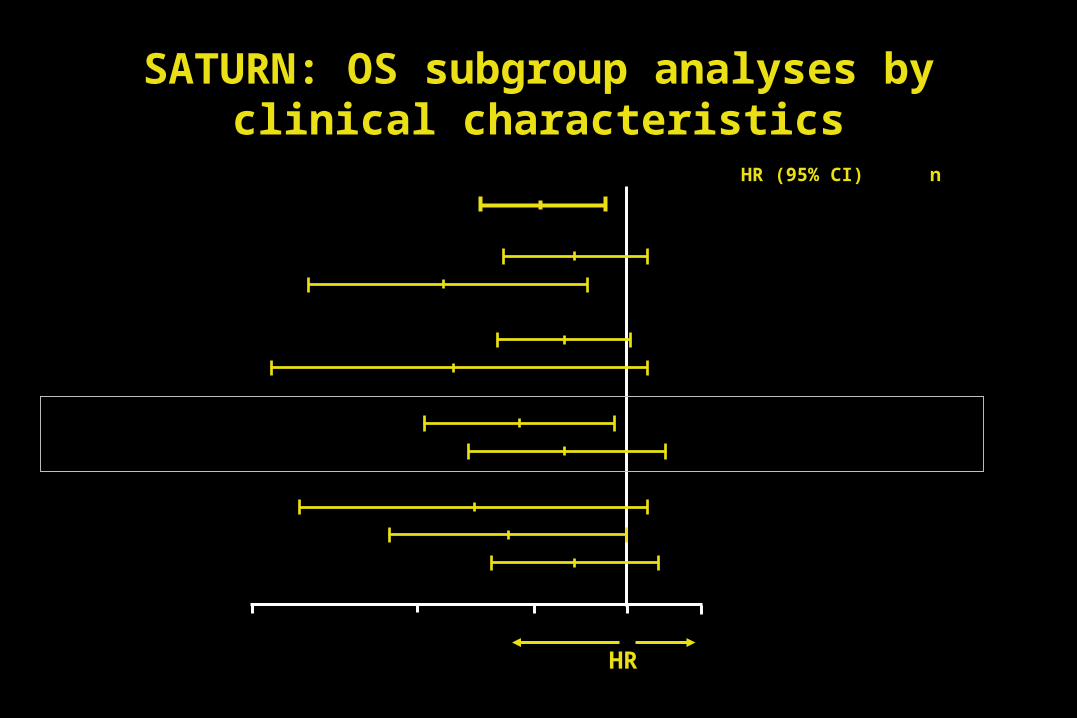
HR (95% CI) n
0.88 (0.74–1.05) 659
0.64 (0.46–0.91) 230
0.86 (0.73–1.01) 746
0.66 (0.42–1.05) 131
0.77 (0.61–0.97) 403
0.86 (0.68–1.10) 360
0.69 (0.45–1.05) 152
0.75 (0.56–1.00) 244
0.88 (0.72–1.08) 493
SATURN: OS subgroup analyses by clinical characteristics
All 0.81 (0.70–0.95) 889

SATURN: PFS (wild type vs. squamous)
Log-rank p=0.0148
HR=0.76 (0.60–0.95)
Squamous-cell carcinoma
1.0
0.8
0.6
0.4
0.2
0
Time (weeks)
0 8 16 24 32 40 48 56 64 72 80 88
Erlotinib (n=166)
Placebo (n=193)
PFS probability
Log-rank p=0.0185
HR=0.78 (0.63–0.96)1.0
0.8
0.6
0.4
0.2
0
Time (weeks)
Erlotinib (n=199)
Placebo (n=189)
0 8 16 24 32 40 48 56 64 72 80 88 96
EGFR wild-type

Comparison of gefitinib and erlotinib in Taiwanese patients with Comparison of gefitinib and erlotinib in Taiwanese patients with advanced NSCLC: A retrospective multi-center studyadvanced NSCLC: A retrospective multi-center study
胸腔醫學會 胸腔醫學會 2009 2009 北榮 范紋健北榮 范紋健
Total: 1122 Female 45%Never/light smoker 53%Adenocarcinoma 77%Stage IV 79%Chemo-naive 41%
Gefitinib Erlotinib* P
N 715 407
ORR 34.4% 35.6% 0.68
DCR 58.9% 65.6% 0.02
PFS 3.6 m 4.6 m
* Erlotinib group: more male, smoker and non-adeno.
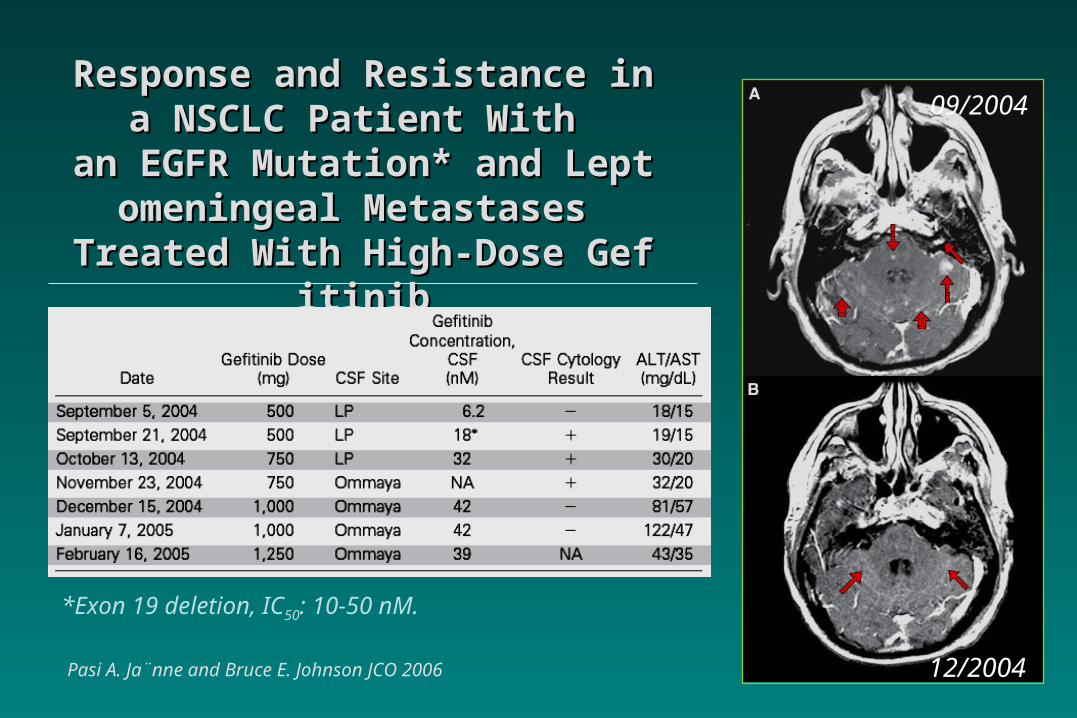
Response and Resistance in a NResponse and Resistance in a NSCLC Patient With SCLC Patient With
an EGFR Mutation* and Leptomean EGFR Mutation* and Leptomeningeal Metastases ningeal Metastases
Treated With High-Dose GefitinibTreated With High-Dose Gefitinib
Pasi A. Ja¨nne and Bruce E. Johnson JCO 2006 12/2004
09/2004
*Exon 19 deletion, IC50: 10-50 nM.

Efficacy of Erlotinib for Brain and Leptomeningeal Metastases in Patients with Lung Adenocarcinoma Who Showed In
itial Good Response to Gefitinib
Katayama, et al. JTO 2009
PD
6 (60%)
SD
4 (40%)Response of Brain Metastases (total N=10)
0 - 20039Duration of Intracranial Disease Control (days) *
126 - 632379MS
29 - 9964TTP
95%CIDaysSurvival time
13.0 - 45.47 (29.2)DCR
0 - 19.62 (8.3)ORR
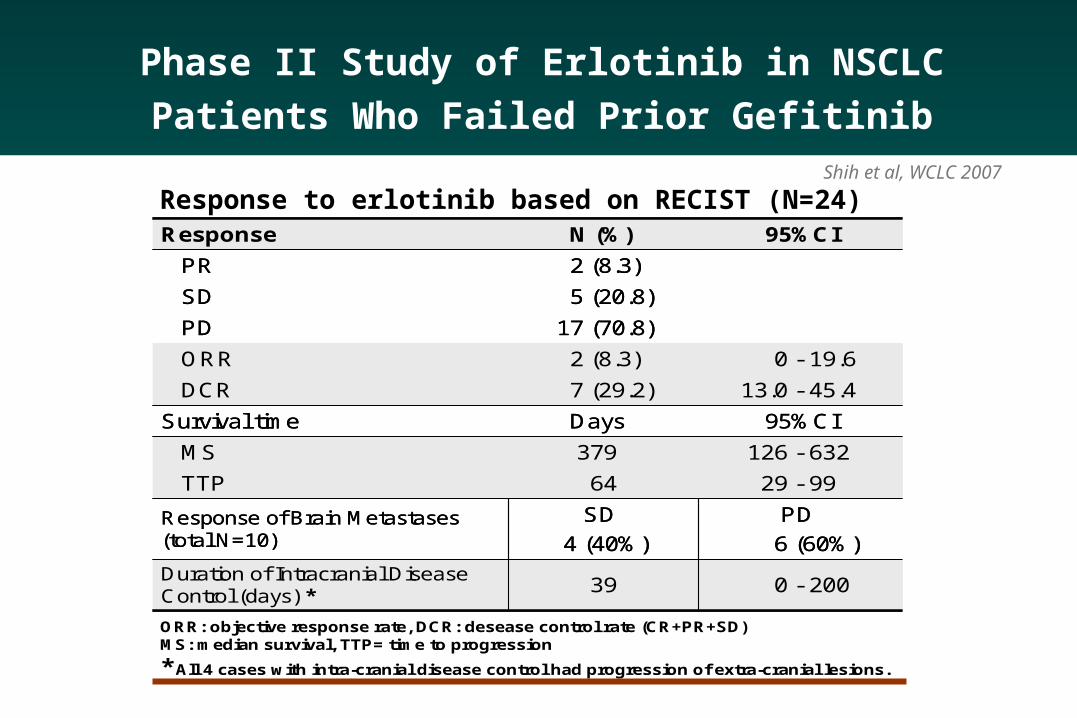
17 (70.8)PD
5 (20.8)SD
2 (8.3)PR
95%CIN (%)Response
PD
6 (60%)
SD
4 (40%)Response of Brain Metastases (total N=10)
0 - 20039Duration of Intracranial Disease Control (days) *
126 - 632379MS
29 - 9964TTP
95%CIDaysSurvival time
13.0 - 45.47 (29.2)DCR
0 - 19.62 (8.3)ORR
17 (70.8)PD
5 (20.8)SD
2 (8.3)PR
95%CIN (%)Response
ORR: objective response rate, DCR: desease control rate (CR+PR+SD)MS: median survival, TTP= time to progression
* All 4 cases with intra-cranial disease control had progression of extra-cranial lesions.
Response to erlotinib based on RECIST (N=24)
Phase II Study of Erlotinib in NSCLC Patients Who
Failed Prior GefitinibShih et al, WCLC 2007
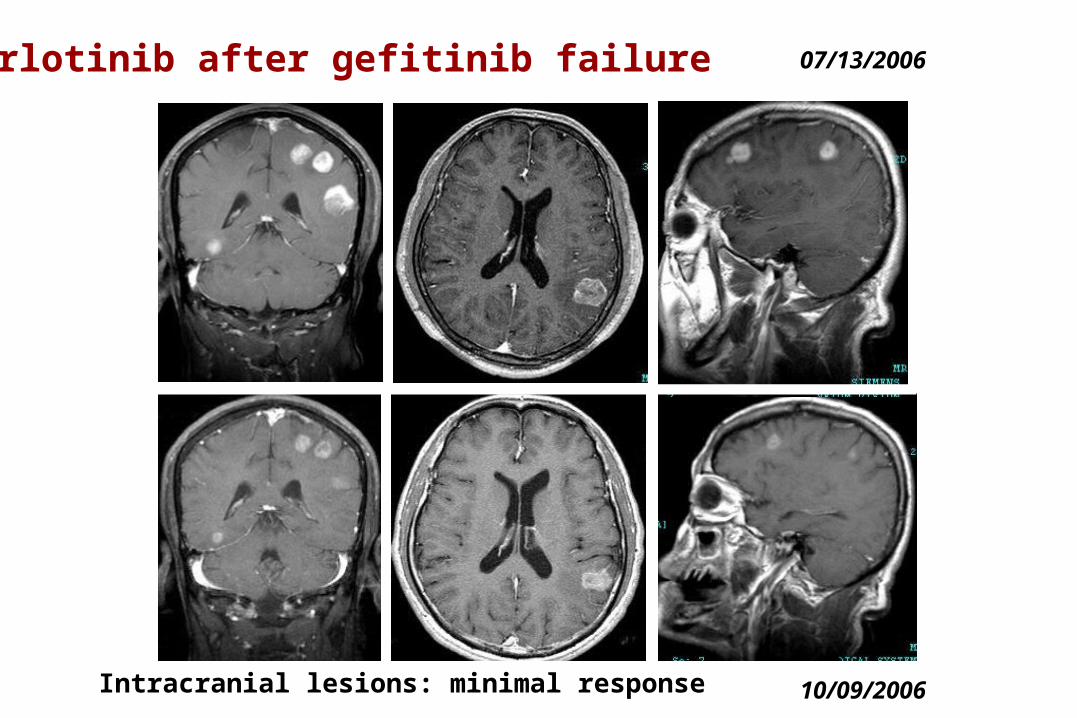
07/13/2006
10/09/2006Intracranial lesions: minimal response
Erlotinib after gefitinib failure

F/1953 Adenocarcinoma, RLL with brain metastasisF/1953 Adenocarcinoma, RLL with brain metastasis
20032003
01– 0201– 02
WBRTWBRT
20032003
03 – 0603 – 06
Gem/CisGem/CisX 6X 6
20042004
02 – 0602 – 06
DocDocX 6X 6
2004 - 052004 - 05
10 – 0210 – 02
NVB/IfoNVB/IfoX 6X 6
2005 20082005 2008
05 04 05 04
2007200704 – 0504 – 05WBRTWBRT
200802/12-25Erlotinib
2008/02/05 2008/02/262008/02/05 2008/02/26 2008/04/222008/04/22
GefitinibGefitinib
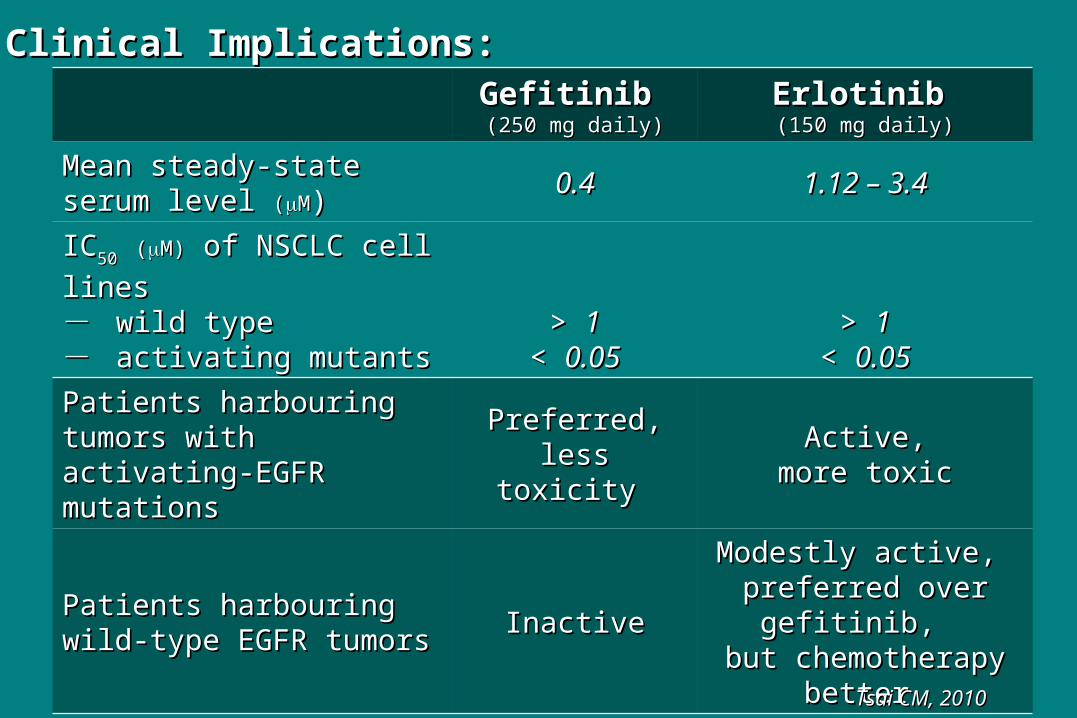
GefitinibGefitinib (250 mg daily)(250 mg daily)
ErlotinibErlotinib (150 mg daily)(150 mg daily)
Mean steady-state serum Mean steady-state serum level level ((MM))
0.40.4 1.12 – 3.41.12 – 3.4
ICIC5050 ((M)M) of NSCLC cell lines of NSCLC cell lines
- - wild typewild type - - activating mutants activating mutants
> > 11< < 0.050.05
> > 11< < 0.050.05
Patients harbouring tumors Patients harbouring tumors with activating-EGFR with activating-EGFR mutations mutations
Preferred,Preferred,less toxicity less toxicity
Active,Active,more toxicmore toxic
Patients harbouring wild-type Patients harbouring wild-type EGFR tumors EGFR tumors InactiveInactive
Modestly active, Modestly active, preferred over gefitinib, preferred over gefitinib,
but chemotherapy but chemotherapy better better
Clinical Implications:Clinical Implications:
Tsai CM, 2010Tsai CM, 2010

GefitinibGefitinib (250 mg daily)(250 mg daily)
ErlotinibErlotinib (150 mg daily)(150 mg daily)
Enriched patientsEnriched patientsIPASS population*IPASS population* ActiveActive Active, more toxicActive, more toxic
Non IPASS populationNon IPASS population Likely inactiveLikely inactivePreferred over gefitinib, Preferred over gefitinib,
but chemotherapy but chemotherapy better better
Patients harbouring tumors Patients harbouring tumors with activating-EGFR with activating-EGFR mutations have brain mutations have brain metastasismetastasis
ActiveActiveMore active and toxic; More active and toxic;
also could defer until gealso could defer until gefitinib failure (?)fitinib failure (?)
Clinical Implications:Clinical Implications:
Tsai CM, 2010Tsai CM, 2010* Adenocarcinoma in never or ex-light smokers* Adenocarcinoma in never or ex-light smokers