Embed Size (px)
Citation preview

NS4053 Rising Inequality in Asia
Winter Term, 2015

Overview
• Asian Development Bank, “Rising Inequality in Asia and Policy Implications” February 2014
• The paper
• Examines the resent trends of rising inequality in developing Asia
• Asks why inequality matters in the Asian context
• Examines the driving forces of rising inequality
• Proposes policy options for tackling high and rising inequality
• Main Findings – Increasing inequality due to
• Technological change
• Globalization
• Market-oriented reform
• Policy Suggestions
2

Introduction I
• Poverty reduction in developing Asia over last two decades faster than
• Any other region in the world
• At any other time in history
• Problem
• The bulk of the region’s population lives in countries with rising inequality
• New Situation in Contrast to
• The “growth with equity” story that marked the transformation of the NIEs in the 1960s and 1970s and
• Recent trends in some other parts of the developing world, particularly Latin America where inequality has been narrowing since the 1990s
3

Introduction II
4
• Drivers of Asia’s rapid growth
• Technological change
• Globalization
• Market oriented reform
• Have had significant distributional consequences. • Growth drivers have favored
• Owners of capital over labor
• Skilled over unskilled workers and
• Urban and costal areas over rural and inland regions
• Unequal access to opportunity caused by
• Institutional weakness and
• Social exclusion
• Have compounded the impacts of these forces
Introduction III
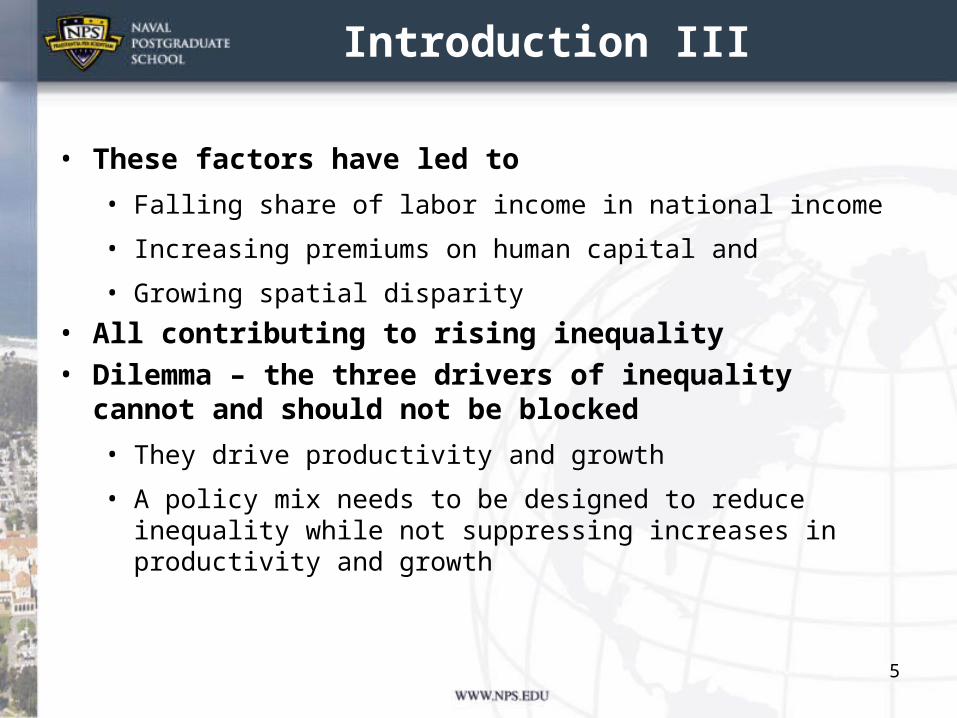
• These factors have led to
• Falling share of labor income in national income
• Increasing premiums on human capital and
• Growing spatial disparity
• All contributing to rising inequality
• Dilemma – the three drivers of inequality cannot and should not be blocked
• They drive productivity and growth
• A policy mix needs to be designed to reduce inequality while not suppressing increases in productivity and growth
5

Recent Trends in Inequality I
• In last two decades growth and poverty reduction in Asia and Pacific have been remarkable
• From 1990 to 2010:
• Average annual growth in GDP for developing Asia reached 7% -- more than double for Latin America
• Growth mainly driven by PRC and India with annual GDP growth rates of 9.9% and 6.4%
• Per capita GDP in 2005PPP terms increased from $1,633 to $5,133
• The percentage of population living at or below the $1.25 a day poverty line fell from 53% in 1990 to 21% in 2010
• 700 million people lifted out of poverty
• Seventeen countries reduced poverty by more than 15% in the period
6

GDP Growth and Poverty Reduction
7

Recent Trends in Inequality II
• Growth accompanied by rising inequality
• Of the 28 economies that have comparable data between the 1990s and 2000s
• 12 accounting for more than 80% of developing Asia’s population in 2020 experienced rising inequality
• The Gini coefficient of per capita expenditure worsened in 12 economies including the PRC, Indonesia and India
• There appears to be a positive, statistically significant relationship between the increase in Gini coefficient and GDP growth
• The change in the quintile ratio is more pronounced than the change in the Gini in all 12 countries – suggesting rising inequality has been driven by the rich getting richer much faster than the poor
• The expenditure shares of the richest 1% and 5% of population also show rising gaps between the rich and poor 8

Annual Growth of Gini Coefficients, 1990s-2000s
9

Recent Trends in Inequality III• Another challenge facing developing Asia is inequality of
opportunity which is a critical factor in widening income inequality
• Great disparities exist in the means to raise one’s living standards such as
• Physical assets (e.g., capital and land),
• Human capital (e.g., education and health, and
• Market access (e.g., labor and finance)
• Inequality of opportunity derives from unequal access to public services, especially education and health
• School age children from households in poorest income quintile were three to tive times as likely to be out of primary and secondary schools as their peers
• Infant mortality rates among the poorest households in some countries were double or triple rates among richest households
10

Why Inequality Matters I• 1. Inequality of opportunity and income can lead to vicious
circle
• As unequal opportunities create income disparities
• Which in turn lead to differences in future opportunities for individuals and households
• 2. Rising inequality hampers poverty reduction• Simulations reveal how rising inequality holds back poverty
reduction• Had inequality not increased the poverty headcount at the
$1.25-a-day the poverty line would have been in:
• India: 29.5% instead of the actual 32.7% in 2010
• PRC: 4.9% instead of the actual 13.1% in 2008 and
• Indonesia: 6.1% instead of the actual 16.3% in 2011• For the 12 economies the cost of rising inequality equates to
240 million more people being trapped under the poverty line -- or 6.5%of the region’s current population. 11

Actual and Simulated Poverty Rates, 1990s-2000s
12

Why Inequality Matters II• 3. Inequality can weaken basis of growth itself• Inequality of wealth and income can lead to large divergences in
human capital
• Those with little wealth or low income face challenges in investing in human capital or wealth and income enhancing activities and will remain poor
• Imperfect financial markets may limit their ability to borrow to invest• Widening inequality – leaving more people at the top and bottom
of income distribution can mean a smaller middle class• Growth driven by and benefiting a middle class is more likely to
be sustained economically
• Rent seeking and corruption associated with highly concentrated gains to growth are avoided
• Politically to the extent that conflict and horizontal inequalities between racial and ethnic groups are easier to manage
13

Why Inequality Matters III
• 4. Greater inequality may lead to a political backlash in which pressure for governments to enact populist policy measures grows.
• In response to rising demands, political process may favor policies that benefit lower end of the income distribution in short run
• But hold back efficient and growth in the long run
• In this situation interests of political system diverge from the interests of the economy as a whole
14

Policy Responses
• Asian governments are responding to rising inequality by trying to make their development plans more inclusive
• Distinction between inequality of opportunity and inequality of outcome important in guiding policy
• Inequality of opportunity – access to education, health care, public services of jobs often arises from differences in individual circumstances outside control of individual
• Such inequality largely reflects institutional weakness and social exclusion and should be target of policy
• On other hand given an individual’s circumstances, efforts in labor market or education will also affect outcomes – income, consumption etc.
• Inequality of outcomes arising from differences in individual efforts reflects and reinforces the market based incentives that are needed to foster innovation and growth
15

Factors Driving Inequality in Asia I
• 1. Technological Change – can influence income distribution if:
• It favors skilled labor (more educated or more experienced) over unskilled labor
• by increasing its relative productivity – and resulting skill premium
• It is biased in favor of capital—leading to an increasing share of capital in national income
• In general capital incomes are generally less equally distributed and accrue more to the rich than the poor
16

Factors Driving Inequality in Asia II
• 2. Globalization can affect income distribution
• Trade integration
• Changes the relative demand for and hence relative wages of skilled and unskilled workers
• It can affect income distribution between capital and labor because capital and skills often work together due to their complementarity
• Financial integration can
• Broaden access to finance by the poor,
• But it can increase the risk of financial crisis and hurt the poor more than the rich
• Studies by the IMF find that
• Global trade integration helps reduce inequality
• Global financial integration increases
• But the found also found that technological progress a more important contributor to rising global inequality in last two decades 17

Factors Driving Inequality III• 3. Market oriented reform an important driver of growth, but
can have significant distributional consequences
• Trade policy reform often part of the driving forces of globalization
• Labor market reforms can change the bargaining position of labor in relation to owners of capital Impacting on wage rates and income distribution
• The three drivers of growth, technological progress, globalization and market oriented reform can be geographically uneven
• New economic opportunities released by these drivers are often most easily seized by locations closer to existing trade routs
• Agglomeration economies also facilitate a self-perpetuating process of increasing concentration
• Considerable empirical evidence linking the three key sources to rising inequality in Asia
18

Factors Driving Inequality IV• Rising skill premiums: Share of inequality accounted for by differences
in educational attainment increased in all countries
• Most significant in PRC from 8.1% in 1995 to 26.5% in 7007
• India next from 20% in 1993 to 30% in 2010
• In late 2000s as much as 25-35% of total inequality can be explained by inter-person differences in human capital and skill endowments in most Asian countries
• Labor’s falling share of total income. Between the mid 1990s and the mid-2000s labor income as a share of manufacturing output in formal sector fell from
• 48% to 42% in the PRC
• 37% to 22% in India
• Because capital income more unequal than labor income, inequality increases
• Increasing spatial inequality: In late 2000s about 25-50% of all inequality can be explained by spatial inequality
• urban/rural, coast/hinterland, and by province.
19
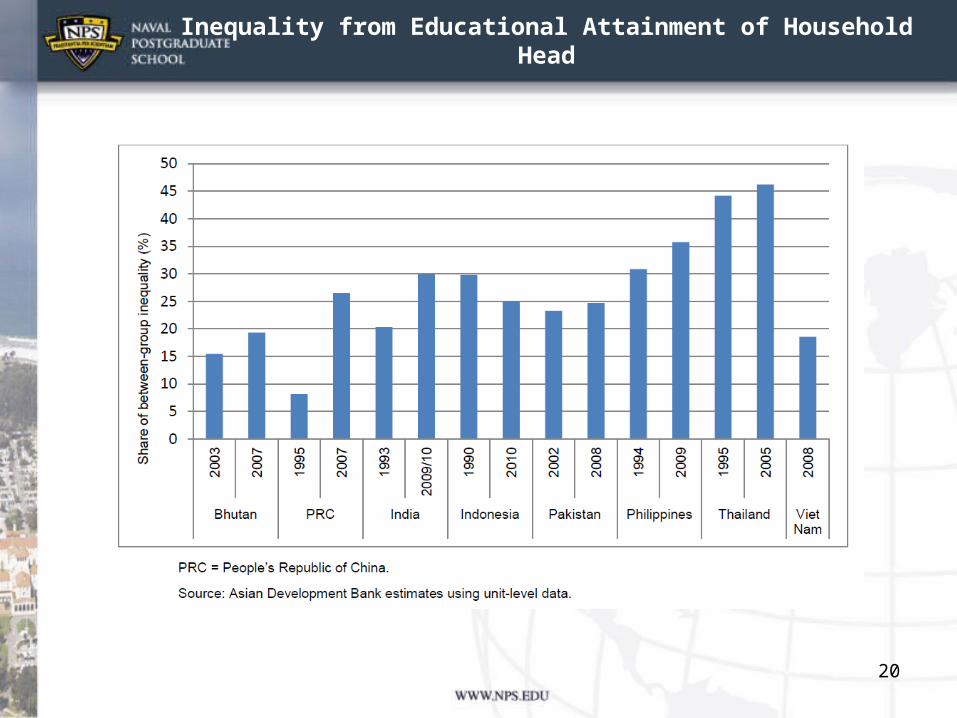
Inequality from Educational Attainment of Household Head
20

Share of Labor Income in Industrial/Manufacturing Value Added
21

Contribution of Spatial Inequality to Overall Inequality
22

Responding to Inequality I
• Idea is to reduce inequality without stifling factors contributing to growth
• Distinction between factors outside of individual control and those that individual makes choices
• Asian Development Bank recommends three sets of policy responses to rising inequality in Asia
1. Efficient fiscal policies to reduce inequality in human capital with view to addressing rising skill premiums relative to low wages of unskilled workers
2. Interventions to reduce spatial inequality
3. Policies to make growth more employment friendly with a view to increasing labor demand and hence labor’s share in national income
• These policies cannot eliminate inequality, but will go long way to reducing it and at same time not endanger development and hurt growth
23

Responding to Inequality II
• Interventions in lagging regions;
• Improving transport and communications networks between more developed and poorer regions
• Creating growth poles in lagging areas
• Strengthening fiscal transfers for greater investment in human capital and better access to public services in lagging regions, and
• Removing barriers to within country migration
• Policies to make growth more employment friendly
• Support development of SMEs
• Remove factor market distortions that favor capital over labor
• Establishing or strengthening labor market intuitions and
• Introducing public employment schemes an a temporary bridge to address pockets of unemployment or underemployment
24

Responding to Inequality III
• Efficient fiscal policies
• Spending more on education and health, especially for poorer households
• Developing and spending more on better targeted social protection schemes including conditional cash transfers that target income to poor but also incentivize buildup of human capital
• Switching fiscal spending from general price subsidies (such as fuel) to targeted transfers and
• Broadening the tax base and strengthening tax administration for greater and more equitable revenue mobilization
• Summing up – adopt strategy of inclusive growth
25
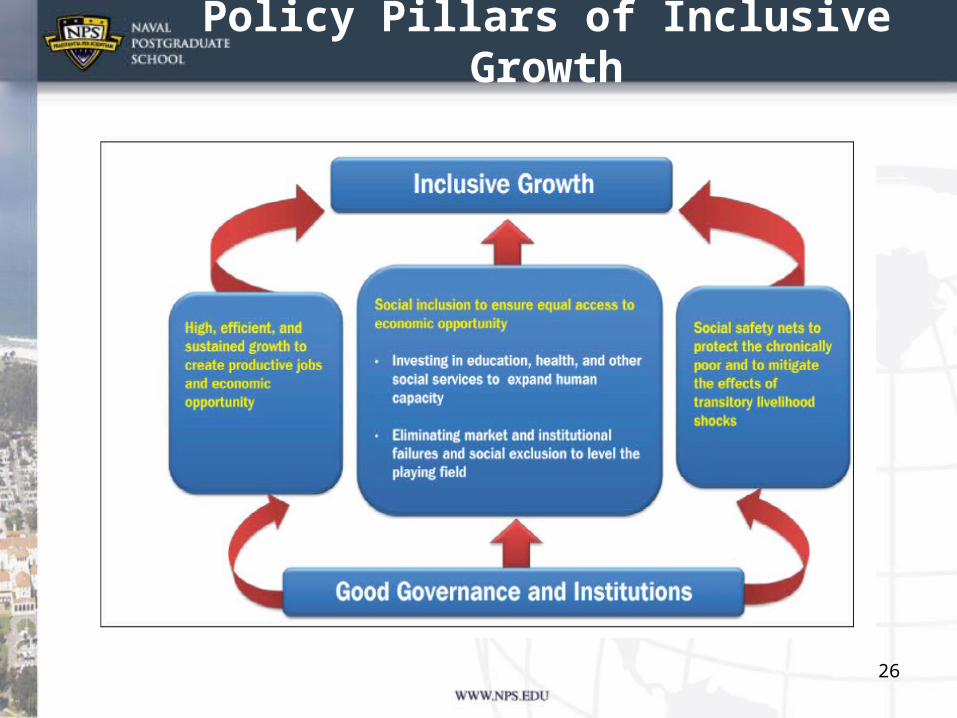
Policy Pillars of Inclusive Growth
26