Embed Size (px)
Citation preview

NS2
Lipid Bilayer
NA (Neuraminidase)
HA (Hemagglutinin)
M2 (Ion channel)
M1 (Matrix protein)
NP (Nucleocapsid)PB1, PB2, PA
(Transcriptase complex)
Infected cell proteinNS1
Influenza A Virus Structure

Natural History of Influenza VirusesNatural History of Influenza Viruses
Topley and Wilson’s Microbiology and Microbial Infections. 9th ed, Vol 1, Virology. Mahy and Collier, eds, 1998, Arnold, page 387, with permission.
18801880 18901890 19001900 19101910 19201920 19301930 19401940 19501950 19601960 19701970 19801980 19901990 20002000
B
H3N2
H1N1
H2N2
H3N8
H2N?
H1N1
Serum antibody Serum antibody prevalenceprevalence
Virus isolationVirus isolation
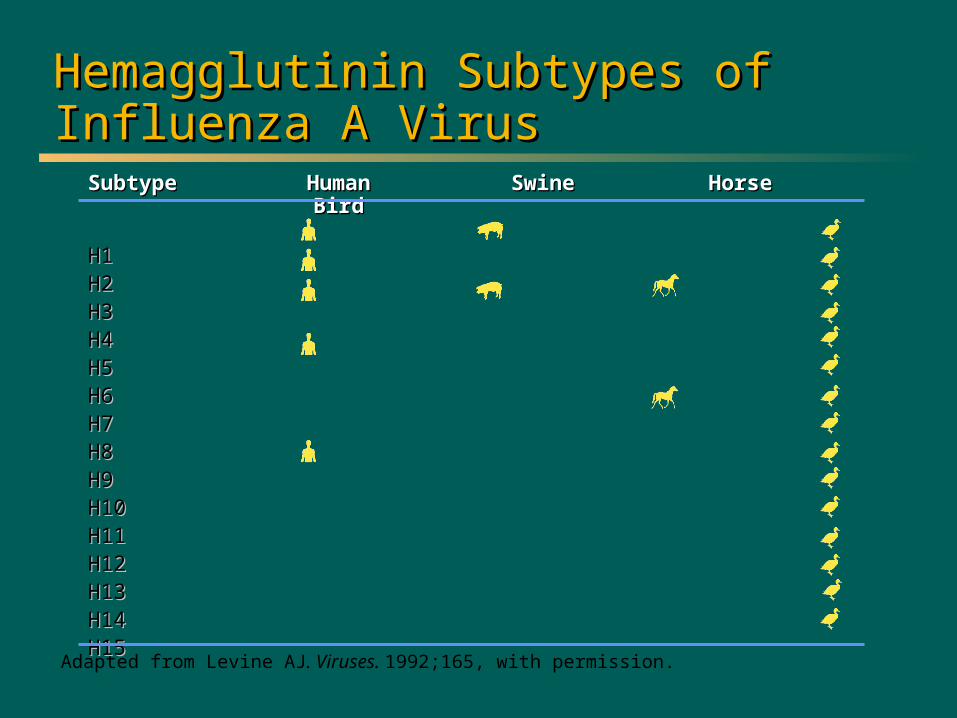
Adapted from Levine AJ. Viruses. 1992;165, with permission.
Hemagglutinin Subtypes of Hemagglutinin Subtypes of Influenza A VirusInfluenza A Virus
SubtypeSubtype HumanHuman SwineSwine HorseHorseBirdBird
H1H1H2H2H3H3H4H4H5H5H6H6H7H7H8H8H9H9H10H10H11H11H12H12H13H13H14H14H15H15

CDC. Influenza Prevention and Control. Available at: http://www.cdc.gov/ncidod/diseases/flu/fluinfo.htm.
Influenza Type A (H1N1) Influenza Type A (H1N1)
Cause of 1918-1919 pandemic (swine)Cause of 1918-1919 pandemic (swine)
Antigenic drift and subsequent epidemicsAntigenic drift and subsequent epidemics
Disappeared in 1957 with appearance of Disappeared in 1957 with appearance of H2N2 virus H2N2 virus
Reappeared as the “Russian flu” in 1977Reappeared as the “Russian flu” in 1977
Immunity in persons born before 1950Immunity in persons born before 1950

NEJM, June 2009

6
Novel H1N1 Weekly Surveillance Pattern: 2008-09 Through July 11, 2009
CDC: http://www.cdc.gov/flu/weekly/weeklyarchives2008-2009/WhoLab27.htm. Accessed July 30, 2009.
New Slide:Needs to be
regularly updated

7
Origins of Novel H1N1 Influenza
First described in April 2009 in Southern California and Mexico
By May 2009 had spread to 43 countries
– >12,000 hospitalizations
– >90 deaths
As of September 11, 2009
– >277,000 cases worldwide
– At least 3200+ deaths
New Slide
Trifonov V. N Engl J Med.2009; 361:115-119.
WHO. http://www.who.int/csr/don/2009_09_11/en/index.html. Accessed September 11, 2009.
8
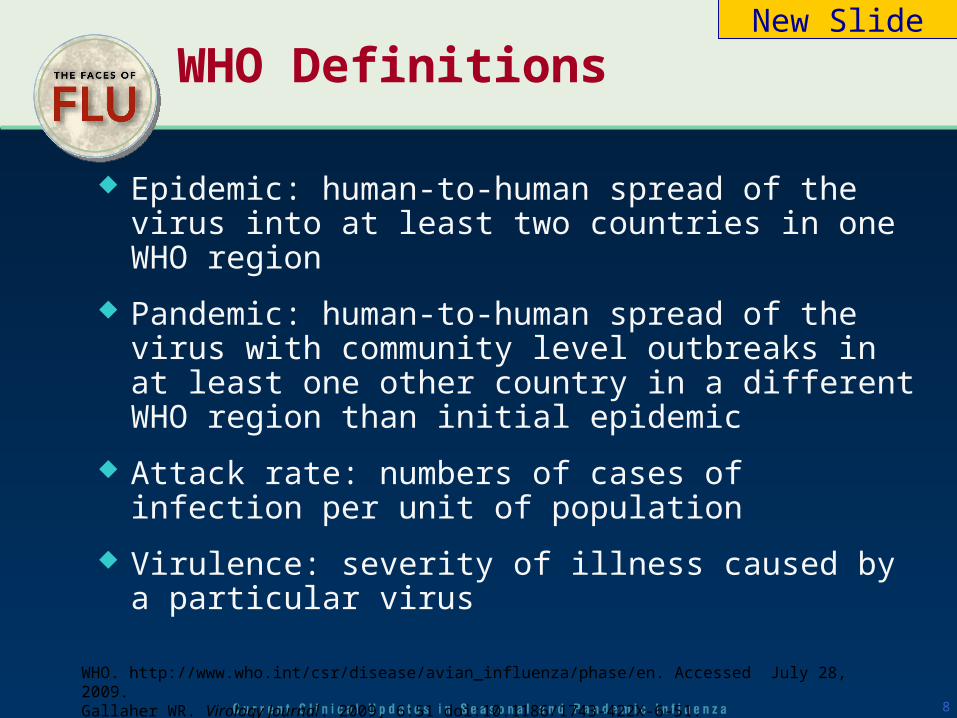
WHO Definitions
Epidemic: human-to-human spread of the virus into at least two countries in one WHO region
Pandemic: human-to-human spread of the virus with community level outbreaks in at least one other country in a different WHO region than initial epidemic
Attack rate: numbers of cases of infection per unit of population
Virulence: severity of illness caused by a particular virus
WHO. http://www.who.int/csr/disease/avian_influenza/phase/en. Accessed July 28, 2009.Gallaher WR. Virology Journal. 2009, 6:51 doi:10.1186/1743-422X-6-51.
New Slide
9
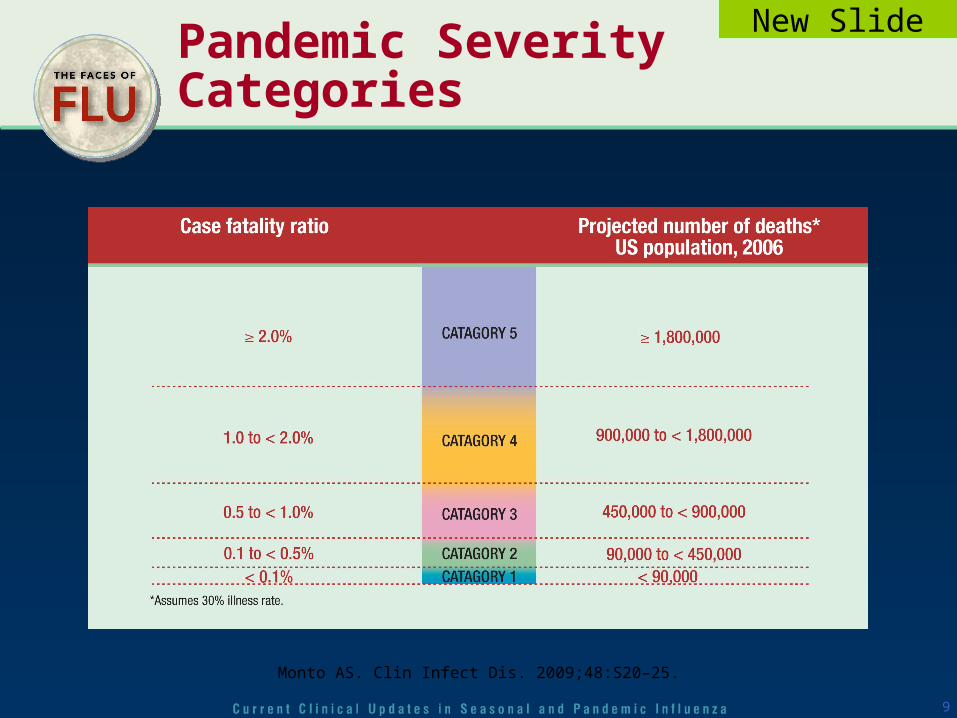
Pandemic Severity Categories
Monto AS. Clin Infect Dis. 2009;48:S20–25.
New Slide
10
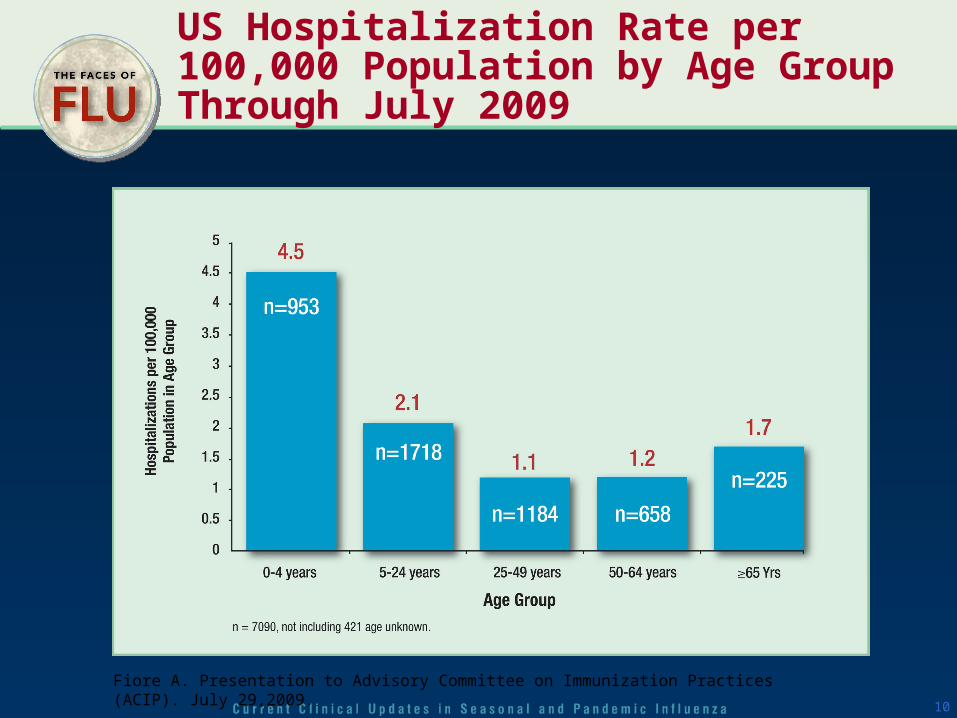
US Hospitalization Rate per 100,000 Population by Age Group Through July 2009
Fiore A. Presentation to Advisory Committee on Immunization Practices (ACIP). July 29,2009.
11
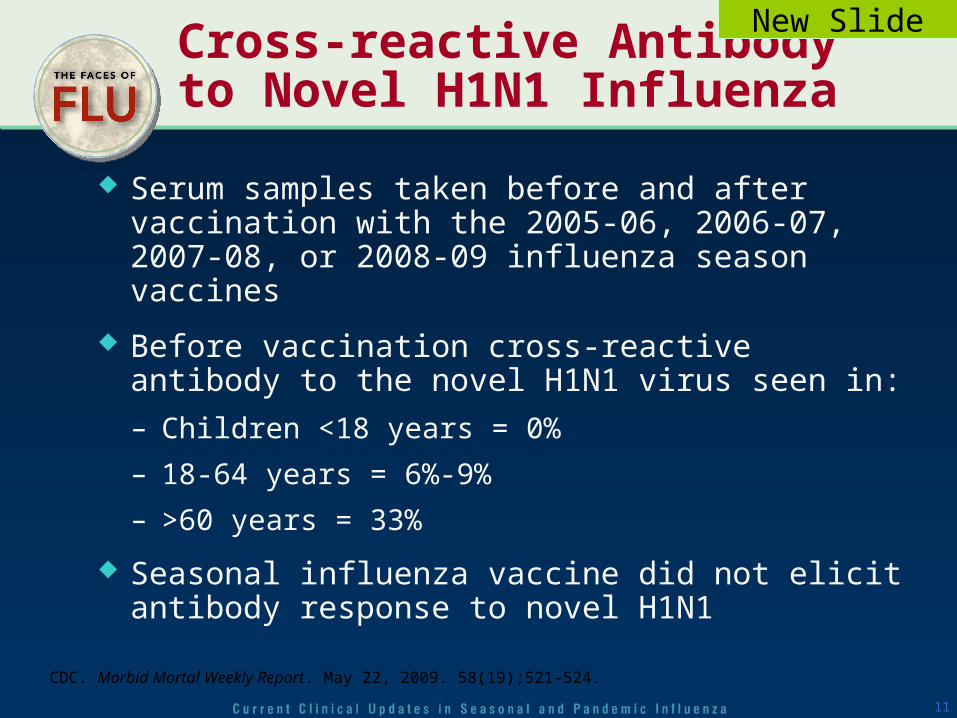
Cross-reactive Antibody to Novel H1N1 Influenza
Serum samples taken before and after vaccination with the 2005-06, 2006-07, 2007-08, or 2008-09 influenza season vaccines
Before vaccination cross-reactive antibody to the novel H1N1 virus seen in:
– Children <18 years = 0%
– 18-64 years = 6%-9%
– >60 years = 33%
Seasonal influenza vaccine did not elicit antibody response to novel H1N1
New Slide
CDC. Morbid Mortal Weekly Report. May 22, 2009. 58(19);521-524.
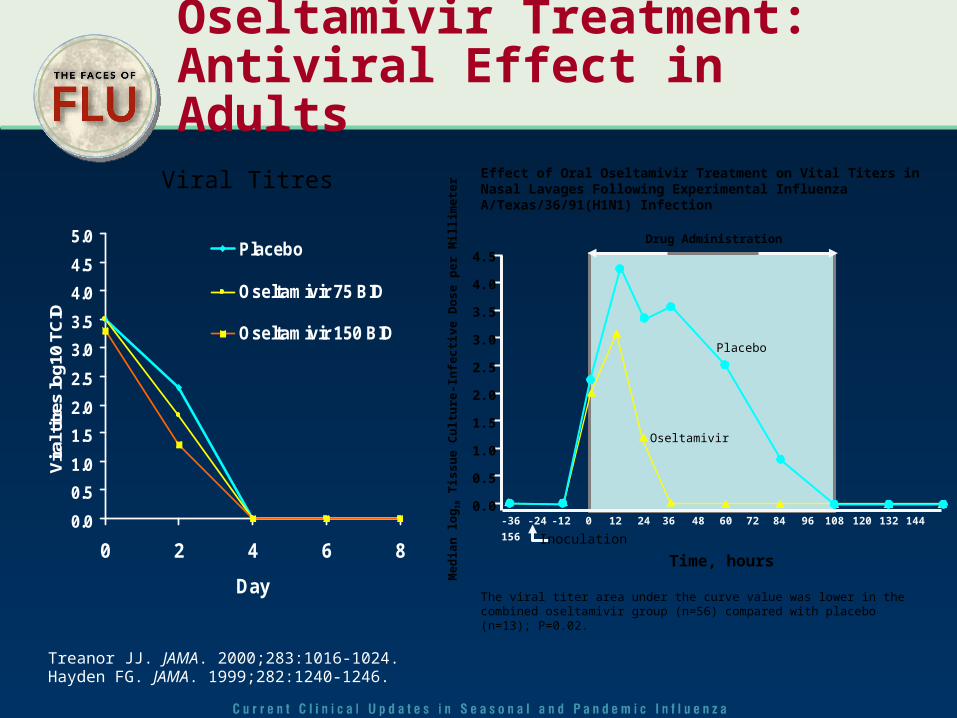
Oseltamivir Treatment: Antiviral Effect in Adults
Treanor JJ. JAMA. 2000;283:1016-1024. Hayden FG. JAMA. 1999;282:1240-1246.
0.0
0.5
1.0
1.5
2.0
2.5
3.0
3.5
4.0
4.5
5.0
0 2 4 6 8
Day
Vir
al ti
tres
log
10 T
CID
Placebo
Oseltamivir 75 BID
Oseltamivir 150 BID
4.5
4.0
3.5
3.0
2.5
2.0
1.5
1.0
0.5
0.0-36 -24 -12 0 12 24 36 48 60 72 84 96 108 120 132 144
156Me
dia
n l
og
10 T
iss
ue
Cu
ltu
re-I
nfe
cti
ve D
os
e p
er M
illim
ete
r
Inoculation
Time, hours
Placebo
Oseltamivir
Drug Administration
The viral titer area under the curve value was lower in the combined oseltamivir group (n=56) compared with placebo (n=13); P=0.02.
Effect of Oral Oseltamivir Treatment on Vital Titers in Nasal Lavages Following Experimental Influenza A/Texas/36/91(H1N1) InfectionViral Titres

Oseltamivir Treatment for Influenza: Adults (16 to 65 Years)
10397
7176
0
20
40
60
80
100
120
Influenza infected Intent to treat
Ho
urs
Placebo Oseltamivir
21 hours**32 hours*
Treanor JJ. JAMA. 2000;283:1016-1024.
*P<0.001; **P=0.004. Treatment initiated within 36 hours of onset of symptoms.
Time to Resolution of All Flu Symptoms
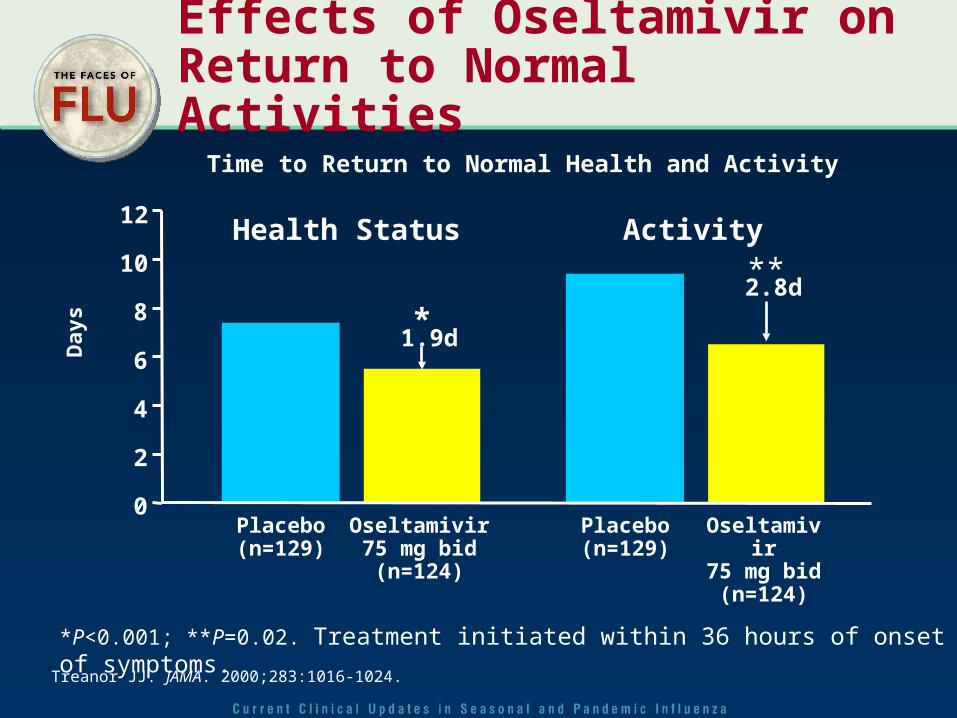
Effects of Oseltamivir on Return to Normal Activities
*P<0.001; **P=0.02. Treatment initiated within 36 hours of onset of symptoms.
Health Status Activity
*
**
1.9d
2.8d
0
12
8
6
4
2
Placebo(n=129)
Oseltamivir75 mg bid
(n=124)
10
Placebo(n=129)
Oseltamivir75 mg bid
(n=124)
Time to Return to Normal Health and Activity
Day
s
Treanor JJ. JAMA. 2000;283:1016-1024.
15
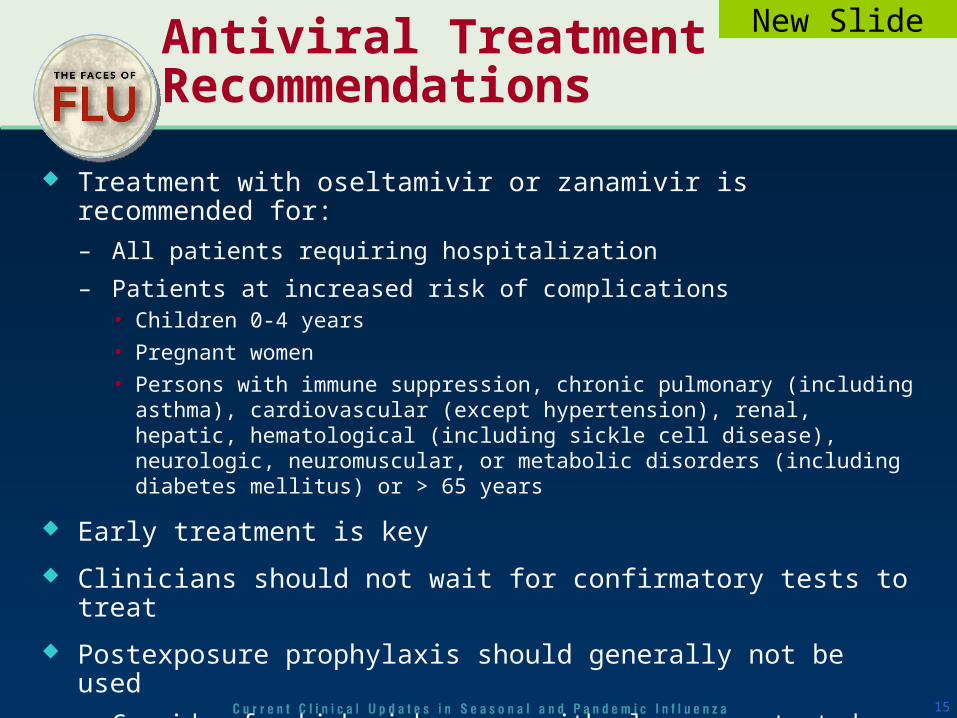
Antiviral Treatment Recommendations
Treatment with oseltamivir or zanamivir is recommended for:
– All patients requiring hospitalization
– Patients at increased risk of complications• Children 0-4 years
• Pregnant women
• Persons with immune suppression, chronic pulmonary (including asthma), cardiovascular (except hypertension), renal, hepatic, hematological (including sickle cell disease), neurologic, neuromuscular, or metabolic disorders (including diabetes mellitus) or > 65 years
Early treatment is key
Clinicians should not wait for confirmatory tests to treat
Postexposure prophylaxis should generally not be used
– Consider for high-risk person with close unprotected exposure
– Do not use if more than 48 hours after exposure
New Slide

Inactivated Vaccine Effectiveness by Age and Risk Group
Age/Risk group Outcome Effectiveness*
6m-16 years, healthy Influenza 50-90%
18-64 years, healthy Influenza 50-90%
>65 years, community Influenza 30-70%
Elderly, nursing home Influenza 30-40%
Elderly, nursing home Hospitalization 30-60%
*Effectiveness may be lower when vaccine and circulating strains antigenically different.
Source: CDC.

Impact of Vaccination of Japanese School Children on Mortality in the Elderly
Reichert TA. N Engl J Med. 2001;344:889-896.
Mandatory vaccination
70
60
50
40
30
20
10
0
14
12
10
8
6
4
2
0Exc
ess
De
ath
s F
rom
All
Ca
use
s (p
er
10
0,0
00
po
pu
latio
n)
Exc
ess
De
ath
s A
ttrib
ute
d t
o P
ne
um
on
ia a
nd
In
flue
nza
(pe
r 1
00
,00
0 p
op
ula
tion
)
1950
1954
1958
1962
1966
1972
1976
1980
1984
1988
1992
1996
2000
Japan, pneumonia and influenza
Japan, all cause
US,pneumonia
and influenza
US, allcause

18
Host and Lineage Origins For The Gene Segments of 2009 A(H1N1) Virus
Garten RJ. Science. 2009;325:197-201.
New Slide
19
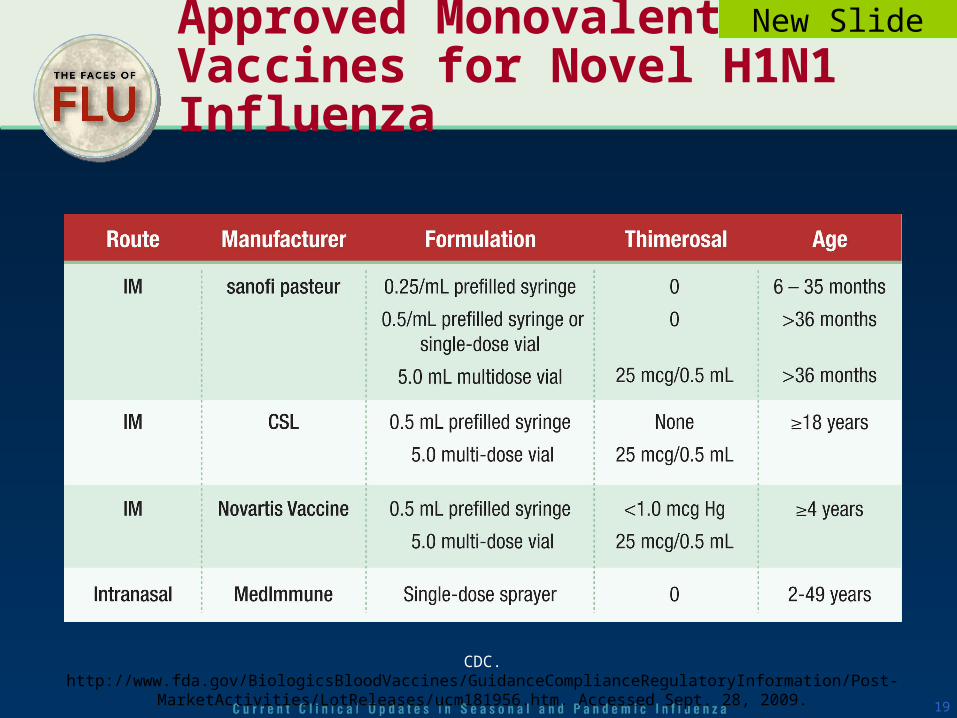
Approved Monovalent Vaccines for Novel H1N1 Influenza
New Slide
CDC. http://www.fda.gov/BiologicsBloodVaccines/GuidanceComplianceRegulatoryInformation/Post-MarketActivities/LotReleases/ucm181956.htm. Accessed Sept. 28, 2009.