Embed Size (px)
DESCRIPTION
The 2012 annual report for the National Resource for Network Biology
Citation preview

Annual Progress Report - Research Progress 2012 National Resource for Network Biology
P41 GM103504 (RR031228) 05/01/2011 - 04/30/2012
The 2012 NRNB Network. On the left is a network representation of all NRNB personnel and collaborators (blue circles), all TRD, DPB, Collaboration, and Service projects (orange diamonds), and associated publications (green triangles). Node size is proportional to the number of connections. Thick red borders indicate personnel and projects directly funded by the NRNB P41 grant. On the right is a zoomed inset, inclusive of all NRNB-funded personnel making up the vital core of the NRNB network. There are 315 nodes and 404 connections in the network. NRNB funds 41 (13%) of these nodes, which make 217 (54%) of the connections. As a Cytoscape network [1], we can interactively explore this representation with our External Advisory Committee, offering dynamic views of our projects, collaborations and budgets. Also see Appendix A for a full-page view of the entire network. 1. Smoot ME, Ono K, Ruscheinski J, Wang PL, Ideker T (2011) Cytoscape 2.8: New features for data integration and network visualization. Bioinformatics 27:431–432.

Summary Continued advances in high-throughput experimental technologies release enormous amounts of interaction data into the public domain. Analysis of these interactions – and the networks they form – relies in large part on robust bioinformatics technology. The mission of the NRNB (nrnb.org) is to develop and support a suite of bioinformatics tools that broadly enable the study of network biology. In our second year as a resource, we have significantly advanced our goals through basic research, collaboration, dissemination of software tools, and community support. Here, we describe our progress in research, both basic and collaborative. This progress includes algorithms for identification of network substructures (modules); use of network modules for patient diagnostics; tools to enable new network analyses and visualizations; and major new versions of our Cytoscape platform and plugin website.
Each progress report below specifies the associated personnel and FTEs funded by the NRNB grant. In terms of our own research, NRNB enables a stable effort from each of the resource member sites, ranging from 0.48 to 1.08 FTEs. Many of these TRD projects leverage effort from other grants and funding mechanisms as well in order to maximize the return on investment. Nevertheless, without NRNB support, these projects would be significantly diminished, if not discontinued, and would lack the cohesion and synergy provided by a network biology resource (see reports #1-7 below).
In terms of the services, training and dissemination, the impact of the NRNB resource is clear. Specifically, the extra effort needed to drive our mailing list response rate from 64% to 93% is due to this resource (see Administrative Information report); the Open Tutorials system for collecting, maintaining and serving tutorial materials; the administration of NRNB’s participation in Google Summer of Code and our new NRNB Academy (see report #9 below); the organization of annual Network Biology SIG and Cytoscape Retreat meetings; the new Cytoscape App Store, which will catalyze Cytoscape user and developer communities (see report #10 below). These efforts are maintained by the 0.5 FTE executive director and 0.3 FTE communications coordinator roles defined and funded by NRNB.
And finally, NRNB has wide-ranging impact on biomedical research, both nationally and internationally through its collaboration projects. NRNB member sites were collectively maintaining an estimated two dozen collaborations prior to the formation of this Resource. During the first year, we established close to 40. And now at the conclusion of our second year, NRNB maintains almost 100 collaboration projects. These project range from the application of Cytoscape as a research tool for network analysis and visualization, to the development of Cytoscape plugins for custom data types and analyses, to the development and application of other network and pathways tools and resources for network biology (see report #8 below). This activity is a direct result of NRNB roles for executive director, communications coordinator and, new this year, collaboration coordinator (0.5 FTE).
We’ve come a long way in just two years, and NRNB is still getting up-to-speed. With continued support, we are committed to maintaining and growing these efforts as a Resource for the network biology community.

Contents
I. Technology Research and Development: Progress and Applications Within each TRD report, we have separated the description of development efforts from the applications of each technology for our own groups and our DBPs. References and figures are provided for each project and numbered independently.
1. Identification of Network Modules as Biomarkers (Ideker) 2. Network Analysis Tools for Cancer Genomics (Sander) 3. Network Analysis Methods for Inferring Causality in Networks (Sander) 4. Using Cytoscape for Social Network Research (Fowler, Pico) 5. Cytoscape 3.0 for the Visualization and Representation of Biological Networks
(Bader) 6. Visualizing Complex Networks as Ontology-Partitioned Mosaics (Pico) 7. The CYNI Modular Network Inference Framework (Schwikowski)
II. Collaboration and Service Projects: Progress In addition to the direct impact of our TRD projects on our research, NRNB also impacts new science through our many CSPs. A description for each CSP is provided in the bulk of the report. Here, we summarize the efforts.
8. New Collaborations 9. Google Summer of Code and NRNB Academy
III. Progress on Supplemental Award, 2011-2013 We were awarded a two-year supplemental grant to work on the Cytoscape App Store. This is a progress report on the first half of the first year.
10. The Cytoscape App Store (Pico)
Appendix A. The 2012 NRNB Network A full-page view of this year’s network representation of NRNB.
I. Technology Research and Development: Progress and Applications Within each TRD report, we have separated the description of development efforts from the applications of each technology for our own groups and our DBPs. References and figures are provided for each project and numbered independently.
1. Identification of Network Modules as Biomarkers (Ideker, 0.5 FTE: Mike Smoot, Rintaro Saito, Kei Ono) Biomarkers are typically thought of as individual genes or proteins. However, we and others have demonstrated that biological pathways and protein interaction networks, which integrate many individual proteins under a common function, can serve as powerful biomarkers and in some cases are also more predictive [1-4]. Our ActiveModules method [1]is an unsupervised approach that first projects molecular profiles (e.g. mRNA or methylation profiles) onto the corresponding nodes in an existing protein interaction map. Subsequently, a network search is performed to identify connected subnetworks (i.e. network modules) whose average node value is higher or lower than expected by chance. The PinnacleZ method [2] is similar to ActiveModules but supervised: each molecular profile is associated with a class label (i.e. cancer subtype) and a network search is performed to identify network modules whose average value is predictive of this sample class. Both PinnacleZ and ActiveModules are implemented as plugins to Cytoscape. Several tools by others, such as the successful HotNet algorithm [5], have been based on ideas introduced by the ActiveModules approach. The advantage of such approaches over regular clustering and classification methods is that they associate the molecular features with physical or functional structures, providing a wealth of hypotheses about the pathway mechanisms underlying an observed set of molecular profiles. In some cases they also provide more robust classification performance. Our projects have been pursuing technological advances to better reveal network modular structure, define network logic functions associated with disease outcomes, and extend existing network-biomarker approaches to multiple types of molecular and phenotypic data.
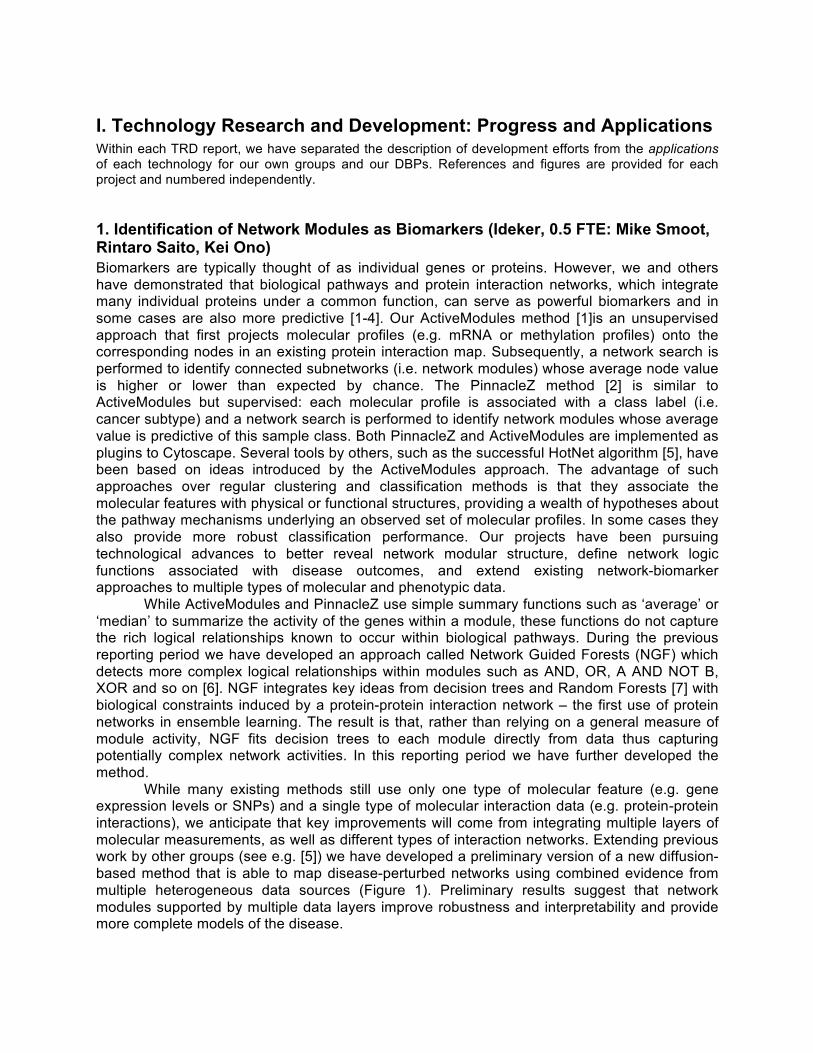
While ActiveModules and PinnacleZ use simple summary functions such as ‘average’ or ‘median’ to summarize the activity of the genes within a module, these functions do not capture the rich logical relationships known to occur within biological pathways. During the previous reporting period we have developed an approach called Network Guided Forests (NGF) which detects more complex logical relationships within modules such as AND, OR, A AND NOT B, XOR and so on [6]. NGF integrates key ideas from decision trees and Random Forests [7] with biological constraints induced by a protein-protein interaction network – the first use of protein networks in ensemble learning. The result is that, rather than relying on a general measure of module activity, NGF fits decision trees to each module directly from data thus capturing potentially complex network activities. In this reporting period we have further developed the method. While many existing methods still use only one type of molecular feature (e.g. gene expression levels or SNPs) and a single type of molecular interaction data (e.g. protein-protein interactions), we anticipate that key improvements will come from integrating multiple layers of molecular measurements, as well as different types of interaction networks. Extending previous work by other groups (see e.g. [5]) we have developed a preliminary version of a new diffusion-based method that is able to map disease-perturbed networks using combined evidence from multiple heterogeneous data sources (Figure 1). Preliminary results suggest that network modules supported by multiple data layers improve robustness and interpretability and provide more complete models of the disease.

Figure 1. Map of network modules and associations integrating multiple data layers. Large orange nodes are modules enriched for somatic mutations while large blue nodes are modules of genes highly over-expressed in cancer (TCGA level 3 data, z > 100 compared to control). Gene size is scaled according to the percentage of the cohort in which they are altered relative to other genes in the module. Edges within a module represent protein interactions while weighted edges between modules represent statistical associations between modules. Insets in the top-left and top-right corner highlight representative modules for over-expression and mutations, respectively.
Applications Using NGF, we analyzed gene expression data gathered for diverse biological programs including breast cancer metastasis [8,9] or mesenchymal transformation of brain tumors [10]. These case studies showed that, unlike the gene sets identified by regular Random Forests, the network modules identified by NGF are highly enriched for known causal mechanisms of disease (e.g. dominated by known oncogenes and tumor suppressors), and they have very consistent performance across different sample cohorts. In this reporting period we have performed multiple analysis of additional large datasets including those collected by one of our DBPs, The Cancer Genome Atlas (TCGA) [11]. Through this analysis we have identified and bioinformatically validated predictive modules found by NGF to associate with the specific subtypes of glioblastoma. The most predictive module associated with the mesenchymal subtype was strongly supported by independent transcriptional datasets. On the basis of these findings, this module is now being validated experimentally. We also published an abstract with another one of our DBPs on a subnetwork-based analysis of chronic lymphocytic Leukemia, associating particular pathways with the progression of the disease [12]. Given a library of genes and network modules selected using various types of molecular data, we can now investigate the relationships among these units such as the association between a germline SNP and the output of a differentially-expressed network (i.e., an eQTL) or the association between a pathway enriched for somatic cancer mutations and a clinical

phenotype such as survival. Together with our DBP, we have used this method to analyze The Cancer Genome Atlas (TCGA) Ovarian Cancer data (somatic mutations and expression profiles) using the HPRD protein interaction network. We identified modules enriched for genetic mutations, as well as modules highly over-expressed in cancer compared to normal tissue. Next we investigated all pairwise correlations between modules to reveal modular associations both within and between the two data layers (Figure 1). Based on this preliminary analysis we conclude that the existing data and our toolset will enable us to construct multi-level modular maps of cancer that will significantly extend single-level network models provided by current methods [13].
References 1. T. Ideker, O. Ozier, B. Schwikowski, A. F. Siegel, Discovering regulatory and signalling circuits in molecular interaction networks. Bioinformatics 18 Suppl 1, S233 (2002). 2. H. Y. Chuang, E. Lee, Y. T. Liu, D. Lee, T. Ideker, Network-based classification of breast cancer metastasis. Mol Syst Biol 3, 140 (2007). 3. E. Lee, H. Y. Chuang, J. W. Kim, T. Ideker, D. Lee, Inferring pathway activity toward precise disease classification. PLoS Comput Biol 4, e1000217 (Nov, 2008). 4. I. W. Taylor et al., Dynamic modularity in protein interaction networks predicts breast cancer outcome. Nat Biotechnol 27, 199 (Feb, 2009). 5. F. Vandin, E. Upfal, B. J. Raphael, Algorithms for detecting significantly mutated pathways in cancer. J Comput Biol 18, 507 (Mar, 2011). 6. J. Dutkowski, T. Ideker, Protein networks as logic functions in development and cancer. PLoS Comput Biol, (2011). 7. L. Breiman, Random forests. Machine Learning 45, 5 (2001). 8. Y. Wang et al., Gene-expression profiles to predict distant metastasis of lymph-node-negative primary breast cancer. Lancet 365, 671 (Feb 19-25, 2005). 9. L. J. van 't Veer et al., Gene expression profiling predicts clinical outcome of breast cancer. Nature 415, 530 (Jan 31, 2002). 10. H. S. Phillips et al., Molecular subclasses of high-grade glioma predict prognosis, delineate a pattern of disease progression, and resemble stages in neurogenesis. Cancer Cell 9, 157 (Mar, 2006). 11. R. G. Verhaak et al., Integrated genomic analysis identifies clinically relevant subtypes of glioblastoma characterized by abnormalities in PDGFRA, IDH1, EGFR, and NF1. Cancer Cell 17, 98 (Jan 19, 2010). 12. Chuang, Han-Yu, et al., Subnetwork-Based Analysis of Chronic Lymphocytic Leukemia Identifies Pathways That Associate with Disease Progression, ASH Annual Meeting Abstracts 2011 118: 3564. 13. P. T. Spellman et al., Integrated genomic analyses of ovarian carcinoma. Nature 474, 609 (Jun 30, 2011).
2. Network Analysis Tools for Cancer Genomics (Sander, 0.65FTE: Ben Gross, Ethan Cerami) As described in our previous progress report, the first TRD project at MSKCC is focused on building network analysis tools for interpreting high-throughput cancer genomic data sets. Our primary focus is building user friendly, open source tools for visualizing and analyzing multidimensional cancer genomic data sets (including copy number, mutation, and mRNA expression) in the context of known biological pathways and interaction networks, and making these tools broadly available within the cancer research community. Providing such tools to the cancer research community is critical, as numerous large-scale projects, including the Cancer Genome Atlas (TCGA) project and the International Cancer Genome Consortium (ICGC), are

profiling dozens of cancer types and subtypes. Identifying altered pathways and networks within each of these cancer types remains a critical and open challenge.
During our first year of NRNB funding, we completed a prototype project for displaying multi-dimensional cancer genomic data in the context of molecular interaction networks. We chose to implement the prototype in Cytoscape Web [1], as Cytoscape Web does not require any additional software installation or require Java Web Start. It therefore significantly lowers the barriers for usage, particularly for biologists and clinical researchers – two of our main target user groups. In this progress report, we describe the transition of our tools from prototype to production mode, and describe how we have now made our software available to the entire cancer research community. Specifically, our NRNB-funded network tools are now available within the cBio Cancer Genomics Portal, where it enables cancer researchers to perform network analysis on up to 20 different cancer types, including TCGA-funded projects related to our DBP, such as Glioblastoma Multiforme (GBM) [2] and serous ovarian cancer [3].
As general background, the cBio Cancer Genomics Portal (http://cbioportal.org) is an open-access resource for interactively exploring multidimensional cancer genomics data sets. It currently provides integrated access to cancer genomic data (including copy number, mutation, mRNA and microRNA expression, methylation, and protein and phosphoprotein data) on more than 5,000 tumor samples from 20 cancer studies. With a focus on usability and ease of use, the cBio Portal specifically provides integrated access to multiple genomic data types, graphical summaries of genomic alterations, survival analysis and predicted functional consequences of somatic mutations. All features of the portal are available via a streamlined four-step web interface, enabling researchers to interactively explore gene sets and pathways, and dynamically broaden or limit the scope of their query. By integrating data on thousands of tumor samples, and providing a simple, yet powerful and flexible interface, the cBio Portal enables cancer researchers to translate genomic data into biological insights and clinical applications. During the past year, we have added our NRNB-funded network analysis tools to the cBio Portal (launched on November 14, 2011), and have made the functionality freely available to the scientific community. The network functionality (Figure 1) is directly available via the main cancer query interface, and the portal now automatically generates a cancer specific network of interest, based on seed genes specified by the user. This network consists of pathways and interactions from the Human Reference Protein Database (HPRD) [4], Reactome [5], NCI-Nature [6], and the MSKCC Cancer Cell Map (http://cancer.cellmap.org), as derived from the open source Pathway Commons Project [7].

Figure 1. Network visualization and analysis now available within the cBio Cancer Genomics Portal (http://cbioportal.org). A. Network view of TP53 in TCGA Glioblastoma Multiforme (GBM). Network of interest generated from the seed gene of TP53; MDM2 and MDM4 are highlighted. B. The portal overlays multi-dimensional genomic data (copy number, mutation, and mRNA expression) onto all nodes in the network. C. All edges are color-coded by interaction types. Interaction types are derived from the BioPAX to Simple Interaction (SIF) inference rules [7]. For example, In Same Component indicates that Genes A and B are involved in the same biological component, such as a complex; State Change indicates that Gene A causes a state change, such as a phosphorylation change within Gene B; Other is used to indicate all other types of interactions, including protein-protein interactions derived from HPRD. D. Options for filtering, cropping and searching the network of interest. By default, the network of interest contains all neighbors of all seed genes specified by the user. If more than 50 neighbor nodes exist in the network, all genes are ranked by the frequency of genomic alteration within the specified cancer study, and less frequently altered genes are automatically pruned from the network. By default, the portal also automatically overlays multi-dimensional genomic data onto each node, highlighting the frequency of alteration by mutation and copy number alteration (and optionally mRNA up/down regulation). This provides an effective means of managing network complexity, while automatically highlighting those genes most directly relevant to the cancer type in question. One can also download the full, non-pruned network for more complete visualization and analysis. In addition, users can filter the network by alteration frequency, highlight all neighbors of a selected gene, hide specific nodes, crop to a selected set of nodes, or search the network by gene symbol. These features enable cancer researchers to identify new cancer-specific genes that go beyond the original set of seed genes, and provide an effective means for discovering novel cancer genes and novel genomic alterations. As originally outlined in our grant application, our goal is to eventually integrate cancer genomic data, pathway data and drug target data. In the next year, we therefore intend to focus on extending the network feature to include drug data and drug target information. We initially plan to integrate drug data from DrugBank [8], but are also evaluating other sources, including: ChEBI [9], NCBI PubChem [10], and PharmGKB [11].
Applications See next section for summary of applications for this and the next TRD project.
References 1. Lopes CT, Franz M, Kazi F, Donaldson SL, Morris Q, Bader GD: Cytoscape Web: an interactive web-based network browser. Bioinformatics 2010, 26(18):2347-2348. 2. TCGA: Comprehensive genomic characterization defines human glioblastoma genes and core pathways. Nature 2008, 455(7216):1061--1068. 3. Integrated genomic analyses of ovarian carcinoma. Nature 2011, 474(7353):609-615. 4. Keshava Prasad TS, Goel R, Kandasamy K, Keerthikumar S, Kumar S, Mathivanan S, Telikicherla D, Raju R, Shafreen B, Venugopal A et al: Human Protein Reference Database--2009 update. Nucleic acids research 2009, 37(Database issue):D767-772. 5. Matthews L, Gopinath G, Gillespie M, Caudy M, Croft D, de Bono B, Garapati P, Hemish J, Hermjakob H, Jassal B et al: Reactome knowledgebase of human biological pathways and processes. Nucleic acids research 2009, 37(Database issue):D619-622.

6. Schaefer CF, Anthony K, Krupa S, Buchoff J, Day M, Hannay T, Buetow KH: PID: the Pathway Interaction Database. Nucleic acids research 2009, 37(Database issue):D674-679. 7. Cerami EG, Gross BE, Demir E, Rodchenkov I, Babur O, Anwar N, Schultz N, Bader GD, Sander C: Pathway Commons, a web resource for biological pathway data. Nucleic acids research, 39(Database issue):D685-690. 8. Knox C, Law V, Jewison T, Liu P, Ly S, Frolkis A, Pon A, Banco K, Mak C, Neveu V et al: DrugBank 3.0: a comprehensive resource for 'omics' research on drugs. Nucleic acids research 2011, 39(Database issue):D1035-1041. 9. de Matos P, Alcantara R, Dekker A, Ennis M, Hastings J, Haug K, Spiteri I, Turner S, Steinbeck C: Chemical Entities of Biological Interest: an update. Nucleic acids research 2010, 38(Database issue):D249-254. 10. Wang Y, Xiao J, Suzek TO, Zhang J, Wang J, Zhou Z, Han L, Karapetyan K, Dracheva S, Shoemaker BA et al: PubChem's BioAssay Database. Nucleic acids research 2012, 40(Database issue):D400-412. 11. McDonagh EM, Whirl-Carrillo M, Garten Y, Altman RB, Klein TE: From pharmacogenomic knowledge acquisition to clinical applications: the PharmGKB as a clinical pharmacogenomic biomarker resource. Biomarkers in medicine 2011, 5(6):795-806.
3. Network Analysis Methods for Inferring Causality in Networks (Sander, 0.65FTE: Ben Gross, Ethan Cerami) The goal of our second TRD project is to algorithmically infer causality within signaling networks from specific perturbation-induced experiments. High-throughput screens conducted with libraries of small molecules or inhibitory RNAs have the ability to identify compounds that induce tumor suppressive responses in cancer cells [1]. While the effects of such perturbations can be easily linked to transcriptional changes, identifying the causal mechanism is a main challenge. In a collaboration with Somwar and colleagues [2], we used a computational approach to predict the target of a small molecule inducing reduced growth in lung adenocarcinoma cell lines. Interestingly, experimental follow up confirmed the prediction. Building on this concept, we have started working on computational approaches to reconstruct the causal signaling cascade inducing observed transcriptional changes within perturbed cell lines. With NRNB funding, we have previously explored the use of an optimization algorithm borrowed from statistical physics to connect altered genes in cancer into minimal spanning networks. Now, we have begun to use the same approach to identify the minimal set of interactions able to connect genes that are differentially expressed after a perturbation, with candidate targets of the same perturbation (Figure 1).

Figure 1. Given a perturbation and an observed response, the proposed network analysis algorithms that we are developing aim to identify the perturbat-ion target and the signaling cascade inducing the observed transcriptional response. Our approach relies on an algorithm that solves the Steiner-tree problem. Given a set of “terminal” nodes, the Steiner-tree is defined as the tree of minimum weight connecting these terminals, allowing the inclusion of additional nodes. Differentially expressed genes after a perturbation and/or candidate targets of the same perturbation can be used as terminals. The resulting Steiner-tree can therefore contain both gene interactions able to explain the observed transcriptional changes, and the putative target of the perturbation. This research remains a work in progress, and we are continuing to explore new algorithmic frameworks.
Applications Large-scale cancer genomics projects, such as the Cancer Genome Atlas (TCGA), and the International Cancer Genome Consortium (ICGC), are providing an unprecedented and high-resolution view of the molecular defects in dozens of cancer types [3]. A key open challenge is to identify biological pathways that are frequently perturbed within tumor cells and lead to the acquisition of tumorigenic properties, such as cell proliferation, angiogenesis or metastasis [4, 5]. A number of algorithmic methods have been identified for discovering altered networks and pathways in cancer, including: Mutually Exclusive Modules in Cancer (MEMo) [6], PARADIGM [7], and HotNet [8]. The network analysis tools we have built for our TRD enable researchers to interactively explore perturbed pathways and networks in cancer. Unlike the algorithmic methods described above, the tools we have developed are specifically designed to support exploratory data analysis and hypothesis generation, and are designed for widespread use within the wider cancer research community. By specifically adding network features to the cBio Cancer Genomics Portal, we have also enabled network analysis on the full TCGA data set. In addition, the portal has become a crucial tool within TCGA and is actively used by a large number of TCGA disease working groups, including serous ovarian cancer, colorectal cancer, breast cancer, and lung cancer (see collaborations). To cite one concrete translation application, we used the network analysis features of the portal to identify genomic alterations in the homologous recombination (HR) DNA repair pathway in serous ovarian cancer. BRCA1 and BRCA2 are known to be involved in the HR Pathway, but additional defects may also abrogate HR functionality, leading to potential sensitivity to PARP inhibitors [9]. To identify potential HR defects in ovarian cancer, we used BRCA1 and BRCA2 as seed nodes for the network view and explored the resulting altered network of interest (Figure 2A). By this means, we quickly identified alterations in C11orf30/EMSY (6% by amplification, 1.6% by mutation), a known interactor of BRCA2, and a possible alternate means for abrogating HR functionality [9]. We also readily identified all altered Fanconi Anemia genes (another family of genes involved in the HR pathway [9]), and identified low frequency alterations in FANCA (altered in 3.5% of patients) and FANCE (2.8% of patients). Combining these results with other genes known to be involved in the HR pathway, our DBP (TCGA) was able to identify potential defects in the HR pathway in up to half of all patients, providing a rationale for including such cases in clinical trials involving PARP inhibitors (Figure 2B) [10].

Figure 2: Extent of homologous recombination (HR) repair defects in serous ovarian cancer. A. Network view of BRCA1/BRCA2 in TCGA serous ovarian cancer. BRCA1 and BRCA2 are seed genes (indicated with thick border), and all other genes are automatically identified as altered in ovarian cancer. Multidimensional genomic details are shown for FANCA, FANC3 and C11orf30/EMSY. Darker red indicates increased frequency of alteration (defined by mutation, copy number amplification or homozygous deletion) in ovarian cancer. B. Extent of HR defects in TCGA Ovarian Samples. Reprinted from [10].
References 1. Somwar R, Shum D, Djaballah H, Varmus H: Identification and preliminary characterization of novel small molecules that inhibit growth of human lung adenocarcinoma cells. Journal of biomolecular screening 2009, 14(10):1176-1184. 2. Somwar R, Erdjument-Bromage H, Larsson E, Shum D, Lockwood WW, Yang G, Sander C, Ouerfelli O, Tempst PJ, Djaballah H et al: Superoxide dismutase 1 (SOD1) is a target for a small molecule identified in a screen for inhibitors of the growth of lung adenocarcinoma cell lines. Proceedings of the National Academy of Sciences of the United States of America 2011, 108(39):16375-16380. 3. Stratton MR, Campbell PJ, Futreal PA: The cancer genome. Nature 2009, 458(7239):719--724. 4. Hanahan D, Weinberg RA: The hallmarks of cancer. Cell 2000, 100(1):57--70. 5. Hanahan D, Weinberg RA: Hallmarks of cancer: the next generation. Cell 2011, 144(5):646-674. 6. Ciriello G, Cerami E, Sander C, Schultz N: Mutual exclusivity analysis identifies oncogenic network modules. Genome research 2012, 22(2):398-406. 7. Vaske CJ, Benz SC, Sanborn JZ, Earl D, Szeto C, Zhu J, Haussler D, Stuart JM: Inference of patient-specific pathway activities from multi-dimensional cancer genomics data using PARADIGM. Bioinformatics 2010, 26(12):i237-245.

8. Vandin F, Upfal E, Raphael BJ: Algorithms for detecting significantly mutated pathways in cancer. Journal of computational biology : a journal of computational molecular cell biology 2011, 18(3):507-522. 9. Turner N, Tutt A, Ashworth A: Hallmarks of 'BRCAness' in sporadic cancers. Nat Rev Cancer 2004, 4(10):814-819. 10. Integrated genomic analyses of ovarian carcinoma. Nature 2011, 474(7353):609-615.
4. Using Cytoscape for Social Network Research (Fowler, 0.72FTE: Janusz Dutkowski; Pico, 0.48FTE: Alex Pico, Alex Williams) It is well known that humans tend to associate with other humans who have similar characteristics, but it is unclear whether this tendency has consequences for the distribution of genotypes in a population. Although geneticists have shown that populations tend to stratify genetically, this process results from geographic sorting or assortative mating, and it is unknown whether genotypes may be correlated as a consequence of non-reproductive associations or other processes.
In this TRD project, we began with a study of social networks and genotypes from the National Longitudinal Study of Adolescent Health [1,2] and a replication study on an independent sample from the Framingham Heart Study. These studies showed that homophily and heterophily occur on a genetic (indeed, an allelic) level, which has implications for the study of population genetics and social behavior. In particular, the results suggest that association tests should include friends' genes and that theories of evolution should take into account the fact that humans might, in some sense, be "metagenomic" with respect to the humans around them. The analytical methods developed for these studies were implemented in the R scripting language, while the visualization methods were provided by a collection of disparate tools, none of which were tailored for network visualization or for integration with R.
During this reporting period, we collaborated with the Pico group on developing new technologies for network analysis and visualization that complement and many cases replace prior methods. In particular, we developed the CyNetworkSignificance plugin, which can perform the same analysis pipeline formerly executed in R and other chart and network visualization tools, but all in a single tool, integrated with wide-ranging functionality through other plugins. After loading a social network into Cytoscape together with genotypic or other data attributes, you can launch CyNetworkSignificance and customize the following parameters. Select the data attribute to use for correlation. Select the correlation method (e.g., Pearson). Choose the number of randomized trials to compare against and randomization method (e.g., shuffle nodes). The hit “Run” and the plugin will calculate correlation values for the original network and each of the randomly generated networks for each Nth-degree represented in the network (e.g., from pairs of nodes directly connected, to pairs of nodes connected by N-degrees of separation). These correlation values match the results of the existing R analysis. We will also add a histogram visualization feature to the plugin before its official release (Fig 1.)

Figure 1. Social network of the Hadza hunter-gatherers of Tanzania. This analysis in Cytoscape reproduces the results published earlier this year in Nature by Fowler et al., that show a strong social network-dependence on the donation of public goods across and within groups [3]. The histogram plot is a mock-up at this stage, but based on the correlation values calculated by CyNetworkSignificance on the original and randomized networks. For extended R analyses, we are leveraging a new community-contributed plugin called RCytoscape, which allows us to send network data to Cytoscape from within R after completing an analysis. The network and associated node and edge attributes are then available for visualization and analysis within Cytoscape. The workflows enabled by these technologies will support the types of analyses we are most interested in pursuing through our DBPs and collaborations.
The NRNB grant has provided not only direct funding for my group, but also has created a unique fluidity of ideas and effort across NRNB sites. This project, for example, would not likely have been initiated (let alone completed) outside of this resource organization, where we could immediately launch and execute the work in collaboration with the Pico group without establishing a new subcontract. The success of this intra-NRNB collaboration serves as a practical example of how our resource can work in new ways and will likely inspire future cross-group activities.
Applications We just recently completed the technical implementation of the new Cytoscape plugin and R workflows. We have performed post-hoc analyses on prior datasets to confirm the reproduction of results from the prior methods. Indeed, the tools work well and should streamline future analyses. During the next reporting period we will apply the new technologies from this TRD to our ongoing research, DBPs and Collaborations. Specifically, we will be following up on the findings above with a genome-wide study of correlated genotypes with the goal of using

associations to learn more about the role of networks in recent human evolution. By correlating these associations with measures of nucleotide diversity, we hope to show that the genotypes under strongest friendship selection are also those under the strongest natural selection. In the meantime, we continue to publish with and track the work of our DBPs, applying social network analysis methods to the study of obesity and aspirin use and cardiovascular events [4,5]
References 1. Fowler JH, Dawes CT, Christakis NA. Model of genetic variation in human social networks. Proc Natl Acad Sci U S A. 2009 Feb 10;106(6):1720-4. Epub 2009 Jan 26. PMID: 19171900; PMCID: PMC2644104. 2. Fowler JH, Settle JE, Christakis NA. Correlated genotypes in friendship networks. Proc Natl Acad Sci U S A. 2011 Feb 1;108(5):1993-7. Epub 2011 Jan 18. PMID: 21245293, PMC3033315 3. Coren L. Apicella, Frank W. Marlowe, James H. Fowler and Nicholas A. Christakis. Social networks and cooperation in hunter-gatherers. Nature, Vol. 481, Pg. 497-501. 4. Block JP, Christakis NA, O'Malley AJ, Subramanian SV. Proximity to food establishments and body mass index in the Framingham Heart Study offspring cohort over 30 years. Am J Epidemiol. 2011 Nov 15;174(10):1108-14. Epub 2011 Sep 30. 5. Strully KW, Fowler JH, Murabito JM, Benjamin EJ, Levy D, Christakis NA.Aspirin use and cardiovascular events in social networks. Soc Sci Med. 2012 Apr;74(7):1125-9. Epub 2012 Feb.
5. Cytoscape 3.0 for the Visualization and Representation of Biological Networks (Bader, 1.0FTE: Christian Lopes, Jason Montojo) Our major activity over the past year has been to ensure that Cytoscape 3.0 supports the advanced visualization and representation features that we proposed in the NRNB grant, both in system design and performance. This has required major effort porting visualization features from Cytoscape 2.8 and developing new visualization features in Cytoscape 3.0 to test the design of the new Cytoscape 3 application programming interfaces (APIs). For instance, we worked with the Ideker software development team to port Cytoscape 2 graph layout algorithms to Cytoscape 3. We also developed a full featured 3D graph visualization and layout system to test that Cytoscape can handle multiple types of visualization systems at the same time (http://wiki.cytoscape.org/Cytoscape_3/3D_Renderer). This resulted in a substantially improved design for support of multiple simultaneous visualization engines in Cytoscape 3. Finally, we worked in collaboration with the i-Vis Information Visualization Research Group of Bilkent University to develop a compound node model for Cytoscape Web, which is a necessary feature for pathway visualization on the web and full compatibility with the Cytoscape 3 network model.
We are also laying the groundwork for representation and visualization of detailed biological pathway information in Cytoscape 3. We have completed the following activities in this area.
● Tested and updated the design of the core Cytoscape 3 model to ensure hierarchical network models can be stored, queried, saved and loaded. This is the foundation for many advanced visualization features that we proposed in the grant, such as hierarchical views necessary for biological pathway visualization.
● Developed a prototype of a new app that uses the latest Cytoscape 3 API and Pathway Commons web services and client API, which provides search, access, and analysis of biological pathway information from the BioPAX Level 3 data warehouse (warehouse development funded by the Pathway Commons project). Also, we ensured that biological pathway information in the standard BioPAX format can be seamlessly mapped to the Cytoscape 3 network model.

Ensuring Cytoscape 3 will enable our stated aims has required tremendous effort, in that we have need to implement a number of prototype features to test that the API design is robust. This work will pay off in 2012-2013 as we finally release Cytoscape 3 and start working on novel visualization features in earnest.
Applications While Cytoscape 3 work is still in the active development phase and we anticipate many applications next year and beyond, we continue to maintain our highly successful Enrichment Map visualization plugin for Cytoscape 2.8, responding to frequent requests by users for new features. This visualization tool is heavily used in all of our collaborations with local biology groups (see Collaboration and Service Projects) and by others (the papers describing the method garnered almost 40 citations since 2010 [1]). In the following year, we plan to port this system to Cytoscape 3.0 and to integrate it with popular pathway enrichment analysis software, such as the Gene Set Enrichment Analysis (GSEA) software from Jill Mesirov’s group at the Broad Institute, MIT. We also continue to publish with and follow the work of our DBPs, whom have had a very productive year applying Cytoscape and network analysis approaches to the study of the yeast interactome, genetic interactions and metabolism [2-5].
References 1. Merico D, Isserlin R, Stueker O, Emili A, Bader GD. Enrichment map: a network-based method for gene-set enrichment visualization and interpretation. PLoS One. 2010 Nov 15;5(11):e13984. PMID: 21085593; PMCID: PMC2981572. 2. Baryshnikova A, Costanzo M, Kim Y, Ding H, Koh J, Toufighi K, Youn JY, Ou J,San Luis BJ, Bandyopadhyay S, Hibbs M, Hess D, Gingras AC, Bader GD, Troyanskaya OG, Brown GW, Andrews B, Boone C, Myers CL. Quantitative analysis of fitness and genetic interactions in yeast on a genome scale. Nat Methods. 2010 Dec;7(12):1017-24. Epub 2010 Nov 14 3. Bellay J, Atluri G, Sing TL, Toufighi K, Costanzo M, Ribeiro PS, Pandey G,Baller J, VanderSluis B, Michaut M, Han S, Kim P, Brown GW, Andrews BJ, Boone C, Kumar V, Myers CL. Putting genetic interactions in context through a global modular decomposition. Genome Res. 2011 Aug;21(8):1375-87. Epub 2011 Jun 29 4. Magtanong L, Ho CH, Barker SL, Jiao W, Baryshnikova A, Bahr S, Smith AM,Heisler LE, Choy JS, Kuzmin E, Andrusiak K, Kobylianski A, Li Z, Costanzo M,Basrai MA, Giaever G, Nislow C, Andrews B, Boone C. Dosage suppression genetic interaction networks enhance functional wiring diagrams of the cell. Nat Biotechnol. 2011 May 15;29(6):505-11. doi: 10.1038/nbt.1855. 5. Szappanos B, Kovács K, Szamecz B, Honti F, Costanzo M, Baryshnikova A,Gelius-Dietrich G, Lercher MJ, Jelasity M, Myers CL, Andrews BJ, Boone C, Oliver SG, Pál C, Papp B. An integrated approach to characterize genetic interaction networks in yeast metabolism. Nat Genet. 2011 May 29;43(7):656-62. doi:10.1038/ng.846.
6. Visualizing Complex Networks as Ontology-Partitioned Mosaics (Pico, 0.48FTE: Alex Pico, Kristina Hanspers) Increasing throughput and quality of molecular measurements in the domains of genomics, proteomics and metabolomics continues to fuel the understanding of biological processes. Collected per molecule, the scope of these data extends to physical, genetic and biochemical interactions that in turn comprise extensive networks. One challenge faced by these tools is how to make sense of such networks, which are often represented as massive “hairballs.” Many network analysis algorithms filter or partition networks based on topological features, optionally weighted by orthogonal node or edge data [1,2]. Another approach is to mathematically model networks and rely on their statistical properties to make associations with other networks,

phenotypes and drug effects, sidestepping the issue of making sense of the network itself altogether [3]. Acknowledging that there is still great value in engaging the minds of researchers in exploratory data analysis at the level of networks, we have produced a Cytoscape plugin called Mosaic [4] to support interactive network annotation and visualization that includes partitioning, layout and coloring based on biologically-relevant ontologies (Fig 1). The ultimate effect of Mosaic is to present slices of a given network in the visual language of biological pathways, which are familiar to any biologist and ideal frameworks for integrating knowledge.
Figure 1. Mosaic control panel, context menu and tiled result windows. The control panel shows both the color mapping legend and subnetwork display. Context menus for listed subnetworks allow the user to partition deeper within a given ontology branch.
While Mosaic can run using practically any annotation, the primary usage relies on ontology-based annotations, especially Gene Ontology. GO provides a controlled vocabulary of terms describing key characteristics of gene products (i.e., process, location, and function). Mosaic manages all identifier mapping and ontology annotation functions via integrated databases and CyCommand access to CyThesaurus. The program then proceeds to partition, layout and color the provided network. All subnetworks are listed hierarchically, including subnetworks that fall outside defined thresholds for display. Selecting a subnetwork in the control panel will bring it into focus in the tiled window view. Additional functions can be accessed by right-clicking on the name of a particular subnetwork in the control panel. In particular, "partition this network to one further level" allows users to interactively partition a huge network to deep levels of GO efficiently without generating hundreds of other subnetworks from parallel branches.
Applications This visualization approach is ideal for many types of ontology-based overrepresentation analyses. As such, we are now working on an ensemble of plugins to handle the complete pipeline from annotation to analysis to visualization. This is in collaboration with two new CSPs established during this reporting period. Through these collaborations and others we will publish
a series of reports on the applications of Mosaic and our integrated ontology analysis tools in Cytoscape during the next reporting period.
References 1. Bader, G.D. and Hogue, C.W. (2003) An automated method for finding molecular complexes in large protein interaction networks, BMC Bioinformatics, 4, 2. 2. Royer, L., et al. (2008) Unraveling protein networks with power graph analysis, PLoS Comput Biol, 4, e1000108. 3. Machado, D., et al. (2011) Modeling formalisms in Systems Biology, AMB Express, 1, 45. 4. Zhang C, Hanspers K, Kuchinsky A, Salomonis N, Xu D, Pico AR. Mosaic: Making Biological Sense of Complex Networks. Bioinformatics, 2012. (accepted with minor revisions)
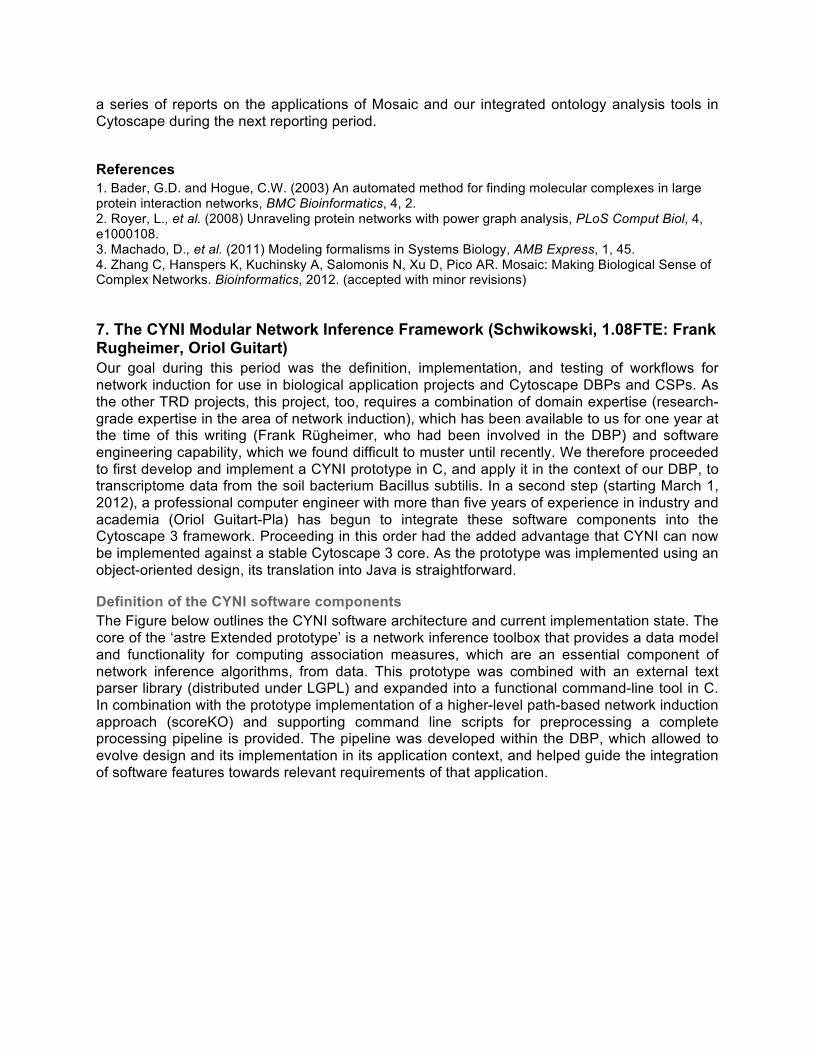
7. The CYNI Modular Network Inference Framework (Schwikowski, 1.08FTE: Frank Rugheimer, Oriol Guitart) Our goal during this period was the definition, implementation, and testing of workflows for network induction for use in biological application projects and Cytoscape DBPs and CSPs. As the other TRD projects, this project, too, requires a combination of domain expertise (research-grade expertise in the area of network induction), which has been available to us for one year at the time of this writing (Frank Rügheimer, who had been involved in the DBP) and software engineering capability, which we found difficult to muster until recently. We therefore proceeded to first develop and implement a CYNI prototype in C, and apply it in the context of our DBP, to transcriptome data from the soil bacterium Bacillus subtilis. In a second step (starting March 1, 2012), a professional computer engineer with more than five years of experience in industry and academia (Oriol Guitart-Pla) has begun to integrate these software components into the Cytoscape 3 framework. Proceeding in this order had the added advantage that CYNI can now be implemented against a stable Cytoscape 3 core. As the prototype was implemented using an object-oriented design, its translation into Java is straightforward.
Definition of the CYNI software components The Figure below outlines the CYNI software architecture and current implementation state. The core of the ‘astre Extended prototype’ is a network inference toolbox that provides a data model and functionality for computing association measures, which are an essential component of network inference algorithms, from data. This prototype was combined with an external text parser library (distributed under LGPL) and expanded into a functional command-line tool in C. In combination with the prototype implementation of a higher-level path-based network induction approach (scoreKO) and supporting command line scripts for preprocessing a complete processing pipeline is provided. The pipeline was developed within the DBP, which allowed to evolve design and its implementation in its application context, and helped guide the integration of software features towards relevant requirements of that application.

Figure 1. Current view of CYNI architecture and implementation.
astre Network inference toolbox In our prototype toolbox, Cytoscape node attribute tables are represented via feature vectors. Each feature vector represents a case that is described as a joint instantiation over an attribute set (e.g. time series for RNA expression levels for a given gene). Simple node association measures, such as correlation, are computed directly for pairs of feature vectors. Beyond that, additional support functionality for contingency tables, discretization and ranking, enables the implementation of more advanced measures that draw on robust statistics and information theory. Supported discretization/ranking mechanisms to-date:
● Standard ranking ● Fractional ranking ● Quantile-based binning
Supported association measures to-date: (values marked with * use contingency tables)
● Pearson correlation coefficient (numerical vectors only) ● Spearman rho rank correlation (ordinal scale or better) ● d2* (sum of element-wise squared deviation of contingency table from expected distribution under independence) (any type) ● Mutual information* (also Shannon information gain) (any type) ● Shannon information gain ratio* (any type) ● Kendall tau rank correlation* (ordinal scale or better)
The astre Network inference toolbox can be used either interactively or in batch mode. At startup the program reads an attribute value table that contains data to be used for computing interaction measures. In interactive mode the program will then continuously process queries for edge association measures and write output as is becomes available. This on-demand computation allows highly efficient heuristic search strategies. Alternatively, a predefined list of queries can be processed in batch mode. By restricting the selection of queries, it is possible to enforce structure constraints on the induced network.

astre also implements unit tests for critical data structures and the majority of implemented measures and discretization methods. As the unit tests can mostly be translated into Java in a straightforward way, they provide a defense against regression errors during the code refinement and optimization phase of CYNI development. For the same purpose, we conducted profiling runs and optimized a number of the core algorithms (initially planned for year 3). Converter scripts are provided to re-import the externally calculated results into Cytoscape for visualization and optional further processing. Sample workflow (compute association measures):
1. Load table data (e.g. expression matrix) into CLI tool and select suitable association measure
2. Generate queries and pass them to CLI tool to obtain association values or edges 3. Integrate association values into higher level network induction strategies
Implementation of the scoreKO approach In addition to simple co-expression networks, we implemented a prototype higher-level network induction component, which we developed in the context of a large integrated EU-funded research project. This prototype generates networks based on plausible chains of gene regulatory interactions that connect a selection of source nodes to targets nodes in the network (manuscript in preparation).
Figure 2. Illustration of prototype network induction component. From left to right: Network based on initial node association measures; Selected source nodes {A,B,C}; Selected target node {I}; Reduced network consisting of all interaction occurring on (near-) optimal interaction chains.
Feature export from CYNI to other modules Some CYNI elements share functionality with other Cytoscape plugins. In particular the symmetric association measures implemented (all but mutual information and mutual information gain) provide natural notions of similarity and can be used in tasks such as hierarchical clustering. The same holds true for symmetric versions of the information gain ratio, that can be produced e.g., by averaging the value obtained by for both possible link directions.[1] An interesting option, which we consider, is an interface to register, group and access implementations of similarity and distance measures as a useful approach to foster reuse and to prevent redundancy between Cytoscape plugins. We are currently in contact with other Cytoscape developers (e.g., of the ClusterMaker plug-in) to present a draft proposal for such an interface to the Cytoscape community. The export of discretization and ranking features could be organized in a similar way.
Current Activities, translation of astre into the Cytoscape 3 framework The arrival of a software engineer (Oriol Guithart) on March 1, 2012, marked the start of the CYNI implementation and integration of astre into Cytoscape. astre data structures and algorithms can largely be translated without modifications into Java/the Cytoscape framework.

In parallel, we continue to increase test coverage of the implemented algorithms and evaluate the addition/modification of features based on experiences in ongoing application projects.
Applications In our collaboration with the lab of Jan Maarten van Dijl (Groningen, Netherlands), this workflow was applied to a network (418 nodes; 174,306 edges) to explore the unknown chains of regulatory interactions between the central carbon metabolism and the competence subsystem of Bacillus subtillis. The approach identifies hypothetical regulatory chains from expression data, perturbation sites in the known regulatory network segment and a marker gene associated with the so-called competence phenotype. Suggested knockout targets were selected from candidate pathways identified by our network induction prototype. Currently, a subset of the proposed genes are evaluated in knock-out experiments to validate or their reject their involvement in the putative regulatory cascade, and to collect additional pertinent transcriptome data that may be fed back into our analysis.

II. Collaboration and Service Projects: Progress (1.3FTE: Alex Pico, Rintaro Saito, Kristina Hanspers) In addition to the direct impact of our TRD projects on our research, NRNB also has an effect on new science through our many CSPs. A description for each CSP is provided in the bulk of the report. Here, we summarize the efforts.
8. New Collaborations During our second year, we established a formal collaboration processing system for NRNB. Each of the 5 NRNB sites has a designated Collaboration Contact who is responsible for managing collaboration and service requests. They can start by directing potential collaborators to the main NRNB website at nrnb.org, where they will find numerous hooks into our collaboration system. Clicking on ‘Collaborate’ for example, leads to a simple web-based form, which is automatically logged in our Collaboration Tracker spreadsheet and email notifications are sent to the contact. Entries are assessed per the availability and interest of each group. If accepted, they are marked for entry into our annual reporting system. If not accepted, they are marked as rejected but still recorded for reporting purposes. Numerous potential collaborators also independently find the collaboration hooks on our website, such as the mentoring programs which bring in the largest numbers and some of the most diverse and productive collaborations (see below).
At the end of year-one, we had established close to 40 collaborations. During the course of our second year, we took on another 60, totaling 97 collaborations in all! These range from the application of Cytoscape as a research tool for network analysis and visualization, to the development of Cytoscape plugins for custom data types and analyses, to the development and application of other network and pathways tools and resources for network biology.
Applications of Cytoscape In this category, we are enabling a wide range of medical research applications [1-3] including the study of Frontal Temporal Dementia, Alzheimer’s disease, Diabetes, Anorexia nervosa, Glaucoma, Heart disease, Leukemia, Brain tumors, Autism, Prostate cancer, Breast cancer, Endometrial cancer, Colorectal cancer, Lung cancer, and Malaria. Through NRNB collaborations, Cytoscape is also being applied to study of the mechanisms [3,4] underlying inflammation, stem cell differentiation, B-cell differentiation, ciliogenesis, cell-cell communication, oxidative stress response, DNA repair, cancer stem cells, and wound healing, as well as general interactome, proteomics and metabolomics research [5,6].
Development of Cytoscape Plugins/Apps It is a testament to the extensible model of Cytoscape and our outreach efforts to provide training and documentation to developers, that we get an equal number of collaboration requests for developing new Cytoscape features, which in turn can be applied to not only our immediate collaborators’ research, but more broadly to the Cytoscape user community. This is a very gratifying virtuous cycle that NRNB is specifically enabling and amplifying. In this category, we have established collaborations to develop plugins and apps [7,8] to connect with public databases to access and load interactions and annotations, to provide new types of data visualizations, to perform ontology analysis, graph analysis, partitioning, quantitative modeling, and to handle new data types such as next-gen sequencing data and variant data. We also have collaborations to develop interoperability between Cytoscape and 3D molecular visualization tools, and integrated workbenches, such as the Cancer Gene Encyclopedia and the cBio Cancer Genomics Portal.

Development and Application of Other NRNB Tools and Resources In this final category of collaborations, we are beginning to extend beyond the immediate reach and scope of Cytoscape to identify complementary tools and resources that contribute significantly to network biology. NRNB allocates time and resources to promote and engage these other efforts, such as by making NRNB-funded network tools available within cBio, by coordinating the curation of biofuel pathways at WikiPathways, by adding network analysis functionality to Broad’s IGV (Integrative Genomics Viewer), and by promoting the use of BaSysBio (Bacillus Systems Biology) [9-11].
References 1. Liu JC, Voisin V, Bader GD, Deng T, Pusztai L, Symmans WF, Esteva FJ, Egan SE,Zacksenhaus E. Seventeen-gene signature from enriched Her2/Neu mammary tumor-initiating cells predicts clinical outcome for human HER2+:ERα- breast cancer. Proc Natl Acad Sci U S A. 2012 Apr 10;109(15):5832-7. Epub 2012 Mar 28. 2. Zhang L, Lim SL, Du H, Zhang M, Kozak I, Hannum G, Wang X, Ouyang H, Hughes G,Zhao L, Zhu X, Lee C, Su Z, Zhou X, Shaw R, Geum D, Wei X, Zhu J, Ideker T, Oka C, Wang N, Yang Z, Shaw PX, Zhang K. High temperature requirement factor A1(HTRA1) gene regulates angiogenesis through transforming growth factor-β family member growth differentiation factor 6. J Biol Chem. 2012 Jan 6;287(2):1520-6.Epub 2011 Nov 2. 3. Dutkowski J, Ideker T. Protein networks as logic functions in development and cancer. PLoS Comput Biol. 2011 Sep;7(9):e1002180. Epub 2011 Sep 29 4. Atwood A, DeConde R, Wang SS, Mockler TC, Sabir JS, Ideker T, Kay SA.Cell-autonomous circadian clock of hepatocytes drives rhythms in transcription and polyamine synthesis. Proc Natl Acad Sci U S A. 2011 Nov 8;108(45):18560-5.Epub 2011 Oct 31 5. Chuang HY, Hofree M, Ideker T. A decade of systems biology. Annu Rev Cell Dev Biol. 2010 Nov 10;26:721-44. Review 6. Diezmann S, Michaut M, Shapiro RS, Bader GD, Cowen LE. Mapping the Hsp90 Genetic Interaction Network in Candida albicans Reveals Environmental Contingency and Rewired Circuitry. PLoS Genet. 2012 Mar;8(3):e1002562. Epub 2012 Mar 15. 7. Aranda B, Blankenburg H, Kerrien S, Brinkman FS, Ceol A, Chautard E, Dana JM, De Las Rivas J, Dumousseau M, Galeota E, Gaulton A, Goll J, Hancock RE, Isserlin R, Jimenez RC, Kerssemakers J, Khadake J, Lynn DJ, Michaut M, O'Kelly G, Ono K,Orchard S, Prieto C, Razick S, Rigina O, Salwinski L, Simonovic M, Velankar S,Winter A, Wu G, Bader GD, Cesareni G, Donaldson IM, Eisenberg D, Kleywegt GJ,Overington J, Ricard-Blum S, Tyers M, Albrecht M, Hermjakob H. PSICQUIC and PSISCORE: accessing and scoring molecular interactions. Nat Methods. 2011 Jun 29;8(7):528-9. doi: 10.1038/nmeth.1637 8. Morris JH, Apeltsin L, Newman AM, Baumbach J, Wittkop T, Su G, Bader GD,Ferrin TE. clusterMaker: a multi-algorithm clustering plugin for Cytoscape. BMC Bioinformatics. 2011 Nov 9;12:436. 9. Buescher JM, Liebermeister W, Jules M, Uhr M, Muntel J, Botella E, Hessling B,Kleijn RJ, Le Chat L, Lecointe F, Mäder U, Nicolas P, Piersma S, Rügheimer F,Becher D, Bessieres P, Bidnenko E, Denham EL, Dervyn E, Devine KM, Doherty G,Drulhe S, Felicori L, Fogg MJ, Goelzer A, Hansen A, Harwood CR, Hecker M, Hubner S, Hultschig C, Jarmer H, Klipp E, Leduc A, Lewis P, Molina F, Noirot P, Peres S,Pigeonneau N, Pohl S, Rasmussen S, Rinn B, Schaffer M, Schnidder J, Schwikowski B, Van Dijl JM, Veiga P, Walsh S, Wilkinson AJ, Stelling J, Aymerich S, Sauer U. Global network reorganization during dynamic adaptations of Bacillus subtilis metabolism. Science. 2012 Mar 2;335(6072):1099-103. 10. Nicolas P, Mäder U, Dervyn E, Rochat T, Leduc A, Pigeonneau N, Bidnenko E,Marchadier E, Hoebeke M, Aymerich S, Becher D, Bisicchia P, Botella E, Delumeau O, Doherty G, Denham EL, Fogg MJ, Fromion V, Goelzer A, Hansen A, Härtig E,Harwood CR, Homuth G, Jarmer H, Jules M, Klipp E, Le Chat L, Lecointe F, Lewis P,Liebermeister W, March A, Mars RA, Nannapaneni P, Noone D, Pohl S, Rinn B,Rügheimer F, Sappa PK, Samson F, Schaffer M, Schwikowski B, Steil L, Stülke J,Wiegert T, Devine KM, Wilkinson AJ, van Dijl JM, Hecker M, Völker U, Bessières P,Noirot P. Condition-dependent transcriptome reveals high-level regulatory architecture in Bacillus subtilis. Science. 2012 Mar 2;335(6072):1103-6.

11. Kelder T, van Iersel MP, Hanspers K, Kutmon M, Conklin BR, Evelo CT, Pico AR. WikiPathways: building research communities on biological pathways. Nucleic Acids Res. 2012 Jan;40 (Database issue):D1301-7. Epub 2011 Nov 16.
9. Google Summer of Code and NRNB Academy In addition to the outreach effort described above, we also leverage a Google-sponsored program called Google Summer of Code (GSoC) to attract new developers for Cytoscape core, plugins/apps, WikiPathways, PathVisio and other tools we deem relevant to the NRNB mission. This year is the sixth year that Dr. Pico has coordinated the collective GSoC effort involving Cytoscape; this is the second year we’ve participated under the new banner of “NRNB”. Through the GSoC program we not only recruit new developers, but we are also significantly promoting NRNB as an open source-friendly organization, putting us in an exclusive list of ~175 organizations selected from around the world by Google to participate. Dr. Pico attends the annual GSoC Mentors Summit with other NRNB mentors to further engage the open source development community. In terms of collaborations, GSoC brings in new potential collaborators who want to participate as mentors in addition to the 40-60 student applicants. This year we coordinated 36 mentors (10 with NRNB funding), thus leveraging the effort of 26 additional developers from the open source communities surrounding NRNB-related tools. And through the GSoC program we received over 60 student applications this year. From these we’ve selected 16 students to mentor on Cytoscape and NRNB-related projects. The projects range from core Cytoscape 3.0, to Cytoscape 3.0 apps, to GeneMANIA and MedSavant, to PathVisio and WikiPathways, to the cBio Cancer Genomics Portal, but the majority of the projects are Cytoscape 3.0 related. Google is paying $5,000 per student, making their investment $80,000 in NRNB for 3 months of work. That’s what I call leveraging the community! Inspired by this very successful model for recruiting new code contributors, we designed and launched NRNB Academy in January of this year. The idea behind NRNB Academy is very similar to GSoC, except it’s not restricted to students, it’s not affiliated with Google, and it’s 100% volunteer. Our experience has been that the major draw to our projects in the past has been the opportunity to get direct mentorship in developing Cytoscape and our other tools. The students and external mentors are eager to contribute time and effort when they know it will be guided and effectively amplified by the interaction with NRNB, thus dramatically increasing the odds for a productive output. In the first three months, we have already received 9 applications, started 4 new projects, and recruited 3 new mentors. We anticipate continued growth of this program as word spreads. One of the principal goals of NRNB is to promote and enhance the development community around Cytoscape. The new NRNB Academy program gives us one more way to reach out to the community and realize this potential. Based on our experience so far, this program is effective in launching new developers and in establishing new collaborations with long-term potential.
III. Progress on Supplemental Award, 11/2011-07/2013 We were awarded a two-year supplemental grant to work on the Cytoscape App Store. This is a progress report on the first half of the first year.
10. The Cytoscape App Store (Pico, 1.0FTE: Samad Lotia) The Cytoscape App Store will offer a whole new way for researchers to search, install and develop custom apps for Cytoscape. Much of the Cytoscape App Store content will be created by its users: ratings, comments, tags and the submission of new apps. Dynamic web sites like the Cytoscape App Store often make use of a web framework to manage frequent changes. First, the web site puts all of its content in a database, because databases make it easy and fast to get the content back later. The web site code retrieves the content from the database. It then processes the content and sends the user HTML, image, CSS, and JavaScript files, which are shown in the user's web browser. At each step the web framework is involved in the web site's code.
The Cytoscape App Store uses the Django web framework, which is written in Python making it concise, versatile, and familiar. As a popular framework in the web development community, Django also has many online forums with experienced developers willing to answer technical questions. Django developers also have made a variety of software extensions that provide additional functionality relevant to our App Store plans. Beyond the web framework, we are using the MySQL database due to its ubiquity in web development. We make extensive use of the jQuery library in JavaScript, a programming language that adds interactivity to web pages. We also pervasively use the Twitter Bootstrap CSS library to provide a consistent and professional-quality look to the web site.
Together, these technologies enable a rich set of features (Figure 1). Everything from keyword search with auto-completion and dynamic navigation through tag lists and tag clouds, to the display of interactive app buttons with icons, brief descriptions and ratings. Clicking on an app button takes you to the corresponding app page where you’ll find a full description of the app along with screenshots, version and author information, links to source websites and tutorials, and a comment section for reviews, questions and bug reports. We are currently implementing a “one-click install” feature on each app page that will allow users to install apps from the website to any instance of Cytoscape 3.0+ that they have running. The submission of new Cytoscape apps is also handled directly by the App Store. Simply sign in (you can use an existing Google account), click “submit a new app”, upload your .jar file, then interactively edit the app page as it will appear to other users.

Figure 1. Screenshots of Cytoscape App Store. The top screenshot is of the main page, showing navigation tools on the left and two columns of app buttons (with icons, names and brief descriptions). The first app, MetaNetter, is moused-over and expands to show ratings, number of download and tags. The bottom screenshot show the app page for MetaNetter with screenshots, full description, version details and the “one-click install” option.
This project will completely replace the existing Cytoscape plugins web page in the next month or two when we roll out the 2.x version of the site. Then, in conjunction with the public

release of Cytoscape 3.0, we will update the site with the 3.x-specific features like “one-click install”.
One of the main goals of NRNB is to actively engage developers and researchers. Ultimately, we can provide better tools and resources by facilitating participation by the greater community and not discounting the sum of thousands of small contributions. This model is extensible beyond the Cytoscape project and could support software-as-a-service distribution. As NRNB broadens its scope in future years, this app-centric, community-based model can be cloned for other tool and resource projects.
Applications Presently, the community is limited in how it can contribute to improve and build upon Cytoscape. Recent developments in crowdsourcing technology and social structures and processes have enabled public software projects to engage vastly more users. These advances promise to take Cytoscape community support to the next level. Just as Cytoscape’s open source extensible software architecture has enabled a rich community of app developers to flourish, crowdsourcing technology will enable users to contribute to software testing, documentation updates, app creation, data set curation, workflow sharing and more. The crowdsourcing infrastructure we are proposing will not only reach out to users and developers of apps, but also to external data sources (e.g., Sage Commons, Pathway Commons) and other data-centric research tools (Taverna, Genome Space) through web service and format standards tailored for the web. Advances in web technologies and broadband connections are allowing more data and computation to migrate to the “cloud” while user-friendly data mining and analysis tools are enabling more researchers to access these resources. Online representations of Cytoscape apps will become hubs for groups of researchers to connect to data resources, analytical methods and relevant results.

Appendix A. The 2012 NRNB Network
A network representation of all NRNB personnel and collaborators (blue circles), all TRD, DPB, Collaboration, and Service projects (orange diamonds), and associated publications (green triangles). Node size is proportional to the number of connections. Thick red borders indicate personnel and projects directly funded by the NRNB P41 grant. There are 315 nodes and 404 connections in the network. NRNB funds 41 (13%) of these nodes, which make 217 (54%) of the connections.

Annual Progress Report - Research Highlights 2012 National Resource for Network Biology
P41 GM103504 (RR031228) 05/01/2011 - 04/30/2012
Contents ● NRNB Supports Development of cBio Cancer Genomics Portal ● Cytoscape 3.0 and the Cytoscape App Store in 2012 ● NRNB Academy Is Now Accepting Applications
NRNB Supports Development of cBio Cancer Genomics Portal The National Resource for Network Biology is proud to support the cBio Cancer Genomics Portal (www.cbioportal.org), which has become a major resource for cancer genomics research both within the TCGA and within the broader cancer research community. Since the launch of the network analysis features in November 2011, the Portal has had 6,306 unique visitors, and has served up over 275,000 page views. The cBio Portal was also recently highlighted in The Scientist, as “a user-friendly site for working with data from TCGA and other data sets” [1]. The article points out the easy-to-use and valuable network and pathway visualization capabilities:
Just enter your gene—say, Trim2—in the gray field and click Submit. After you select the tumor type and click View Cancer Study Details, you can review the network of known gene interactions and pathways involving the gene under the Network tab. You can mouse over a gene, represented as a node, to see a color-coded wheel summarizing its mutation, expression, and copy number status.
Bringing network perspectives to critical data sets is a shared goal of the cBio project and NRNB. 1. Storrs C: Combing the Cancer Genome. The Scientist 2012, Mar.
Cytoscape 3.0 and the Cytoscape App Store in 2012 A primary goal of NRNB is to amplify and propagate the community development model of Cytoscape. Cytoscape is a core research tool that is used and/or developed by almost every project and collaboration engaged by the NRNB. We are developing version 3.0 of Cytoscape, which represents a marked evolution of our architecture designed to modularize the core of Cytoscape, define a clear and consistent API, and simplify the experience of customizing Cytoscape. The 4th milestone release and the first beta release of the API will be available at the end of May 2012. The beta API release is the point at which we expect external developers to be able to comfortably port their plugins without having to make significant changes before the final 3.0 release. Some of new features included in 3.0 include a quick-start welcome screen that provides simple mechanisms for loading networks and attributes, a simplified user interface, and many small improvements such as edge bundling layout.
The Cytoscape App Store will open with the release of Cytoscape 3.0 and offer a whole new way for researchers to search, install and develop custom extensions to Cytoscape. As

extensions are ported from older versions or developed anew for 3.0, they will be rebranded as apps to acknowledge the shift in the underlying technology and in our focus on these customizations as the primary drivers for Cytoscape’s success and its future relevance and impact. The Cytoscape App Store will manage the submission of new apps, generating a suite of unique content and functions around each app to support community reviews, ratings, comments, as well as “one-click install” and a variety of navigational tools.
In conjunction with the Cytoscape App Store, the 3.0 of Cytoscape release will further accelerate the recognition, adoption and customization of the Cytoscape platform by the network biology research community.
NRNB Academy Is Now Accepting Applications Taking on a new approach to outreach and training, we launched NRNB Academy in January, 2012. NRNB Academy offers software developers from around the world the opportunity to work with our open source development team on network biology related tools and resources. The program provides a framework for training with a list of starter projects and a host of mentors to be paired with new developers. It is completely volunteer-based and offers participants flexible project terms. The main goals of the NRNB Academy are:
○ To promote development of scientific tools for network biology ○ To offer participants practical open source dev experience ○ To produce useful tools and resources for the research community
More information about potential projects and the application process is available at nrnb.org/academy. In the first three months, we received 9 applications, started 4 new projects, and recruited 3 new mentors for our Google Summer of Code effort. We anticipate continued growth of this program as word spreads. One of the principal goals of NRNB is to promote and enhance the development community around Cytoscape. The new NRNB Academy program gives us one more way to reach out to the community and realize this potential. Based on our experience so far, this program is not only effective in launching new developers, but also in establishing new collaborations with long-term potential.

Annual Progress Report - Administrative Information 2012 National Resource for Network Biology
P41 GM103504 (RR031228) 05/01/2011 - 04/30/2012
Administrative Structure During the first year, we defined the administrative structure of the resource, including some unique new roles within the organization. The roles of Principal Investigator (PI), Co-PI, External Advisory Committee (EAC), Resource Administrator and Chief Software Architect were defined as in the original grant. We defined a new role of Executive Director (ED) to oversee some of the new resource functions that NRNB provides, including Training & Outreach, Communications and Infrastructure. The ED (Alex Pico, Gladstone Institutes) is responsible for coordinating these efforts as well as conducting all of the necessary tracking and due diligence for the annual reporting to NIH. During the second year, we defined the new role of Collaboration Coordinator to screen and process collaboration requests to our resource. This has been a vital role in supporting the 60+ new collaborations in year two. Finally, we were very pleased to have all seven invited members promptly agree to join and attend our first EAC meeting last summer, including Dr. Stephen Friend as chair of the committee. Budget changes between years 1 and 2 were minimal, with a few exceptions. In Figure 1A, you will notice an increase overall due mainly to annual cost-of-living raises for personnel in each of the 3 budget categories: PIs, TRDs and Staff. The one main exception is the new staff position for Collaboration Coordinator created in year 2 (Fig 1A, red, circled). A B
Figure 1. Budget graphs. Area charts showing the distribution of funds for years 1 and 2 (x-axis) per category (A) and per group (B). Y-axis is in units of $1,000s of US dollars. Each stripe corresponds to an individual with a specific role in NRNB, totaling just over 7 FTEs. Note that groups are sorted by degree of change, which is critical in this style of visualization to minimize misperception of change when slopes are actually parallel.

In panel B of figure 1, you will notice slight increases from raises, except where countered by a decrease in FTE (e.g., Fowler). More significant increases Conklin and Ideker budgets are due to increased TRD support for the Conklin group (which needed correction after new ED and Communications Coordinator staff roles were defined and not originally budgeted for) and to the new role of Collaboration Coordinator in the Ideker group (same as in panel A). As the basis for the graphs above, here are itemized tables of FTEs and funding for both years 1 and 2 (Table 1).
FTEs $1,000s Roles and Groups Year 1 Year 2 Year 1 Year 2 Collaboration Coord. 0.00 0.50 0 50 Resource Admin. 1.00 0.56 52 38 Chief Architect 0.40 0.40 47 51 TRD-Ideker 0.50 0.50 40 45 PI-Ideker 0.30 0.30 74 78 Communications Coord. 0.30 0.30 29 29 Executive Director 0.50 0.50 56 56 TRD-Conklin 0.20 0.48 21 39 PI-Conklin 0.02 0.02 5 5 TRD-Sander 0.65 0.65 90 97 PI-Sander 0.02 0.02 5 5 TRD-Bader 1.00 1.00 90 93 PI-Bader 0.10 0.10 0 0 TRD-Schwikowski 1.00 1.08 81 83 PI-Schwikowski 0.08 0.08 0 0 TRD-Fowler 1.00 0.72 58 54 PI-Fowler 0.10 0.10 21 26 SUBTOTAL 7.17 7.32 669 750 Supplement-Ideker 0.00 0.40 0 45 Supplement-Conklin 0.00 1.00 0 85 Supplement-Bader 0.00 0.40 0 45 SUBTOTAL 0.00 1.80 0 175 GRAND TOTAL 7.17 9.12 669 925
Table 1. NRNB effort and budget. Annual budgeting of FTEs and $1,000s, itemized by roles and groups. Subtotals are provided for the main grant and supplemental funding (bold). Allocation of Resource Access Beyond the active distribution and support of Cytoscape, which is covered in later sections, NRNB resource allocation can be categorized in the following way:
1. On-site training events: NRNB staff have participated in 20 training events during the reporting period, up from just 7 last year. These events include tutorials, workshops and courses.
2. Requests for collaboration and mentorship: This year we ramped up our responsiveness to requests for collaboration by designation Collaboration Czars at each NRNB site and funding a Collaboration Coordinator position to oversee the processing of

collaboration requests. With a 277% increase in established collaborations (from 35 to 97), we are confident our new strategies are working. Many of these collaborations are coming through our participation in Google Summer of Code (GSoC) and our own NRNB Academy efforts (see #3). All told, we rejected 43 requests during this same time period; 39 of these were students through GSoC.
3. Google Summer of Code and NRNB Academy: In addition to receiving requests from potential students through these programs, we also receive requests from a number of groups to join our organization as mentors. This brings new technology and ideas to our effort. GSoC has been our most successful outreach program by far. It’s responsible for 25% of all our NRNB collaborations (24 out of 97). And by the website traffic report below (Fig. 2), you can also see that it is the most active time period for use of NRNB.org online resources, getting NRNB broad exposure in the open source community. Building on the success of this model, we launch NRNB Academy in January of this year. Our Academy follows the same approach as GSoC, organizing around available mentors, ideas and interested students. However, we are not restricted to supporting university students in our program as it is independent of GSoC and 100% volunteer based. The Research Progress and Highlights provide more details.
4. Requests for training material support: We receive requests for tutorial materials throughout the year from inside and outside the Cytoscape core development team. Our homegrown Open Tutorials system makes it easy to accommodate all such requests. Open Tutorials is an easy-to-use wiki system that provides content formatted to be used as online sessions, slide shows and printed handouts. This year we are seeing more content from more contributors, in addition to a steady rise in visitors (see details in the Training section below).
5. Providing software community support: Our goal is to develop a generic template of services based on the support we provide the Cytoscape community of users and developers. So far we have extended support to two additional software projects, internal to NRNB PI sites: WikiPathways and cBio Cancer Genomics Portal. These proven resources complement Cytoscape and help demonstrate the broader scope of the NRNB mission. We are providing distribution links, showcases, tutorial support, news and event tracking, and GSoC and NRNB Academy participation to these projects.
Awards and Honors None Dissemination We averaged just over 23,000 visits per month (304,000 total visits) to the Cytoscape website during this reporting period (8% increase over last period). An additional 28,000 visits were made to Open Tutorials and another 17,000 visits were logged at the NRNB website during the reporting period (350% and 120% increases over last period, respectively). The front page of the NRNB website now includes a video presentation introducing NRNB. A new Showcase page displays graphical highlights of common workflows involving NRNB tools. The Training page is regularly updated with information on current training events and also includes a full listing of courses relevant to NRNB tools. But based on the analytics report, it is clear that the dominant activity on the site relates to our outreach and collaboration through Google Summer of Code (Fig 2).

Figure 2. A plot of daily visits since the launch of the NRNB website, December 2012 - April 2012. Notice the dramatic spikes in activity during the GSoC application weeks at the end of March and beginning of April. A key statistic in terms of dissemination is number of software downloads. Currently, the primary software offered and supported by NRNB is Cytoscape and its suite of plugins. We have seen consistent activity over the past 12 months averaging close to 5,000 downloads per month for the Cytoscape distribution (Fig. 3).
Figure 3. Chart of Cytoscape software downloads per month over the past 12 months.
We are sustaining the increase in downloads that we experienced last year, and see this period as the “calm before the storm.” With the anticipation for the Cytoscape 3.0 release and the exciting plans around the new Cytoscape App Store, these numbers are sure to take on a new growth curve before the next report.
We also make researchers aware of our tools and services through the many conferences our representatives attend. For example, the NRNB will have a major presence at the Annual International Conference on Intelligent Systems for Molecular Biology (ISMB 2012), which will be held in Long Beach, California. ISMB has become the largest conference on computational biology worldwide. This year over 1500 attendees are expected. As part of this meeting, we are organizing the second annual Network Biology Special Interest Group (NetBio SIG) meeting dedicated to network biology tools, resources and research applications. NRNB tools are also represented in the research literature through our development and research publications. Numerous Cytoscape plugin articles and research articles using Cytoscape are published annually: 309 during this report period alone (HighWire search). We have a review article currently under revision that covers all submitted Cytoscape plugins. We will follow that

up with a paper introducing Cytoscape 3.0 and another introducing the Cytoscape App Store, both scheduled for release in 2012. Finally, most visibility for our software arguably comes from our consistent dedication to an “open source” policy. Our open-source license allows us to easily disseminate our software code through public repositories (Sourceforge, code.google, self-hosted servers) and participate in social networks in support of code development (Ohloh). We take very seriously our active participation and cultivation of an open development community. This should not be taken for granted. Many academic software projects suffer from relatively short cycles of commitment from graduate students and postdocs progressing through their careers. The open source model offers a means to develop software inclusively and sustainably. We have worked hard to build, develop and maintain this community. The benefits are a sustained project that continues to grow and to stay relevant. It also instills confidence in potential contributors as well as users that their work will be acknowledged and that the product will persist and remain free and open. It is through the software development community that Cytoscape maintains its most ardent evangelists, presenting new functionality at their home institutions and through conferences and publications. Patents, Licenses, Inventions, and Copyrights None. We are committed to an Open-Source dissemination policy. Training and Outreach Annual Cytoscape Retreat We are just beginning to plan this year’s annual Cytoscape Retreat and Symposium, hosted by the National Resource for Network Biology (NRNB) at the Gladstone Institutes on the UCSF Mission Bay campus in San Francisco. In addition to developer meetings, the retreat will include user and new developer tutorials, a Plugin Expo, and a special symposium. This year we will be able to shift the bulk of development discussion to Cytoscape 3.0 core and apps, including assessment of our new App Store web site and services. Workshops For the reporting period, NRNB has participated a total of 20 training events in 7 countries. These events include tutorials, workshops and courses. Cytoscape is taught in many classroom and workshop settings. We try to track all of these on our website and Event Tracker. We’ve identified 32 courses offered in the 2011-2012 calendar year! And these are just the ones affiliated with NRNB staff. Open Tutorials Our tutorial management system, Open Tutorials, is still the main source for tutorial materials for the Cytoscape project, and is being used both internally by presenters, and by researchers and developers. We have seen a steady increase in visits to Open Tutorials over the last year, with an average of 2,700 visits per month for the last three months. The increase in traffic can partly be explained by the addition of 12 new editors in the last year, contributing to several new tutorials. Most of the development was focused on a set of 4 developer tutorials for Cytoscape 3.0, which will be critical for continued momentum on Cytoscape 3.0 development. Overall, Open Tutorials has allowed NRNB to reach our goal of providing tutorial support to a broad and diverse community. Helpdesk A major means of support for NRNB tools is through dedicated helpdesk and discussion mailing lists. We began monitoring the activity of these lists last year for the Cytoscape community as
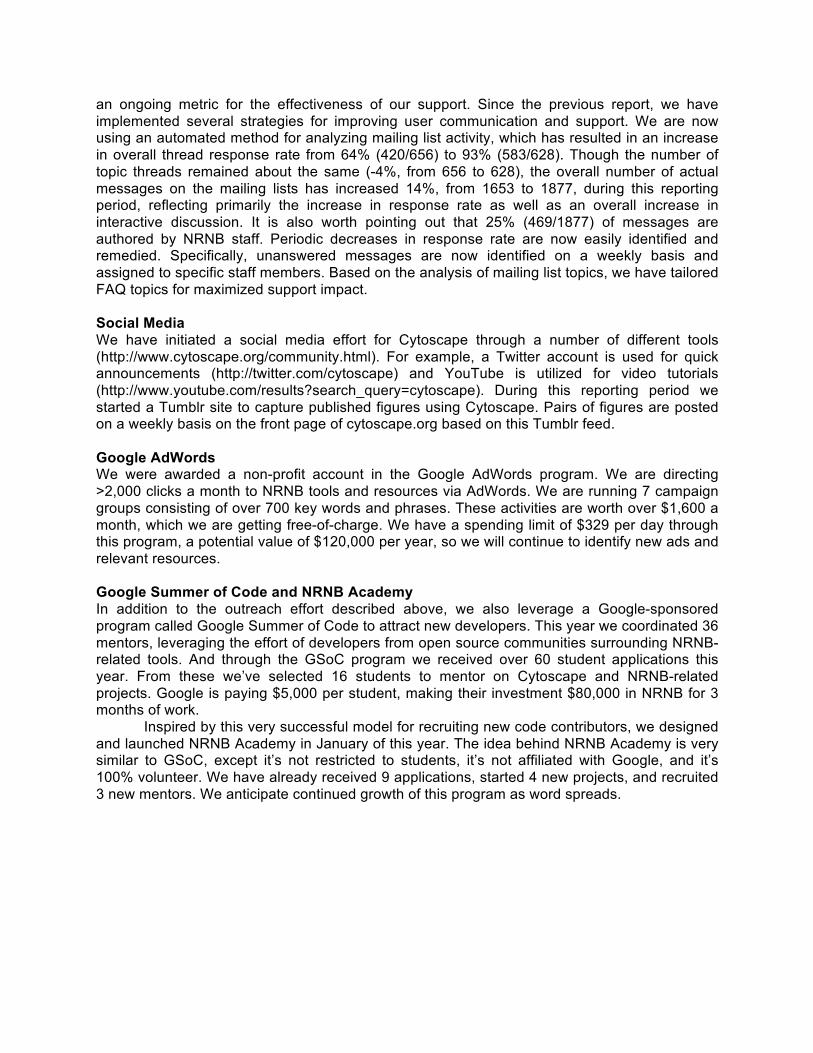
an ongoing metric for the effectiveness of our support. Since the previous report, we have implemented several strategies for improving user communication and support. We are now using an automated method for analyzing mailing list activity, which has resulted in an increase in overall thread response rate from 64% (420/656) to 93% (583/628). Though the number of topic threads remained about the same (-4%, from 656 to 628), the overall number of actual messages on the mailing lists has increased 14%, from 1653 to 1877, during this reporting period, reflecting primarily the increase in response rate as well as an overall increase in interactive discussion. It is also worth pointing out that 25% (469/1877) of messages are authored by NRNB staff. Periodic decreases in response rate are now easily identified and remedied. Specifically, unanswered messages are now identified on a weekly basis and assigned to specific staff members. Based on the analysis of mailing list topics, we have tailored FAQ topics for maximized support impact.
Social Media We have initiated a social media effort for Cytoscape through a number of different tools (http://www.cytoscape.org/community.html). For example, a Twitter account is used for quick announcements (http://twitter.com/cytoscape) and YouTube is utilized for video tutorials (http://www.youtube.com/results?search_query=cytoscape). During this reporting period we started a Tumblr site to capture published figures using Cytoscape. Pairs of figures are posted on a weekly basis on the front page of cytoscape.org based on this Tumblr feed. Google AdWords We were awarded a non-profit account in the Google AdWords program. We are directing >2,000 clicks a month to NRNB tools and resources via AdWords. We are running 7 campaign groups consisting of over 700 key words and phrases. These activities are worth over $1,600 a month, which we are getting free-of-charge. We have a spending limit of $329 per day through this program, a potential value of $120,000 per year, so we will continue to identify new ads and relevant resources. Google Summer of Code and NRNB Academy In addition to the outreach effort described above, we also leverage a Google-sponsored program called Google Summer of Code to attract new developers. This year we coordinated 36 mentors, leveraging the effort of developers from open source communities surrounding NRNB-related tools. And through the GSoC program we received over 60 student applications this year. From these we’ve selected 16 students to mentor on Cytoscape and NRNB-related projects. Google is paying $5,000 per student, making their investment $80,000 in NRNB for 3 months of work. Inspired by this very successful model for recruiting new code contributors, we designed and launched NRNB Academy in January of this year. The idea behind NRNB Academy is very similar to GSoC, except it’s not restricted to students, it’s not affiliated with Google, and it’s 100% volunteer. We have already received 9 applications, started 4 new projects, and recruited 3 new mentors. We anticipate continued growth of this program as word spreads.

Annual Progress Report - Advisory Committee 2012 National Resource for Network Biology
P41 GM103504 (RR031228) 05/01/2011 - 04/30/2012
At the conclusion of our first year, we scheduled the first External Advisory Committee (EAC), which took place May 19th, 2011. We were very pleased to have all seven invited members promptly agree to join our EAC and attend the first meeting. Dr. Stephen Friend serves as chair of the committee. Following the list of committee members below are the summary statements provided by the EAC. Committee Members: ● Stephen Friend, M.D, Ph.D. is President, Co-Founder and Director of Sage Bionetworks. He
was previously Senior Vice President and Franchise Head for Oncology Research at Merck & Co., Inc.
● David Hill, Ph.D. is Associate Director of the Center for Cancer Systems Biology at the Dana-Farber Cancer Institute where he is also co-leader of the Pathogen Host Interactomes group.
● Tamara Munzner, Ph.D. is Associate Professor in the Department of Computer Science at the University of British Columbia and is a member of the IMAGER Graphics, Visualization and HCI research group.
● Nicholas Schork, Ph.D. is Director of Biostatistics and Bioinformatics at the Scripps Translational Science Institute and Professor in the department of Molecular and Experimental Medicine at the Scripps Research Institute.
● Gustavo Stolovitzky, Ph.D. is Manager of the Functional Genomics and Systems Biology group at the IBM Computational Biology Center. He is a Fellow of the American Physical Society, a Fellow of the New York Academy of Sciences, and an adjunct Associate Professor at Columbia University.
● Marian Walhout, Ph.D. is Associate Professor at the University of Massachusetts Medical School in the program of Program in Gene Function and Expression.
● Steve Laderman, Ph.D. is the Director of the Molecular Tools Lab at Agilent Technologies, Inc.

Summary Statements From the First External Advisory Committee May 19, 2011
San Diego, CA
TRDs and DBPs David Hill DFCI/Harvard The NRNB Technology Research and Development Projects Each of the TRDs is successfully using existing Cytoscape tools as well as developing new features to address important questions in network biology, and an intriguing application of Cytoscape by the TRDs is in the social networking arena. The current efforts of all the TRDs emphasizes the fact that Cytoscape has become the premier software for data visualization as the TRDs are each using different features of Cytoscape for their projects. The ability to integrate diverse data sets is key to Cytoscape maintaining a pre-eminent position, and several of the TRDs have made effective use of dataset integration. While network visualization has been the hallmark of Cytoscape, visualization alone is insufficient for decision-making, and visualization can lead to erroneous conclusions/decisions without readily available statistical analysis (including randomizations) and background annotation to support nodes in the networks. For next year, it will be helpful to see a comparison of all of the various tools applied to any one TRD project in order to show how meaningful results can be obtained using judicious application of the correct set of tools and justify continued development of new tools. As a way to demonstrate how Cytoscape provides “value added”, it would be useful to know that results obtained using the full spectrum of Cytoscape features are at least comparable to those obtained using standard statistical packages first. Basically, how is Cytoscape poised to move from being an effective and efficient visualization tool to a more robust decision-making tool that is superior to or more efficient than existing systems such as MatLab? We are willing to serve as an alpha or beta test site for data integration and novel visualizations as well as testing plug-ins for statistical analysis coupled to visualizations.
Cytoscape 3.0 progress Gustavo Stolovitzky IBM Computational Biology Center Progress in Cytoscape 3.0 There was a discussion on the issue of backwards compatibility. There is a strong pressure from users to have every feature of Cytoscape backwards compatible. However, many of the

2.x APIs are messy and hard to make backwards compatible. This is in part due to the fact that every time an API was faced with restrictions, developers used a workaround to achieve their goals. Version 3.0 should face less problems with backwards compatibility in the future due to the improvements in modularization. A few criteria were discussed to ameliorate the task of making 3.0 backwards compatible. 1) Have a log of the most used (e.g., most downloaded) plugins and make these backwards compatible. 2) Ask the developers to contribute with backwards compatible code. 3) Crowdsource the writing of code that keep the plugin updated. 4) Write a tutorial for developers. There were a number of ideas to improve recognition to Cytoscape by its users in the form of citations. The issue is important as a way to report back to NIH how effective the NRNB is in meeting its goals. Some items that surfaced in the discussion are discussed below. 1) It was recognized that many publication have used Cytoscape, yet Cytoscape was not cited in the publication. To gain some recognition from already published papers, some manual surveillance of the existing network biology literature has been done, and should continue. 2) There is nothing wrong in requesting researchers to cite Cytoscape. For example, a phrase on the Cytoscape website front page could read Citing Cytoscape helps us help you! 3) To encourage people to cite Cytoscape, the idea of featuring papers that use Cytoscape on the website. To implement this, researchers could submit their papers to the NRNB and we will highlight their work. Alternatively, just a “blog roll” showing authors (citations) of submitted papers could be featured in the NRNB website.
Collaboration Training and Support Component Nicholas J. Schork The Scripps Research Institute The NRNB has established itself as a leader in the dissemination and scientific exposure of network biology tools, algorithms and ideas. This will likely continue to be the case in the foreseeable future given the exemplary NRNB team and leadership. There are a few areas, however, that the NRNB team should consider in moving their resource forward. These areas may simply benefit from greater emphasize rather than a complete revamping. First, it is important to establish a mechanism (possibly formal) for vetting various collaborations given that there are only finite resources available for dedicated use for any one project. Using an internal committee and then having the executive committee consider the protocol was discussed as a possibility. Second, determine, to the degree possible, if Cytoscape is and can be incorporated into formal undergraduate and graduate classroom settings for training. This is clearly going on at UCSD for some courses, but exploring this opportunity generally may result in great exposure/adoptability of the tools and allow for critical feedback as to Cytoscape-related tools’ ease of use and limitations among next-generation biologists. Third, develop metrics for assessing the impact that Cytoscape has on research and research training. For example, how

many trainees have gone on to positions for which network science is their emphasis? How many grant proposals have been submitted and funded as a result of pilot studies with the Cytoscape team? Although efforts are being made to track publications via acknowledgements of the Cytoscape tools, this has proven difficult given that not everyone ultimately acknowledges the use of the tools. Additional metrics may be of benefit in assessing the return on investment as a result. Fourth, importantly, more collaborations with theoreticians/modelers in network science should be pursued. The applications-oriented collaborations are exemplary, but collaborations regarding, e.g., network controllability/key driver analysis, connectivity metrics, visualization schemes, etc. may benefit the development of the actual tools to be made available to the Cytoscape user community. Some add-ons and macros developed by the user community are obviously available, but making aspects of this work core Cytoscape collaborations would arguably be of great benefit. Fifth, new computing environments at the SDSC are being developed (e.g., DASH and GORDON) which may be value in the NRNB mission.
Policy and Management Marian Walhout University of Massachusetts It was discussed that simply tabulating citations to the original Cytoscape paper (Shannon et al., Genome Research 2003, PMID: 14597658) does not accurately reflect the impact of the tool on Systems Biology at large and Network Biology in particular. Several potential solutions were discussed: i) adding a watermark to Cytoscape-generated images; ii) including a phrase on the Cytoscape website to remind researchers about the importance of citing original papers; iii) offering a “wall of names” in which papers using Cytoscape will be featured which will provide researchers with additional visibility. This would require citing the original paper. A second topic of discussion was about the balance between TRD and CSP support in the allocation of budget and resources – what is it currently, and what should it be in the future? It will be important in the next NRNB meeting in 2012 to highlight what is involved in being a CSP, and how their science benefits measurably and directly from support from the NRNB. A dedicated FTE, or part thereof, with a broad knowledge of network biology is desired to evaluate CSP requests. It is recommended to generate a FAQ online for interested researchers regarding the requirements, resources, deliverables and success rate. A survey that measures the impact of CSPs on the projects of individual researchers was also suggested. Finally, the idea of a network biology course (e.g. at CSH) was mentioned, which could incorporate both experimental and computational network science. This would be a format to disseminate Cytoscape and related tools in a hands-on manner. Finally, it was mentioned that it is critical to interface with scientists that want to use networks but also with those that are true network biologists and/or graph theorists.

Suggestions for next year's EAC: requested items and how to organize for our review Tamara Munzner University of British Columbia This year's report is structured around the science done by the PIs. While it nicely illustrates that some beautiful science was done and that the PIs have a great publication record, it does not clearly articulate exactly how the funding for this national resource enabled new science (both from the PIs and from others). Future reports should be structured primarily around the specific new tool/resource capabilities created, the work directly done by the FTEs supported by this funding, and the work by others that is leveraged or facilitated by directly funded FTEs. The reports should secondarily discuss what new science was enabled by these efforts at three levels: the focused PI/TRD level, the middle CSP level, and the broad general community level. The report should also clearly discuss resource allocation between these three constituencies, including a concise high-level budget summary (only a few pages). The NIH representative Olga Brazhnik has confirmed that there is no need to rewrite this year's report in the new format, but we suggest that creating a short slide deck describing the next year's plan in terms of this reporting framework could be a useful kickstarter. Finally, the EAC meeting should happen before the final report is due (at least one month in advance), so that feedback from EAC can be incorporated into it. The full draft report should be distributed to EAC members at least one week in advance. All EAC members have agreed that subsequent meetings should be one full day rather than the initial half-day length. Finally, there was concern that the current report only mentioned one DBP, future reports should connect the scientific agenda to most or all of the original five DBPs. There was also concern that each TRD currently appears to use a completely different set of tools, ideally new capabilities would crosscut to support more than a single scientific problem (at either the DBP, TRD, CSP, or broad community levels).