Embed Size (px)
Citation preview

8/4/2019 NRL Report
http://slidepdf.com/reader/full/nrl-report 1/154
••• •••
June 2002 • NREL/TP-510-32438
Lignocellulosic Biomass toEthanol Process Design andEconomics Utilizing Co-Current
Dilute Acid Prehydrolysis andEnzymatic Hydrolysis for Corn Stover A. Aden, M. Ruth, K. Ibsen, J. Jechura,K. Neeves, J. Sheehan, and B. WallaceNational Renewable Energy Laboratory
L. Montague, A. Slayton, and J. LukasHarris GroupSeattle, Washington
National Renewable Energy Laboratory
1617 Cole BoulevardGolden, Colorado 80401-3393
NREL is a U.S. Department of Energy LaboratoryOperated by Midwest Research Institute • Battelle • Bechtel
Contract No. DE-AC36-99-GO10337
8/4/2019 NRL Report
http://slidepdf.com/reader/full/nrl-report 2/154
••• •••
June 2002 • NREL/TP-510-32438
Lignocellulosic Biomass toEthanol Process Design andEconomics Utilizing Co-Current
Dilute Acid Prehydrolysis andEnzymatic Hydrolysis for Corn Stover A. Aden, M. Ruth, K. Ibsen, J. Jechura,K. Neeves, J. Sheehan, and B. WallaceNational Renewable Energy Laboratory
L. Montague, A. Slayton, and J. LukasHarris GroupSeattle, WashingtonPrepared under Task No. BFP2.A410
National Renewable Energy Laboratory
1617 Cole BoulevardGolden, Colorado 80401-3393
NREL is a U.S. Department of Energy LaboratoryOperated by Midwest Research Institute • Battelle • Bechtel
Contract No. DE-AC36-99-GO10337

8/4/2019 NRL Report
http://slidepdf.com/reader/full/nrl-report 3/154
NOTICE
This report was prepared as an account of work sponsored by an agency of the United Statesgovernment. Neither the United States government nor any agency thereof, nor any of their employees,makes any warranty, express or implied, or assumes any legal liability or responsibility for the accuracy,completeness, or usefulness of any information, apparatus, product, or process disclosed, or representsthat its use would not infringe privately owned rights. Reference herein to any specific commercialproduct, process, or service by trade name, trademark, manufacturer, or otherwise does not necessarilyconstitute or imply its endorsement, recommendation, or favoring by the United States government or anyagency thereof. The views and opinions of authors expressed herein do not necessarily state or reflectthose of the United States government or any agency thereof.
Available electronically at http://www.osti.gov/bridge
Available for a processing fee to U.S. Department of Energyand its contractors, in paper, from:
U.S. Department of EnergyOffice of Scientific and Technical InformationP.O. Box 62Oak Ridge, TN 37831-0062phone: 865.576.8401fax: 865.576.5728email: [email protected]
Available for sale to the public, in paper, from:U.S. Department of Commerce
National Technical Information Service5285 Port Royal RoadSpringfield, VA 22161phone: 800.553.6847fax: 703.605.6900email: [email protected] ordering: http://www.ntis.gov/ordering.htm
Printed on paper containing at least 50% wastepaper, including 20% postconsumer waste

8/4/2019 NRL Report
http://slidepdf.com/reader/full/nrl-report 4/154
Abstract
The U.S. Department of Energy (DOE) is promoting the development of ethanol fromlignocellulosic feedstocks as an alternative to conventional petroleum-based transportation fuels.DOE funds both fundamental and applied research in this area and needs a method for predictingcost benefits of many research proposals. To that end, the National Renewable Energy
Laboratory (NREL) has modeled many potential process designs and estimated the economics of each process during the last 20 years.
This report is an update of the ongoing process design and economic analyses at NREL. Weenvision updating this process design report at regular intervals; the purpose being to ensure thatthe process design incorporates all new data from NREL research, DOE funded research andother sources, and that the equipment costs are reasonable and consistent with good engineering practice for plants of this type. For the non-research areas this means using equipment and process approaches as they are currently used in industrial applications.
For the last report1, published in 1999, NREL performed a complete review and update of the process design and economic model for the biomass-to-ethanol process utilizing co-current dilute
acid prehydrolysis with simultaneous saccharification (enzymatic) and co-fermentation. The process design included the core technologies being researched by the DOE: prehydrolysis,simultaneous saccharification and co-fermentation, and cellulase enzyme production. In addition,all ancillary areas—feed handling, product recovery and purification, wastewater treatment(WWT), lignin combustor and boiler-turbogenerator, and utilities—were included. NRELengaged Delta-T Corporation (Delta-T) to assist in the process design evaluation, the processequipment costing, and overall plant integration. The process design and costing for the lignincombustor and boiler turbogenerator was reviewed by Reaction Engineering Inc. (REI) andMerrick & Company reviewed the wastewater treatment.
Since then, NREL has engaged Harris Group (Harris) to perform vendor testing, process design,and costing of critical equipment identified during earlier work. This included solid/liquid
separation and pretreatment reactor design and costing. Corn stover handling was alsoinvestigated to support DOE’s decision to focus on corn stover as a feedstock for lignocellulosicethanol. Working with Harris, process design and costing for these areas were improved throughvendor designs, costing, and vendor testing in some cases. In addition to this work, enzyme costswere adjusted to reflect collaborative work between NREL and enzyme manufacturers (Genencor International and Novozymes Biotech) to provide a delivered enzyme for lignocellulosicfeedstocks. This report is the culmination of our work and represents an updated process designand cost basis for the process using a corn stover feedstock.
The process design and economic model are useful for predicting the cost benefits of proposedresearch. Proposed research results can be translated into modifications of the process design,and the economic impact can be assessed. This allows DOE, NREL, and other researchers to set
priorities on future research with an understanding of potential reductions to the ethanol production cost.
To be economically viable, ethanol production costs must be below market values for ethanol.DOE has chosen a target ethanol selling price of $1.07 per gallon as a goal for 2010. Theconceptual design and costs presented here are based on a 2010 plant start-up date. The keyresearch targets required to achieve this design and the $1.07 value are discussed in the report.
i

8/4/2019 NRL Report
http://slidepdf.com/reader/full/nrl-report 5/154
Table of ContentsI. Introduction..............................................................................................................1 I.1 Approach..................................................................................................................3I.2 Process Overview.....................................................................................................5 I.3 Plant Size .................................................................................................................7
I.3.1 Effect of Plant Size on Collection Distance.............................................................7 I.3.2 Estimating Corn Stover Costs Today.....................................................................10 I.3.3 Effect of Distance on Stover Cost..........................................................................11 I.3.4 Cost of Ethanol as a Function of Plant Size...........................................................12 I.3.5 Selecting the Right Plant Size................................................................................15 I.4 Feedstock and its Composition ..............................................................................16 II. Processing Design and Cost Estimating ................................................................18 II.1 Feedstock Storage and Handling – Area 100 (PFD-P110-A101)..........................18 II.1.1 Overview................................................................................................................18 II.1.2 Design Basis...........................................................................................................18 II.1.3 Cost Estimation......................................................................................................20 II.2 Pretreatment and Hydrolyzate Conditioning – Area 200 (PFD-P110-A201-3).....20 II.2.1 Overview................................................................................................................20 II.2.2 Design Basis...........................................................................................................22 II.2.3 Cost Estimation......................................................................................................24 II.2.4 Achieving the Design Case....................................................................................26 II.3 Saccharification and Co-Fermentation – Area 300 (PFD-P110-A301-2)..............27 II.3.1 Overview................................................................................................................27 II.3.2 Design Basis...........................................................................................................28 II.3.3 Cost Estimation......................................................................................................33 II.3.4 Achieving the Design Case Targets .......................................................................34 II.4 Cellulase Enzyme...................................................................................................36 II.5 Product, Solids, and Water Recovery (Distillation, Dehydration, Evaporation,
and Solid-Liquid Separation) – Area 500 (PFD-P110-A501-5).......................36 II.5.1 Overview................................................................................................................36 II.5.2 Design Basis Description.......................................................................................38 II.5.3 Cost Estimation......................................................................................................39 II.6 Wastewater Treatment – Area 600 (PFD-110-A601-2).........................................40 II.6.1 Overview................................................................................................................40 II.6.2 Design Basis...........................................................................................................42 II.6.3 Cost Estimation......................................................................................................44 II.7 Product and Feed Chemical Storage – Area 700 (PFD-P110-A701) ....................45 II.7.1 Overview................................................................................................................45 II.7.2 Design Basis...........................................................................................................45 II.7.3 Cost Estimation......................................................................................................46 II.8 Combustor, Boiler, and Turbogenerator – Area 800 (PFD-P110-A801-3) ...........46 II.8.1 Overview................................................................................................................46 II.8.2 Design Basis...........................................................................................................47 II.8.3 Cost Estimation......................................................................................................49 II.9 Utilities – Area 900 (PFD-P110-A901-3)..............................................................50
ii

8/4/2019 NRL Report
http://slidepdf.com/reader/full/nrl-report 6/154
II.9.1 Overview................................................................................................................50 II.9.2 Design Basis...........................................................................................................50 II.9.3 Cost Estimation......................................................................................................52 II.10 Water and Carbon Balances and Energy Analysis ................................................52 II.10.1 Water Balance........................................................................................................52II.10.2 Carbon Balance......................................................................................................53
II.10.3 Energy Analysis.....................................................................................................56 III. Process Economics.................................................................................................60 III.1 Analysis Procedure ................................................................................................60 III.1.1 Total Project Investment ........................................................................................60 III.1.2 Variable Operating Costs.......................................................................................64 III.1.3 Fixed Operating Costs............................................................................................65 III.1.4 Discounted Cash Flow Analysis and the Selling Cost of Ethanol.........................66 III.1.5 The Cost of Sugar ..................................................................................................71 IV. Sensitivity Analysis ...............................................................................................72
IV.1 Stover Composition, Cost, and Handling ..............................................................72 IV.2 Pretreatment Yields and Cost.................................................................................73 IV.3 Gypsum ..................................................................................................................73IV.4 Saccharification and Fermentation Yields and Cost..............................................74 IV.5 Energy Production .................................................................................................77 IV.6 Monte Carlo Analysis ............................................................................................78 IV.6.1 Overview................................................................................................................78 IV.6.2 Parameter Estimates...............................................................................................79 IV.6.3 Results....................................................................................................................80 V. Planned Improvements and Extensions to the Model............................................82 V.1 Water Balance and Optimization...........................................................................82 V.2 Fermentation pH Control .......................................................................................82 V.3 Air Emissions.........................................................................................................82 V.4 Greenhouse Gas Emissions....................................................................................82 V.5 Lignin Gasification and Gas Turbine Power Generation.......................................83 V.6 Physical Properties of Corn Stover ........................................................................83 References and Notes.........................................................................................................83Appendix A – NREL Biofuels Process Design Database Description and SummaryAppendix B – Individual Equipment Costs SummaryAppendix C – Chemical Costs and Sources Appendix D – Discounted Cash Flow Rate of Return SummaryAppendix E – Process Parameters Appendix F – Process Flow Diagrams (PFDs) Appendix G – Changes from the 1999 Design Report Appendix H – Chemical Formulas for Biomass Compounds Appendix I – Physical Property Model and Parameters for Distillation
iii

8/4/2019 NRL Report
http://slidepdf.com/reader/full/nrl-report 7/154
Figures
Figure 1. NREL’s Approach to Process Design and Economic Analysis......................3 Figure 2. Overall Process, PFD-P100-A000 ..................................................................6
Figure 3. GIS Model Results Showing the Location of 35 2000 MT/d Ethanol
Plants in Iowa.............................................................................................8 Figure 4. The Effect of Plant Size on Collection Distance ............................................9 Figure 5. Typical Breakdown of Corn Stover Costs ....................................................10 Figure 6. Hauling Charges for Corn Stover as a Function of Distance........................12 Figure 7. Ethanol Cost as a Function of Plant Size for 10% Availability of Corn
Acres ........................................................................................................13 Figure 8. Ethanol Price as a Function of Plant Size and Percentage of Available
Acres ........................................................................................................14 Figure 9. Ethanol Price as a Function of Plant Size and Hauling Cost ($/ton-mile)....15 Figure 10. Pretreatment Process Area Overview, PFD-P100-A200 ..............................21
Figure 11. Corrosion Resistance of Incoloy 825............................................................25 Figure 12. Distillation System Overview, PFD-P110-A500..........................................37 Figure 13. Wastewater Treatment (WWT) Process Overview, PFD-P110-A600 .........41 Figure 14. Process Carbon Balance................................................................................55 Figure 15. Process Energy Analysis Based on Higher Heating Value of Biomass Feed58 Figure 16. CFBC/Turbogenerator Energy Balance........................................................60 Figure 17. Effect of Varying IRR and Equity on Minimum Ethanol Selling Price .......67 Figure 18. Cost Contribution Details from Each Process Area......................................71 Figure 19. SSF Yields for Multiple Enzyme Loadings........................................................75 Figure 20. MESPs for Multiple Enzyme Loadings...................................................................76 Figure 21. MESPs for Multiple Residence Times ....................................................................76Figure 22. Histogram of the Minimum Ethanol Selling Price .......................................80 Figure 23. Probability Curve of the Minimum Ethanol Selling Price............................81 Figure 24. Histogram of the Total Project Investment...................................................81
iv

8/4/2019 NRL Report
http://slidepdf.com/reader/full/nrl-report 8/154
Tables
Table 1. Feedstock Composition.................................................................................16 Table 2. Measured Stover Composition Ranges.........................................................17 Table 3. Pretreatment Hydrolyzer Conditions ............................................................22
Table 4. Pretreatment Hydrolyzer Reactions and Conversions ..................................23 Table 5. Experimental Pretreatment Reactor Conditions............................................26 Table 6. Experimental Pretreatment Hydrolyzer Reactions and Conversions............26 Table 7. Saccharification Conditions..........................................................................29 Table 8. Saccharification Reactions and Conversions ................................................29 Table 9. Seed Train Specifications .............................................................................30 Table 10. Seed Train Reactions and Conversions.........................................................31 Table 11. Co-Fermentation Conditions.........................................................................32 Table 12. Co-Fermentation Reactions and Conversions...............................................32 Table 13. Co-Fermentation Contamination Loss Reactions .........................................33 Table 14. Experimental Saccharification Conditions ...................................................34
Table 15. Experimental Saccharification Reactions and Conversions .........................34 Table 16. Experimental Co-Fermentation Conditions ..................................................35 Table 17. Experimental Co-Fermentation Reactions and Conversions ........................35 Table 18. Comparison of Sending Evaporator Syrup to the Combustor or WWT .......44 Table 19. Boiler Costs...................................................................................................49 Table 20. Ethanol Plant Overall Water Balance ...........................................................53 Table 21. Ethanol Plant Overall Carbon Balance .........................................................54 Table 22. Feed Stream Carbon Composition................................................................56 Table 23. Ethanol Plant Overall Energy Analysis ........................................................57 Table 24. Feed Stream Energy Analysis.......................................................................59 Table 25. Installation Factors........................................................................................62 Table 26. Chemical Engineering Purchased Equipment Index ....................................62 Table 27. Additional Cost Factors for Determining Total Project
Investment................................................................................................63 Table 28. Total Installed Equipment Costs...................................................................63 Table 29. Total Project Investment (TPI) .....................................................................64 Table 30. Variable Operating Costs..............................................................................64 Table 31. Inorganic Chemical Index.............................................................................65 Table 32. Fixed Operating Costs...................................................................................66 Table 33. Labor Index...................................................................................................66 Table 34. Construction Activities and Cash Flow ........................................................69 Table 35. Discounted Cash Flow Parameters ...............................................................70 Table 36. Summary of Yields, Rates and Conversion Costs ........................................70 Table 37. Mixed Sugar Stream Concentration from Saccharification ..........................72 Table 38. Effect of Pretreatment Yields on Minimum Ethanol Selling Price...............73 Table 39. Summary of Sensitivity Results by Cost Impact ..........................................78 Table 40. Input Parameter Distribution for Monte Carlo Analysis...............................79
v

8/4/2019 NRL Report
http://slidepdf.com/reader/full/nrl-report 9/154
Acronyms
ABB ABB Power Generation SystemsACFM Actual Cubic Feet per Minute
ASPEN Advanced Simulator for Process EngineeringANSI American National Standards InstituteAPI American Petroleum InstituteBFW Boiler Feed Water B/MAP Biomass AgriProductsBOD Biochemical Oxygen DemandBTU British Thermal UnitCFBC Circulating Fluidized Bed Combustor CFM Cubic Feet per MinuteCIP Clean-in-placeCOD Chemical Oxygen Demand
CS Carbon SteelCSL Corn Steep Liquor CW Cooling Water DAP Diammonium PhosphateDB Declining BalanceDOE U.S. Department of EnergyEIA Energy Information AdministrationEPA Environmental Protection AgencyEtOH EthanolFPU Filter Paper UnitsFWE Foster Wheeler EnergyGDS General Depreciation SystemGIS Geographic Information SystemGPM Gallons per minuteHHV Higher Heating ValueHMF Hydroxymethyl FurfuralIFPU International Filter Paper Units (see FPU)IGCC Integrated Gasification Combined CycleIRR Internal Rate of ReturnIRS Internal Revenue ServiceLHV Lower Heating ValueMACRS (IRS) Modified Accelerated Cost Recovery SystemMESP Minimum Ethanol Selling PriceMM MillionMT Metric Ton NREL National Renewable Energy Laboratory NSPS New Source Performance StandardsORNL Oak Ridge National LaboratoryP&ID Piping and Instrument DiagramPDU Process Development Unit
vi

8/4/2019 NRL Report
http://slidepdf.com/reader/full/nrl-report 10/154
PFD Process Flow Diagram REI Reaction Engineering, Inc. SCFM Standard Cubic Feet per Minute SS Stainless SteelSSCF Simultaneous Saccharification and Co-Fermentation ST Short Ton
TPI Total Project InvestmentVOC Volatile Organic Compound WWT Wastewater Treatment
vii
8/4/2019 NRL Report
http://slidepdf.com/reader/full/nrl-report 11/154
I. Introduction
The U.S. Department of Energy (DOE) is promoting the development of ethanol fromlignocellulosic feedstocks as an alternative to conventional petroleum transportation fuels.Programs being sponsored by DOE range from fundamental and applied research for developing
better cellulose hydrolysis enzymes and ethanol-fermenting organisms, to engineering studies of potential processes, to co-funding initial biomass-to-ethanol demonstration and productionfacilities. This research is being conducted by various national laboratories, including the National Renewable Energy Laboratory (NREL) and Oak Ridge National Laboratory (ORNL), aswell as by universities and private industry. Engineering and construction companies andoperating companies are generally conducting the engineering work.
There are two primary reasons for NREL to investigate the complete process design andeconomics of lignocellulosic ethanol plants. First, this effort helps to direct research bydeveloping a benchmarking case for the current conceptual process design. Once the benchmark case is developed, the proposed research and its anticipated results are translated into a newdesign, the economics (the anticipated results of proposed research) are determined, and this new
information is compared to the benchmark case. Following this process for several proposedresearch projects allows DOE to make funding decisions based on which projects have thegreatest potential to lower the cost of ethanol production. Complete process design andeconomics are required for such studies because a new proposal in one research area may have alarge effect on another process area that is not generally part of the research program, such as product recovery or waste treatment. The impact on other areas of the process can have asignificant impact on the economics of the proposed research.
Second, this investigation allows us to develop an absolute cost of the production of ethanol based on process and plant design assumptions. In reviewing and establishing research directions,only relative cost differences are important. However, to be able to compare the economics of ethanol with other fuels, the absolute cost is required. An absolute cost is also needed to study
the potential ethanol market penetration of the lignocellulosic biomass to ethanol process. Thus,we are making the best possible attempt to develop cost estimates that are consistent withapplicable engineering, construction, and operating practices for facilities of this type. To do so,the complete process, including newly researched areas and industry-available processcomponents must be designed and their costs determined. For the current level of designknowledge, we consider the capital cost estimate to be at the conceptual level.
To improve the plant cost estimates that affect the absolute cost of ethanol production, NRELcontracts with companies such as Harris Group (Harris) and Delta-T Corporation (Delta-T) toassist in preparing, reviewing, and estimating costs for the process designs. Delta-T worked with NREL process engineers in 1998-99 to review all the process design and equipment costs (withthe exclusion of wastewater treatment and the combustor-boiler system, which were reviewed by
Merrick Engineering2
and Reaction Engineering, Inc.3
[REI], respectively). At the conclusion of these efforts, the first design report was published1.
As a result of the NREL/Delta-T work, several areas were identified that required more extensivestudy. Therefore, NREL worked with Harris to perform vendor testing, corr osion testing, processdesign, and costing of critical equipment identified from the earlier work. This includedsolid/liquid separation equipment and pretreatment reactors. Corn stover handling was alsoinvestigated to support DOE’s decision to focus on stover in its efforts to commercializelignocellulosic ethanol. Working with Harris, process design and costing for these areas was
1

8/4/2019 NRL Report
http://slidepdf.com/reader/full/nrl-report 12/154
improved. At the same time, DOE partnered with the two largest enzyme manufacturers in theworld (Genencor International and Novozymes Biotech) to reduce the cost of cellulase enzymes
by a factor of 10. It is assumed that these companies will produce the enzymes and sell them toethanol producers. Therefore, the ethanol plant will no longer be responsible for enzyme production but will purchase them from off-site. This report is the culmination of this work andrepresents an updated process design and cost basis for the process using a corn stover feedstock.
To be economically viable, ethanol production costs must be below market values for ethanol.DOE has chosen a target ethanol selling price of $1.07 per gallon as a goal for 2010. Theconceptual design and costs presented here are based on a 2010 plant start-up date. The keyresearch targets required to achieve this design and the $1.07 value are discussed in the report.
We envision that this conceptual process design will be updated via an on-going process, and thatreports will be released at regular intervals. The purpose is to ensure that the process designincorporates all new data from NREL research, DOE funded research and other sources, and thatthe equipment costs are reasonable and consistent with good engineering practice for plants of this type. For the non-research areas this means using equipment and process approaches as theyare currently being used in industrial applications.
2
8/4/2019 NRL Report
http://slidepdf.com/reader/full/nrl-report 13/154
I.1 Approach
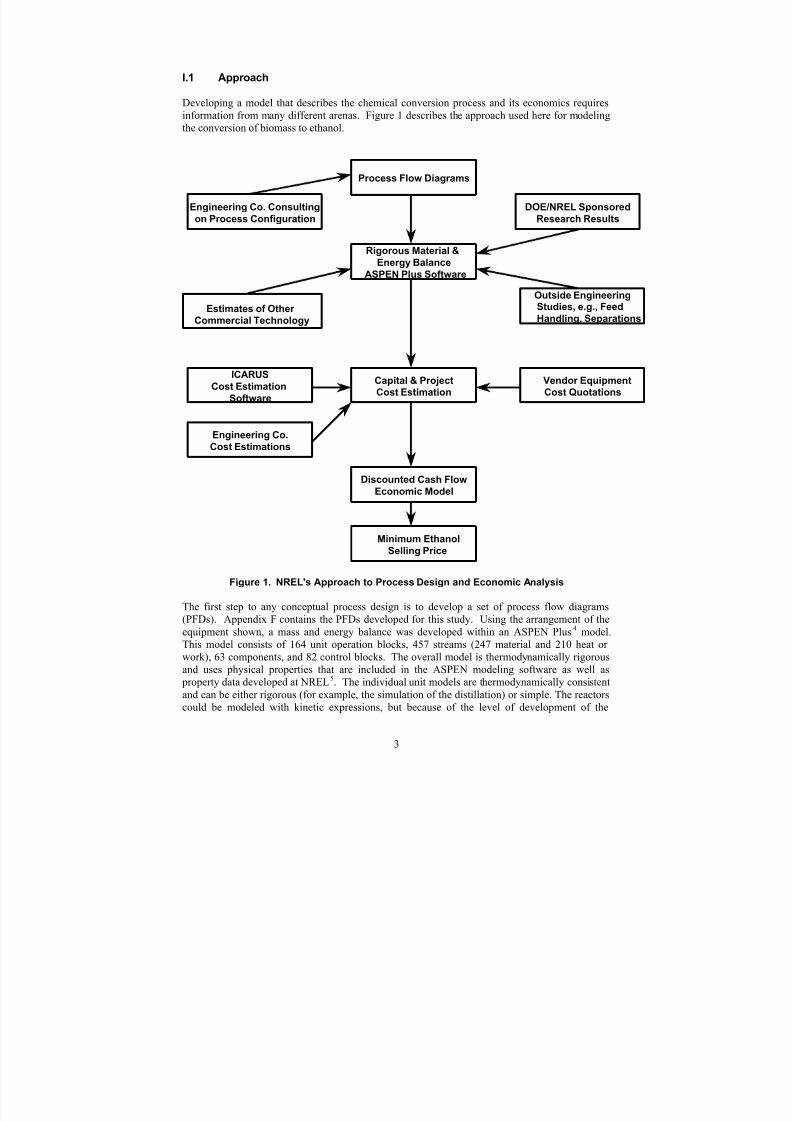
Developing a model that describes the chemical conversion process and its economics requiresinformation from many different arenas. Figure 1 describes the approach used here for modelingthe conversion of biomass to ethanol.
Rigorous Material &Energy Balance
ASPEN Plus Software
Engineering Co. Consultingon Process Configuration
DOE/NREL SponsoredResearch Results
Outside EngineeringStudies, e.g., FeedHandling, Separations
Capital & ProjectCost Estimation
Discounted Cash FlowEconomic Model
ICARUSCost Estimation
Software
Vendor EquipmentCost Quotations
Engineering Co.Cost Estimations
Minimum EthanolSelling Price
Process Flow Diagrams
Estimates of Other Commercial Technology
Figure 1. NREL's Approach to Process Design and Economic Analysis
The first step to any conceptual process design is to develop a set of process flow diagrams(PFDs). Appendix F contains the PFDs developed for this study. Using the arrangement of theequipment shown, a mass and energy balance was developed within an ASPEN Plus4 model.This model consists of 164 unit operation blocks, 457 streams (247 material and 210 heat or work), 63 components, and 82 control blocks. The overall model is thermodynamically rigorousand uses physical properties that are included in the ASPEN modeling software as well as property data developed at NREL5. The individual unit models are thermodynamically consistentand can be either rigorous (for example, the simulation of the distillation) or simple. The reactorscould be modeled with kinetic expressions, but because of the level of development of the
3

8/4/2019 NRL Report
http://slidepdf.com/reader/full/nrl-report 14/154
experimental data, they were modeled as experimentally determined conversions of specificreactions. The chemical formulas for atypical compounds (not included in the ASPEN modelingsoftware) are listed in Appendix H. This type of model still satisfies the rigorous mass andenergy balance. Other unit operations, such as liquid-solid separations, are typically modeledwith fixed solids removal and liquid retention (in the solids stream) data from vendor tests.
Using the PFDs and the mass and energy balance information from the ASPEN model, wedeveloped specifications for each piece of equipment. The equipment specifications (and costestimate) are detailed in the NREL process database (see Appendix A). Finally, within eachequipment specification, we developed individual purchased equipment and installation costs.
Equipment costs were obtained from vendor quotations when possible, especially for uncommonequipment such as pretreatment reactors. These costs reflect the base case for which theequipment was designed. If process changes are made and the equipment size changes, theequipment is not generally re-costed in detail. Using the following exponential scalingexpression, the cost was determined by scaling based on the new size or other valid size relatedcharacteristic.
New Size *
exp
New Cost = Original Cost Original Size * * or characteristic linearly related to the size
If the size of the equipment is known to change linearly with the inlet flow, that information can be used for scaling. Another characteristic of the size might be the heat duty for a heat exchanger if the log-mean temperature difference is known not to change. Generally these relatedcharacteristics are easier to calculate and give the same result as resizing the equipment eachtime. For some equipment, nothing can be easily related to the size, so it must be resized witheach process change. Heat exchangers with varying temperature profiles are one example. Inthis case, the heat exchanger area is calculated each time the model is run and the cost is scaledusing the ratio of the new and original areas.
The scaling exponent (exp) was obtained from vendor quotes (if two quotes at different sizeswere obtained), Harris, or from a standard reference, such as Garrett.6 The installation costs were primarily taken from Delta-T’s experience and are explained in more detail in the processeconomics section (Section III).
Once the scaled, installed equipment costs were determined, we applied overhead andcontingency factors to determine a total plant investment cost. That cost, along with the plantoperating expenses (generally developed from the ASPEN model) was used in a discounted cashflow analysis to determine the cost of ethanol production, using a set discount rate. For theanalysis done here, the ethanol production cost is the primary value used to compare designs.
Development of alternative designs is very useful in evaluating research proposals. Scenarios, based on technologies that might be developed after several years of research, are translated to process designs and the cost of ethanol production is evaluated. These projections are only asgood as the estimation of the future technology developments.
Even though one aim of this work was to develop the absolute cost of ethanol for comparison toother fuels, it should be noted that ethanol and possibly electricity are the only products of theseconceptual process designs. It is likely that smaller volume, niche products will emerge, such as products from the biomass-derived sugars that will have a significantly higher profit margin than
4

8/4/2019 NRL Report
http://slidepdf.com/reader/full/nrl-report 15/154
fuel-grade ethanol. When these other products and their selling prices are figured into theanalysis, the cost of ethanol may decrease, just as the cost of gasoline is reduced by the sale of other petroleum refinery products. Likewise, co-location with existing producers of ethanol, power, or some other equally synergistic product slate will likely reduce the cost of ethanol.
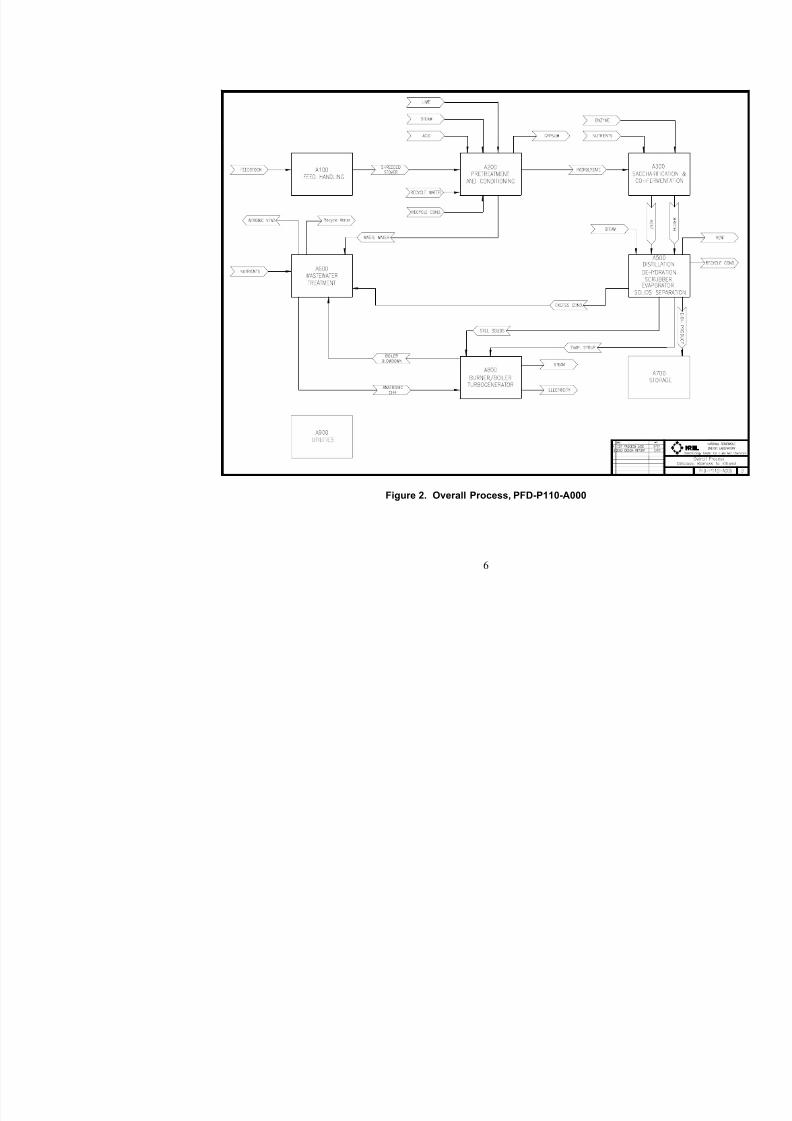
I.2 Process Overview
The process being analyzed here can be described as using co-current dilute acid prehydrolysis of the lignocellulosic biomass with enzymatic saccharification of the remaining cellulose and cofermentation of the resulting glucose and xylose to ethanol. The process design also includesfeedstock handling and storage, product purification, wastewater treatment, lignin combustion, product storage, and all other required utilities. In all, the process is divided into eight areas (seeFigure 2).
The feedstock, in this case corn stover (comprised of stalks, leaves, cobs, and husks), is deliveredto the feed handling area (A100) for storage and size reduction. From there the biomass isconveyed to pretreatment and detoxification (A200). In this area, the biomass is treated withdilute sulfuric acid catalyst at a high temperature for a short time, liberating the hemicellulose
sugars and other compounds. Separation with washing removes the acid from the solids for neutralization. Overliming is required to remove compounds liberated in the pretreatment that aretoxic to the fermenting organism. Detoxification is applied only to the liquid portion of thehydrolysis stream.
Enzymatic hydrolysis (or saccharification) coupled with co-fermentation (A300) of the detoxifiedhydrolyzate slurry is carried out in continuous hydrolysis tanks and anaerobic fermentation tanksin series. A purchased cellulase enzyme preparation is added to the hydrolyzate in the hydrolysistanks that are maintained at a temperature to optimize the enzyme’s activity. The fermentingorganism Zymomonas mobilis is first grown in a series of progressively larger batch anaerobicfermentations to make enough cells to inoculate the main fermenters. The inoculum, along withother nutrients, is added to the first ethanol fermenter along with the partially saccharified slurryat a reduced temperature. The cellulose will continue to be hydrolyzed, although at a slower rate,at the lower temperature. After several days of separate and combined saccharification and cofermentation, most of the cellulose and xylose will have been converted to ethanol. The resulting beer is sent to product recovery.
Product recovery (A500) involves distilling the beer to separate the ethanol from the water andresidual solids. A mixture of nearly azeotropic water and ethanol is purified to pure ethanol usingvapor-phase molecular sieve. Solids from the distillation bottoms are separated and sent to the boiler. Concentration of the distillation bottoms liquid is performed by evaporation, using wasteheat. The evaporated condensate is returned to the process and the concentrated syrup is sent tothe combustor.
Part of the evaporator condensate, along with other wastewater, is treated by anaerobic and
aerobic digestion (A600). The biogas (high in methane) from anaerobic digestion is sent to thecombustor for energy recovery. The treated water is suitable for recycling and is returned to the process.
The solids from distillation, the concentrated syrup from the evaporator, and biogas fromanaerobic digestion are combusted in a fluidized bed combustor (A800) to produce high-pressuresteam for electricity production and process heat. The majority of the process steam demand is inthe pretreatment reactor and distillation areas. Generally, the process produces excess steam thatis converted to electricity for use in the plant and for sale to the grid.
5
8/4/2019 NRL Report
http://slidepdf.com/reader/full/nrl-report 16/154
Figure 2. Overall Process, PFD-P110-A000
6

8/4/2019 NRL Report
http://slidepdf.com/reader/full/nrl-report 17/154
I.3 Plant Size
In establishing the appropriate size of a plant, we must consider the effects of a number of tradeoffs. Savings resulting from economies of scale (see discussion in section I.1) are offset byincreased costs for feedstock transportation. Put quite simply, the more feedstock a plantdemands, the farther out it must go to get it. Collection distance for a plant is highly site specific,
but a simple analysis can be done to understand the range of plant sizes for which overall costsand the impact of feedstock transport are minimal. This requires understanding both the cost of feedstock transportation and the effect of plant size on capital and fixed operating costs for theethanol plant.
On average, in the process industries, capital cost for equipment increases as a function of size or throughput according to the power law equation shown in section I.1 with an exponent of around0.6. This means that, per unit of output, the cost of capital can drop dramatically for larger scaleoperations. An exponent of 1 would mean linear scaling is taking place. An exponent less than 1means that the capital cost per unit size decreases as the equipment becomes larger. This conceptis sometimes termed “economies of scale”. Economies of scale diminish when the equipment isas large as possible and multiple pieces of equipment become necessary.
In 1991, NREL first evaluated the size of an ethanol plant for our standard design by looking atthe trade off between economies of scale and increased cost of delivering feedstock. 7 That studycompared a plant size of around 1,750 metric tons (1 MT is 1,000 kg) or 1,920 short tons (1 ST is2000 lb) per day to one of 9,090 MT (10,000 ST), assuming an additional $2/ton transport costsfor the larger plant size. In this report, we have repeated that analysis in a more rigorous way tosee if a plant size of 2,000 MT per day is appropriate in the current design for converting cornstover to ethanol.
I.3.1 Effect of Plant Size on Collection Distance
NREL and ORNL recently completed a life cycle analysis of corn stover-derived ethanol.8 As
part of that study, researchers at ORNL used a GIS model known as ORIBUS to estimate energydemands, environmental flows and costs for collection and transportation of corn stover in thestate of Iowa (Figure 3). The premise of this study was that the maximum amount of stover thatcould be collected should be constrained by soil erosion considerations. An analysis of theeffects of stover removal on soil erosion found that, for Iowa farmers using low or no till practices and who are producing corn continuously on their land, an average of two metric tons(MT) per acre of stover can be removed without causing erosion rates to exceed USDA’stolerable soil loss limits. ORIBUS was used to estimate transportation costs for a total of 35 potential ethanol plants sized to handle 2,000 MT (2,205 ST) per day of corn stover.
Though the life cycle study of corn stover-derived ethanol in Iowa did not look at the effect of locating plants of different sizes, we can use the results of this study to calibrate a much simpler
analysis of stover transportation costs in order to understand the trade-offs of transportation costsand savings due to economies of scale.
7

8/4/2019 NRL Report
http://slidepdf.com/reader/full/nrl-report 18/154
Figure 3. GIS Model results showing the location of 35 2000 MT/d ethanol plants in Iowa
For this analysis, we need to estimate the distance traveled to collect corn stover, which,obviously, increases as the size of the plant increases. We estimate the collection distance as theradius of a circle around the plant within which the stover is purchased. The area of this circle isa function of the residue that can be collected per acre, the fraction of surrounding farmland fromwhich stover can be collected and the fraction of farmland dedicated to crops (versusinfrastructure):
Areacollection = (Dstover /(Ystover *Favailableacres*Flandincrops)
Where:Areacollection is the circle of collection around the plant
Dstover is the annual demand for stover by an ethanol plant
Ystover is MT stover collected per acre per year
Favailableacres is the fraction of total farmland from which stover can be collected
Flandincrops is the fraction of surrounding farmland containing crops
The last two items warrant further explanation. In this simplified analysis we presume that the plant is located in the middle of corn farmland. Even so, not all of the land on a farm is availablefor planting crops. We assume that 25% of the land is tied up in infrastructure (e.g., roads and buildings), leaving 75% of the farm acres actually planted in corn. Thus, Flandincrops is taken to be0.75. Furthermore, we do not assume that all of the farms around the ethanol plant will want or be able to participate in the collection and sale of their corn stover. Thus, Favailableacres is a parameter we vary in the analysis.
8
8/4/2019 NRL Report
http://slidepdf.com/reader/full/nrl-report 19/154
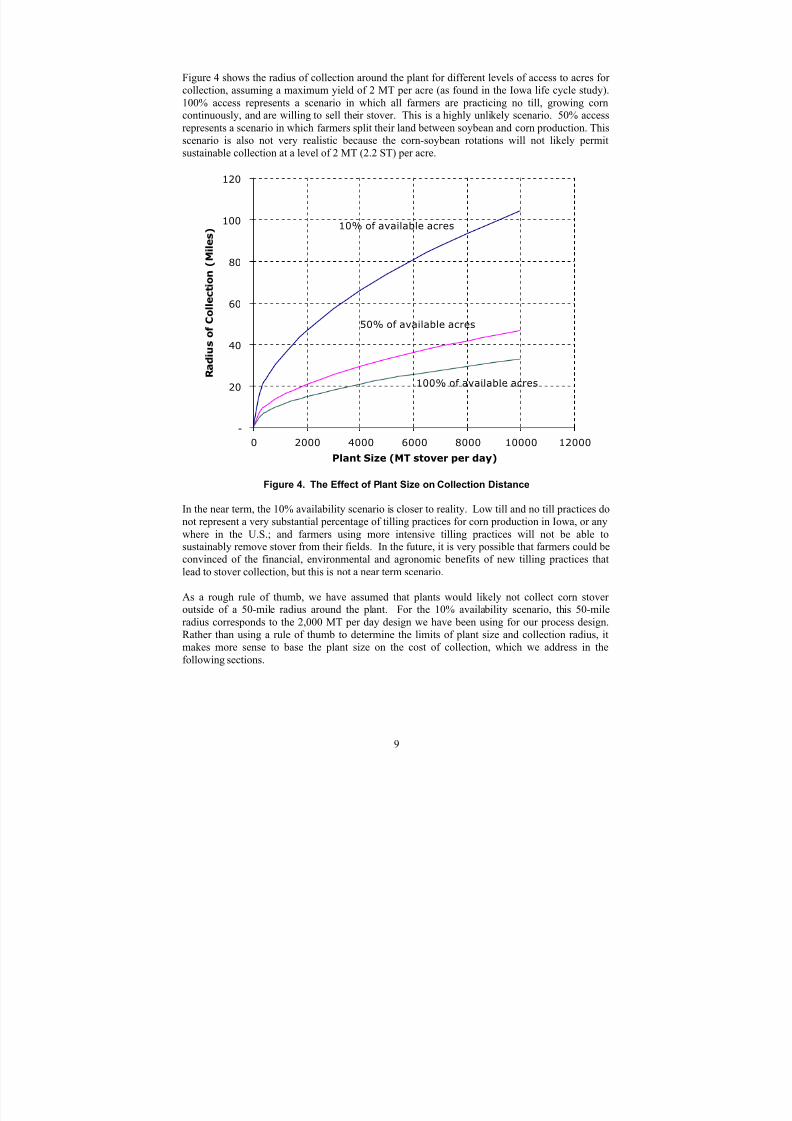
Figure 4 shows the radius of collection around the plant for different levels of access to acres for collection, assuming a maximum yield of 2 MT per acre (as found in the Iowa life cycle study).100% access represents a scenario in which all farmers are practicing no till, growing corncontinuously, and are willing to sell their stover. This is a highly unlikely scenario. 50% accessrepresents a scenario in which farmers split their land between soybean and corn production. Thisscenario is also not very realistic because the corn-soybean rotations will not likely permit
sustainable collection at a level of 2 MT (2.2 ST) per acre.
120
100
80
60
40
20
-
0 2000 4000 6000 8000 10000 12000
10% of available acres
100% of available acres
50% of available acres
Plant Size (MT stover per day)
Figure 4. The Effect of Plant Size on Collection Distance
In the near term, the 10% availability scenario is closer to reality. Low till and no till practices donot represent a very substantial percentage of tilling practices for corn production in Iowa, or anywhere in the U.S.; and farmers using more intensive tilling practices will not be able tosustainably remove stover from their fields. In the future, it is very possible that farmers could beconvinced of the financial, environmental and agronomic benefits of new tilling practices thatlead to stover collection, but this is not a near term scenario.
As a rough rule of thumb, we have assumed that plants would likely not collect corn stover
outside of a 50-mile radius around the plant. For the 10% availability scenario, this 50-mileradius corresponds to the 2,000 MT per day design we have been using for our process design.Rather than using a rule of thumb to determine the limits of plant size and collection radius, itmakes more sense to base the plant size on the cost of collection, which we address in thefollowing sections.
R a d i u s o f C o l l e
c t i o n ( M i l e s )
9

8/4/2019 NRL Report
http://slidepdf.com/reader/full/nrl-report 20/154
I.3.2 Estimating Corn Stover Costs Today
Collecting biomass for the plant has two main sources of direct costs:
• The cost of baling and staging stover at the edge of the field
• The cost of transportation from the farm to the plant gate
In the past two years, Oak Ridge National Lab has been quantifying the cost of collecting cornstover assuming the use of existing equipment; and, more importantly, assuming that stover would be collected in a second pass through the field after the grain has been harvested. Weknow that such an approach will not suffice as the industry develops, but it does reflect the coststhat we can anticipate for farmers collecting stover today. Furthermore, we have documentedexperience with such collection schemes.9
Figure 5 shows the relative contribution of the sources of costs for stover collection and delivery, based on an analysis done by ORNL for our corn stover life cycle analysis:
Total Delivered Stover Cost = $62 per dry MT ($56 per dry ST)
Trans18%
K fertilizer
23%
P fertilizer
port Farmer Premium
4%
N fertilizer6%
2%
Bale and Stage
47%Figure 5. Typical Breakdown of Corn Stover Costs
These costs represent a specific set of conditions that correspond to the scenario of 100%availability of acres, maximum levels of stover removal, with all costs averaged across a total of 35 Iowa facilities processing 2,000 MT per day, as shown in Figure 3. Baling and staging, at $29 per dry MT ($26 per dry ST), represents almost half the cost of delivered feedstock. The analysisincludes the payment of a premium to farmers of $11 per dry MT ($10 per dry ST). This
payment is above and beyond the cost of stover collection. For a yield of 2 MT per acre (2.2 ST per acre), this corresponds to a profit of $22 per acre. Informal discussions with the farmcommunity suggest that $20 per acre is the likely threshold above which farmers would acceptthe risk and added work of collecting and selling their residue. Note that we have also included
costs for added fertilizer requirements associated with the loss of nitrogen, potassium and phosphorous contained in the removed stover. Added fertilizer costs amount to around $8 per dryMT ($7 per dry ST). Transportation cost in this scenario is $14 per dry MT ($13 per dry ST).
The average costs for transportation and baling costs are somewhat inflated in this analysis because they include costs for the last plants able to collect stover in Iowa. In the GIS analysisdone for the life cycle study, individual 2,000 MT per day plants were located in sequence, witheach new plant located to collect the lowest cost stover supplies. The last few plants have to go
10

8/4/2019 NRL Report
http://slidepdf.com/reader/full/nrl-report 21/154
much farther to obtain stover, and they must collect stover from the least cost effective sources of residue.
It is important to note that the feedstock costs shown in this section are not the same as thenominal cost used in the process design economic analysis presented at the end of this report.This design is built on a series of assumptions tied to the successful achievement of research and
development goals for the conversion technology. We have not yet developed cost-based targetsfor reducing the cost of feedstock collection and transport. As a placeholder in the processeconomics presented here, we have assumed that the nominal cost of corn stover will be reducedto around $33 per dry MT ($30 per dry ST) through improved collection (e.g. single pass)techniques.
One final note about the cost of feedstock—the costs shown here are significantly higher thancost previously reported in the literature. That is because these costs include a premium paid tothe farmer on top of the cost of collection and increased fertilizer application rates. Someestimates include no net payment to the farmer; while others include premiums, but assume thatthe cost of added fertilizer cost is hidden in the premium payment. One reason why these addedcosts for fertilizer and farmer premium have not been addressed is that there is tremendous
uncertainty in these estimates. Nitrogen fertilizer cost, in particular, is hard to get a handle on.The composition data used to estimate fertilizer loss is sparse. The cost of stover collection presented here serve as a reasonable basis for testing the sensitivity of ethanol cost to plant size, but should not be regarded as an accurate assessment of corn stover collection costs.
I.3.3 Effect of Distance on Stover Cost
The only “real life” experience with transporting corn stover that has been documented in the published literature comes from the efforts by Biomass Agricultural Products (BMAP, LLC) inHarlan Iowa.9
11

8/4/2019 NRL Report
http://slidepdf.com/reader/full/nrl-report 22/154
$18.00
$16.00
$14.00
$12.00
$10.00
$8.00
$6.00
$4.00
$2.00
$-
0 to 15 16-30 31-50 50-100
$6.71
$9.65
$12.58
$15.51
Radius from Plant (mi)
Figure 6. Hauling Charges for Corn Stover as a Function of Distance
In their collection study, BMAP established a pricing structure for corn stover that includedhauler costs as a function of radial distance from the plant. Those costs are shown in Figure 6. In
our evaluation of the trade-off of the costs of collection and the effect of plant size, we use thecost breakdown for stover shown in Figure 5, excluding the transportation cost. The linear relationship between cost and distance reported by BMAP is then substituted to predict a totalcost of delivered corn stover that is a function of distance from the plant.
I.3.4 Cost of Ethanol as Function of Plant Size
The last piece of information required to conduct the analysis for choosing plant size requiresestimates of the annualized cost and non-feedstock related operating costs of the plant. We usethe costs as reported in the section on process economics later in this report (which are based on a2,000 MT per day design). But, we need to be able to take into account the effect of plant size(economies of scale). To do this, we need to substitute the annualized costs calculated for the
2,000 MT per day design with an equation that recalculates annualized cost as a function of sizeusing the power law type of equation for scale factor discussed earlier. In this analysis we used acapital cost scaling exponent of 0.7, which was calculated by rigorously modeling 2 different plant sizes and determining the exponent from each plant’s capital cost and feed rate10.
H a u l e r C o s t ( $ / M T )
12

8/4/2019 NRL Report
http://slidepdf.com/reader/full/nrl-report 23/154
$1.80
$1.60
$1.40
$1.20
$1.00
$0.80
$0.60
$0.40
$0.20
$0.00
0 2000 4000 6000 8000 10000 12000
Total Cost
Feedstock Cost
Non Feedstock Cost
10% access to
surrounding corn acres
Plant Size (MT stover per day)
Figure 7. Ethanol Cost as a Function of Plant Size for 10% Availability of Corn Acres
Figure 7 shows the minimum selling price for ethanol as a function of plant size for theconservative, but more likely near term, scenario of collecting stover from only 10% of the cornacres around the conversion facility. The non-feedstock and feedstock-related cost componentsare plotted along with the total cost. This figure demonstrates the nature of the trade-off quiteclearly. The non-feedstock cost curve reflects the conventional wisdom of economies of scale.An increase in plant size from 2,000 to 10,000 MT per day reduces non-feedstock costs by $0.19 per gallon, savings that seem well worth capturing. But the increased cost of feedstock for the10,000 MT per day design eliminates $0.13 of these savings. In this scenario, the net savings of $0.06 is achieved at a plant size between 6,000 and 8,000 MT per day, with no additional costsavings realized above that size. Plant sizes below the 2,000 MT per day design show rapidlyincreasing costs, suggesting that the 2,000 MT per day plant, under the assumed conditions, is agood choice for the minimum plant size. Thus, for the conservative scenario of collecting stover from 10% of the corn acres around a conversion plant, the optimal minimum plant size is in the2,000 to 4,000 MT per day range.
As more acres of corn become available for stover collection, it is possible to increase the rangeof optimal plant designs, as shown in Figure 8. When available acres are increased from 10 to25%, savings in cost due to increased plant size top out at $0.10 per gallon up to a plant size of 10,000 MT per day. For the case of full access to stover on surrounding corn acres, increasing
M i n
E t h a n o l S e l l i n g P r i c e ( $ / g a l )
13

8/4/2019 NRL Report
http://slidepdf.com/reader/full/nrl-report 24/154
plant size from 2,000 to 10,000 MT per day can realize savings of $0.16 per gallon, however, thelion’s share of these savings are achieved by the time you reach a plant size of 8,000 MT per day.
$1.80
$1.70
$1.60
$1.50
$1.40
$1.30
$1.20
$1.10
$1.00
0 2000 4000 6000 8000 10000 12000
10%
25%
50%
100%
Plant Size (MT stover per day)
Figure 8. Ethanol Price as a Function of Plant Size and % of Available Acres
Another important factor impacting the cost of delivering feedstock is the cost per ton-mile. Thiscost is affected by the bulk density of the stover bales, the maximum number of bales per loadand the road infrastructure itself. Lower bulk density and lower load capacity will increase thenumber of trips needed to deliver stover. Road infrastructure can be very important, as it impactsthe maximum speed for haulers. The largest cost for hauling is in labor, which increasesinversely as speed limit drops. Figure 9 shows the effect of the cost per ton-mile in the case of 10% access to surrounding corn acres. A 50% increase in hauling cost per ton-mile reduces therange of optimum plant sizes to 2,000 to 5,000 MT per day (versus 2,000 to 8,000 MT per day for the 1x cost per ton-mile). At twice the our estimated cost per ton-mile, the range of optimal plantsizes not only shrinks to a maximum of around 3,000 MT per day, but higher plant sizes actuallysee significant increases in the minimum ethanol selling price.
M i n E t h a n o l S e l l i n g P r i c e ( $ / g a l )
14

8/4/2019 NRL Report
http://slidepdf.com/reader/full/nrl-report 25/154
$1.70
M
i n E t h a n o l S e l l i n g P r i c e ( $ / g a
l )
$1.60
$1.50
$1.40
$1.30
$1.20
$1.80
2.0x
1.0x
1.5x
10% access to
surrounding corn acres
$1.10
$1.00
0 2000 4000 6000 8000 10000 12000
Plant Size (MT stover per day)
Figure 9. Ethanol Price as a Function of Plant Size and Hauling Cost ($/ton-mile)
I.3.5 Selecting the Right Plant Size
The analysis presented here illustrates the need to understand and improve the technology andlogistics of corn stover collection. Still, even when we consider a wide range of possiblecollection scenarios, we see that the minimum plant size of 2,000 MT per day holds reasonablywell. Changes in assumptions about collection, however, can significantly impact the range of plant sizes over which it may be possible to realize cost savings. But the maximum plant size isunlikely to be above 8,000 MT per day. A more likely range for designs is 2,000 to 4,000 MT per day.
It bears repeating that the cost estimates for stover used in this plant size analysis do notcorrespond to the nominal feedstock costs assumed in the detailed process design and economicssummarized in this report. For the purposes of the process design, we used a nominal cost of $33
per MT ($30 per ST); meaning that we implicitly assume that research going on at Oak Ridge National Lab and at USDA will lead to considerable cost reductions. The estimate of stover costshown in this section is higher than previously reported stover costs, developed by Oak Ridge National Lab. ORNL has reported costs of $38 to $55 per MT of stover.11 At a delivered cost of $55 per MT, ORNL reports that almost all of the potential stover supply becomes available.
In addition, the perspective of our studies is that of “nth” plants using high-volume biomasssources. We assume that these plants are located in the best locations for access to thesefeedstocks. In the near term, many of the pioneer plants will rely on niche feedstocks, which are
15

8/4/2019 NRL Report
http://slidepdf.com/reader/full/nrl-report 26/154
often spread out over much larger distances. Such plants may indeed be much smaller in sizethan our base case design assumes.
I.4 Feedstock and its Composition
The feedstock chosen for the process design has a significant impact on the overall analysis. The
type of feedstock used will have a large effect on the feedstock-handling portion of the process,and the composition will certainly have an impact on how much ethanol is produced.
The feedstock used for this analysis was corn stover; Table 1 shows the composition used. Thiscomposition is an average of the analyses of nine samples from two multi-ton batches of cornstover NREL received from Biomass AgriProducts (B/MAP) for use in lab and pilot studies12. Afeedstock analysis was converted to components that are used in the ASPEN model andnormalized to 100%. In general, the component analysis of carbohydrates was used directly;other soluble compounds were combined under “extractives”. The unknown soluble solidscomponent was used to normalize the composition to 100%; its heat of formation is calculated to balance the reported heating value of the feedstock with the calculated component heating values.
Table 1. Feedstock Composition12
Component % Dry Basis Glucan 37.4
Xylan 21.1
Lignin 18.0
Ash 5.2
Acetate* 2.9
Protein 3.1
Extractives 4.7
Arabinan 2.9
Galactan 2.0
Mannan 1.6
Unknown Soluble Solids** 1.1
Moisture 15.0
*Acetate represents the acetate groups present inthe hemicellulose polymer. They are generallyconverted to acetic acid in the prehydrolysis
reactor.**Unknown soluble solids are calculated bydifference to close the mass balance.
Corn stover can vary in its composition and moisture content due to corn variety, region, weather,soil type, and harvesting and storage practices. NREL is working to bracket this variability andunderstand its effect on the process. Recent preliminary studies on corn variety13 and stover storage effects14,15 provide a larger range of data; the major constituents’ ranges are shown inTable 2.
16

8/4/2019 NRL Report
http://slidepdf.com/reader/full/nrl-report 27/154
Component Table 2. Measured Stover Composition Ranges
B/MAP batches
12 Variety Studies13 Storage Studies
14, 15
Glucan 36.1-39.1 35.6-38.3 29-41 33.3 +/-2.8
Xylan 19.3-23.3 19.8-23.0 16-27.5 19.5 +/-2.8
Lignin 17.2-18.9 Not reported 14-30 21.1 +/-0.8
The mass balance data on corn stover presented here is preliminary and provides an estimate of its performance. We expect that as more research data on stover becomes available we will beable to make the process model more robust, tailoring its unique conversion reactions in the process to account for stover compositional effects.
17

8/4/2019 NRL Report
http://slidepdf.com/reader/full/nrl-report 28/154
II. Process Design and Cost Estimating
The following sections describe in detail the process design and cost estimation for a biomass-to-ethanol process based on core technology developed by NREL. Generally, the data used for design have been demonstrated in the laboratory or pilot plant. In some cases, we extrapolatedcurrent experimental results to take into account anticipated technology advances over the next 1
or 2 years of continued research (these extrapolations are noted in the text). More details of thedesign and cost estimation can be found in the NREL process engineering equipment database,which contains all engineering calculations and results from any vendors or costing programs.The database is described and partially summarized in Appendix A. Individual equipmentinformation (costs, number of units, sparing) is listed in Appendix B. Process Flow Diagrams(PFDs) are contained in Appendix F.
The cost estimate is based on the assumption that this is the “nth” plant, meaning that several plants using this same technology will have already been built and are operating. This means thatadditional costs for risk financing, longer start-ups, and other costs associated with first-of-a-kind plants are not included.
The on-line time is 96%, which allows for a little more than two weeks of downtime. This wasconsidered reasonable for an “nth” operating plant.
II.1 Feedstock Storage and Handling – Area 100 (PFD-P110-A101)
II.1.1 Overview
Corn stover bales are received by the plant on truck trailers. As the trucks are received, they areweighed and unloaded by forklifts. Some bales are sent to on-site storage while others are takendirectly to the conveyors. From there, the bales are conveyed to an automatic unwrapping systemthat cuts away the plastic wrapping and/or net surrounding the bales. The unwrapped bales areconveyed to a wash table, which both breaks up bales and washes dirt and grit from the corn
stover. The washed stover is then conveyed past a magnetic separator to remove tramp metal,after which it is introduced to primary and secondary shredders where the material is reduced insize. Finally, the washed and milled stover is conveyed to prehydrolysis. It is possible thatwashing and sizing requirements may be reduced as we learn how sensitive the process is to dirtand particle size for stover.
Dirty wash water is recycled and cleaned utilizing a clarifier-thickener system. The wash water is pumped to the clarifier where clean water is drawn off and recycled back to the wash tables. Theunderflow from the clarifier is then dewatered in a belt press. Because most of the wash water isrecycled through this system, the fresh water requirement is low.
II.1.2 Design Basis
The as-received corn stover feed requirement for the plant is 98,039 kg/hr (216,178 lb/hr, 2,352MT per day [2,594 ST per day]) feedstock at 15% moisture. The corn stover bales are wrappedwith plastic net to ensure they don’t break apart when handled, and may also be wrapped in plastic film to protect the bale from weather. The bales are either square or round, and theconceptual design applies equally to either shape. Square bales are typically 4 ft x 4 ft x 8 ft andweigh between 545 and 681 kg (1,200 and 1,500 lb). Round bales are approximately 70 inches indiameter, 5 ft long, and weigh around 545 kg (1,200 lb). The bales are received at the plant fromoff-site storage on large truck trailers.
18

8/4/2019 NRL Report
http://slidepdf.com/reader/full/nrl-report 29/154
Since corn stover is only harvested for a short period each year, long-term storage is required to provide feed to the plant year-round. Long-term storage will likely consist of 400-500 acres of uncovered piled rows of bales at a location (or multiple locations) reasonably close to the ethanol plant. On-site short-term storage is provided equivalent to 72 hours of production at an outsidestorage area. Bales and surrounding access ways as well as the transport conveyors will be on a
concrete slab. A concrete slab is used because of the volume of traffic required to deliver thelarge amount of corn stover required. A concrete slab will minimize the amount of standingwater in the storage area, as well as reduce the stover’s exposure to dirt. The stored material provides a short-term supply for weekends, holidays, and when normal direct delivery of materialinto the process is interrupted. This stored material will be rotated continuously, with a first-in,first-out inventory management strategy.
In the projected design, trucks are received twelve hours daily, six days a week. After the trucksare weighed on the scales (M101) the bales are off-loaded by propane-fueled forklifts (M-102)and are placed directly onto two lines of bale transport conveyors (C-101) or in the short-termstorage area. Bales are also reclaimed from short-term storage by forklifts (M-103) and loadedonto the bale transport conveyors. Each truck trailer holds 17 round bales, or 9.2 MT (10 ST),
which is significantly below the weight limit for road considerations. To satisfy plant and storagerequirements, the plant must receive 24 trucks every hour, with seven bales being unloaded everyminute. Eight forklifts were deemed necessary to satisfy this schedule; four to unload trucks andfour to draw bales from short-term storage. Each forklift is capable of operating with a 33-lb propane tank for an 8-hour shift. Individual propane canisters are refilled at bulk storage on-site.When trucks are not being unloaded, all eight forklifts are used to move feed from short-termstorage.
The original stover handling design from Harris16 stated that each truck would hold 30 bales.However, the current stover harvesting operation in Harlan, Iowa, uses trailers that hold amaximum of 17 round bales9, and this is the number used by Oak Ridge National Laboratory intheir feedstock logistics work. We feel that this information is the best currently available for
baled stover transport. Thus, the Harris design was altered to accept 17 round bales per truck instead of the original 30 bales per truck.
Bales travel to one of two bale unwrapping stations (C-102), which are sized to handle 90 baleseach per hour. Unwrapped bales are transported to wash tables (M-104). The wash tables break
the bales with a spreader bar and pull the stover up a 45° incline using metal teeth attached to adrag chain. Water is sprayed on the corn stover as it is conveyed up the incline. This washes dirtand grit from the product and allows water to drain from the stover. Washing the stover prior tocutting or shredding minimizes the amount of moisture that is absorbed by the product.
The washed stover is then discharged onto a conveyor (C-104) and passes a magnetic separator (S-103) to remove tramp metal prior to shredding. The stover is introduced to a primary shredder
and then a secondary shredder (M-105), which reduces the stover to the proper size for prehydrolysis. This size has not yet been optimized for prehydrolysis of corn stover; but theshredders were specified to produce material that is a maximum of 1.5 inches long. Eachshredder is sized to process 25.2 MT (28 ST) of stover per hour. Without experience using thiswashing concept for corn stover, the estimated moisture content of the shredded stover is 30%-40%.
The wash table design was taken from the sugar cane processing industry where they wash thesugar cane prior to processing. A 24 ft wide cane table can typically handle up to 4,082 MT
19

8/4/2019 NRL Report
http://slidepdf.com/reader/full/nrl-report 30/154
(4,500 ST) per day of cane. Since stover is less dense than cane, 2,000 MT per day is areasonable size for a 24 ft wide machine. Each table is capable of spraying approximately 568m3/hr (2,500 gpm) of wash water; more water can be used by adding more or larger spraynozzles. The actual wash water requirement for stover has not been determined; 568 m3/hr wasused in the design.
Dirty wash water is recycled through a clarifier-thickener (S-101, T-102) to remove solids withthe help of a polymer. Underflow from the thickener is dewatered in a belt press (S-102). Thedewatered underflow is primarily topsoil and corn stover fines. This is disposed of via landapplication to nearby fields. The amount of fresh water make-up will depend upon the belt-pressefficiency and the absorption capacity of the stover. Because most of the water is recycled to awash water tank (T-101) and back to the wash tables, fresh water consumption is approximately43,000 kg/hr, or 4% of the total wash water. Approximately 1% of the wash water is expected toevaporate from the open wash system (11,400 kg/hr). The other 3% of the wash water consumedis mostly absorbed by the stover; a small portion of the water leaves with the topsoil and stover fines.
Most of the equipment specified has been used in commercial straw, corn stover, or sugar cane
processing industries. The automatic unwrapping station is the only equipment that has not yet been commercially applied. Cross Wrap OY, Finland, has bale-wrapping systems for plastic filmand has developed some de-baling technology, but this must be modified for stover baleswrapped with plastic net and film. Manual bale unwrapping is feasible but would be too labor intensive for an operation of this size.
Due to the bale handling, eight forklift operators each shift are envisioned to unload trucks andmaintain the feedstock supply to the process.
II.1.3 Cost Estimation
Harris obtained vendor cost estimates for the forklifts, wash tables, shredders, clarifier-thickener,
and belt press. Cross Wrap, OY, estimated the bale unwrapping equipment cost for an “nth” plant. Harris estimated the other equipment costs (pumps, conveyors, tank, concrete) based ontheir experience.
II.2 Pretreatment and Hydrolyzate Conditioning – Area 200 (PFD-P110-A201-3)
II.2.1 Overview
The pretreatment and hydrolyzate conditioning process area converts, by hydrolysis reactions,most of the hemicellulose portion of the feedstock to soluble sugars - primarily xylose, mannose,arabinose, and galactose. Glucan in the hemicellulose and a small portion of the cellulose areconverted to glucose. This conversion is accomplished using dilute sulfuric acid and high
temperature. These conditions also solubilize some of the lignin in the feedstock and “expose”the cellulose for subsequent enzymatic hydrolysis. In addition, acetic acid is liberated from thehemicellulose hydrolysis. Degradation products of pentose sugars (primarily furfural) and hexosesugars (primarily hydroxymethyl furfural (HMF)) are also formed.
Following the pretreatment reactor, the hydrolyzate liquid and solids are flash cooled, whichvaporizes a large amount of water, a portion of the acetic acid, and much of the furfural and HMF(see Figure 10). Removing these heterocyclic aldehydes is beneficial, as they can be toxic todownstream fermentation microorganisms.
20

8/4/2019 NRL Report
http://slidepdf.com/reader/full/nrl-report 31/154
Figure 10. Pretreatment Process Area Overview, PFD-P110-A200
21

8/4/2019 NRL Report
http://slidepdf.com/reader/full/nrl-report 32/154
In addition to flash removal of aldehydes, the solids are washed and pressed to separate the liquid portion of the hydrolyzate, containing sulfuric acid, from the solids. The liquid is then“overlimed,” or raised to pH 10 (by adding lime) and held for a period of time. Neutralizationand precipitation of gypsum follow the overliming step. The gypsum is filtered out and thehydrolyzate is mixed with the solids (cellulose) and dilution water before being sent tosaccharification and co-fermentation (Area 300).
II.2.2 Design Basis
The washed, shredded corn stover is fed to pretreatment and first steamed with low-pressure
steam in a presteamer to about 100°C (see PFD-P110-A201). This steam removes noncondensables that can take up space in the reactor and allows about one-third of the total prehydrolysis reaction heat requirement to be satisfied by low-pressure steam. The presteamer 17
is fed by a set of screw conveyors with variable frequency drives to vary the feed rate as the process may dictate. The presteamer is a horizontal vessel with paddles on an interior center shaft to move the stover. The discharge from the presteamer is a variable-frequency screwconveyor leading to a blow tank. The blow tank is used as a seal between the presteamer and thereactor. The blow tank has a live bottom screw to feed the material to the reactor. Steam is
injected into the screw to pressurize it on the way to the reactor. Anco-Eaglin, Inc. (Anco-Eaglin), the manufacturer, described the steam injection as a venturi-like arrangement. The steamacts as a motive force to pull the material into the reactor. A plug is formed in the screw,maintaining the pressure in the reactor. The reactor also has paddles on an interior center shaft tohelp move the material. The close-pitch flights in the discharge screw compact the material sothat it acts as a seal coming out of the vessel.
The presteamer was designed for a maximum 20-minute residence time, which is used in pulping.The time could be shorter, depending on the particle size. The horizontal reactor vessel isdesigned to be 95% full with 10 minutes of residence time. Anco-Eaglin’s experience is that proper mixing and cooking can be achieved with this fill percentage. Because of the large vesselfill percentage, fewer vessels are required. The original Anco-Eaglin quote was for a 10-minute
residence time; the reactor cost was adjusted for the shorter target residence time of 2 minutes.Three reactor trains (each including a presteamer, blow tank, reactor) are used. NREL and other pretreatment research groups are studying the operability of a continuous reactor at shortresidence times.
After the stover is steamed, acid is added to the reactor. Concentrated sulfuric acid is diluted withevaporator condensate (see Section II.5) until the mixture (the total water, including steam andacid) in the reactor is 1.1% sulfuric acid. The total stover mixture now constitutes 30% insoluble
solids. The reactor is brought up to temperature by direct injection of 13 atm (191 psia) (192°Csaturation temperature and 76°C superheat) turbine extraction steam. The pretreatment reactor
(M-202) operates at 12.1 atm (177 psia) pressure and 190°C. Heat losses from the reactor werenot accounted for in the energy balance calculations. Table 3 summarizes the conditions in the
pretreatment reactor.
Table 3. Pretreatment Hydrolyzer Conditions
Acid Concentration 1.1%
Residence Time 2 minutes
Temperature 190°C
Pressure 12.1 atm (177 psia)
Solids in the Reactor 30%
22

8/4/2019 NRL Report
http://slidepdf.com/reader/full/nrl-report 33/154
Table 4 summarizes the resulting reactions and the conversions that take place in the pretreatmenthydrolyzer. The conversion value is the fraction of reactant converted to product. The other hemicellulose carbohydrates (arabinan, mannan, galactan) are assumed to have the same reactionsand conversions as xylan.
Table 4. Pretreatment Hydrolyzer Reactions and Conversions
Reaction Reactant Fraction Converted
to Product
(Glucan)n + n H2O → n Glucose Glucan 0.07
(Glucan)n + m H2O → m Glucose Oligomer Glucan 0.007
(Glucan)n + ½n H2O → ½n Cellobiose Glucan 0.007
(Xylan)n + n H2O → n Xylose Xylan 0.90
(Xylan)n + m H2O → m Xylose Oligomer Xylan 0.025
(Xylan)n + → n Furfural + 2n H2O Xylan 0.05
Acetate → Acetic Acid Acetate 1.0(Lignin)n → n Soluble Lignin Lignin 0.05
Glucose and xylose oligomers are sugars bound in soluble oligomer form.
The exiting material from the pretreatment reactor is flash cooled to 1 atm (14.7 psia) in T-203.The flash vapor is modeled with the Hayden and O’Connell18 equation of state to specificallymodel the vaporization of acetic acid. Acetic acid creates dimers in the vapor phase and thisequation of state properly accounts for them. If the vapor phase dimerization of acetic acid is notaccounted for, the loss of acetic acid in the vapor will be over estimated. In this flash, 7.8% of the acetic acid and 61% of the furfural and HMF are removed.
The flash vapor, about 53,000 kg/hr (117,000 lb/hr) of essentially 100°C steam, is used to preheat
the beer column feed in H-201. During this exchange, the beer column feed is heated to 95°Cand the entire flash vapor from T-203 is condensed. The condensed flash vapor is sent towastewater treatment (Area 600).
After a residence time of 15 minutes in the flash tank, the hydrolyzate slurry with 21% insoluble
solids is conveyed to a Pneumapress pressure filter (S-205) to separate the solids and the liquids(see PFD-P110-202). The liquids are separated from the solids to facilitate conditioning of theliquid portion to reduce toxicity of the stream to downstream fermentation.
Harris considered different types of solid-liquid separation equipment19; two makes of decanter centrifuges and several types of filters (filter press, belt filter press, pressure filter). ThePneumapress, a pressure belt filter press, provided the best recovery of solids, and solubles with
minimal wash water.
The Pneumapress pressure filter provides automated batch liquid-solid separation by forcingcompressed air (125 psig) through the biomass slurry and filter media to displace liquid,maximizing the solid content of the cake on the filter. Very high cake solids levels and cakewashing efficiencies are advantages to using this equipment. Bench scale testing19 has shown thatdry cakes, near 55% insoluble solids with 99.5% insoluble solids recovery, are possible with thisunit. Those tests also showed that 95%-96% cake washing efficiencies are possible in two washcycles with a wash water to feed mass ratio of 0.58. The cycle times of this batch unit are
23
8/4/2019 NRL Report
http://slidepdf.com/reader/full/nrl-report 34/154
typically quite short (<10 minutes). The Pneumapress filter was also cost competitive with theother types of separation equipment.
The cyclic operation of the Pneumapress pressure filter system is as follows. Pretreated slurry is pumped from the blowdown tank into the hydrolyzate mixing tank (T-205) and mixed withrecycled filtrate liquor (from tank T-213) to reduce the insoluble solids in the slurry to a
pumpable level, having a suspended solids concentration that is capable of being fed to thePneumapress, approximately 10%. That diluted slurry is pumped into the Pneumapress, building pressure in the Pneumapress and pushing filtrate through the filter. The filtrate flows to the washfiltrate tank (T-213). The cake is then washed with liquor that is pumped from the primaryfiltrate tank (T-211). Filtrate from that cycle also flows into the wash filtrate tank (T-213).Finally, the cake is washed with recycle water (stream 252) and air is blown through it to displacethe liquor, which is primarily water. Filtrate from the final washing flows into the primary filtratetank (T-211). The air is sent through a condenser to remove water and other condensables andthen to the combustor as combustion air. Volatile organic compounds (VOC) in the air arecombusted. Condensate is sent to wastewater treatment.
The final cake is conveyed off of the Pneumapress onto a transport conveyor and into the
slurrying tank (T-232) where it is mixed with conditioned hydrolyzate liquor and additionalrecycle water. Product liquor to be conditioned is pumped from both the primary filtrate tank andthe wash filtrate tank to a heat exchanger (H-200) where it is cooled to 50°C using cooling water.The temperature of 50°C was chosen because the next unit operation, overliming, is run at thattemperature. Liquor from the wash filtrate tank is also used to dilute the pretreated slurry.
The plant air compressor provides air at 9.5 atm (140 psia) to the Pneumapress filters.
After the separation step the material is overlimed (see PFD-P110-A203). Lime is added in tank T-209 to raise the pH to 10. The residence time in T-209 is one hour to allow for the overliming“reactions” to occur.20 Based on the experience of Delta-T, the agitation for this application isassumed to be 98.5 W/m3 (0.5 hp/1000 gal). The liquid is then adjusted to the fermentation pH of
4.5 in tank T-224 and held for four hours. This long residence time allows the resulting gypsumcrystals to form to a size that can be readily separated by hydrocyclone and rotary drum filtrationin series.21 Agitation power for T-224 was set at 98.5 W/m3 (0.5 hp/1000 gal), again based onDelta-T’s experience. The filtration is assumed to remove 99.5% of the precipitated gypsum andthe solids are assumed to contain 20% liquid.22 At 80% solids, gypsum can be handled as a drysolid. This approach was recommended by vendors and is typical of dewatering equipment usedin the utility flue gas desulfurization industry to achieve high gypsum solids concentrationscommercially.
After the gypsum is filtered, the conditioned hydrolyzate liquid is recombined with hydrolyzatesolids (which were separated in S-205) in Tank T-232 (see PFD-P110-A202). The residence timein this tank is minimal (15 minutes) just long enough to afford good mixing. The agitation for this
application is assumed to be 394 W/m3
(2 hp/1000 gal) based on the experience of Delta-T. Theresulting slurry, now conditioned, pH-adjusted, and properly diluted, is pumped to fermentation(Area 300).
II.2.3 Cost Estimation
All pumps, tanks, screw conveyors, and agitators for this section were estimated using theICARUS Process Evaluator.23 The material of construction for all equipment except the pretreatment reactor (M-202), flash tank (T-203) and Pneumapress equipment is 304SS, based on
24

8/4/2019 NRL Report
http://slidepdf.com/reader/full/nrl-report 35/154
the experience of Delta-T. The material of construction of the flash tank is SS316 because
additional acid resistance at temperatures higher than 100°C is necessary. Harris recommendedmostly SS316 for the solid-liquid separation equipment in contact with the process.
Harris obtained quotes for the continuous pretreatment reactors from Anco-Eaglin, Inc. Theconstruction materials were assumed to be Incoloy 825-clad steel for all parts in contact with
acid, based on corrosion data generated by Intercorr of Houston via Harris17. This includes vessel paddles and shafts. Stainless steel (316L) was assumed for most other reactor parts including the presteamer. Anco-Eaglin felt the cost estimate provided reflected an nth plant cost because it was based on similarly designed equipment currently in service.
NREL engineers have developed a spreadsheet-based model to predict general corrosion rates inacid and temperature environments for various alloys, based on sets of corrosion data fromvarious corrosion studies performed in the last several years.24 While not rigorous, it can provideguidance when considering metallurgy for varying conditions. For solid Incoloy 825, thecorrosion rate at the target pretreatment conditions is expected to be less than 20 mils per year (amil is a thousandth of an inch ), which is considered satisfactory resistance. Figure 11 shows theeffect of temperature and acid concentration on corrosion rate for Incoloy 825. As either
parameter increases, the corrosion resistance is reduced.
100
1.5 wt% Sulfuric Acid
0.5 wt% Sulfuric Acid
Good Corrosion
Resistance
Satisfactory
Corrosion
Resistance
Unsatisfactory Corrosion Resistance
10
C o r r o s i o n R a t e ( m p y )
1
0.1
0.01
0 50 100 150 200
Temperature (°C)
Figure 11. Corrosion Resistance of Incoloy 825
The cost estimate for the liquid solid separators S-205 and S-222 are based on vendor quotationsfrom Pneumapress and Komline Sanderson respectively. Three Pneumapress units are requiredto accommodate the process flowrate.
25
250

8/4/2019 NRL Report
http://slidepdf.com/reader/full/nrl-report 36/154
II.2.4 Achieving the Design Case
Table 5 lists conditions that have produced good yields from NREL’s 1 ton per day, continuousSunds vertical reactor and conditions that produced higher yields from the 4L steam gun.
Table 5. Experimental Pretreatment Hydrolyzer ConditionsSunds Reactor25 Steam Gun26
Acid Concentration 1.16% 1.1%
Residence Time 6.2 minutes 2 minutes
125Temperature
179°C 190°C
Pressure 9.7 atm (142 psia) 12.1 atm (177 psia)
Solids in the Reactor 19% 37 – 47%
Table 6 summarizes the resulting reactions and the conversions for the experimental runs in eachreactor. The measured values were taken from experiments conducted at the conditions in Table5. For the Sunds run, the total carbon recovery was approximately 105%, so about 5% more
carbon was measured in the product streams than in the feed stream. This carbon recovery isslightly higher than previous experiments but is within a standard range of carbon mass balanceclosure of 90 to 105%. High or low carbon closure is typically caused by imprecision in theexperimental and analytical methods, or the creation of degradation products that are notidentified in the analysis.
Table 6. Experimental Pretreatment Hydrolyzer Reactions and Conversions
Reaction Reactant Fraction Converted to Product Sunds
Reactor25 Steam
Gun26 Design
Case (Glucan)n + n H2O → n Glucose Glucan 0.0675 0.081 0.07
(Glucan)n + m H2O → m Glucose
Oligomer
Glucan 0.006 0.0 0.007
(Glucan)n + ½nH2O
→ ½n Cellobiose Glucan 0.008 0.0 0.007
(Xylan)n + n H2O → n Xylose Xylan 0.675 0.837 0.90
(Xylan)n + m H2O → m Xylose Oligomer Xylan 0.029 0.126 0.025
(Xylan)n + → n Furfural + 2nH2O
Xylan 0.159 0.03 0.05
Acetate → Acetic Acid Acetate 1.0 0.638 1.0
(Lignin)n → n Soluble Lignin Lignin NotReported
NotReported
0.05
Glucose and xylose oligomers are sugars bound in soluble oligomer form.
The design case conditions and conversions for the reactor are based on the experimental runs inthe Sunds and the 4L steam gun. Lignin solubilization and solids loading values are based onrecent runs in the Sunds pilot reactor 27. Conversion of the minor hemicellulose carbohydrates(arabinan, mannan and galactan) was assumed the same as xylan for the design case. Scale-up of these conditions to a continuous horizontal reactor is underway in addition to running theseconditions in the vertical one dry ton per day Sunds reactor. The xylose oligomers may bereduced via optimization of the pretreatment conditions, a hold tank, or hemicellulase activity inthe enzyme preparation. The Anco-Eaglin reactor is a horizontal configuration with a throughput
26

8/4/2019 NRL Report
http://slidepdf.com/reader/full/nrl-report 37/154
of about 700 dry MT per day for one unit. Understanding how the reaction kinetics change withdifferent reactors sizes and with configuration is important to know when the pretreatment has been scaled up adequately that accurate prediction is possible at larger scales. Data from thesethree reactors will be used to understand and predict conversion rates as a function of size andconfiguration in addition to process parameters like temperature. While Anco has not previouslyworked with corn stover, they are pursuing opportunities to do so.
The mechanism of detoxification by overliming is not completely understood. Overliming is atemperature and pH treatment designed to aid the conversion of hydrolyzate sugars to ethanolduring fermentation28. The procedure varies in the literature but always includes an adjustment of pH, a temperature increase, a hold at temperature for 15 to 30 minutes, and a hot filtration.Overliming was originally designed to limit the calcium concentration in solution to organism-tolerant levels. In many organisms calcium is involved in membrane transport, so minimumconcentrations may be necessary for efficient sugar uptake.
Research is currently under way to determine if the overliming process is removing, adding, or changing the form of a component, or a combination of all of these. 29 We now know thatcontrolling calcium concentrations is not the only advantage of overliming. Overliming also
appears to catalyze condensation reactions in lignin-derived compounds. These reactionsdetoxify the hydrolyzate and the detoxification is more efficient at higher pH. Investigations intothe specific functional groups involved in this detoxification are being performed under a NRELsubcontract. We hope to use knowledge of the actual chemical reactions involved in lignindetoxification to guide selection of alternatives to overliming that do not require lime additionand gypsum removal. Enzyme systems that condense lignin or processes that remove very lowmolecular weight lignin are possible alternatives.
One of the biggest challenges in overliming at an industrial scale will be accurate pH control. By pH 11, as much as 30% of the glucose may be lost to HMF and other side reactions. Severalfactors increase the probability of overshooting pH endpoints during overliming. The natural buffering capacity of hydrolyzates causes neutralization reactions to be slow. Measurements
using pH membrane probes are affected by temperature and the presence of dissolved organiccompounds (sugars and lignin).
II.3 Saccharification and Co-Fermentation–Area 300 (PFD-P110-A301-2)
II.3.1 Overview
Two different operations are performed in this process area—saccharification of the cellulose toglucose using cellulase enzymes, and fermentation of the resulting glucose and other sugars (fromthe dilute acid pretreatment of hemicellulose, Area 200) to ethanol.
Hydrolysis, or saccharification, occurs first, separately from the fermentation. The separate
saccharification step enables operation of the saccharification step at an elevated temperature totake advantage of increased enzyme activity and reduce the time and amount of enzyme required.The enzyme used to saccharify the cellulose is purchased from an enzyme manufacturer. Thecellulase enzyme and diluted, detoxified hydrolyzate are continuously added to a train of five 1-million gallon vessels.
Cellulase enzyme is actually a collection of enzymes. This collection is comprised of: (1)endoglucanases, which attack randomly along the cellulose fiber to reduce polymer size rapidly;(2) exoglucanases, which attack the ends of cellulose fibers, allowing it to hydrolyze highly
27

8/4/2019 NRL Report
http://slidepdf.com/reader/full/nrl-report 38/154
crystalline cellulose; and (3) β-glucosidase, which hydrolyzes cellobiose to glucose. Several bacteria and fungi naturally produce these enzymes, including bacteria in ruminant and termiteguts and white rot fungus.30 The most common organism used to produce cellulase industrially isTrichoderma reesei. Genencor International and Novozymes Biotech, the two largest enzymemanufacturers in the world are developing more cost effective cellulase enzymes. DOE isfunding this important work, which will improve the economic viability of biomass conversion.
For fermentation, the recombinant Z. mobilis bacterium31 is used as the biocatalyst. This form of Z. mobilis will ferment glucose and xylose to ethanol. It is assumed that mannose and galactosesugars are also fermented in this design. Several research institutions32 are geneticallyengineering strains, such as Z. mobilis, to utilize additional sugars, or are identifying naturallyoccurring organisms that metabolize hemicellulosic sugars.
The Z. mobilis must be “grown” in a seed fermentation train of vessels in this process area.Saccharified slurry and nutrients are combined with an initial seed inoculum (grown in thelaboratory) in a very small vessel. The result of each seed batch is used as the inoculum for thenext size seed increment. This series of scale-ups is continued until the last step is large enoughto support the production fermentation.
Finally, the seed inoculum, nutrients, and saccharified slurry are added to a train of continuousfermentors. It is really a simultaneous saccharification and co-fermentation (SSCF) configurationat this point, because although the temperature in the fermentation tanks will be lower bynecessity because of the ethanologen’s thermal tolerance, the enzyme will still continue tohydrolyze cellulose. The number of fermentors will be about five 1-million gallon vessels in atrain or line. The resulting ethanol broth is collected in a beer well (storage tank) before it is pumped to distillation.
II.3.2 Design Basis
Detoxified and diluted hydrolyzate fed to the saccharification vessels is about 20% total solids 33
(soluble and insoluble solids) including the dilution that will occur when the cellulase stream ismixed in. The enzyme loading is determined by the amount of cellulose present in thehydrolyzate and the target hydrolysis conversion level with the combined residence time of thesaccharification tanks and the fermenters. A heat exchanger (H-301) heats the 51°C hydrolyzateslurry exiting the re-acidification tank (T-224) to 65°C, the saccharification temperature, usinglow-pressure steam.
Saccharification takes place in five 950,000-gal vessels (see PFD-P110-A302). The totalresidence time is estimated at 36 hours. Because the cellulase enzyme is still being developed,the actual split of time between saccharification and fermentation (actually simultaneoussaccharification and fermentation) is not known, but it is likely that some time in an SSF modewill be needed to reach 90% hydrolysis yields. The tanks are cooled using a pump-around loop
that consists of a centrifugal pump (P-310) and heat exchanger (H-310). The heat exchanger iscooled with cooling water. For this design case, cellulase is fed at the rate of 12 internationalfilter paper units (IFPU) per gram of cellulose assuming an enzyme concentration of 50FPU/mL34. Target conditions, developed with the enzyme manufacturers, take advantage of improved thermal tolerance to reduce the required time and loading; they are summarized inTable 7.
28
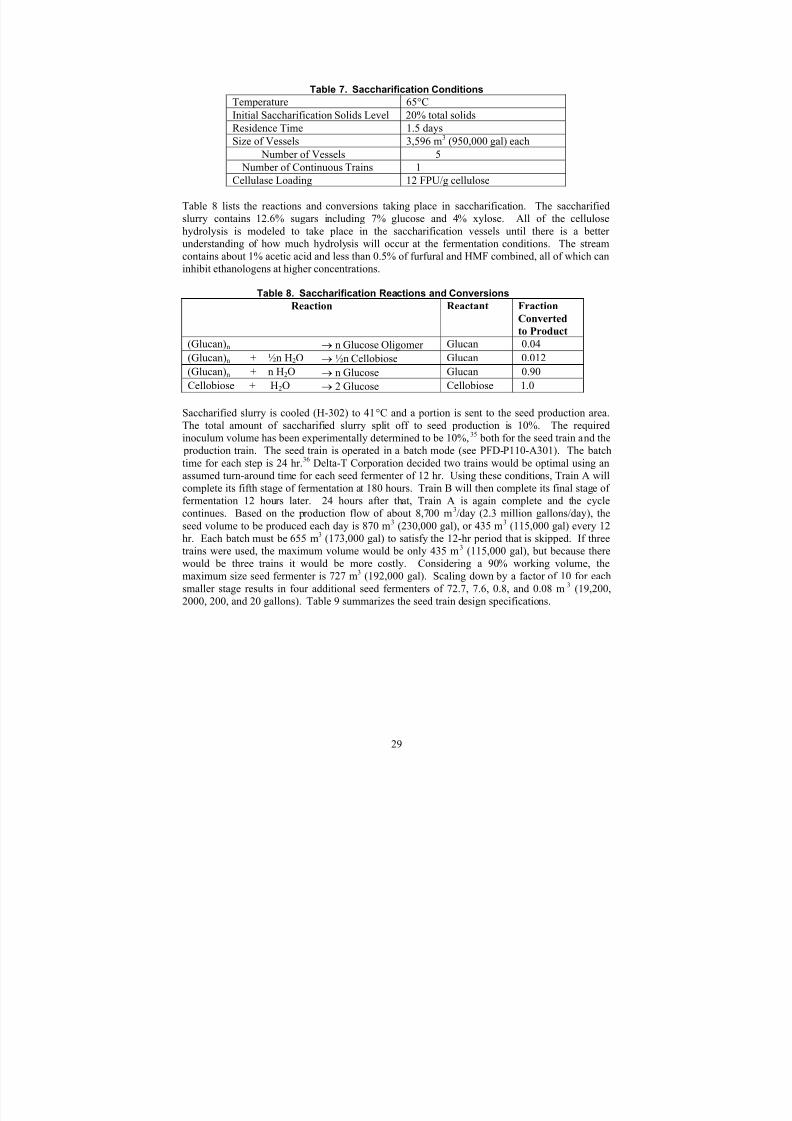
8/4/2019 NRL Report
http://slidepdf.com/reader/full/nrl-report 39/154
Table 7. Saccharification Conditions
Temperature 65°C
Initial Saccharification Solids Level 20% total solids
Residence Time 1.5 days
Size of Vessels 3,596 m3 (950,000 gal) each
Number of Vessels 5 Number of Continuous Trains 1
Cellulase Loading 12 FPU/g cellulose
Table 8 lists the reactions and conversions taking place in saccharification. The saccharifiedslurry contains 12.6% sugars including 7% glucose and 4% xylose. All of the cellulosehydrolysis is modeled to take place in the saccharification vessels until there is a better understanding of how much hydrolysis will occur at the fermentation conditions. The streamcontains about 1% acetic acid and less than 0.5% of furfural and HMF combined, all of which caninhibit ethanologens at higher concentrations.
Table 8. Saccharification Reactions and Conversions
Reaction Reactant Fraction Converted
to Product
(Glucan)n → n Glucose Oligomer Glucan 0.04
(Glucan)n + ½n H2O → ½n Cellobiose Glucan 0.012
(Glucan)n + n H2O → n Glucose Glucan 0.90
Cellobiose + H2O → 2 Glucose Cellobiose 1.0
Saccharified slurry is cooled (H-302) to 41°C and a portion is sent to the seed production area.The total amount of saccharified slurry split off to seed production is 10%. The requiredinoculum volume has been experimentally determined to be 10%,35 both for the seed train and the
production train. The seed train is operated in a batch mode (see PFD-P110-A301). The batchtime for each step is 24 hr.36 Delta-T Corporation decided two trains would be optimal using anassumed turn-around time for each seed fermenter of 12 hr. Using these conditions, Train A willcomplete its fifth stage of fermentation at 180 hours. Train B will then complete its final stage of fermentation 12 hours later. 24 hours after that, Train A is again complete and the cyclecontinues. Based on the production flow of about 8,700 m3/day (2.3 million gallons/day), theseed volume to be produced each day is 870 m3 (230,000 gal), or 435 m3 (115,000 gal) every 12hr. Each batch must be 655 m3 (173,000 gal) to satisfy the 12-hr period that is skipped. If threetrains were used, the maximum volume would be only 435 m3 (115,000 gal), but because therewould be three trains it would be more costly. Considering a 90% working volume, themaximum size seed fermenter is 727 m3 (192,000 gal). Scaling down by a factor of 10 for eachsmaller stage results in four additional seed fermenters of 72.7, 7.6, 0.8, and 0.08 m3 (19,200,
2000, 200, and 20 gallons). Table 9 summarizes the seed train design specifications.
29

8/4/2019 NRL Report
http://slidepdf.com/reader/full/nrl-report 40/154
Table 9. Seed Train Specifications33,35,36
Inoculum Level 10% of total
Batch Time 24 hr
Fermenter Turn-Around Time 12 hr
Number of Trains 2
Number of Fermenter Stages 5Maximum Fermenter Volume (F-305) 727 m3 (173,000 gal)
Corn Steep Liquor (CSL) Level 0.5%
Diammonium Phosphate (DAP) Level 0.67 g/L fermentation broth
The two largest seed fermenters are large tanks (F-304 and F-305) with internal cooling coils (H-304 and H-305) and agitators (A-304 and A-305) that are costed separately. The small fermenters
are package units (agitator and jacket included). Well water at 13°C, supplemented with cooling
water is used to maintain the fermenters at 41°C. The well water is then used as make-up water to the process. The coil size was calculated using a tank coil correlation from Kern37. Theagitators were sized based on Delta-T’s experience with similar systems. The design numbers for agitation were 20 W/m3 (0.1 hp/1000 gal) for the largest fermenter (F-305) and 60 W/m3 (0.3hp/1000 gal) for F-304. The three smaller seed fermenters (F-301-3) are designed as package- jacketed, agitated reactors. ICARUS23 was used to estimate the agitation powers of 0.75 kW (1hp) for F-301, 3.7 kW (5 hp) for F-302, and 18.6 kW (25 hp) for the F-303.
Table 10 gives the reactions and conversions used in the seed fermentations to describe themicroorganism growth and sugar metabolism. Full mass balances have not been attempted for conditions that favor cell growth as they would in the seed train38.
30

8/4/2019 NRL Report
http://slidepdf.com/reader/full/nrl-report 41/154
Table 10. Seed Train Reactions and Conversions
Reaction Reactant Fraction Converted
to Product38
Glucose → 2 Ethanol + 2 CO2 Glucose 0.90
Glucose + CSL +0.018 DAP
→ 6 Z. mobilis + 2.4 H2O + 0.3 O2 Glucose 0.04
Glucose + 2 H2O → 2 Glycerol + O2 Glucose 0.004
Glucose + 2 CO2 → 2 Succinic Acid + O2 Glucose 0.006
Glucose → 3 Acetic Acid Glucose 0.015
Glucose → 2 Lactic Acid Glucose 0.002
3 Xylose → 5 Ethanol + 5 CO2 Xylose 0.80
Xylose + 0.835 CSL+ 0.015DAP
→ 5 Z. mobilis + 2 H2O + 0.25 O2 Xylose 0.04
3 Xylose + 5 H2O → 5 Glycerol + 2.5 O2 Xylose 0.003
Xylose + H2O → Xylitol + 9.5 O2 Xylose 0.0463 Xylose + 5 CO2 → 5 Succinic Acid + 2.5 O2 Xylose 0.009
2 Xylose → 5 Acetic Acid Xylose 0.014
3 Xylose → 5 Lactic Acid Xylose 0.002
Corn steep liquor (CSL) and Diammonium Phosphate (DAP) are both nitrogen sources required for Z. mobilisgrowth. The usage rates for these nutrients are the same as used in laboratory fermentations; however thestoichiometry used to model the reactions has not been experimentally verified.
Two high-capacity transfer pumps are used (P-302) to transfer the seed to the seed hold tank (T-301) in a timely fashion (approximately 2.5 hr). Two pumps are required because this is thelargest rotary lobe pump available from Waukesha Pump Company. A rotary lobe pump is usedto avoid damaging the microorganisms by pump sheer.
The seed hold tank (T-301) is sized to hold 20% more than the fifth seed reactor (F-305). Arotary lobe pump (P-301) is then used to continuously feed the seed to the productionfermentation train.
Co-fermentation is conducted in 950,000-gal vessels (see PFD-P110-A302). The total residencetime is estimated at 36 hours for the sugar fermentation. It is expected that saccharification willcontinue in the fermentors, slowed by the lower temperature, but perhaps enhanced by theremoval of glucose. This SSCF aspect is not modeled. In all, five vessels are required for thisresidence time and are arranged in a continuous train. Table 11 summarizes the conditions in thefermentation vessels.
31
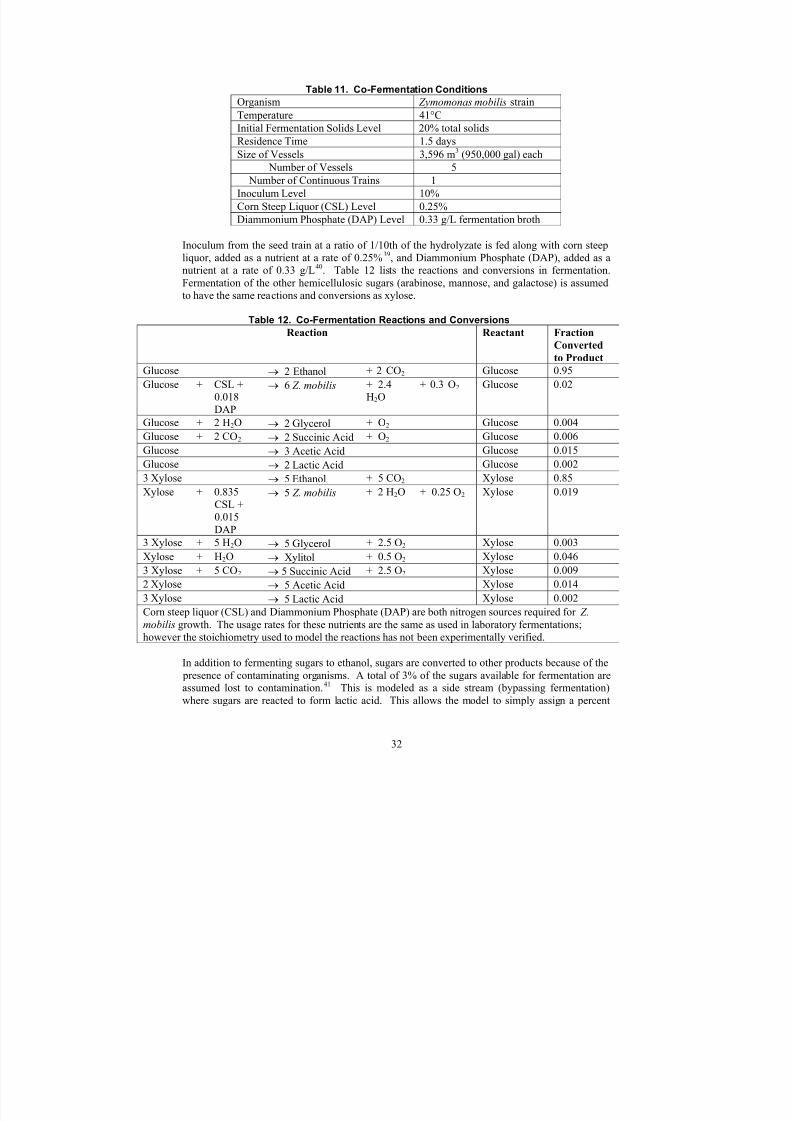
8/4/2019 NRL Report
http://slidepdf.com/reader/full/nrl-report 42/154
Table 11. Co-Fermentation Conditions
Organism Zymomonas mobilis strain
Temperature 41°C
Initial Fermentation Solids Level 20% total solids
Residence Time 1.5 days
Size of Vessels 3,596 m3 (950,000 gal) each Number of Vessels 5
Number of Continuous Trains 1
Inoculum Level 10%
Corn Steep Liquor (CSL) Level 0.25%
Diammonium Phosphate (DAP) Level 0.33 g/L fermentation broth
Inoculum from the seed train at a ratio of 1/10th of the hydrolyzate is fed along with corn steepliquor, added as a nutrient at a rate of 0.25%39, and Diammonium Phosphate (DAP), added as anutrient at a rate of 0.33 g/L40. Table 12 lists the reactions and conversions in fermentation.Fermentation of the other hemicellulosic sugars (arabinose, mannose, and galactose) is assumedto have the same reactions and conversions as xylose.
Table 12. Co-Fermentation Reactions and Conversions
Reaction Reactant Fraction Converted
to Product
Glucose → 2 Ethanol + 2 CO2 Glucose 0.95
Glucose + CSL +0.018DAP
→ 6 Z. mobilis + 2.4H2O
+ 0.3 O2 Glucose 0.02
Glucose + 2 H2O → 2 Glycerol + O2 Glucose 0.004
Glucose + 2 CO2 → 2 Succinic Acid + O2 Glucose 0.006
Glucose → 3 Acetic Acid Glucose 0.015Glucose → 2 Lactic Acid Glucose 0.002
3 Xylose → 5 Ethanol + 5 CO2 Xylose 0.85
Xylose + 0.835CSL +0.015DAP
→ 5 Z. mobilis + 2 H2O + 0.25 O2 Xylose 0.019
3 Xylose + 5 H2O → 5 Glycerol + 2.5 O2 Xylose 0.003
Xylose + H2O → Xylitol + 0.5 O2 Xylose 0.046
3 Xylose + 5 CO2 → 5 Succinic Acid + 2.5 O2 Xylose 0.009
2 Xylose → 5 Acetic Acid Xylose 0.014
3 Xylose → 5 Lactic Acid Xylose 0.002
Corn steep liquor (CSL) and Diammonium Phosphate (DAP) are both nitrogen sources required for Z.mobilis growth. The usage rates for these nutrients are the same as used in laboratory fermentations;however the stoichiometry used to model the reactions has not been experimentally verified.
In addition to fermenting sugars to ethanol, sugars are converted to other products because of the presence of contaminating organisms. A total of 3% of the sugars available for fermentation areassumed lost to contamination.41 This is modeled as a side stream (bypassing fermentation)where sugars are reacted to form lactic acid. This allows the model to simply assign a percent
32
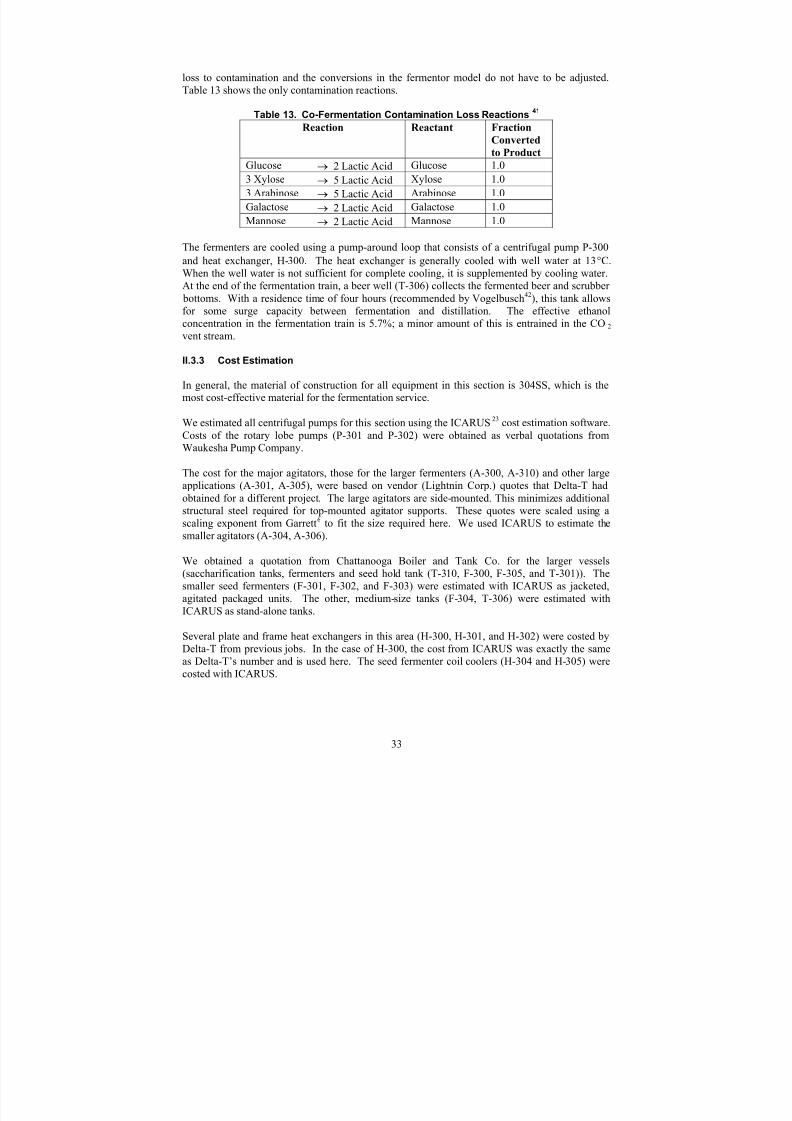
8/4/2019 NRL Report
http://slidepdf.com/reader/full/nrl-report 43/154
loss to contamination and the conversions in the fermentor model do not have to be adjusted.Table 13 shows the only contamination reactions.
Table 13. Co-Fermentation Contamination Loss Reactions 41
Reaction Reactant Fraction Converted
to ProductGlucose → 2 Lactic Acid Glucose 1.0
3 Xylose → 5 Lactic Acid Xylose 1.0
3 Arabinose → 5 Lactic Acid Arabinose 1.0
Galactose → 2 Lactic Acid Galactose 1.0
Mannose → 2 Lactic Acid Mannose 1.0
The fermenters are cooled using a pump-around loop that consists of a centrifugal pump P-300
and heat exchanger, H-300. The heat exchanger is generally cooled with well water at 13°C.When the well water is not sufficient for complete cooling, it is supplemented by cooling water.At the end of the fermentation train, a beer well (T-306) collects the fermented beer and scrubber
bottoms. With a residence time of four hours (recommended by Vogelbusch
42
), this tank allowsfor some surge capacity between fermentation and distillation. The effective ethanolconcentration in the fermentation train is 5.7%; a minor amount of this is entrained in the CO2
vent stream.
II.3.3 Cost Estimation
In general, the material of construction for all equipment in this section is 304SS, which is themost cost-effective material for the fermentation service.
We estimated all centrifugal pumps for this section using the ICARUS23 cost estimation software.Costs of the rotary lobe pumps (P-301 and P-302) were obtained as verbal quotations fromWaukesha Pump Company.
The cost for the major agitators, those for the larger fermenters (A-300, A-310) and other largeapplications (A-301, A-305), were based on vendor (Lightnin Corp.) quotes that Delta-T hadobtained for a different project. The large agitators are side-mounted. This minimizes additionalstructural steel required for top-mounted agitator supports. These quotes were scaled using ascaling exponent from Garrett6 to fit the size required here. We used ICARUS to estimate thesmaller agitators (A-304, A-306).
We obtained a quotation from Chattanooga Boiler and Tank Co. for the larger vessels(saccharification tanks, fermenters and seed hold tank (T-310, F-300, F-305, and T-301)). Thesmaller seed fermenters (F-301, F-302, and F-303) were estimated with ICARUS as jacketed,agitated packaged units. The other, medium-size tanks (F-304, T-306) were estimated withICARUS as stand-alone tanks.
Several plate and frame heat exchangers in this area (H-300, H-301, and H-302) were costed byDelta-T from previous jobs. In the case of H-300, the cost from ICARUS was exactly the sameas Delta-T’s number and is used here. The seed fermenter coil coolers (H-304 and H-305) werecosted with ICARUS.
33

8/4/2019 NRL Report
http://slidepdf.com/reader/full/nrl-report 44/154
II.3.4 Achieving the Design Case
Table 14 summarizes the experimental and design case conditions for the saccharification area.The research to date has been with SSCF at lab scale to test enzyme activity, since the optimizedenzymes are not yet available.
Table 14. Experimental Saccharification ConditionsExperimental43 Design Case
Mode SSF Saccharification
Temperature 32°C 65°C
Initial Saccharification Solids Level 6% cellulose 22% total solids
Residence Time 7 days 1.5 days
Size of Vessels Shake flask 3596 m3 (950,000 gal) each
Number of Vessels N/A 5
Number of Continuous Trains N/A 1
Cellulase Loading 15 FPU/g cellulose 12 FPU/g cellulose
Table 15 shows the reactions and experimental saccharification conversions for corn stover as
measured using NREL’s SSF experimental protocols. These conversions are used in the designcase. The 90% cellulose to glucose yield has been achieved at 15 FPU/g cellulose in an SSCFmode and is considered achievable at a lower enzyme loading of an optimized enzyme. Aseparate saccharification step will allow better use of temperature to optimize enzyme performance.
Table 15. Experimental Saccharification Reactions and Conversions
Reaction Reactant Fraction Converted to Product Experimental
43 Design Case (Glucan)n → n Glucose Oligomer Glucan 0.04 0.04
(Glucan)n + ½n H2O → ½n Cellobiose Glucan 0.012 0.012
(Glucan)n + n H2O → n Glucose Glucan 0.90 0.90
Cellobiose + H2O → 2 Glucose Cellobiose 1.0 1.0
The seed train in NREL’s pilot plant is similar to that outlined in the design, and has been runsuccessfully to grow yeast for several campaigns, each lasting several weeks.
Table 16 summarizes the experimental and design case conditions for co-fermentation. Theexperimental conditions are from a yellow poplar run. This fermentation is reported because nofully mass-balanced fermentations using pretreated corn stover have been run to date.
34

8/4/2019 NRL Report
http://slidepdf.com/reader/full/nrl-report 45/154
Table 16. Experimental Co-Fermentation Conditions
Experimental44 Design Case
Mode SSCF Co-fermentation
Organism Zymomonas mobilis 39676-pZB4L Zymomonas mobilis strain
Temperature 32°C 41°C
Initial Fermentation Solids Level 12.6% 20%Residence Time 7 days 1.5 days
Size of Vessels ~800 mL working volume fermenters 3596 m3 (950,000 gal) each
Number of Vessels N/A 5
Number of Continuous Trains N/A 1
Inoculum Level 0.5 OD ~ 10% 10%
Corn Steep Liquor (CSL) Level 0.25% (clarified) 0.25%
Diammonium Phosphate (DAP) Level 0.33 g/L fermentation broth 0.33 g/L fermentation broth
Table 17 shows experimentally measured fermentation yields for glucose and xylose from theyellow poplar run44 and the design case conversions. The conversions of sugars to other productsresulting from Z. mobilis metabolism are also listed.
Table 17. Experimental Co-Fermentation Reactions and Conversions
Reaction Reactant Fraction Converted to Product
Experimental44 Design
Case Glucose → 2 Ethanol + 2 CO2 Glucose 0.95 0.95
Glucose + CSL +0.018DAP
→ 6 Z. mobilis + 2.4H2O
+ 0.3 O2 Glucose 0.02 0.02
Glucose + 2 H2O → 2 Glycerol + O2 Glucose 0.004 0.004
Glucose + 2 CO2 → 2 Succinic Acid + O2 Glucose Not measured 0.006
Glucose → 3 Acetic Acid Glucose 0.015 0.015Glucose → 2 Lactic Acid Glucose 0.002 0.002
3 Xylose → 5 Ethanol + 5 CO2 Xylose 0.902 0.85
Xylose + 0.835CSL +0.015DAP
→ 5 Z. mobilis + 2 H2O + 0.25 O2 Xylose 0.019 0.019
3 Xylose + 5 H2O → 5 Glycerol + 2.5 O2 Xylose 0.003 0.003
Xylose + H2O → Xylitol + 0.5 O2 Xylose 0.046 0.046
3 Xylose + 5 CO2 → 5 Succinic Acid + 2.5 O2 Xylose Not measured 0.009
2 Xylose → 5 Acetic Acid Xylose 0.014 0.014
3 Xylose → 5 Lactic Acid Xylose 0.002 0.002
Corn steep liquor (CSL) and Diammonium Phosphate (DAP) are both nitrogen sources required for Z. mobilis growth.The usage rates for these nutrients are the same as used in laboratory fermentations; however the stoichiometry used tomodel the reactions has not been experimentally verified.
High glucose and xylose to ethanol yields been achieved on yellow poplar feedstock using Z.mobilis in the laboratory. However, an engineered organism may not achieve a xylose to ethanolyield that high in a less controlled fermentation, so the conversion was lowered slightly in themodel. Organism development is a crucial activity in enabling fermentation of not only xylose at
35

8/4/2019 NRL Report
http://slidepdf.com/reader/full/nrl-report 46/154
high levels, but also the other sugars including the minor hemicellulose sugars: arabinose,mannose and galactose. Tolerance to compounds in the hydrolyzate, particularly acetic acid, mayalso be a key activity in strain development.
II.4 Cellulase Enzyme
Area 400, which was used for enzyme production in the 1999 hardwood design1, has beenremoved. Enzyme will instead be purchased at an estimated cost of $0.10 per gallon of ethanol. Itwill be produced on-site through licensing agreements with enzyme suppliers. This cost wasdeveloped from our current collaborations with enzyme manufacturers to develop commerciallyavailable enzyme preparations for lignocellulosic biomass. This equates to $0.17 per gallon of cellulose-derived ethanol. If the xylose to ethanol yield is improved, the overall cost of enzymedecreases, but the cost per gallon of cellulose-derived ethanol stays constant. If the cellulose toethanol yield is improved, both values will change.
II.5 Product, Solids, and Water Recovery (Distillation, Dehydration,Evaporation, and Solid-Liquid Separation) – Area 500 (PFD-P110-A501-5 )
II.5.1 Overview
Distillation and molecular sieve adsorption are used to recover ethanol from the raw fermentation beer and produce 99.5% ethanol. Distillation is accomplished in two columns—the first, calledthe beer column, removes the dissolved CO2 and most of the water, and the second concentratesthe ethanol to a near azeotropic composition (see Figure 12).
All the water from the nearly azeotropic mixture is removed by vapor phase molecular sieveadsorption. Regeneration of the adsorption columns requires that an ethanol water mixture berecycled to distillation for recovery.
Fermentation vents (containing mostly CO2, but also some ethanol) as well as the beer columnvent are scrubbed in a water scrubber, recovering nearly all of the ethanol. The scrubber effluentis fed to the first distillation column along with the fermentation beer.
The bottoms from the first distillation contain all the unconverted insoluble and dissolved solids.The insoluble solids are dewatered by a Pneumapress pressure filter and sent to the combustor (Area 800). The liquid from the pressure filter that is not recycled is concentrated in a multipleeffect evaporator using waste heat from the distillation. The concentrated syrup from theevaporator is mixed with the solids being sent to the combustor, and the evaporated condensate isused as relatively clean recycle water to the process.
Because the amount of stillage water that can be recycled is limited, an evaporator is included in
the process. The total amount of the water from the pressure filter that is directly recycled is setat 25%. Organic salts like ammonium acetate or lactate, corn steep liquor components notutilized by the organism, or inorganic compounds in the biomass end up in this stream.Recycling too much of this material can result in levels of ionic strength and osmotic pressuresthat can be detrimental to the fermenting organism’s efficiency. In a typical grain-to-ethanolfacility, this recycle can be limited to as little as 10% of the centrifuge filtrate stream to minimizethis effect. For the water that is not recycled, the evaporator concentrates the dissolved solids intoa syrup that can be sent to the combustor, minimizing the load to wastewater treatment.
36

8/4/2019 NRL Report
http://slidepdf.com/reader/full/nrl-report 47/154
Figure 12. Distillation System Overview, PFD-P110-A500
37

8/4/2019 NRL Report
http://slidepdf.com/reader/full/nrl-report 48/154
II.5.2 Design Basis
Beer from the fermentation area is first preheated with flash vapor from the pretreatment reactor (H-201). This feed to the beer column (PFD-P110-A501) is then further heated by heat exchangewith the bottoms from the beer column in H-512. The beer column (D-501) operates in a mode toremove the CO2 and as little ethanol as possible overhead, while removing about 90% of the
water to the bottoms. The ethanol is removed as a vapor side draw from the column and feddirectly to the rectification column (D-502).
This separation (D-501) is accomplished with 32 actual trays at 48% efficiency with the feedentering on the fourth tray from the top. Nutter V-grid trays are used for this purpose. These trayshave been found to tolerate the solids well and have a relatively good efficiency. Both columns(D-501 and D-502) are operated below 2 atm (30 psia) overhead pressure. This relatively low pressure keeps the reboiler temperature down and minimizes fouling. The tray spacing is 0.61 m(24 in.) and the column diameter is 4.37 m (14.3 ft). The reflux ratio required is 3:1. Theoverheads are vented to the scrubber and contain 83.7% CO2, 12% ethanol, and 4% water. Allthe CO2 and only 0.2% of the ethanol are vented here. Most of the ethanol vented (99%) will berecovered and recycled via the vent scrubber. In addition, about 0.7% of the ethanol fed is lost in
the bottoms stream. Over 99% of the ethanol fed is removed as a 39.4% w/w mixture with water vapor side draw from the column at actual tray 8. Heat is supplied to a forced recirculationreboiler (H-501) by low-pressure (4.4 atm [65 psia]) steam. A forced circulation reboiler is usedin an effort to accommodate the solids present in the bottoms. A spare reboiler, suggested byVogelbusch42 to allow for cleaning due to the high-fouling service, is included in the design.
The vapor side draw from D-501 is fed directly to D-502, the rectification column (PFD-P100-A502). This column uses 60 Nutter V-Grid trays at a slightly higher efficiency of 57%. The D-501 vapor is fed on Tray 44 (from the top) and the recycle from adsorption, which is higher inethanol (72% w/w versus 40% w/w), is fed on Tray 19 (from the top). The column above Tray44 is 3.5 m (11.5 ft) in diameter; below Tray 44 it is 1.2 m (4 ft) in diameter. The required refluxratio is 3.2:1 to obtain a vapor overhead mixture of 92.5% w/w ethanol and a bottoms
composition of 0.05% w/w ethanol. Only 0.1% of the ethanol from fermentation is lost in the bottoms. The composition of 7.5% water in the feed to the adsorption column represents only0.7% of the water originally entering distillation. Reflux for this distillation is supplied byinterchange with the evaporator (E-501). An ancillary condenser (H-505) is supplied for start-up.Heat is supplied to the column in a thermosyphon reboiler (H-502) with low-pressure (4.4 atm[65 psia]) steam.
As mentioned in Section II.5.1, all ethanol-containing vents are collected and sent through awater scrubber (T-512). This is a packed column using Jaeger Tri-Pack plastic packing, and itrecovers 99.5% of the ethanol with four theoretical stages and 7.6 m (25 ft) of packing. A flowrate of about 0.60 m3/min (158 gpm) of well water is used. The resulting effluent is 1.3% w/wethanol and is sent to the beer well for feeding to D-501. The design basis is >98% ethanol
adsorption in the vents and venting no more than 36.3 MT (40 ST) per year of VOC for air pollution considerations, specifically New Source Performance Standards criteria.
Overhead vapor from D-502 is fed to the Delta-T molecular sieve adsorption unit (M-503). Thespecifics of the design of this unit are proprietary to Delta-T, but the general arrangement is givenon PFD-P110-A503. Saturated vapor from the distillation is first superheated and fed to one of two adsorption columns. The adsorption column removes 95% of the water and a small portionof ethanol. The 99.5% pure ethanol vapor is cooled by heat exchange against regeneratecondensate and finally condensed and pumped to storage. While one bed is adsorbing water, the
38

8/4/2019 NRL Report
http://slidepdf.com/reader/full/nrl-report 49/154
other is regenerating. Passing a very small slipstream of pure ethanol vapor back through theloaded bed while a vacuum is applied carries out regeneration. The water is stripped off theadsorbent, and the mixture is condensed and returned to the rectification column (D-502).
Finally, the beer column (D-501) bottoms are sent to the first effect evaporator (E-501, PFD-P110-A504). This effect is heated by both condensing the reflux vapor to the rectification
column (D-502) and by adding very low-pressure steam (1.7 atm [25 psia]). This dual heating isaccomplished using a split tubesheet evaporator that prevents the steam from mixing with thereflux. About 24% (35% of the total evaporation) of the water entering this first effect is
evaporated. In addition, the slurry is cooled from 117°C to 87°C, which is a more suitabletemperature for liquid-solid separation. The slurry is sent to the Pneumapress (S-505, PFD-P110-A505) and the filtrate is returned to the second evaporator effect (E-502). No washing is used inthis application of the Pneumapress; otherwise its operation is as described in Section II.2.2. Inthe second effect, 44% (33% of the total evaporation) of the water entering is evaporated. A thirdstage of evaporation (E-502) is used to evaporate 76% of the remaining water (32% of the totalwater evaporated). The final vapor is condensed in H-517. Of the total feed to theevaporator/separation system, 10.5% remains as syrup, 11.5% is removed as a wet cake in the pressure filter, 17% is recycled back to the process as recycle water, and 61% is evaporated. The
final syrup (evaporator bottoms) is 60% water. Delta-T estimates that 60% water is the maximumdissolved solids level that can be achieved without rapid fouling of the evaporator, so the flow of very low-pressure steam to the evaporator is set to achieve this level. This syrup is mixed withthe solids from the Pneumapress and sent to the combustor for disposal. Air from thePneumapress is sent to the combustor as combustion air. The pressure of the third effect is set by
the need to easily condense the evaporator vapor with cooling water at 0.21 atm (3 psia) or 64 °C.The system uses high circulation pumps to minimize fouling on the heat transfer surfaces caused by solids adhering to or plating out on the hot surfaces. The pressures of the first and secondeffects were adjusted to make all five evaporators the same size: two units each are used for thefirst and third effects and one unit for the second effect.
The clean-in-place system services the equipment that handles stillage (beer column bottoms) by
flushing with a hot caustic solution and recirculating the solution until heat transfer surfaces areclean. Manual acid cleaning, which must be performed occasionally, removes mineral scales.The frequency for this cleaning depends on the operating conditions.
Appendix I contains a discussion of the physical property model and parameters used for distillation.
II.5.3 Cost Estimation
The material of construction for equipment in the distillation area is generally 304SS. We used acorrelation from Aersten and Street45 to size the thermosyphon reboiler. The pumps, refluxdrums, and the thermosyphon reboiler (H-502) were costed using ICARUS23. Delta-T used
information and experience gained in other projects to cost the rest of the equipment. The cost of the first evaporator effect (E-501) was increased by 25% to account for the complexity of twovapor feeds. Delta-T provided the quote for the molecular sieve package since they are a vendor of that equipment. Pneumapress Filter Corporation provided quotes for the pressure filters viaHarris.
39

8/4/2019 NRL Report
http://slidepdf.com/reader/full/nrl-report 50/154
II.6 Wastewater Treatment (WWT) – Area 600 (PFD-P110-A601-2)
II.6.1 Overview
The wastewater treatment section treats process water for reuse to reduce the plant makeup water requirement. Figure 13 is a simplified flow diagram of the WWT design chosen. It shows that
the plant wastewater (condensed pretreatment flash vapor, condensate from the hydrolyzatePneumapress vent, boiler blowdown, cooling tower blowdown, CIP waste, and the non-recycledevaporator condensate) is initially screened to remove large particles, which are collected in ahopper and sent to a landfill. Screening is followed by anaerobic digestion and aerobic digestionto digest organic matter in the stream. Anaerobic digestion produces a biogas stream that is richin methane so it is fed to the combustor. Aerobic digestion produces a relatively clean water stream for reuse in the process as well as a sludge that is primarily composed of cell mass. Thesludge is also burned in the combustor.
In 1998, the wastewater treatment section was thoroughly studied by Merrick Engineering2. Theyinvestigated all of the process wastewaters, selected the design, and estimated costs for thissection. During their investigation of process streams, Merrick developed a map showing all the
streams entering WWT and used that map for guidance in selecting the best treatment method for each. Merrick recommended an integrated evaporation and water recycle design that wasimplemented by NREL and Delta-T engineers into the process design (see Area 500). Thatimprovement cut the loading to WWT dramatically. After reviewing the flow rates and wastestrength of the remaining wastewater streams, Merrick recommended the screening / anaerobicdigestion / aerobic digestion scheme for all of them. That waste treatment scheme is standardwithin the current ethanol industry and facilities in the 1-5 million gallons (4-19 million liters) per day range can be obtained as “off-the-shelf” units from vendors.
40
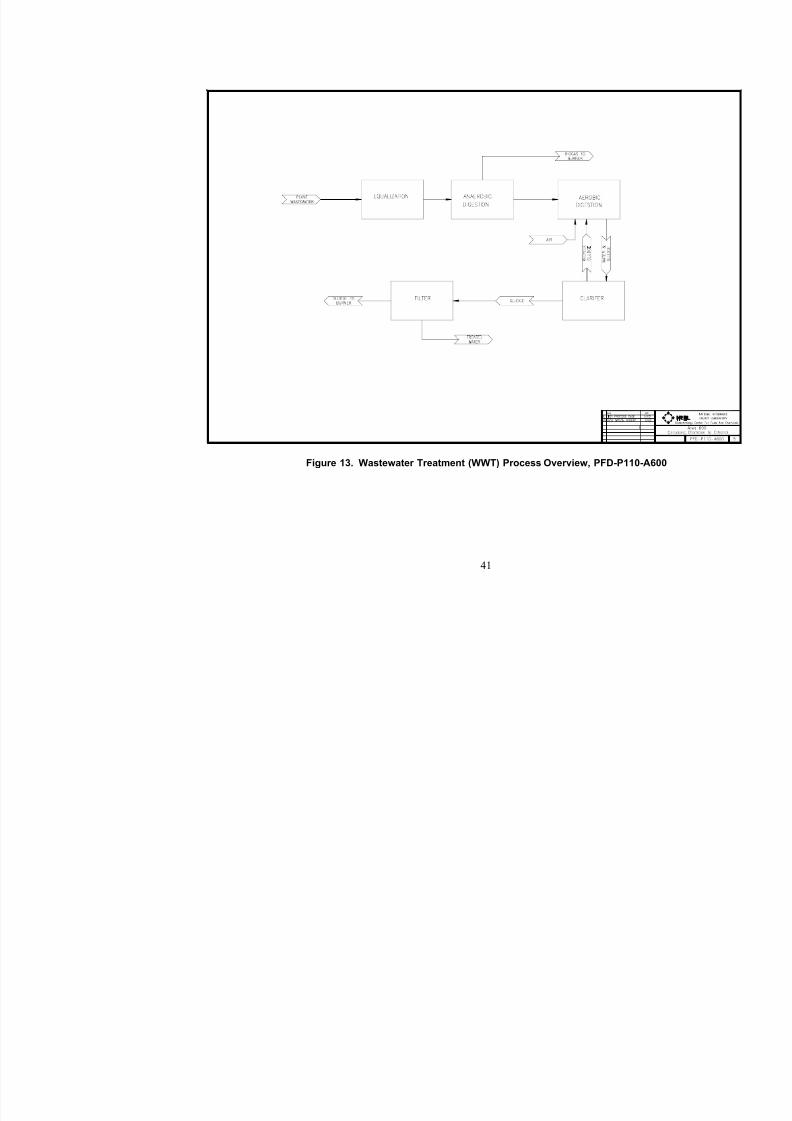
8/4/2019 NRL Report
http://slidepdf.com/reader/full/nrl-report 51/154
Figure 13. Wastewater Treatment (WWT) Process Overview, PFD-P110-A600
41

8/4/2019 NRL Report
http://slidepdf.com/reader/full/nrl-report 52/154
II.6.2 Design Basis
Merrick considered several alternate approaches and determined that screening followed byanaerobic digestion and aerobic digestion was the best method for all streams to be treated2.
Condensed pretreatment flash vapor, condensate from the hydrolyzate Pneumapress vent, boiler blowdown, cooling tower blowdown, CIP waste, and the non-recycled evaporator condensate aremixed together (stream 612) and flow through a bar screen (S-600) to an equalization basin (T-602). Since ASPEN Plus is a steady state modeling program, upsets (including unusualsuspended solids) are not modeled, and treatment of the resulting wastewater is not accounted for in this design. Rain and snow run-off, equipment washing, and other non-process wastewater areassumed to flow to the municipal wastewater treatment system. Other intermittent loads (e.g.,from process spills) were not considered in the design. The flows and loadings to WWT will not be at steady state either, so the equalization basin (T-602) is designed for a steady-state residencetime of over 7 hours allowing dampening of flow problems downstream. The majority of thewastewater in the basin is condensate so it is too warm for biological treatment, so it is pumpedthrough a heat exchanger (H-602) and cooled to 35°C.
The cooled stream then flows to the anaerobic digester. The total chemical oxygen demand(COD) is calculated for the stream entering anaerobic digestion (613) and is approximately 1,600kg/hr (equivalent to 16 g/L). COD is defined as the amount of oxygen that would be necessary tocombust all soluble organic components within the stream to carbon dioxide, nitrous oxide, andwater and is used to determine residence time and nutrient requirements for digestion. Althoughinsoluble components such as cellulose and xylan may be converted in anaerobic digestion theyare not converted within the model making the estimate slightly conservative. No insolublecomponents are included in the COD calculation because of uncertainty of their reactivity.Merrick reports that ammonium ions are not converted in anaerobic digestion (although they arein aerobic digestion) and recommends that they not be included in this first COD calculation.However, the calculated COD is within 5% of the experimentally measured COD and the
ammonium flowrate is low, so ammonium has been kept in the COD calculation46
. The biological oxygen demand (BOD) is a better predictor of efficacy of anaerobic digestion but itcannot be directly related to composition. It is assumed to be 70% of the COD.
Within anaerobic digestion, 90% of each organic component is converted to methane and carbondioxide. Methane is produced from that organic matter at its maximum yield of 350 L per kgCOD removed (0.229 kg/kg at 25°C). Carbon dioxide is also produced at a molar ratio of 1 molecarbon dioxide produced per 3 moles methane produced. Cell mass is produced at a yield of 30 gcell mass for each 1 kg COD that is removed resulting in a 93% removal of COD. Finally, allsulfates entering anaerobic digestion are converted to hydrogen sulfide. The anaerobic digestersare sized for a conversion rate of 12 g COD per L digester volume per day. Thirty-seven gramsof nutrients (primarily caustic with some phosphoric acid, urea and micronutrients) are added per
kilogram of COD to provide other nutrients the anaerobic organisms require.
Biogas from the digester contains approximately 75% methane and 25% carbon dioxide on a drymolar basis. Depending upon the complexity of the feed, the methane fraction may vary from50% to 90%; technologies are available that may increase the methane fraction. During standardoperation, the gas will flow to the combustor providing about 17.1 MMBTU/hr (5,010 kW) or 2.6% of the total fuel load supplied to the combustor. An emergency biogas flare is designed intothe process to burn the biogas in case of a process upset in the combustor.
42

8/4/2019 NRL Report
http://slidepdf.com/reader/full/nrl-report 53/154
The liquid from the anaerobic digester is pumped to aerobic lagoons with floating aerators. In theaerobic lagoons 90% of the remaining soluble organic matter is converted with 60% producingwater, carbon dioxide, nitrous oxide, and sulfur dioxide in stoichiometric amounts. Theremaining 30% is modeled to produce cell mass on a mass basis (i.e., the atoms do not necessarily balance but the mass does). With a 93% reduction of the COD in anaerobic digestion followed by 90% reduction of the remaining COD in aerobic digestion, the total COD reduction is 99.4%.
The aerobic lagoons are sized for a conversion rate of 0.55 g COD per liter lagoon volume per day and the aerators are sized to provide 50% more oxygen to the lagoon than is required by theCOD.
The fully digested material is pumped to a clarifier (T-610) where the insoluble material,consisting primarily of cell mass, is separated from the clean liquor. The clean water has a CODof about 0.1 g/L and is mixed with process make-up water and recycled to the process (coolingtower, CIP, etc). Most of the sludge is recycled to the clarifier to keep the aerobic lagoons’ cellmass loading high. The remaining portion is filtered using a belt filter press (S-614) to removemost of the water from the solids. To assist in dewatering, polymer is added to the filter press at arate of 1.7 g / kg COD entering aerobic digestion. The pressed solids are primarily cell mass andare conveyed to the combustor for disposal. If higher value disposal options can be found (e.g.,
sale as fertilizer) those will be preferable. Filtrate from the filter press is recycled to the aerobiclagoons for additional treatment.
Because the evaporator syrup from area A500 contains 60% water, sending it to the combustor might not be the most economical alternative. As an alternative, we considered sending theevaporator syrup to wastewater treatment. This would increase the hydraulic and organic load toWWT, however it would also decrease the load to (and therefore cost of) the combustor. Another alternative is to send the distillation bottoms to WWT and removed the evaporators, which arecostly. The results of a comparison of these two options against the design case of sending thesyrup to the combustor are shown in Table 18.
43

8/4/2019 NRL Report
http://slidepdf.com/reader/full/nrl-report 54/154
Table 18. Comparison of Sending Evaporator Syrup to the Combustor or WWT
Destination of Evaporator Syrup
Combustor (Design Case)
WWT Change from the Design
Case
WWT with no evaporators
Change
from Design
Case Minimum Ethanol Selling Price ($/gal) $1.07 $1.14 +$0.07 $1.10 +$0.03
Total Operating Costs (cents/gal):
Other Raw Materials 5.5 6.9 6.9
Waste Disposal 2.9 2.9 2.9
Electricity -9.3 -6.0 -7.0
Fixed Costs 10.9 11.1 10.9
Capital Depreciation 14.3 14.9 14.2
Average Income Tax 10.6 10.8 10.4
Average Return on Investment 25.4 26.4 25.3
Operating Costs ($MM/yr) 37.9 38.85 +$0.95 38.88 +$0.98
Capital Cost Breakdown ($MM):Distillation and Solids Recovery $21.8 $21.9 $14.6
WWT $3.3 $10.6 $13.5
Boiler/Turbogenerator $38.3 $35.5 $36.1
Utilities $4.7 $4.4 $3.7
Total Equipment Cost $113.7 $118.3 $113.4
Total Project Investment $197.4 $203 +$5.6 $193.8 -$3.6
Model I0203I I0203I_wwt1 I0203I_wwt_2
As expected, the cost of wastewater treatment went up considerably when syrup was introduced.It went up even further when the evaporators were taken out of the process altogether; however,
eliminating them reduced the capital costs by over $3MM. The capital costs were lowest for thecase where no evaporators were included, but the annual operating costs were $0.98MM greater because more WWT chemicals were required, but more importantly, because less electricity wasgenerated when the solids in the syrup were no longer combusted. Thus, the capital savings fromremoving the evaporators does not overcome the added operating costs plus lost revenue. Oneother impact of removing the evaporators is the loss of clean recycle water. The evaporator condensate (stream 534A) has no solids and few other impurities (1%). Without evaporators, thetreated wastewater would be used for recycle water. This stream would have solubles andsuspended solids in it (that were previously removed by the evaporators), which could adverselyaffect process conversions and equipment efficiency. This comparison shows that the overalleconomics as measured by the cost of ethanol production are most favorable when the syrup issent to the boiler.
II.6.3 Cost Estimation
All cost estimations for this area were taken from the Merrick report2. The primary equipmentcosts in this area are the anaerobic digesters, aerobic lagoons, and the belt filter press. Theanaerobic digester cost was taken from a quote developed by Chattanooga Boiler and Tank Company for the SS304 fermentation vessels. Merrick quoted the aerobic lagoons as field-excavated, polymer-lined lagoons. The belt filter press was costed according to a scaled quotefrom Phoenix Biosystems.
44

8/4/2019 NRL Report
http://slidepdf.com/reader/full/nrl-report 55/154
ICARUS23 was used to cost the remaining equipment including pumps, heat exchangers, andsurge tanks.
II.7 Product and Feed Chemical Storage – Area 700 (PFD-P110-A701)
II.7.1 Overview
This portion of the plant provides for the bulk storage of chemicals used in the process and product ethanol. Storage of the biomass feedstock is handled in Section A100 of the process.Feed chemicals stored in this area include CSL, sulfuric acid, cellulase enzyme, propane (for feedstock handling forklifts), and gasoline (used as a denaturant for the product ethanol). Water for fire suppression is also stored here.
II.7.2 Design Basis
Ethanol product storage is based on Delta-T’s experience with fuel ethanol production facilities.The recommended amount of storage (T-701) corresponds to 7 days of production or 4,540 m3
(1.2 million gal) in two 2,270 m3 (600,000 gal) carbon steel tanks.
Based on Delta-T’s experience we used 5 days of storage for sulfuric acid (T-703), whichcorresponds to about 72 m3 (19,000 gal). Stainless steel (SS316) is used as the material of construction because of the corrosive nature of sulfuric acid. SS316 is the industry standard for ambient temperature sulfuric acid.
Using a flow rate of 568 m3/hr (2,500 gpm) of fire-fighting water (similar to another Delta-T project of about the same size), 2,270 m3 (600,000 gal) tank supplies 4 hr of operating time. Thetank (T-704) is of carbon steel construction.
Corn steep liquor (CSL) is a nutrient source for fermentation seed growth and ethanol production.
The storage time is 5 days or a 273 m3 (72,000 gal) tank (T-720). The tank is stainless steel(SS304) construction. CSL would likely be supplied by rail car. Standard rail tank car capacitiesrange from 8,000 to 30,000 gallons with typical loads between 20,000 and 25,000 gallons47 for products such as corn syrup, resins, oils, fertilizers, and petroleum. Therefore, 3 tank cars of CSLwould be needed every 5 days.
Diammonium Phosphate (DAP) comes in solid form, probably pellets, via rail car. The usagerate of 4 MT per day will require solids handling and storage equipment similar to that for thelime in Area 200. The DAP storage bin (T-755) was sized at 40 m3 (10,500 gal) based on a 7-daystorage time. From the storage bin, DAP is fed into a day tank (T-760) where it is mixed withCSL. The CSL/DAP mixture is then pumped to fermentation seed production and ethanol production.
Liquid cellulase enzyme is received from an enzyme producer either on-site or close-by. Thestorage time is set at 4 days in two 500 m3 (130,000 gal) tanks (T-750), which allows enzyme lotsto be kept separate and identified. The tanks are stainless steel (SS304) construction.
Propane fuel for the forklifts is delivered in 7.6 m3 (2,000 gal) trucks. A 33-lb propane tank,which fuels the forklift, lasts approximately 8 hours according to the vendor 48. Therefore, the
45

8/4/2019 NRL Report
http://slidepdf.com/reader/full/nrl-report 56/154
approximate consumption rate of propane for 8 forklifts is 0.022 ft3/min (33 lb/hr). A 13 m3
(3,435 gal) tank (T-709) gives about 15 days of storage. This tank is pressurized to 250 psig.
Gasoline is used as a denaturant for the ethanol being loaded for transportation away from the plant. Five percent gasoline (v/v) is added to the ethanol. A 7-day storage time is used for thegasoline as for ethanol, or 241 m3 (63,600 gal) tank (T-710). Carbon steel is used for this tank.
The pumps in this section are generally sized for quickly loading trucks (P-701, P-710) or filling process day tanks (P-703 and P-720). The firewater pump is sized for 568 m3/hr (2,500 gpm).Other pumps are sized per the process requirements.
II.7.3 Cost Estimation
We used ICARUS to estimate the cost for all equipment in this section23.
II.8 Combustor, Boiler, and Turbogenerator – Area 800 (PFD-P110-A801-3)
II.8.1 Overview
The purpose of the combustor, boiler, and turbogenerator subsystem is to burn various by-productstreams for steam and electricity generation. All of the lignin and some of the cellulose andhemicellulose from the feedstock will remain unconverted through the hydrolysis process. Themajority of wastewater from the process is concentrated to a syrup high in soluble solids.Anaerobic digestion of the remaining wastewater produces a biogas high in methane. Aerobicdigestion produces a small amount of waste biomass (sludge). Burning these by-product streamsto generate steam and electricity allows the plant to be self sufficient in energy, reduces solidwaste disposal costs, and generates additional revenue through sales of excess electricity.
Reaction Engineering Inc. (REI)3 investigated the combined system of combustor, boiler, andturbogenerator. They contacted several vendors to obtain cost and operating information to
identify a system suitable for the available fuel streams and steam requirements. REI alsoobtained quotes for support equipment including a deaerator, baghouse, and boiler feedwater pumps.
Three primary fuel streams (post-distillate solids, biogas, and evaporator syrup) are fed to aCirculating Fluidized Bed Combustor (CFBC). The small amount of waste biomass (sludge)from wastewater treatment is also sent to the combustor. The post-distillate solids’ moisturecontent leaving the Pneumapress is 45%. The biogas and syrup enter the combustor at 4% and60% moisture, respectively. The moisture of the combined feed to the combustor is 52%. A fanmoves air into the combustion chamber. Treated water enters the heat exchanger circuit in the
combustor and is evaporated and superheated to 510°C (950°F) and 86 atm (1265 psia) producing184,771 kg/hr (407,420 lb/hr) of steam. Boiler efficiency, defined as the percentage of the feed
heat that is converted to steam heat, is 68% (see Figure 16). Flue gas from the combustor preheats the entering combustion air then enters a baghouse to remove particulates, which arelandfilled. The gas is exhausted through a stack.
A multistage turbine and generator are used to generate electricity. Steam is extracted from theturbine at three different conditions for injection into the pretreatment reactor and heat exchangein distillation and evaporation. The remaining steam is condensed with cooling water andreturned to the boiler feedwater system along with condensate from the various heat exchangersin the process. Treated well water is used as makeup to replace steam used in direct injection.
46

8/4/2019 NRL Report
http://slidepdf.com/reader/full/nrl-report 57/154
Makeup water and condensate are softened, deaerated, and preheated with steam to 177°C.Chemicals for pH control, scale removal, and oxygen removal are added. Boiler blowdown is 3%of steam production. Section II.10.3 discusses the energy balance of the steam cycle.
II.8.2 Design Basis
The design of the combustor/boiler/turbogenerator system is changed somewhat from an earlier design by Radian Corporation49. The previous design included a drum dryer that used the hot fluegas to reduce the moisture in the solids. However, since the Pneumapress pressure filter iscapable of drying the post-distillate solids more efficiently than the centrifuge previously in thedesign, the drum dryer is no longer required, and the hot flue gas can be used to preheat thecombustion air (H-801), which improves the boiler efficiency. When combined with maintaininga high solids content in the syrup, drying the solids helps to ensure a stable combustion bedtemperature and improved boiler efficiency. Foster Wheeler Energy (FWE) suggested maximumfeed moisture of 50%; other sources50 suggest 60% is acceptable. There is a wide range of valuesreported, primarily due to the various combinations of combustor designs and feeds being used.Because of heightened interest in using biomass, pulping wastes, and sewage sludge in place of
fossil fuels, new methods of handling higher moisture feeds are being developed such as in-beddrying and staged combustion51. Blending the wet feed with dry material or adding auxiliary fuelto maintain the combustion temperature are more traditional methods. A Lower Heating Value(LHV) of 1,111-1,389 kcal/kg (2,000-2,500 BTU/lb) is considered a minimum for maintainingcombustion3. The combined feed to the combustor has a LHV of 2,322 kcal/kg (4,179 Btu/lb).The total energy (on a higher heating value basis) to the combustor in the combined feed streamsis 178 MMkcal/hr (706 MMBtu/hr). The solids contribute 59% of this energy and the syrupcontributes 37%.
Foster Wheeler Energy (FWE)3 confirmed the Radian design49 of a circulating fluidized bedcombustor (CFBC) (M-803). This type of combustor is suitable for varying feeds and feedcharacteristics; however, this flexibility is more expensive than a grate or pile combustor.
Because the bed material is returned to the combustor after the cyclone, CFBCs have littleunburned carbon in the ash. Compared to coal, the combined feed in this process hassignificantly less ash and could require supplementing the bed with sand to keep an adequate bedlevel. Two drawbacks to these units are the high power requirement for circulation and the potential for erosion due to high particulate velocities. Parameters for emissions and efficiencylosses were supplied by FWE.
Because the steam pressure required by the process is not high (13 atm [191 psia]), NRELengineers originally envisioned a lower pressure system. FWE declined to quote on this system,citing it as non-standard due to the low operating pressure available to move the water/steam over the heating surfaces. After further study, FWE did state that a low-pressure system might be cost-effective because the lower materials cost may pay for the cost of added piping on the steam side,
but they did not provide a cost estimate.
Another option, gasification of the waste streams to produce steam and electricity, is beingstudied at NREL. Gasification has the potential to produce enough steam and larger amounts of electricity through an integrated combined cycle (gas and steam turbine) system thanconventional combustion with only a steam turbine.
The turbogenerator (M-811), which consists of a multistage turbine with extraction ports,generator, and condenser is the other main portion of this section, producing lower pressure steam
47

8/4/2019 NRL Report
http://slidepdf.com/reader/full/nrl-report 58/154
and electricity. Twenty-eight percent (28%) of the steam is extracted from the turbine at 13 atm
(268°C [191 psia, 514°F]), 60% at 4.4 atm (164°C [65 psia, 327°F]), and 3% at 1.7 atm (115°C[25 psia, 239°F]) for process needs. The remaining steam (9%) is condensed at 0.1 atm (1.5 psia). ABB Power Generation Systems (ABB) provided cost, efficiency, and design information,which were used in the model3. ABB representatives, when asked about the low-pressure boiler discussed above, stated that the lower pressure option did not allow the most cost effective
turbine system; higher-pressure systems supply more electricity on a power per capital cost basis.Badger,52 working with Turbodyne, came to the same conclusion, stating “for larger turbines of 8000 kW upward steam inlet pressure has little effect on capital costs over the range 200-1600 psig”. Per ABB, the turbine efficiency was set at 85%. For this design, a total of 30.4 MW of power is generated from the system. The process uses 11.7 MW, leaving 18.7 MW that is sold tothe grid.
V. Putsche confirmed the FWE and ABB design parameters using an ASPEN combustor/boiler model showing good correlation of efficiencies, output flows, and temperatures53.
The boiler feed water (BFW) system includes a softener (M-820) for the makeup and condensatewater, a deaerator (T-826) to remove air and other non-condensables, surge tanks and pumps.
The boiler feedwater pumps (P-826) produce 98 atm (1445 psia) of pressure and require 709 kW(951 hp) of power. Liquid hydrazine (T-830, PFD-P110-A804) is injected into the deaerator toremove oxygen, which can pit the boiler surfaces. Ammonia, which volatizes with the steam, isadded to control the pH and reduce the corrosive nature of the hot condensate. Phosphate is alsoadded to control the formation of scale in the steam drum. The oxygen, pH, and hardness controlsystems were designed by Badger 52 and follow conventional practice54. The amount of water treatment necessary depends on the incoming water quality, metallurgy of the boiler, and the ratioof makeup to condensate in the feedwater. The current system contains some redundancy;however, the control systems’ costs are low compared to the replacement cost of the boiler or itscomponents.
The power usage estimate for the baghouse (M-804) cleaners (176 kW [236 hp]) was obtained
from the vendor, Hamon Research-Cottrell. One induced draft fan was used to move the flue gasfrom the combustor cyclone through the baghouse.
Pollutant generation values were taken from information provided by FWE. Baghouse efficiencyof 98.8% was taken from information supplied by the vendor. All of the emissions are below thecurrent New Source Performance Standards (NSPS) limits53 so no control measures other than the baghouse were added to the process. Pollutant flow rates are calculated from the generation ratesdiscussed below and the higher heating value of the combustion feed stream.
Sulfur dioxide is assumed to be generated at a rate of 0.68 kg/MWhr (0.44 lb/MMBtu). All of thesulfur into the combustor is converted to sulfur dioxide; 1% of the generated sulfur dioxide isconverted to sulfuric acid. The presence of this acid requires that the flue gas temperature be kept
above the dew point to avoid corrosion. Sulfur comes from wastewater treatment (hydrogensulfide), neutralization of sulfuric acid, and is present in the proteins within the cellulase and biomass entering the boiler with the pressure filter and spent biomass solids, respectively.Limestone, if it is needed to control sulfur dioxide to a stricter standard, can be purchased for about $6 per ton for quarter-inch particle size.3 The amount of sulfur in the combustor feedstreams is higher than untreated biomass, but lower than most coals.
Carbon monoxide is assumed to be generated at a rate of 0.31 kg/MWhr (0.2 lb/MMBtu).3
Unburned carbon (char) in the ash is low at 1%, owing to the circulation of the unburned carbon
48

8/4/2019 NRL Report
http://slidepdf.com/reader/full/nrl-report 59/154
back to the combustor bed from the cyclone. The flue gas composition of 804D on PFD-P110-A801 shows the remaining unreacted components; in actuality, these would be present in the fluegas as char.
NOx is generated at 0.31 kg/MWhr (0.2 lb/MMBtu)3. Nitrogen oxide, or NOx, formation is acomplicated mechanism, and depends on the feed, combustion temperatures, excess air rate,
combustor design and the presence of other control schemes like limestone injection for sulfur dioxide control. CFBCs are generally considered to have lower NOx emissions due to lower combustion temperatures compared to traditional pile or grate combustors50. The fate of theammonia species in a combustor is not well understood, but there is evidence to suggest thatsome of the ammonia is converted to nitrous oxide (N 2O) while also acting to reduce NOx
formation.55 Ammonia injection has long been a means of reducing NOx emissions. The nitrogenlevel in the combined feed is similar to coal when the ammonia species are included, but is morelike untreated biomass when they are not.
II.8.3 Cost Estimation
The costs for the CFBC, turbogenerator, boiler feedwater pumps, and deaerator are from vendor
quotes. In addition, FWE and ABB provided scaling factor information. According to FWE, theCFBC should be scaled on steam production, but only for similar feed conditions such asmoisture content. The cost obtained from FWE compared well with a previous 1994 quote,shown in Table 19. Other quotes obtained over the last decade are also listed in this table.
Boiler feedwater softening equipment was costed using Richardson56, including the scaling factor.Other chemical treatment costs are from Chem Systems57. ICARUS23 was used to cost theremaining equipment including pumps, heat exchanger, and surge tanks.
For the baghouse, information on bag life and replacement cost from the vendor was incorporatedinto the capital costs.
Table 19. Boiler CostsVendor/Requestor Year Steam
Conditions
Pressure/Temp
Steam Production
(1000 lb/hr)
Total Cost ($MM)*
Scope
FWE/REI31998 915-1265
psia/950°F752 24.9 CFB
FWE/NREL 581994 1515 psia/950°F 694 22.9 CFBC
AhlstromPyropower/Radian49
1991 1515 psia/950°F 279-385 18-24 FBC
ABB/ChemSystems59
1990 1100 psia/875°F 434 19.8 Dryer/FBC
*$1998 dollars
49

8/4/2019 NRL Report
http://slidepdf.com/reader/full/nrl-report 60/154
II.9 Utilities – Area 900 (PFD-P110-A901-3)
II.9.1 Overview
This area provides all utilities required by the ethanol production facility except steam and
electricity, which are provided by Area 800. The utilities provided include cooling water, chilledwater, plant and instrument air, process water, and the clean-in-place (CIP) system.
Cooling water is provided to the following equipment items:
• H-200 to cool the pretreated hydrolyzate liquor before it enters overliming
• H-205 to condense the water from the Pneumapress air vent
• H-244 to cool the pretreatment flash vapor before it enters WWT
• F-301-5 on an as-needed basis to remove heat in the seed train
• H-300 on an as-needed basis to remove heat produced in the co-fermentation production train
• H-302 to cool the saccharified slurry to fermentation temperature
• H-310 to remove heat produced in the saccharification production train
• H-504 to condense the beer column reflux
• H-505 to condense the rectification column reflux during start-up
• H-517 to condense vapors from the third evaporator effect
• M-503 to provide some cooling and condensation in the molecular sieve
• H-602 to cool wastewater before anaerobic digestion
• M-811 to condense the remaining steam after the steam turbine
No chilled water is used in the plant; the required process temperatures can be achieved bycooling water year-round.
The plant and instrument air systems provide compressed air for plant uses (pneumatic tools and
clean up), the Pneumapress units (prehydrolysis conditioning and post-distillation dewatering),and instrument operation.
The process water system mixes fresh well water with treated wastewater and provides water at aconstant pressure to the facility. Water is provided to the stover washer system, seed production, boiler feed water, cooling tower make-up, the CIP system, and the scrubber. It is also mixed withrecycle water for dilution before saccharification. Process water is also used throughout thefacility for cleaning on an as-needed basis.
The CIP system provides a solution that can be heated and includes cleaning and sterilizationchemicals to saccharification and co-fermentation, seed vessels, and the distillation system.
II.9.2 Design Basis
The primary cooling water consumers in this process are pretreatment, saccharification,fermentation, distillation, wastewater treatment, and steam condensation after the turbogenerator.The cooling water system is designed at 28°C with a 9°C temperature rise in coolers throughoutthe facility. We chose 28°C because the average summer wet bulb temperature in thesoutheastern part of the United States is 25°C and a 3°C approach is a reasonable design60.
50
8/4/2019 NRL Report
http://slidepdf.com/reader/full/nrl-report 61/154
Overliming, saccharification, fermentation, distillation, wastewater treatment, and steamcondensation in the boiler utilize cooling water year round. The initial cooling source for fermentation, which is operated at 41°C, is well water, which enters the facility at 13°C and isheated to 26°C by the fermentation cooling load before entering the process water system. Theremaining heat is removed by cooling water.
Using ASPEN, we calculated the amount of cooling tower evaporation and assumed that windagewould be 0.1% of the total flow to the tower. The tower blowdown is assumed to be 10% of thesum of the evaporative loss plus windage.
The plant and instrument air systems provide compressed air for plant uses (pneumatic tools andclean-up, Pneumapress filters) and instrument operation. Delta-T recommended 1,530 m3/hr (900SCFM) compressed air for plant operation. The plant air compressor also provides air at 9.5 atm(140 psia) to the Pneumapress filters via air receivers at a combined usage of 8,892 m3/hr (5,230ACFM). Three 5,228 m3/hr (3,075 CFM) screw compressors were specified—two on-line withone spare. An instrument air dryer and a surge tank were designed to provide clean dry air at aconsistent pressure to the instrument air system. The surge tank was sized at 3.8 m3 (1,000 gal) to provide about 2.5 L/m3/hr (1 gal per SCFM) of compressor capacity.
Fresh well water is used to cool the fermentation broth and is then split three ways, to provideclean water to the boiler feed water make-up system and the scrubber. The process water tank (T-914) mixes and holds the treated wastewater and the remaining fresh water before it is pumpedthroughout the facility. It is designed for an 8 hr. residence time. The process water pump (P-914) pumps water from the tank into the facility. It is designed to handle 1.5-times the processwater flow requirement. The scrubber and the boiler feedwater system require fresh water. Fresh process water is mixed with recycle water for dilution prior to entering seed production, coolingtower make-up, and the CIP system.
The CIP system is designed to provide cleaning solution to all the seed, saccharification andfermentation tanks, to the beer column, to all the beer column heat exchangers, and to the
evaporators.
Process water flows into the CIP system tanks and is heated by low-pressure steam. Two CIPtanks are needed in order to maintain the ability to clean a tank at the same time as a beer columncomponent.
The washing sequence follows:1) Process water is pumped at 454 m3/hr (2,000 gpm) (or at the equipment design flow)
to the equipment being cleaned in order to flush the solids out of the equipment.2) a. CIP solution is then pumped at 454 m3/hr (2,000 gpm) (or at the equipment
design flow) through the equipment and returned to the CIP tank via the cycloneseparator.
b. For tanks with spray balls, CIP solution is pumped at 136 m3
/hr (600 gpm)through the spray balls in the tank. The solution is then pumped back to the CIPtanks by the 136 m3/hr (600 gpm) CIP return pump, via the cyclone separator.
3) The cyclone separator continuously discharges the sludge stream to the wastewater treatment area while the centrate is returned to the CIP tank for reuse.
4) The CIP cycle continues until the equipment has been cleaned.
51
8/4/2019 NRL Report
http://slidepdf.com/reader/full/nrl-report 62/154
II.9.3 Cost Estimation
We based the cooling system cost estimate on a verbal quote by Marley. It was quoted for a heatload of 148 MM Kcal/hr (587 MMBtu/hr) and fiberglass construction for cost effectiveness andcorrosion resistance. The quoted cooling tower is a five cell counterflow tower with a 82.3 m x16.8 m (270 ft x 55 ft) frame, a 82.6 m x 18.6 m (271 ft x 61 ft) basin, a 181 kW (243 hp) fan in
each cell, and a total flow capacity of 16,125 m3/hr (71,000 gpm). The cooling tower circulation pumps were estimated using ICARUS23. Their material of construction is carbon steel, chosen because of Delta T’s experience with these towers.
We used ICARUS to estimate the plant and instrument air compressor and dryer costs. Theestimates are based on 125-psig rotary screw compressors and a dew point requirement of -40°C.We used ICARUS to estimate the plant air receiver tank costs as a horizontal vessel with a design pressure of 14.6 atm (200 psig). The Pneumapress air receivers were costed by Harris19.
The process water tank and pump costs were estimated using ICARUS. We estimated the tank cost using the atmospheric pressure carbon steel vertical vessel data and the pump cost using thecarbon steel centrifugal pump data.
The CIP system was designed by Delta-T and the cost was estimated to be similar to the costs previously used by NREL for this system. The cost of the previous units totaled $95,000 (1995).Scaling and installation factors were estimated.
II.10 Water and Carbon Balances and Energy Analysis
II.10.1 Water Balance
Large amounts of water are circulated throughout the biomass-to-ethanol process. Detailed water balances around the major processes and the entire plant were derived from the ASPENsimulations. Improving water usage to reduce makeup demand continues to be an area of study.
The process is designed for zero discharge to a municipal treatment plant in a steady state mode.Table 20 shows the major water inputs and outputs to the overall ethanol plant. Well water isused to make up for water losses to the atmosphere due to evaporation, water in streams vented tothe atmosphere, and water entrained in the waste solids. Water is consumed in hydrolysisreactions that convert the long chain polymers to monomeric sugars (prehydrolysis andsaccharification) and generated in the combustion and digestion reactions. The difference in thewater and overall mass balance is discussed in the next section with the carbon balance.
52

8/4/2019 NRL Report
http://slidepdf.com/reader/full/nrl-report 63/154
Table 20. Ethanol Plant Overall Water Balance
Total Flow (kg/hr) Water Flow (kg/hr)
Process Inlets
Stover Feedstock 98,039 14,706
Enzymes 6,824 6,255
Chemicals & Nutrients 7,239 0
Air 310,255 3,382
Well Water 186,649 186,649
Inlet Total 609,006 210,992
Water Consumption/Generation
Prehydrolysis -2,788
Saccharification -2,736
Combustion 20,035
Wastewater Treatment 371
Consumption/Generation Total 14,882
Process Outlets
Ethanol Product 24,686 122Evaporative Losses 195,993 156,291
Vents to Atmosphere 375,443 68,051
Solids to Landfill 12,718 2,194
Outlet Total 608,840 226,658
Water Difference (inputs + consumption + generation - outputs) -784
II.10.2 Carbon Balance
Overall mass balances are performed on the ethanol production process using ASPEN. As acheck of our assumed biomass composition, stream flow definitions and reaction stoichiometrythroughout the process, a carbon balance was performed61.
The overall carbon balance is 99% closed. The methods used in modeling two subsystems,wastewater treatment (T-606) and the treated water mix (T-914), contribute to the small error.
• T-606 was designed using the COD (chemical oxygen demand) method of wastewater treatment, which only ensures that the mass balance closes and not the component molar balance. This section accounts for 15 kmol/hr of the discrepancy.
• T-914 assumes that pure water is being recycled to the plant; therefore the trace carboncompounds exiting from the block are not taken into account. Since the totalconcentration of these trace compounds are very low (less than 0.5%) in the recyclestream, they are not modeled. This section accounts for the other 25 kmol/hr of thediscrepancy.
Table 21 shows the flow of carbon as a percentage of the biomass feed. As shown in the table,99% of the carbon enters in the biomass feed. The major exits for carbon (accounting for 99%)are in the combustion exhaust (47%), ethanol product (34%), and the scrubber vent (17%). Theseresults are depicted in Figure 14.
53

8/4/2019 NRL Report
http://slidepdf.com/reader/full/nrl-report 64/154
Table 21. Ethanol Plant Overall Carbon Balance
Carbon Flow(C kmol/hr)
Ratio to Feedstock Carbon Content(C kmol basis)
Carbon Inlets
Stover Feedstock 3,144 1.000
Enzymes 25 0.008
Total 3,169 1.008
Carbon Outlets
Combustion Exhaust 1,497 0.476
Ethanol Product 1,066 0.339
Scrubber Vent 532 0.169
Ash 16 0.005
Gypsum 10 0.003
Aerobic Vent 3 0.001
Loss to Atmosphere 4 0.001
Total 3,129 0.995
We expect the amount of carbon exiting in the combustion exhaust to be rather large becausemost byproducts (lignin etc.) of this process are burned; thus liberating CO2. Over 99% of thisstream consists of carbon dioxide. The majority of the carbon exiting the scrubber vent is in theform of CO2 with some minor amounts of carbon exiting in the form of ethanol (0.05%). Thescrubber processes the fermentation gas, which contains CO2.
54

8/4/2019 NRL Report
http://slidepdf.com/reader/full/nrl-report 65/154
Figure 14. Process Carbon Balance
55

8/4/2019 NRL Report
http://slidepdf.com/reader/full/nrl-report 66/154
Table 22.
ComponentFeed Stream Carbon Composition
Carbon Flow (C kmol/hr) % Carbon Flow (C kmol basis)
Ethanol Producing Reactants
Cellulose 1,154 36.7%
Xylan 665 21.1%
Arabinan 92 2.9%Galactan 60 1.9%
Mannan 48 1.5%
Total 2,019 64.2%
Non-Ethanol Producing Reactants
Lignin 968 30.8%
Soluble Solids 13 0.3%
Acetate 81 2.6%
Protein 40 0.8%
Extractives 26 1.3%
Total 1,125 35.8%
The comparison of the ethanol product’s carbon content to that of the total biomass feed is a littlemisleading since the non-carbohydrate components of the biomass cannot be converted to ethanolvia fermentation. Accordingly, the biomass feed stream can be broken into the various ethanoland non-ethanol producing components. Table 22 shows the distribution; 64% (C mole basis) of the carbon in the feed stream is present as ethanol producing sugars. Converting all of this carbonrepresents the theoretical yield. According to Table 21, 51% of the feed stream carbon is actuallyconverted by the ethanol pathway (ethanol in the product and CO2 in the scrubber vent), so theactual yield is 80% of the theoretical yield.
II.10.3 Energy Analysis
The process has been analyzed to compare the energy available in its products (ethanol andelectricity) to the maximum energy available from the biomass feed62. This analysis includesother energy inputs to the process (e.g., sensible heat effects of all feed streams and effluentstreams).
The potential energy of the material streams is considered to have three contributions:
1. A chemical potential energy defined as its higher heating value (HHV) at a referencetemperature of 25°C.
2. A sensible heat effect to account for the process temperature being different from thisreference temperature.
3. A latent heat effect to account for a volatile component being in a phase conditiondifferent from its phase condition at the reference temperature. (For example, water
being discharged as a vapor instead of it normal liquid state at 25°C.)
The potential energies of the material streams are referenced to the potential energy of the biomass feed. This is a convenient basis to analyze the energy contents of the streams since theenergy of the ethanol product will ultimately be recovered by its combustion. One outcome of this basis is that combustion products have a zero energy contribution (other than any sensibleand latent heat effects). Also, the carbon dioxide produced by fermentation essentially has a zeroenergy content compared to the other material and energy streams.
56

8/4/2019 NRL Report
http://slidepdf.com/reader/full/nrl-report 67/154
The HHV is a convenient reference for the combustion energy since there is a lot of liquid water flowing throughout the process. The HHV has its basis water produced by combustion in theliquid state, not the vapor state (as with the lower heating value, or the LHV). So, the liquidwater in the process has a zero contribution to the chemical potential energy of any stream.
A comparison of the major energy streams produced by the process to the combustion energy of the biomass feed is made in Table 23 and depicted in Figure 15. The combined energy availablefrom the ethanol product and the exported electricity is over half of the energy content of the biomass feed. The energy losses from the cooling tower and combustion exhausts are fairlylarge. There is a potential for increased energy recovery as exported electricity if more elaboratelow level waste heat recovery systems were to be included in the process.
Table 23. Ethanol Plant Overall Energy Analysis
Energy Flow(MMkcal/hr)
Ratio to Feedstock Energy Flow
Energy Inlets
Stover Feedstock 358 1.000
Enzymes 3 0.009Air 2 0.005
Sulfuric Acid -2 -0.005
Well Water -2 -0.006
Other -1 -0.004
Total 358 1.000
Energy Outlets
Ethanol 174 0.487
Cooling Tower 79 0.220
Combustion Exhaust 54 0.151
Ambient Heat and Work Losses 22 0.060
Byproduct Electricity 16 0.045
Loss to Atmosphere 1 0.004
Ash 1 0.003
Other -2 -0.004
Total 346 0.966
Some of the energy flow values in this table are negative. This may be due to the stream’stemperature being less than the reference temperature (e.g., the well water enters the process at20°C and, as an inlet, represents a sensible heat penalty to the process). The negative value for sulfuric acid represents its negative heat of combustion (i.e., heat is required to convert sulfuricacid to its combustion products).
There is a small discrepancy in the overall energy balance for the process. The outlet energy flowis 12 MMkcal/hr less than the inlet energy flow. This is due to approximations made in threemajor areas: Pretreatment, Distillation, and Wastewater Treatment. This discrepancy is only 3%of the total inlet energy flow.
There is a small discrepancy in the overall energy balance for the process. The outlet energy flowis 12 MMkcal/hr less than the inlet energy flow. This is due to approximations made in threemajor areas: Pretreatment, Distillation, and Wastewater Treatment. This discrepancy is only 3%of the total inlet energy flow.
57
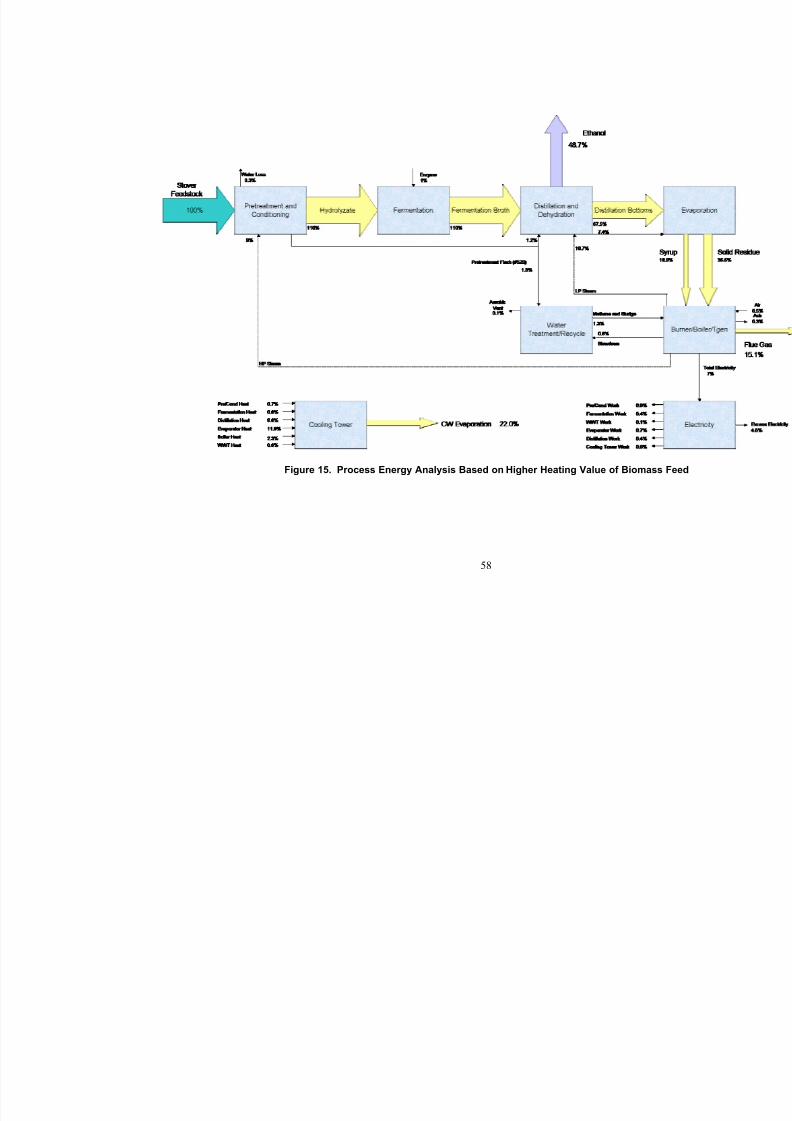
8/4/2019 NRL Report
http://slidepdf.com/reader/full/nrl-report 68/154
Figure 15. Process Energy Analysis Based on Higher Heating Value of Biomass
58

8/4/2019 NRL Report
http://slidepdf.com/reader/full/nrl-report 69/154
As with the carbon balance, a comparison of the ethanol product’s combustion energy content tothat of the total biomass feed can be misleading. Because the conversion is done by fermentationof sugars, the process cannot convert non-carbohydrate components of the biomass (such as thelignin and the proteins). The energy content of the various feed components (carbohydrates thatcan be converted to ethanol and the non-carbohydrates that cannot) is shown in Table 24. Only
63% of the original combustion value of the biomass is due to carbohydrates that can produceethanol. Taking this into account the energy content of the carbohydrates in the feed recovered asethanol is much greater, over 77%.
Table 24. Feed Stream Energy Analysis
Component Energy Flow (MMkcal/hr)% Total Feedstock
Energy Flow
Ethanol Producing Reactants
Cellulose 129 36.1%
Xylan 75 20.8%
Arabinan 10 2.9%
Galactan 7 1.9%
Mannan 5.4 1.5%Total 226 63.2%
Non-Ethanol Producing Reactants
Lignin 92 25.6%
Soluble Solids 4 1.1%
Protein 11 3.1%
Extractives 17 4.6%
Acetate 9 2.4%
Total 132 36.8%
Similar energy analyses can be performed around any section of the process. An energy analysis
around the boiler section can identify the relative amount of the energy from the various feedstreams to the combustor that will ultimately create the steam and electricity to run the process.See Figure 16 for a simplified flow diagram for this section of the process. The combined feedsto the combustor have an energy content of 178 MMkcal/hr (706 MMBtu/hr). The lignin residue provides the majority (59%) of this energy to the combustor. Combined, the electricity and steam produced is 66% of the energy to the combustor. The energy lost to the flue gas is due to its hightemperature and fairly large amount of volatile material in the vapor phase. Though it wouldseem desirable to reduce this loss by further cooling the flue gas, operational problems couldarise, such as condensation of acidic liquids or low gas velocities through the stack.
59

8/4/2019 NRL Report
http://slidepdf.com/reader/full/nrl-report 70/154
All heat flows are fractions of the energy content
of the feed to the COMBUSTOR
BOILER TURBINE/ GENERATOR
COMBUSTOR
Lignin Residue 59%
Evaporator Syrup 37%
Anaerobic Biogas 2%
Digestor Solids 0.2%
Flue Gas 31%
Heat Losses 1%
68%
Feed Water 5%
Blowdown1%
Electricity 15%
Condenser 5%
Steam to Process51%
Power Losses1%
Humid Fresh Air 1%
71%
Figure 16. CFBC/Turbogenerator Energy Balance
III. Process Economics
As mentioned earlier, one of the primary purposes for developing a detailed process design,simulation model, and cost estimate is to determine the economics of ethanol production. Thecost of ethanol production is used either to assess its potential in the marketplace with an absolutecost of production or to evaluate research proposals by looking at the relative cost of productionof process modifications that could be developed through research.
III.1 Analysis Procedure
The total project investment (based on total equipment cost) as well as variable and fixedoperating costs, are developed first. With these costs, we use a discounted cash flow analysis todetermine the production cost of ethanol when the net present value of the project is zero. Thissection describes these three cost areas and the assumptions made to complete the discounted
cash flow analysis.
III.1.1 Total Project Investment
Section II of this report describes the details of the conceptual process design and how the purchase cost of all equipment was determined. The next step is to determine the installed cost of that equipment. The installation cost can be determined by a detailed study of everythingrequired to install the necessary equipment and make it operational. This type of detail is notwarranted for the current level of the estimate. When the process is much closer to constructionand an estimate of +/- 5% accuracy is required for financing, more details will be necessary. Thisstudy is more of a +25%/-10% accuracy, making a “factored” approach satisfactory. Manyengineering texts such as Garrett6 or Peters and Timmerhaus63 list installation factors that can beapplied to purchased equipment costs to determine the installed cost. The ICARUS ProcessEvaluator 23 develops a detailed installation cost estimate using its estimate of the piping andinstrumentation required for each type of equipment. Although the ICARUS estimate is moredetailed than a simple factored method, it, as well as the standard textbook factored methods, wasdeveloped for the chemical and petroleum industry, not an aqueous-based biotechnology process.Standards for industries handling concentrated chemicals and fuels are based (to a significantdegree) on the safety aspects of the process. Many of these standards (such as API for refineriesand ANSI for chemical plants) are unnecessary for an aqueous-based process. A better
60

8/4/2019 NRL Report
http://slidepdf.com/reader/full/nrl-report 71/154
methodology is to use the expertise and engineering practices that Delta-T has developed in thedesign and construction of starch-based ethanol plants.
Delta-T reviewed the factors for direct installation costs suggested by Chem Systems64 in its 1994study of this process (Chem Systems in turn took these installation factors from Walas 65). Theseinstallation factors, given in Table 25, were applied to the equipment purchase costs. In addition
to the Chem Systems installation factors, a more recent evaluation performed by Harris.66
provided equipment specific installation and scaling factors for corn stover feed handling,continuous pretreatment reactors, and solid-liquid separation equipment. In general, the Harrisfactors were higher than those from Chem Systems, particularly for smaller equipment like pumps. The overall installation “factor” was then calculated as the quotient of the sum of all purchased costs and the sum of all installed costs, excluding sections A600 and A800. Delta-Tcompared this ratio (1.42) to several existing corn ethanol projects, where the actual ratio was1.46. Therefore, these installation factors were accepted for most equipment except where other information, such as installation factors from vendors, was available. Harris obtained installationfactors for the stover handling and solid-liquid separation equipment; as a result this overallinstallation factor (excluding A600 and A800) is 1.61 for this design case. See Appendix B for acomplete listing of the equipment, along with its purchased and installed costs.
Once the installed equipment cost has been determined from the purchased cost and theinstallation factor, it can be indexed to the project year being considered. In this case, we selected2000 so as to align with petroleum costs projected by the Energy Information Administration(EIA),67 which is in 2000 dollars. The purchase cost of each piece of equipment has a year associated with it. It might be 1998, if a vendor quote was obtained in that year, or it might be1997 if ICARUS was used as its basis. The purchased cost year will be indexed to the year of interest using the Chemical Engineering Index.68 Existing values for the index ranging from 1990to 1999 were regressed to a simple equation. The resulting equation is used to extrapolate tofuture years (referred to as “out years”) when such an analysis is desired. Table 26 gives theindex as a function of date.
61

8/4/2019 NRL Report
http://slidepdf.com/reader/full/nrl-report 72/154
Table 25. Installation Factors69
Equipment Multiplier* Agitators – Carbon Steel (CS) 1.3-1.4
Agitators – Stainless Steel (SS) 1.2-1.3
Boilers 1.3
Compressors (motor driven) 1.3Cooling Towers 1.2
Distillation columns – Carbon Steel 3.0
Distillation columns – Stainless Steel 2.1
Filters 1.4
Heat Exchangers (S&T) – Carbon Steel/Stainless Steel 2.1
Pumps – Lobe 1.2-1.4
Pumps – Centrifugal, Carbon Steel 2.8
Pumps – Centrifugal, Stainless Steel 2.0
Pressure Vessels – Carbon Steel 2.8
Pressure Vessels – Stainless Steel 1.7
Tanks – Field Erected, Carbon Steel 1.4Tanks – Field Erected, Carbon Steel with Lining 1.6
Tanks – Field Erected, Stainless Steel 1.2
Solids Handling Equipment 1.2-1.4
Turbogenerator 1.5
*Installed cost = (purchased equipment cost) x (multiplier)
Table 26. Chemical Engineering Purchased Equipment Index 68
Year Index Year Index 1990 357.6 1997 386.5
1991 361.3 1998 389.5
1992 358.2 1999 390.6
1993 359.2 2000 394.11994 368.1
1995 381.1
1996 381.7
The total equipment cost in the year of interest has now been determined. To obtain the total project investment, we must add several other items. Table 27 summarizes the categories andadditional factors proposed by Chem Systems69 based on industry standards. Delta-T reviewed theitems and factors and determined that they were consistent with other projects the company hascompleted.
62

8/4/2019 NRL Report
http://slidepdf.com/reader/full/nrl-report 73/154
Table 27. Additional Costs for Determining Total Project Investment 69
Item Description Amount Warehouse 1.5% of Total
InstalledEquipment Cost
SiteDevelopment
Site Development: Includes fencing, curbing, parking, lot, roads,well drainage, rail system, soil borings, and general paving. Thisfactor allows for minimum site development assuming a clear site,with no unusual problems such as right-of-way, difficult landclearing, or unusual environmental problems.
9% of theinstalled cost of process equip.(areas A100,A200, A300, andA500).
ProrateableCosts
This includes fringe benefits, burdens, and insurance of theconstruction contractor.
10% of TotalInstalled Cost
FieldExpenses
Consumables, small tool equip. rental, field services, temporaryconstruction facilities, and field construction supervision.
10% of TotalInstalled Cost
Home Officeand Const.
Engineering plus incidentals, purchasing, and construction. 25% of TotalInstalled Cost
ProjectContingency
Small because of the detail included in the process design. 3% of TotalInstalled Cost
Other Costs Start-up and commissioning costs.Land, rights-of-way, permits, surveys, and fees.Piling, soil compaction/dewatering, unusual foundations.Sales, use, and other taxes.Freight, insurance in transit and import duties on equipment,
piping, steel, instrumentation, etc.Overtime pay during construction.Field insurance.Project team.Transportation equipment, bulk shipping containers, plant vehicles,
etc.Escalation or inflation of costs over time.Interest on construction loan.
10% of TotalCapitalInvestment
Table 28 summarizes the Total Installed Equipment Cost. Table 29 illustrates the application of factors in Table 27 to obtain the Total Project Investment (TPI).
Table 28. Total Installed Equipment Costs
Process Area Capital Cost
A100 Feed Handling $7,500,000
A200 Pretreatment $19,000,000
Neutralization/Conditioning $7,800,000
A300 Saccharification/Fermentation $9,400,000A500 Distillation and Solids Recovery $21,800,000
A600 Wastewater Treatment $3,300,000
A700 Storage $2,000,000
A800 Boiler/Turbogenerator $38,300,000
A900 Utilities $4,700,000
Total Installed Equipment Cost $113,700,000
Model I0203I, 2000 $
63

8/4/2019 NRL Report
http://slidepdf.com/reader/full/nrl-report 74/154
Table 29. Total Project Investment (TPI)
Total Installed Equipment Cost (Table 28)Warehouse
Site DevelopmentTotal Installed Cost
$113,700,000$1,700,000
$5,900,000$121,200,000
Indirect CostsField Expenses + Prorateable ExpensesHome Office & Construction FeeProject Contingency
$24,300,000$30,300,000$3,600,000
Total Capital Investment $179,400,000
Other Costs (Startup, Permits, etc.) $17,900,000
Total Project Investment $197,400,000
Model: I0203I, 2000 $
III.1.2 Variable Operating Costs
Variable operating costs, which include raw materials, waste handling charges, and by-productcredits, are incurred only when the process is operating. All raw material quantities used andwastes produced were determined using the ASPEN mass and energy balance model. AppendixC documents the sources of the costs of these items. Table 30 summarizes these costs, both on a per-year and per-gallon of ethanol basis.
Table 30. Variable Operating Costs (Based on 69.3 MM annual gallons ethanol)
Raw Material kg/hr Cost ($/lb) MM$/yr Cents/gal
Ethanol Biomass Feedstock* 98,039 0.0128 23.17 33.45Clarifier Polymer 28 1.2500 0.66 0.95
Sulfuric Acid 3,288 0.0124 0.76 1.09
Lime 2,395 0.0348 1.54 2.23
Corn Steep Liquor 1,306 0.0804 1.95 2.81
Purchased Cellulase 6,824 0.0552 6.98 10.08
Diammonium Phosphate 163 0.0706 0.21 0.31
Propane 20 0.0022 0.0022 0.001
Make-up Water 186,649 0.0001 0.40 0.58
BFW Chemicals 1.0 1.3497 0.03 0.04
Cooling Water Chemicals 1.9 1.0204 0.04 0.05
WWT Chemicals 57.9 0.1579 0.17 0.24
WWT Polymer 0.2 2.551 0.01 0.01
Ash Disposal 4,492 0.0094 0.78 1.13
Gypsum Disposal 7,217 0.0094 1.25 1.81
Electricity Credit -18,747 (kW) 0.041/kWh -6.43 -9.29
*Cost of as-received corn stover, 15% moisture, $30/dry U.S. tonModel: I0203I, 2000 $See Appendix C for cost sources
64

8/4/2019 NRL Report
http://slidepdf.com/reader/full/nrl-report 75/154
As with capital equipment, the costs for chemicals are associated with a particular year. To indexthe costs from the year in which they were obtained to the year the analysis is being performed,we use the Industrial Inorganic Chemical Index70 from SRI Consulting. Data for this index wereavailable for years 1980 through 1999. These data were regressed to a simple equation and usedto extrapolate to other years, as shown in Table 31.
Table 31. Inorganic Chemical Index 70
Year Index Year Index 1982 91.1 1993 96.0
1983 86.6 1994 91.3
1984 85.9 1995 93.3
1985 88.1 1996 94.7
1986 86.8 1997 98.8
1987 86.1 1998 92.1
1988 91.9 1999 96.8
1989 99.2 2000 98.8
1990 101.7
1991 102.5
1992 100.0
Note: 1990 to 1999 represents actual data.2000 was extrapolated from the data.
III.1.3 Fixed Operating Costs
Fixed operating costs are generally incurred fully whether or not the plant is producing at fullcapacity. These costs include labor and various overhead items. Delta-T recommendedinformation on fixed operating costs using data from similar ethanol plant projects the companyhas been involved with (ranging up to 230 million L [60 million gal] annual production), as wellas the standard reference of Peters and Timmerhaus63. Table 32 contains the Delta-T
recommendation, except for the number of yard employees. Harris determined the number of yard employees for the corn stover feed handling system16.
Salaries do not include benefits; they are covered in the general overhead category. Generaloverhead is a factor of 60% applied to the total salaries and covers items such as safety, generalengineering, general plant maintenance, payroll overhead (including benefits), plant security, janitorial and similar services, phone, light, heat, and plant communications.
Annual maintenance materials, based on the experience of Delta-T and Peters & Timmerhaus,were estimated as 2% of the total installed equipment cost (shown in Table 28). Additionally,insurance and taxes were estimated at 1.5% of the total installed cost (shown in Table 29) using both Delta-T’s in-house information and published information.
It is important to note that the estimates provided for this section are based on a representativeMidwest U. S. location. The estimates can vary significantly depending on specific location.
65

8/4/2019 NRL Report
http://slidepdf.com/reader/full/nrl-report 76/154
Table 32. Fixed Operating Costs
Annual Salary Number of Personnel Total Annual Cost Plant Manager $80,000 1 $80,000
Plant Engineer $65,000 1 $65,000
Maintenance Supervisor $60,000 1 $60,000
Lab Manager $50,000 1 $50,000Shift Supervisor $37,000 5 $185,000
Lab Technician $25,000 2 $50,000
Maintenance Technician $28,000 8 $224,000
Shift Operators $25,000 20 $500,000
Yard Employees $20,000 32 $640,000
General Manager $100,000 1 $100,000
Clerks & Secretaries $20,000 5 $100,000
Total Salaries (1998 $) $2,054,000
Total Salaries (2000 $) $2,150,000
Factor General Overhead 60% Of Total Salaries $1,293,000Maintenance 2% Of Installed Equipment Cost $2,273,000
Insurance & Taxes 1.5% Of Total Installed Cost $1,819,000
Model: I0203I, 2000 $
The salaries are on a 1998 basis and will need to be indexed to other cost years when appropriate.The index to adjust these costs is taken from the Bureau of Labor Statistics71 and is given in Table33. The available data were regressed to a simple equation. The resulting regression equationcan be used to extrapolate to out years.
Table 33. Labor Index71
Year Index Year Index 1980 8.3 1992 14.511981 9.12 1993 14.82
1982 9.96 1994 15.13
1983 10.58 1995 15.62
1984 11.07 1996 16.17
1985 11.56 1997 16.57
1986 11.98 1998 17.09
1987 12.37 1999 17.38
1988 12.71 2000 17.93
1989 13.09
1990 13.54
1991 14.04
III.1.4 Discounted Cash Flow Analysis and the Selling Cost of Ethanol
Once the major three cost areas have been determined—(1) total project investment, (2) variableoperating costs, and (3) fixed operating costs—a discounted cash flow analysis can be used todetermine the minimum selling price per gallon of ethanol produced. The discounted cash flowanalysis program iterates on the selling cost of ethanol until the net present value of the project iszero. This analysis requires that the discount rate, depreciation method, income tax rates, plantlife, and construction start-up duration be specified. The minimum ethanol selling price is the
66

8/4/2019 NRL Report
http://slidepdf.com/reader/full/nrl-report 77/154
selling price of ethanol that makes the net present value of the biomass to ethanol process equal tozero with a 10% discounted cash flow rate of return over a 20 year plant life.
The discount rate for this analysis was set at 10%. This rate was selected based on therecommendation by Short et al.72 in his description of how to perform economic evaluations of renewable energy technologies for DOE. His view is that “In the absence of statistical data on
discount rates used by industrial, transportation and commercial investors for investments withrisks similar to those of conservation and renewable energy investments, it is recommended thatan after tax discount rate of 10%… be used.”
For this analysis, we assumed that the plant would be 100% equity financed. This, along with our other financial assumptions, is of course subject to change for a specific project. For this analysisthese parameters were chosen to provide a standard method that was not clouded by the infinite possibilities of financing, but are certainly not the final word in project financing. Figure 17illustrates the dependence of minimum ethanol selling price on both the percentage of equityfinancing and the after tax discount rate (IRR), based on 7.5% interest on a 10-year loan.
$0.80
$0.90
$1.00
$1.10
$1.20
$1.30
$1.40
$1.50
$1.60
$1.70
0% 20% 40% 60% 80% 100%
Equity (%)
M i n i m u
m E t h a n o l S e l l i n g P r i c e ( $ / g a l )
20%IRR
15%IRR
10%IRR
Figure 17. Effect of Varying IRR and Equity on Minimum Ethanol Selling Price(Loan Rate=7.5%, Loan Term=10 years)
To determine the depreciation amount for the calculation of federal taxes to be paid, Short et al. 73
recommends the use of the IRS Modified Accelerated Cost Recovery System (MARCS). Withinthe MARCS system is the General Depreciation System (GDS), which allows both the 200% and150% declining balance (DB) methods of depreciation. This offers the shortest recovery periodand the largest tax deductions. IRS publication 534 (IRS 1993) indicates that steam production plants should use a 20-year recovery period. The IRS indicates that other property notspecifically described in the publication should be depreciated using a 7-year recovery period.Short et al.74 indicates that property listed with a recovery period less than 10 years should use the200% DB depreciation method and that a 20-year recovery period property should use the 150%DB depreciation.
67

8/4/2019 NRL Report
http://slidepdf.com/reader/full/nrl-report 78/154
State taxes are not considered, primarily because the location of the plant has not been determinedand tax rates vary quite drastically (from 0% to 12%). Short et al72 suggested using the highestfederal tax bracket, which is 39% for large corporations.
Return on investment is calculated on a per gallon basis. Income tax is averaged over the plant
life and that average is calculated on a per gallon basis. The amount of income tax to be paid by a potential ethanol producer varies annually due to changes in the volume of product produced andthe allowable depreciation deduction. In fact, no income tax is paid in the first three years of operation because the depreciation deduction is greater than the net income.
The construction time is important to the cash flow analysis because there is generally no incomeduring construction but huge sums of money are being expended. Perry and Green75 indicate thatsmall projects (less than $10 million investment) can be constructed in fewer than 18 months andthat larger projects can take up to 42 months. An overview76 of petroleum refining economicsindicates that large refineries (of the order of $1.5 billion investment) can be constructed in 24months. Certainly this ethanol process is much smaller than the petroleum refinery, so using aconstruction time of more than 24 months is conservative and fits within these references. Delta-
T’s experience with grain-to-ethanol plants indicates that it will require a little more than 2 yearsto complete a project of this size. An important difference between this type of facility and arefinery are the large number of field-erected vessels in this process. Their on-site constructionand proximity will cause the construction time to be a little longer. Table 34 summarizes theschedule for construction and the cash flow during that time.
68

8/4/2019 NRL Report
http://slidepdf.com/reader/full/nrl-report 79/154
Table 34. Construction Activities and Cash Flow
Project Start Month
Project End
Month
Activity Description % of Project
Cost 0 6 Project plan and schedule established, conceptual and
basic design engineering, permitting completed. Major equipment bid packages issued, engineering started onselected sub-packages, P&IDs complete, preliminary plant and equipment arrangements complete.
8.00%
6 18 All detailed engineering including foundations, structure, piping, electrical, site, etc. complete; all equipment andinstrument components purchased and delivered; all sitegrading, drainage, sewers, rail, fire pond, foundation,and major structural installation complete; 80% of allmajor process equipment set (all except longest leaditems), all field fabricated tanks built, and the majority
of piping and electrical materials procured.
60.62%
18 30 Complete process equipment setting, piping, andinstrumentation installation complete; all electricalwiring complete; all building finishing and plumbingcomplete; all landscaping complete; pre-commissioningcomplete; and commissioning, start-up, and initial performance test complete.
31.38%
TOTAL 100.00%
Notes:1. The above presumes no utility or process equipment orders placed prior to month seven.2. Expenditures based on typical 60 MM gal/yr grain-to-ethanol facility.
Perry and Green75 indicate that for a moderately complex plant start-up should be about 25% of the construction time - or 6 months, in this case. Delta-T’s experience with start-up demonstratesthat a large grain-to-ethanol plant could be started in less time, but a biomass ethanol plant ismore complex than a grain ethanol plant. Considering that this design is for the “nth” operating plant, we assumed a start-up time of 6 months. The start-up period is not completely wasted,however. We expect that an average of 50% production could be achieved during that periodwith about 75% expenditure of variable expenses and 100% of fixed expenses.
Peters and Timmerhaus63 define working capital as money available to cover (1) raw materialsand supplies in inventory 2) finished product in storage, (3) accounts receivable, (4) cash on handfor monthly payments such as wages and maintenance supplies, (5) accounts payable, and (6)
taxes payable. They indicate that working capital is usually 10%-20% of the total capitalinvestment. This flow of money is required over the life of the plant, beginning in the start-up phase to make product that generates revenue to use in purchasing more materials and supplies.For this project, 10% would be about $18 million. On-site ethanol storage capacity is seven days;assuming the product can be made, shipped and payment received in 30 days is conservative.One month’s raw materials, labor, maintenance, taxes and overhead is $4 million. Therefore, alower number seems reasonable. Garrett6 suggests that using a fraction of the yearly operatingcost, typically 10-35% is more relevant. Using these percentages results in a working capitalrange of $5 to $16 million. We chose to use $10 million, or 5% of the total capital investment.
69

8/4/2019 NRL Report
http://slidepdf.com/reader/full/nrl-report 80/154
Table 35 summarizes the parameters used in the discounted cash flow analysis.
Table 35. Discounted Cash Flow Parameters
Plant Life 20 years
Discount Rate 10%
General Plant Depreciation 200% DBGeneral Plant Recovery Period 7 years
Steam Plant Depreciation 150% DB
Steam Plant Recovery Period 20 years
Federal Tax Rate 39%
Financing 100% equity
Construction Period1st 6 Months Expenditures
Next 12 Months ExpendituresLast 12 Months Expenditures
2.5 years8%61%31%
Working Capital 5% of Total Capital Investment
Start-Up TimeRevenuesVariable CostsFixed Costs
6 months50%75%100%
Using the discounted cash flow parameters in Table 35, plus the cost information in Table 29, 30and 32, the resulting minimum ethanol selling price of pure ethanol is $1.07/gal (see Table 36).Using the total project investment estimate margin of +25%/-10%, the impact on the cost of ethanol would be a low of $1.02/gal and a high of $1.19/gal. Samples of the discounted cashflow, operating costs, and summary worksheets are in Appendix D.
Table 36. Summary of Yields, Rates, and Conversion Costs
Feedstock Rate (dry metric tons/day) 2,000Ethanol Yield (gal/dry US ton feedstock) 89.7
Ethanol Production (MM gal/yr) 69.3
Total Equipment Cost (MM $) 113.7
Total Project Investment (capital) (MM $) 197.4
Non-feedstock Raw Materials (MM $/yr) 12.7
Waste Disposal (MM $/yr) 2.0
Fixed Costs (MM $/yr) 7.5
Excess Electricity Generated (kWh/gal ethanol) 2.28
On-Line Time (hr/yr) 8,406
Minimum Ethanol Selling Price $1.07 /gal (+$0.12/-$0.05)
Model: I0203I, 2000 $
The $1.07/gal can be further broken down into the cost of each process area. Figure 18 illustratesthe contribution to the overall cost by process area and capital, operations, and fixed costs.
70

8/4/2019 NRL Report
http://slidepdf.com/reader/full/nrl-report 81/154
Storage
UtilitiesBoiler/Turbogenerator
Wastewater Treatment
Distillation and Solids
Recovery
Cellulase
Saccharification
& Fermentation
Pretreatment /
Conditioning
Feed Handling
Biomass
-20% -10% 0% 10% 20% 30% 40%
Raw Materials Process Electricity
Fixed Costs
31%
5%
19%
8%
9%
12%
2%
8% (Net)
4%
1% $1.07/gallon +$0.12/-$0.05
Capital Recovery Charge
Grid Electricity Total Plant Electricity
Figure 18. Cost Contribution Details from Each Process Area (% of Ethanol Selling Price)
These costs are probably still too high for a company to start constructing a grass-roots plant based on undemonstrated technology. Plants that are being engineered today have some nichethat allows them a special advantage in the short term for a small market segment. This could befeedstock costs (very low or negative for environmental wastes), used equipment (making use of
related equipment that has been shut down), co-location with existing facilities (biomasscombustors and waste treatment facilities), or a combination of these. It is not expected that grassroots, large-scale cellulosic biomass-to-ethanol plants will be built until after these first pioneer plants.
III.1.5 The Cost of Sugar
Sugars are an intermediate product in the formation of ethanol. Hemicellulose is hydrolyzed toform xylose, arabinose, galactose, and mannose in the pretreatment area. Cellulase enzymesaccharifies the cellulose into glucose. For this analysis enzymatic hydrolysis is assumed to beoperated in a near sterile way and nearly to completion so that a transferable sugar stream is produced as product.
To analyze the cost of the intermediate sugar stream the following areas were removed from the biomass-to-ethanol process model and economics: wastewater treatment (a cost was kept for treatment of the pretreatment flash vapor), fermentation, distillation and stillage treatment, andstorage. Also, a counter-current washer was added after the saccharification area to separatelignin for combustion from the dilute mixed sugar stream. Mass balances and capital andoperating costs were determined for the sugar process and the minimum sugar transfer price wascalculated to be 6.4¢/lb. Table 37 shows the sugar stream composition. As in the design case for
71

8/4/2019 NRL Report
http://slidepdf.com/reader/full/nrl-report 82/154
ethanol, all of the hydrolysis (90% of theoretical) is assumed to occur in the saccharificationtanks. In reality, glucose levels in the saccharification step may limit the extent of hydrolysis.
Table 37. Mixed Sugar Stream Concentration From Saccharification
Sugar Concentration (g/L)
Glucose 65
Xylose 38Arabinose 5.2
Mannose 2.7
Galactose 3.4
Total 114.3
Model: R0204E
In some cases the lignin stream can be sold either to a nearby plant that converts lignin intohigher value byproducts or a larger more cost-efficient biomass power facility. Selling the ligninat the same price as the feedstock (on a lower heating value basis) reduces the sugar price to5.6¢/lb.
IV. Sensitivity Analysis
The cost of ethanol as determined in the previous section was derived using technology that has been developed or is currently being developed. The process targets in the design represent whatmust be achieved to obtain the $1.07 per gallon reported. When any target is not met, the cost isaffected to varying degrees. In addition, uncertainty about equipment design and installation andconstruction costs will impact the economics. Some process targets can be met through researchof the core technologies: feedstock collection, pretreatment, saccharification (enzymedevelopment) and fermentation (ethanologen development). Others, like feedstock compositionvariability are not as controllable. The key is to understand the impact of those types of parameters that are likely to vary, and how they might be controlled to a definable range. For example, corn stover may need to be stored covered, or be used within a certain window after harvesting to avoid carbohydrate degradation. Equipment and operating costs are another areathat research is less able to affect, since demand will affect the price of the ingredient or equipment. Discussed here are process targets that have been identified as key ones to understandand achieve. In most cases, values used for the sensitivities are picked from current experimentaldata, to demonstrate the effect of technology advancement (or lack of) on the economic viabilityof the process.
IV.1 Stover Composition, Cost, and Handling
Different parts of the corn have different compositions. The relative proportions of the variousanatomical parts present in a given lot of feedstock will be affected by the genetics of the corn,environmental factors, harvest, and storage practices. These variations can have a significant
effect on cost through yield alone, and preliminary observations suggest that variation in thesolids composition of anatomical fractions of a plant can have an effect on pretreatmentefficiency13.
Improved harvesting methods, weather, and demand are some of the factors that will affect thestover cost. The results of a small stover collection program in 1997-1998 by Iron Horse CustomFarming of Harlan, Iowa, reported stover collection costs between $31-$36 per dry U.S. ton9.Studies by contractors for DOE have reported a range of $35-$46 per dry U.S. ton with current
72

8/4/2019 NRL Report
http://slidepdf.com/reader/full/nrl-report 83/154
----- -----
collection methods77. ORNL has reported that almost all of the collectable stover becomesavailable for $55 per dry U.S. ton11. If these prices remain the norm due to any of the factorsmentioned above, then the production cost of ethanol could be as high as $1.35/gal using stover purchased at $55 per dry U.S. ton.
Bale handling in the plant is currently envisioned to require a large complement of yard workers
to move the bales from the trucks to storage or the feedstock handling area. Harris estimated 4laborers per shift. If the number can be reduced from 32 to 8 (2 per shift) the resulting costsavings is $0.02/gal. Such a reduction might occur from improved handling equipment or practices.
IV.2 Pretreatment Yields and Cost
Conversion of the hemicellulosic portion of the stover is important when it contains almost half (44%) of the available sugars. Xylan makes up 72% of the hemicellulosic sugars. Table 38shows the effect of pretreatment yield on overall yield and ethanol selling price. If no moreimprovement is made in yields than the current data25 shows, then there is a $0.11/gal increase inthe ethanol selling price.
Table 38. Effect of Pretreatment Yields on Minimum Ethanol Selling Price
Pretreatment Hemicellulose to Monomer Yield
Overall
Ethanol Yield
(gal/dry U.S.
ton)
Change in
Overall
Yield (%)
Ethanol Selling Price
($/gal)
Change in price
from design case
($/gal)
67.5% 80.4 -10 $1.18 +$0.11
80% 85.5 -5 $1.12 +$0.05
90% 89.7 $1.07
95% 91.6 +2 $1.05 -$0.02
While the equipment designed for continuous dilute acid pretreatment of the stover is similar tohydrolyzers used in the pulp and paper and rendering industries, the solids handling for stover may be significantly different, causing a more expensive reactor. Conditions in the reactor mayrequire more exotic metallurgy than Inconel. These are not first of a kind costs, but a moreexpensive reactor design overall. If the costs are 50% higher (or lower) than currently envisioned(about $17MM installed equipment cost), the ethanol selling price will change by $0.04/gal.
IV. 3 Gypsum
Solid-liquid separation prior to overliming and neutralization allows gypsum to be removed fromthe process and prevents deposits in the high temperature product recovery equipment. If thisstep is removed, there is a savings of $0.03/gal due primarily to capital reduction (-$7.2MM in
conditioning/neutralization, +2.1MM in saccharification/fermentation and distillation) and aslight yield increase (0.4 gal/ton) from sugars that exited with the gypsum waste stream. Theseeffects are easy to quantify. The impact of having the gypsum in the process is more difficult totranslate to cost. Without the separation, gypsum in the saccharification feed stream (306) goesfrom 28 kg/hr (0.1%) to 5,100 kg/hr (1%). It is 0.06% of the solids with the separation and
becomes 10% of the solids if the separation is removed. About this same concentration goes tothe stripper column and the first evaporator effect; high solids recovery in the solids recoveryseparation step keeps most of the gypsum out of the second and third effects. The gypsum ends
73

8/4/2019 NRL Report
http://slidepdf.com/reader/full/nrl-report 84/154
up in the combustor, lowering the feed’s lower heating value 15% (4,179 to 3,552 Btu/lb). Thegypsum will affect the SOx production in the combustor, but whether positively due to thecalcium, negatively due to the sulfur, or some combination of both is unknown at this time. Theunreacted portion will go with the ash to waste disposal.
IV.4 Saccharification and Fermentation Yields and Costs
If the enzyme cost is higher or lower than estimated in this analysis, it will have a direct effect onthe ethanol selling price. Since the cellulase subcontracts are in the second year, it is early tohave a preparation to test for efficacy and determine loading. There are several possible trade-offs to minimize the overall effect of a higher than expected enzyme cost per ethanol gallon. Oneof them is residence time. Doubling the residence time in the saccharification tanks (from 1.5days) will increase the TPI by $4.4MM and the ethanol selling price by $0.01/gal. For every 5FPU/ g cellulose increase in loading, the ethanol selling price increases $0.04/gal, so for the costof doubling the residence time, only a minimal increase in loading can be achieved.
If increasing the residence time can minimize the enzyme loading, the overall MESP can beminimized using a sensitivity analysis with empirical data. An example of that sensitivity
analysis was run on an unoptimized corn stover pretreatment (P010129CS). That pretreatmentwas run at 165°C for 8 min. with an acid concentration of 1.37% and is described in a paper bySchell78. The enzymatic digestibilities of the resulting hydrolyzed solids were measured in anSSF using Iogen (Ottawa, Canada) cellulase enzyme (lot no. BRC 191095) and a Saccharomycescerevisiae D5A in shake flasks. The flasks were loaded with 5.65% cellulose (equivalent toapproximately 17% total solids). Since the enzyme is not representative of what will be produced by the DOE/enzyme manufacturer partnerships, the pretreatment conditions were not optimized,and the enzymatic digestibility measurements do not match process conditions (e.g.,saccharification without fermentation vs. SSF with only glucose fermented) this study is only anexample. It is not intended to show the ideal enzyme loading/residence time combination butrather to show how that optimization could be determined.
Yields from the SSF were calculated by dividing the final ethanol concentration by the theoreticalethanol concentration from cellulose after subtracting out ethanol added with the inoculum. Theresulting yield is probably a conservative estimate of cellulose conversion because it does notinclude other fermentation products; however, it is close to what can be achieved in the process.Figure 19 shows ethanol yields for five enzyme loadings (5, 10, 15, 20, and 25 FPU/g cellulose)at multiple SSF times (ranging from 7 hours to 168 hours). Since only SSF data are available, for modeling purposes we assumed that the sacccharification and fermentation times are each half of the SSF time. In the design case, the enzyme loading is 12 FPU/g cellulose, the saccharificationtime is 36 hours, the fermentation time is 36 hours (the equivalent SSF time is 72 hours), and thecellulose hydrolysis yield is 90%. Those parameters are discussed in section II.3.4 and wereachieved using a more optimum pretreatment than was used for this study; therefore, the designcase has better results than those shown in Figure 19.
74

8/4/2019 NRL Report
http://slidepdf.com/reader/full/nrl-report 85/154
100
90
80
70
60
50
40
30
20
10
5
10
15
20
25Loading
(FPU/g)
0
0 20 40 60 80 100 120 140 160Time (Hours)
Figure 19. SSF Yields for Multiple Enzyme Loadings
Each of the enzyme loading, residence time, and yield combinations shown in Figure 19 wereentered into the process model, and the model was run to calculate the corresponding MESPs.Those MESPs are shown in Figures 20 and 21. Figure 20 portrays the MESP at each time pointwith each of the enzyme loadings. It shows that the residence time should be at or above 144hours and that the effect of increasing residence time is large until it reaches about 120 hours.Figure 21 portrays the MESP at each enzyme loading with each time point. It shows that the
optimum enzyme loading is about 10 FPU/g cellulose. Both figures show the decreasing effectadditional fermentation time (as additional fermentation capacity) has on the ethanol selling price.These results are highly dependent upon the corn stover, pretreatment conditions, enzymecocktail, saccharification/fermentation design, and enzyme cost so the optimums will probablychange if any of those process options are different.
Y i e l d ( % )
75
180

8/4/2019 NRL Report
http://slidepdf.com/reader/full/nrl-report 86/154
M E S P ( $ / g a l )
M E S P ( $ / g a l )
$1.60
$1.50
$1.40
$1.30
$1.20
$1.10
$1.00
$1.60
$1.50
$1.40
$1.30
$1.20
$1.10
$1.00
5
1015
20
25
Loading
(FPU/g)
0 20 40 60 80 100 120 140 160 180
Time (Hours)
Figure 20. MESPs for Multiple Enzyme Loadings
120
144
168
Residence
Time
(hours)
0 5 10 15 20 25 30
Loading (FPU/g cellulose)
Figure 21. MESPs for Multiple Residence Times
Hemicellulase activity in the enzyme preparation may also reduce costs by allowing for a milder pretreatment. Again, the work is at an early stage, but some of the commercial preparations show
76

8/4/2019 NRL Report
http://slidepdf.com/reader/full/nrl-report 87/154
hemicellulase activity. NREL is investigating opportunities in hemicellulase and other “accessory” enzymes.
Finding or engineering an organism to ferment hemicellulosic sugars is key to economic yieldsfrom stover. If an organism is developed, it may metabolize xylose and the minor sugars slower than, or after, glucose. If the minor sugars (arabinose, mannose, galactose) are not converted,
there is a $0.09/gal increase ($0.04, $0.03, $0.02/gal, respectively) in the ethanol selling price.Table 39 shows other yield effects from a less than robust multi-fermentation organism(s).Increasing the residence time to 3 days has the same minimal effect on the ethanol selling price asincreasing saccharification time, $0.01/gal, so using it to increase ethanol yield can offsetorganism efficiency.
IV.5 Energy Production
Solids combustion (coal) is well known. Biomass co-firing has become industry practice among power generators to reduce emissions, and biomass power generation has been in California for several years. Aside from biomass, pulverized coal and coal slurries are the fuels most similar tothe lignin residue from the ethanol process. A circulating fluidized bed combustor has been
identified as the most likely combustor for this feed without drying it. If a CFBC requiresadditional drying or feed handling equipment for the residue, the cost may increase. Conversely,a cheaper type of combustor, like a modified pile or grate burner may be adequate. If thecombustor costs (currently $20.6MM installed equipment cost) change by 50%, the ethanol priceis affected by $0.05/gal. A 30% change translates to a $0.03/gal effect.
A $0.041/kWh credit is assumed for excess electricity produced by the plant and sold “to thegrid”, which is usually an avoided use credit. If the value of the electricity were only$0.02/kWh79, the ethanol selling price would be $1.12/gallon; if the value were $0.06/kWh, theethanol selling price would be $1.02/gallon. The value of power is highly regional and fluctuatesalmost by the hour. There is the uncertainty of the plant’s ability to meet contracts or get a good price by supplying more at peak demand. A worst case scenario would be no revenue for the
excess power, implying that the excess steam would be vented or used for some other non-revenue producing work. There may be some cost benefit in using the excess steam to heat the plant buildings. No net revenue for electricity means $0.09/gal increase. Assuming the plantcould purchase electricity for $0.04/kW makes the ethanol selling price $1.16/gal (with theturbogenerator removed from the design), which again hinges on the electricity cost variations.Given these two choices, in-house electricity production makes sense as a way to keep the costscontrolled unless capital costs are controlling the decision.
If there were a value for the lignin residue outside of the plant, purchasing electricity and producing steam with a gas boiler would also reduce the capital costs.
77

8/4/2019 NRL Report
http://slidepdf.com/reader/full/nrl-report 88/154
-----
----- -----
----- -----
-----
----- -----
----- -----
-----
-----
----- -----
----- -----
Table 39 summarizes the sensitivity results by their cost impact.
Table 39. Summary of Sensitivity Results by Cost Impact
Design Parameter Values Overall
Yield (gal/dryU.S. ton)
Change
in OverallYield (%)
Ethanol Selling
Price ($/gal)
Change in
price from designcase
($/gal)Design Case Sensitivity
Xylose/minor sugar fermentation yields 85%/85% 50%/0% 72.0 -20 $1.31 +$0.24
Stover cost$30/dry U.S. ton
$50/dry U.S.ton 89.7 $1.29 +$0.22
Hemicellulose sugar fermentation yields 85% 50% 77.4 -14 $1.22 +$0.15
Minor sugar (arabinose,mannose, galactose)fermentation yields 85% 0% 81.1 -10 $1.17 +$0.10
Pretreatment yield 90% 67.5% 80.4 -10 $1.18 +$0.11Electricity credit $0.041 kWh 0 $1.16 +$0.09
$0.02/kWh 89.7 $1.12 +$0.05
$0.06/kWh 89.7 $1.02 -$0.05
Electricity source Produced Purchased $1.16 +$0.09
Pretreatment yield 90% 80% 85.7 -4 $1.12 +$0.05
Enzyme loading 12 FPU/gcellulose
17 FPU/gcellulose
89.7 $1.12 +$0.05
Glucose yield 95% 85% 84.4 -6 $1.12 +$0.05
Combustor cost $20.6MM +50% $1.12 +$0.05
Pretreatment reactor cost $17MM +50% $1.11 +$0.04
Glucose yield 95% 90% 87.0 -3 $1.10 +$0.03
Saccharification or fermentation residencetime
1.5 days 3 days 89.7 $1.08 +$0.01
Pretreatment yield 90% 95% 91.6 +2 $1.05 -$0.02
Stover handling labor 8/shift 2/shift 89.7 $1.05 -$0.02
Combustor cost $20.6MM -30% $1.04 -$0.03
Solid-liquid separation before overliming
Yes No 90.1 +0.5 $1.04 -$0.03
Pretreatment reactor cost $17MM -50% $1.03 -$0.04
IV.6 Monte Carlo Analysis
IV.6.1 Overview
Monte Carlo analysis is a probabilistic analysis method that couples results with the uncertaintyof values entered into a model. The basic uncertainty of parameter values can be representedwith random distribution functions and the results can be shown as probability curves.
Since all parameter values have some uncertainty, reporting a single result set is anoversimplification of the potential results. The single result set is valid for the input set of data if
78

8/4/2019 NRL Report
http://slidepdf.com/reader/full/nrl-report 89/154
------- ------- -------
all values are absolutely accurate; however, a probability curve better represents real results basedon uncertainty of the input parameters. The Monte Carlo analytical method allows the user toselect one or more input parameters and define the probability curve of values for those parameters. It then utilizes random selection (according to the probability assigned) to set a valuefor each parameter, calculates the result, records the results, and repeats the process of selection,calculation, and recording numerous times. The final results can be reported in several different
types of curves; the most common are histograms and probability curves.
The primary use of Monte Carlo simulation has been for financial decisions, although a fewgroups have begun to use it in the scientific arena. As early as 1986, NREL staff proposedutilization of Monte Carlo analysis as a management technique for biomass-to-ethanol research80.They used cumulative probability curves to compare potential processes and focused on their overlaps and MESP with 50% probability. Akerberg and Zacchi show a probability curve of the production cost of lactic acid from starch81 to emphasize that a single production cost isinsufficient.
As a preliminary Monte Carlo analysis for this process model, we selected several economic parameters, defined their probability curves, and calculated the resulting probability curves for
ethanol selling price and total project investment. Utilizing Crystal Ball82 as an add-in to Excel83
simplified the task of curve definition and recording and reporting of results. Process performance parameters were not varied during this analysis because of the difficulty of runningan ASPEN simulation for each iteration. We plan to develop a method for Monte Carlo analysisof process parameters so that we can link economic results to research uncertainty as well aseconomic uncertainty.
IV.6.2 Parameter Estimates
Probability curves were defined for the following 5 parameters: stover cost, value of excesselectricity, enzyme price, pretreatment reactor purchase price, and project contingency. Three of the parameters (stover cost, value of excess electricity, and enzyme price) affect operating costs
directly. The other two (pretreatment reactor purchase price and project contingency) affect thecapital investment and fixed operating costs that are scaled off of capital investment. Table 40shows the distributions of the five parameters.
Table 40. Input Parameter Distribution for Monte Carlo Analysis
Stover cost Value of Excess
Electricity
Enzyme Price
Pretreatment Reactor
Purchase Price
Project Contingency
DistributionFunction
Triangular Normal Triangular Lognormal Triangular
Most
Probable*
$30/dry US ton $0.04/kWh $0.10/gal
ethanol
$2,457,000 3%
StandardDeviation
$0.008/kWh $500,000
Minimum $25/dry US ton $0.02/kWh $0.07/galethanol
$0 2%
Maximum $50/dry US ton Infinite $0.20/galethanol
Infinite 25%
* Mean for normal and lognormal distributions
79

8/4/2019 NRL Report
http://slidepdf.com/reader/full/nrl-report 90/154
In all cases, the most probable input is the value in the standard model and has been reported in previous sections.
Two thousand iterations were run using the above probability distributions. For each iteration, all5 parameters were randomly varied according to the defined distribution for each value andresults were calculated and recorded.
IV.6.3 Results
The minimum ethanol selling price, total project investment, and Lang factor results wererecorded. All results are based only upon the minimal number of varied values shown above.Obviously, a better analysis can be done once process performance parameters can beinvestigated in addition to the economic parameters that are currently being reported.
Figure 22 is a histogram of the minimum ethanol selling price and shows that the 90% confidenceinterval of the MESP is $1.06/gal to $1.29/gal. Figure 23 is the probability curve of the MESPand shows that the MESP has a 7% probability of being $1.07/gal or less and that it has a 50% probability of being $1.17/gal or less.
Forecast: MESP2,000 Trials Frequency Chart 8 Outliers
.016 32
.012 24
.008 16
.004 8
.000 0 1.36
1.00 1.09 1.18 1.27 1.36
Certainty is 90.00% from 1.06 to 1.29
Figure 22. Histogram of the Minimum Ethanol Selling Price
80

8/4/2019 NRL Report
http://slidepdf.com/reader/full/nrl-report 91/154
Forecast: MESP
2,000 Trials Cumulative Chart 8 Outliers
1.000 2000
.750
.500 1000
.250 500
.000 0
1.00 1.09 1.18 1.27 1.36
Figure 23. Probability Curve of the Minimum Ethanol Selling Price
Figure 24 is a histogram for the total project investment and shows that the 90% confidenceinterval for the TPI is $192,000,000 to $223,000,000.
Forecast: TPI
2,000 Trials Frequency Chart 17 Outliers
.025 49
.018 36.75
.012 24.5
.006 12.25
.000 0184,000,000 196,000,000 208,000,000 220,000,000 232,000,000
Certainty is 90.10% from 192,000,000 to 223,000,000
Figure 24. Histogram of the Total Project Investment
81

8/4/2019 NRL Report
http://slidepdf.com/reader/full/nrl-report 92/154
V. Planned Improvements and Extensions to the Model
The process design and economic model that we have described here is not a static tool. Not onlywill the information contained in the model will be continually improved, but the scope of technologies and the capabilities for calculation will also be expanded. The following gives a
brief overview of the work currently underway or planned.
V.1 Water Balance and Optimization
Efficient water usage in a process can reduce the overall costs significantly. Alternate treatmentschemes can reduce wastewater treatment costs, such as a fractionated approach where wastestreams are treated differently by type. These may prove more efficient than the current system.Water recycle to the process will also be evaluated to determine the optimal approach to using thevarying degrees of treated water available.
V.2 Fermentation pH Control
Biologically catalyzed processes can have a very narrow band of optimum operating conditions.
The metabolic pathways of an organism are dependent on temperature, pH, inhibitors, and manyother parameters. Two of the by-products of ethanol fermentation, acetic acid and lactic acid,cause a lowering of pH. In addition, some contaminant microorganisms may produce additionalorganic acids. Current process models do not address neutralizing the acids made duringfermentation to ensure the optimum pH is maintained.
V.3 Air Emissions
There are several areas where air emissions are a concern. VOCs, and ethanol are producedduring fermentation. Adequate treatment of these gases in the existing scrubber and by other means needs to be assured. Combustion of lignin residue generates SOx, NOx, and particulates.The mechanisms and amounts of these gases generated should dictate whether alternative or
improved treatment is necessary. For example, emissions that exceed EPA limits for a biomass-to-ethanol plant will require further attention.
V.4 Greenhouse Gas Emissions
Carbon dioxide is a by-product of fermentation. Combustion of the lignin residue produces N2O,CO and CO2 that are considered greenhouse gases. Greenhouse gas emissions from the bioethanol facility are comprised of carbon dioxide (CO2), nitrous oxide (N2O) and methane(CH4). There are many other compounds that have some potential for causing global warming, but these three are the most potent. CO2 is the dominant greenhouse gas in emitted by the plant.It is generated as a result of lignin residue combustion in the boiler and as a byproduct of thefermentation of glucose to ethanol in the fermentors. Because CO2 is by far the largest
contributor to climate change effects, it is used as the standard for rating the relative globalwarming potential of other greenhouse gases. In other words, CO2 is assumed to have a globalwarming potential (GWP) of 1. While N2O emissions are much lower globally (and in this plant),they have a very high GWP. One gram of N2O is equivalent to 360 grams of CO2. Methane isalso a potent greenhouse gas. One gram of methane is equivalent to 24 grams of CO2. NOx andother air pollutants can effect climate change, but their impacts are small relative to the GWP of CO2.
82

8/4/2019 NRL Report
http://slidepdf.com/reader/full/nrl-report 93/154
V.5 Lignin Gasification and Gas Turbine Power Generation
Another alternative to simply burning the lignin to generate steam and power is to gasify thelignin and use a gas turbine to generate power in combination with a steam turbine. Thistechnology, termed integrated gasification combined cycle (IGCC) power generation, is currently being pursued by the DOE Biomass Power Program for use on biomass feedstocks. The current
base case will be modified to incorporate this technology so that a comparison can be made between it and conventional lignin combustion.
V.6 Physical Properties of Corn Stover
As NREL works more with corn stover, we expect our knowledge base of its composition and properties to expand. This information will be incorporated into the mass and energy balancemodels to improve its predictive capabilities and provide a better picture of the energy balance of the process.
References and Notes
1 Wooley, R., M. Ruth, J. Sheehan, K. Ibsen, “Lignocellulosic Biomass to Ethanol ProcessDesign and Economics Utilizing Co-Current Dilute Acid Prehydrolysis and EnzymaticHydrolysis Current and Futuristic Scenarios,” NREL report TP-580-26157, July 1999.http://www.ott.doe.gov/biofuels/process_engineering.html
2 “Wastewater Treatment Options for the Biomass-To-Ethanol Process,” NREL SubcontractAXE-8-18020-01, Merrick & Company, Aurora, CO, February 24, 1998.http://www.ott.doe.gov/biofuels/process_engineering.html
3 “Steam and Electricity Generation Options For the Biomass-To-Ethanol Process,” NRELSubcontract ACO-8-18019-01, Reaction Engineering International, Salt Lake City, UT, March16, 1998. http://www.ott.doe.gov/biofuels/process_engineering.html
4
ASPEN Plus
TM
, Release 10.2, Aspen Technology, Inc., Cambridge, MA, February 2000.5 Wooley, R.J. and V. Putsche, “Development of an ASPEN PLUS Physical Property Database
for Biofuels Components,” NREL, Golden, CO, Report MP-425-20685, April 1996.http://www.afdc.doe.gov/pdfs/3955.pdf
6 Garrett, D.E., Chemical Engineering Economics, Van Nostrand Reinhold, New York, 1989.
7 Riley, C. and D. Schell. Technical and Economic Analysis of an Enzymatic Hydrolysis Based Ethanol Plant . Solar Energy Research Institute Internal Report. Golden, CO, 1991.
8 Sheehan, J. et al. Is ethanol from corn stover a sustainable fuel? A Case Study in Cyber
Farming. National Renewable Energy Laboratory, Golden, CO. In Press.
9 Glassner, D., J. Hettenhaus, T. Schechinger, “Corn Stover Collection Project,” in BioEnergy
’98—Expanding Bioenergy Partnerships: Proceedings, Volume 2, Madison, WI, pp 1100-1110,1998. http://www.afdc.doe.gov/pdfs/5149.pdf.
10 Ruth, M., “Large Scale Ethanol Facilities and Short Cut for Changing Facility Size,” InternalReport, National Renewable Energy Laboratory Technical Memo, October 1999.
11 Walsh, M.E., et al, ”Biomass Feedstock Availability in the United States: 1999 State LevelAnalysis”, Bioenergy Information Network, Bioenergy Feedstock Development Program, Oak Ridge National Laboratory, January 2000. http://bioenergy.ornl.gov/resourcedata/
83

8/4/2019 NRL Report
http://slidepdf.com/reader/full/nrl-report 94/154
12 Two separate batches of corn stover were received from B/MAP in May and November 2001.Sample analysis from totes 10,7,11 and 6 were used from the May batch. Sample analysis for Sunds runs P011211CS and B/MAP sample 112901CS were used from the November batch.
13 Thomas, S. et al, “Estimating the Effects of Compositional Variation on Biomass Conversion
Process economics,” Internal Report, National Renewable Energy Laboratory C milestonereport to DOE, October 2001.
14 Templeton, D.; Hames, B.; Ruth, M.; Wiselogel, A.; McMillan, J. “Determine CompositionalStability of Corn Stover during Outdoor Storage: Year One Results,” NREL milestone reportto DOE, April 2000.
15 Templeton, D., B. Hames, J. McMillan, “Compositional and Storage Stability Study: Year 2Results,” Internal Report, National Renewable Energy Laboratory P milestone report to DOE,July 2001.
16 “Baled Feedstock Handling System,” report no. 99-10600/13, NREL Subcontract ACO-9-29067-01, Harris Group Inc., Seattle, WA, October 11, 2001.http://www.ott.doe.gov/biofuels/process_engineering.html
17 “Continuous Acid Hydrolysis Reactor,” report no. 99-10600/17, NREL Subcontract ACO-9-29067-01, Harris Group Inc., Seattle, WA, January 22, 2001.http://www.ott.doe.gov/biofuels/process_engineering.html
18 Hayden, J.G., and J.P. O’Connell, “A Generalized Method for Predicting Second VirialCoefficients,” IEC Process. Des. Dev., 14(3), 209, 1975.
19 “Liquid/Solid Separation’” report no. 99-10600/14, NREL Subcontract ACO-9-29067-01,Harris Group Inc., Seattle, WA, March 6, 2001.
20 Ranatunga, T.D., J. Jervis, R.F. Helm, J.D. McMillan, and C. Hatzis. “Identification of Inhibitory Components Toxic Toward Zymomonas mobilis CP4(pZB5) Xylose Fermentation,” Appl. Biochem. Biotechnol . 67: 185-198, 1997 defines the hold time to be 30 minutes. The
time is increased to 1 hr in the model to allow for reduced heating rates and different reactionkinetics in a large continuous stirred-tank reactor (CSTR).
21 H. Majdeski, Delta-T, Williamsburg, VA, personal experience in the flue gas desulfurizationindustry, 1998.
22 Letter to B. Bunner, Delta-T Corporation, Williamsburg, VA, from A. Bowser, Komline-Sanderson Limited, Peapack, NJ, August 1998.
23 ICARUS Process Evaluator, Version 4.0, ICARUS Corporation, Rockville, MD, June 30, 1997.
24Jechura, J. “Correlation of Metal Corrosion Data,” Internal Report, National Renewable EnergyLaboratory Technical Memo, March 2001.
25 Near-term Ethanol prehydrolysis run in NREL’s Sunds reactor. Run #P001207CS Carbon
Balance Point 2. Limited discussion of this run in “Preliminary Investigation of Corn Stover Pretreatment Using Dilute Sulfuric Acid” by D. Schell, Internal Report, National RenewableEnergy Laboratory, July 2001.
26 Nguyen, Q., “Summary of Corn Stover Pretreatment using the 4-L Steam Gun,” run number CS000914-02, Internal Report, National Renewable Energy Laboratory Technical Memo,March 2002.
27 The Sunds reactor in the PDU has been run at approximately 30% solids in several recent runs,most recently in March 2002, run number P020311CS #5. Compositional analysis of pretreated
84

8/4/2019 NRL Report
http://slidepdf.com/reader/full/nrl-report 95/154
material from these runs suggests that some of the lignin is being solublized; although rigorousmass balances to determine the lignin fate have not been completed to date.
28 Leonard, R.H. and G.J. Hainy, Industrial and Engineering Chemistry, vol. 37 no. 4, pp. 390-395, 1945.
29 Ranatunga, T.D., J. Jervis, R.F. Helm, J.D. McMillan, and R.J. Wooley, “The overliming of dilute acid pretreated lignocellulosics, Part 1. The fate of inorganics, uronic acids and ether soluble organics,” submitted to Enzyme and Microbial Technology, 1999.
30 Walker, L.P. and D.B. Wilson, “Enzymatic Hydrolysis of Cellulose: An Overview,” Bioresource Technology 36:3-14, 1991.
31 Zhang, M., C. Eddy, K. Deanda, M. Finkelstein, and S. Picataggio, “Metabolic Engineering of a Pentose Metabolism Pathway in Zymomonas mobilis,” Science, 267:240-243, 1995.
32Kadam, K., “Evaluation of Potential Strains for Corn stover to Ethanol Conversion,” InternalReport, National Renewable Energy Laboratory Technical Memo, December 2001. Severalresearch groups’ papers are listed in the bibliography that discuss different strain work.
33
McMillan, J.; Tucker, M.; Hayward, T.; Newman, M.; Ruth, M.; Farmer, J. “Demonstrate process technology meeting or exceeding process qualifier performance in the mini-pilot biochemical conversion system and assess continuous SSCF performance to recommend futurework,” Internal Report, National Renewable Energy Laboratory C milestone to DOE, October 1997. Duplicate SSCF runs were demonstrated in the mini pilot fermentation system using aninitial total solids loading of almost 20%.
34 This is the titer of the enzyme used in the NREL pilot facility, purchased from Iogen in 1995.
35 McMillan, J.D., M.P. Tucker, T.K. Hayward, C. Hatzis, and D. Glassner. “Process Qualifier Milestone,” Internal Report, National Renewable Energy Laboratory, Golden, CO, 31 August1996, Experiment PD 23 #3.
36 McMillan, J.D., M.P. Tucker, T.K. Hayward, C. Hatzis, and D. Glassner. “Process Qualifier
Milestone,” Internal Report, National Renewable Energy Laboratory, Golden, CO, 31 August1996, Experiment PD 23 #3. PD 23 #3 utilized a 24-hr residence time for seed production.
37 Kern, D.Q., Process Heat Transfer , McGraw-Hill, New York, 1950, pp. 720-723.
38 The seed reaction yields were assumed to be the same as fermentation yields in the ethanol production fermentors with increased cell mass production. Therefore the cell mass productionwas increased to 4% from both glucose and xylose and the xylose to products yield wasreduced to allow more xylose to be converted to cell mass.
39 The CSL loading used in McMillan, J.D., M.P. Tucker, T.K. Hayward, C. Hatzis, and D.Glassner, Process Qualifier Milestone, August 31, 1996, experiment PD 23 #3 was 1% clarifiedCSL. The experiment titled Nutrient Screen #2 for recombinant Zymo 39676pZB4L conducted
by the Enzymatic Process Development (EPD) team during fiscal year 1998 showed that 0.25%CSL was as effective as 1% CSL, so 0.25% CSL is used in the model.
40 Diammonium phosphate (DAP) is an inorganic nutrient typically added to SSCF experimentsfor nitrogen augmentation. It is typically provided at a concentration of 0.33 g/L as evident by Newman, M. “Three dry nutrient supplements obtained from the Marcor Corporation weretested and growth curves compared to media containing liquid CSL using the adapted strainr Zymomonas39676 (pZB 4L)”, Internal Report, National Renewable Energy Laboratory,Golden, CO, 20 September 2000. Notebook #2301, pp. 80-84. EPD experiment #EPD0007.
85

8/4/2019 NRL Report
http://slidepdf.com/reader/full/nrl-report 96/154
41 A loss of 3% of the fermentable sugars to non-ethanol products, such as lactic acid, is estimated based on conversations with corn ethanol producers who indicate they can tolerate acontamination loss less then 3%.
42 G. Brodl, P. Tetarenko, Vogelbusch, USA, personal communications with M. Ruth, 1998.
43 Combs, N., McMillan, J. “LAP Procedures #8 - SSF Experimental Protocols: LignocellulosicBiomass Hydrolysis and Fermentation,” Published Procedure, 30 October 2001.http://www.afdc.doe.gov/pdfs/4691.pdf . The LAP analysis resulted in 87.2% measuredconversion of insoluble glucan to ethanol. Assuming 3% loss of converted sugars to non-ethanol pathway products (e.g., cell mass and glycerol), the insoluble glucan to glucoseconversion is 90%. The other yields were measured in a full mass-balanced experiment onyellow poplar that is listed in the reference.
44 Dowe, N., “EPD0005: A Material Balance of the SSCF Using Whole In-house Cellulase Brothand Partially Washed Pretreated Yellow Poplar,” Internal Report, National Renewable EnergyLaboratory Experimental Report, March 2002.
45 Aersten, F., and G. Street, Applied Chemical Process Design, Plenum Press, New York, 1978.
46 “Wastewater Treatment Options for the Biomass-To-Ethanol Process,” NREL SubcontractAXE-8-18020-01, Merrick & Company, Aurora, CO, February 24, 1998.http://www.ott.doe.gov/biofuels/process_engineering.html pp. 9-10. Three samples wereanalyzed for components and tested (in triplicate) for COD. The COD calculated fromcomposition was 28,398 mg/L and the average measured CID was 27,199 mg/L.
47 http://my.ohio.voyager.net/~combs/arr/fp/tankcars.html
48 “Baled Feedstock Handling System,” report no. 99-10600/13, NREL Subcontract ACO-9-29067-01, Harris Group Inc., Seattle, WA, October 11, 2001. Found in Appendix G, vendor is Northwest Handling Systems, Inc. http://www.ott.doe.gov/biofuels/process_engineering.html
49 “Biomass-To-Ethanol Total Energy Cycle Analysis,” NREL Subcontract RCN 213-185-01-00Final Report, Radian Corporation, Austin, TX, November 22, 1991.http://www.ott.doe.gov/biofuels/process_engineering.html
50 Fluidized Bed Combustion and Gasification: A Guide for Biomass Waste Users, SoutheasternRegional Biomass Energy Program, FBT, Inc and Tennessee Valley Authority, Muscle Shoals,AL, July 1994. http://www.ott.doe.gov/biofuels/process_engineering.html
51 K. Ibsen, personal experience based on literature survey focused toward biomass residuecombustion, 1998.
52 “Economic Feasibility Study of an Acid Hydrolysis-Based Ethanol Plant,” NREL subcontractZX-3-03096-2 Final Report, Badger Engineers, Inc., Cambridge, MA, April 1987.http://www.ott.doe.gov/biofuels/process_engineering.html
53 “ASPEN Modeling of the NREL Boiler/Turbogenerator Systems,” NREL ConsultantAgreement CXL-8-18051-01, Final Report, V. Putsche, February 1998.
54 Babcock & Wilcox, 1978, Steam: It’s Generation and Use Thirty-ninth Edition. Babcock &Wilcox Company, New York, NY, p. 34/10-16.
55 Phillippek, C. et al, 1997. “NOx Formation and Reduction During Combustion of Wet SewageSludge in the Circulating Fluidized Bed,” 1997 Fluidized Bed Combustion vol. 2, ASME 1997.
86

8/4/2019 NRL Report
http://slidepdf.com/reader/full/nrl-report 97/154
56 Process Plant Construction Estimating Standards, electronic version section 100-374,Richardson Engineering Services, Inc., Mesa, AZ, 1999.
57 “Biomass to Ethanol Process Evaluation,” NREL Final Subcontract Report, Chem Systems,Tarrytown, NY, Appendix V, December 1994.
http://www.ott.doe.gov/biofuels/process_engineering.html58 W. Campbell, Foster Wheeler Corporation, Cost Quotation, Proposal 0-02-43731, to V.
Putsche, NREL, September 30, 1994.
59 “Technical and Economic Evaluation: Wood to Ethanol Process,” SERI Subcontract Report,Chem Systems, Tarrytown, NY, August 1990.http://www.ott.doe.gov/biofuels/process_engineering.html
60 Sheehan, J., “Analysis of Regional Conditions for Cooling Water Used in Ethanol ProductionTechnology,” Internal Report, National Renewable Energy Laboratory, Golden, CO, January1998.
61 MacFarlane, B., “Calculation of an Overall Carbon Balance for the Ethanol ProductionProcess,” Internal Report, National Renewable Energy Laboratory Technical Memo, June2001.
62 MacFarlane, B., “Calculation of the Overall Energy Balance for the Ethanol ProductionProcess,” Internal Report, National Renewable Energy Laboratory Technical Memo, December 2001.
63 Peters, M.S. and K.D. Timmerhaus, Plant Design and Economics for Chemical Engineers, 4thEdition, McGraw-Hill, Inc., New York, 1991.
64 “Biomass to Ethanol Process Evaluation,” NREL Final Subcontract Report, Chem Systems,Tarrytown, NY, December 1994. http://www.ott.doe.gov/biofuels/process_engineering.html
65 Walas, S. M., Chemical Process Equipment Selection and Design, Butterworth Publishing,1988.
66 “Process Design and Cost Estimate of Critical Equipment in the Biomass to Ethanol Process,” NREL Final Subcontract Report, Harris Group Inc., Seattle, WA, March 2001.
67 Energy Information Administration, Annual Energy Outlook 2001 with Projections to 2020.U.S. Department of Energy, Washington, DC, 2000. http://www.eia.doe.gov/oiaf/aeo/
68 “Chemical Engineering Plant Cost Index,” Chemical Engineering , January 2001.
69 “Biomass to Ethanol Process Evaluation,” NREL Final Subcontract Report, Chem Systems,Tarrytown, NY, p. VI-3, December 1994.
70 “U.S. Producer Price Indexes – Chemicals and Allied Products/Industrial Inorganic ChemicalsIndex,” from the Chemical Economics Handbook , published by SRI Consulting, a division of
SRI International, Menlo Park, CA, October 1997.71Bureau of Labor Statistics Data Web site (www.stats.bls.gov), National Employment, Hours,
and Earnings Catalog, Industry: Chemicals and Allied Products. Series ID: EEU32280006,Years: 1980 - 2000, annual average. Data extracted on March 1, 2001.
72 Short, W., D.J. Packey, and T. Holt, “A Manual for the Economic Evaluation and EnergyEfficiency and Renewable Energy Technologies,” National Renewable Energy Laboratory,Golden, CO, Report TP-462-5173, p.7, March 1995.
87

8/4/2019 NRL Report
http://slidepdf.com/reader/full/nrl-report 98/154
73 Short, W., D.J. Packey, and T. Holt, “A Manual for the Economic Evaluation and EnergyEfficiency and Renewable Energy Technologies,” National Renewable Energy Laboratory,Golden, CO, Report TP-462-5173, p. 19, March 1995.
74 Short, W., D.J. Packey, and T. Holt, “A Manual for the Economic Evaluation and Energy
Efficiency and Renewable Energy Technologies,” National Renewable Energy Laboratory,Golden, CO, Report TP-462-5173, pp. 20-21, March 1995.
75 Perry, R. H., and D. W. Green, Perry’s Chemical Engineers’ Handbook , 7th Edition, McGraw-Hill, New York, pp. 9-76, 1997.
76 Gary, J. H., and G. E. Handwerk, Petroleum Refining, Technology and Economics, 3rd Edition,Marcel Dekker, Inc., New York, 1994.
77 Ibsen, K. “Publish results of Bridge to Corn Ethanol Subcontracts,” Internal Report, NationalRenewable Energy Laboratory P milestone, February 2001.
78 Reported as runs #1 and #2 in Schell, D.J., J. Farmer, M. Newman, and J.D. McMillan. “DiluteSulfuric Acid Pretreatment of Corn Stover in a Pilot-Scale Reactor: Investigation of Yields,Kinetics, and Solids Enzymatic Digestibilities” presented at the Twenty-Fourth Symposium onBiotechnology for Fuels and Chemicals (Gatlinburg, TN, April-May 2002) and submitted to theconference proceedings which will be published in the Spring 2003 edition of AppliedBiochemistry and Biotechnology.
79 Comments from ethanol producers to J. Ashworth at the Enzyme Sugar Platform gate reviewmeeting held in 2002 suggest that $0.02/kWh is in the range for long term power purchase andsales contracts in key states (Nebraska, Kansas). $0.06/kWh is below the industrial rate of many East coast utilities currently, so it represents a reasonable high-end value.
80 Douglas, Larry J. “Monte Carlo Simulation as a Research Management Tool.” TAPPIProceedings of the 1986 Research and Development Conference. pp. 65-71.
81 Akerberg, Christina; and Zacchi, G. “An economic evaluation of the fermentation production
of lactic acid from wheat flour.” Bioresource Technology 75 (2000) 119-126.82Crystal Ball TM , Release 2000.1 Professional Edition, Decisioneering, Inc., Denver, CO,
September 2000.
83 Excel TM , Release 2000, Microsoft Corporation, Seattle, WA, 2000.
88

8/4/2019 NRL Report
http://slidepdf.com/reader/full/nrl-report 99/154
Appendix A
NREL Biofuels Process Design Database
Description and Summary

8/4/2019 NRL Report
http://slidepdf.com/reader/full/nrl-report 100/154
Appendix A NREL Process Design Database Description and Summary
NREL’s Process Engineering Team has developed a database of primary information on all of theequipment in the benchmark model. This database contains information about the cost, reference year,scaling factor, scaling characteristic, design information and back-up cost referencing. The information is
stored in a secure database in the Biotechnology Center for Fuels and Chemicals and can be directly linkedto the economic portion of the model. In addition to having all of the cost information used by the model, ithas the ability to store documents pertaining to the piece of equipment. These include sizing and costing
calculations and vendor information when available.
The following summarizes the important fields of information contained in the database. A partial listing
of the information is attached for each piece of equipment. Additional information from the database iscontained in the equipment cost listing in Appendix B.
Equipment Number:AB Unique identifier, the first letter indicates the equipment type and the firstnumber represents the process area, e.g., P-301 is a pump in Area 300
Equipment Name:AB Descriptive name of the piece of equipmentAssociated PFD: PFD number on which the piece of equipment appears, e.g., PFD-P110-A101Equipment Category:A Code indicating the general type of equipment, e.g., PUMP
Equipment Type:A Code indicating the specific type of equipment, e.g., CENTRIFUGAL for apump
Equipment Description:A Short description of the size or characteristics of the piece of equipment, e.g.,
20 gpm, 82 ft head for a pumpNumber Required:B Number of duplicate pieces of equipment neededNumber Spares:B Number of on-line spares
Scaling Stream:B Stream number or other characteristic variable from the ASPEN model bywhich the equipment cost will be scaled
Base Cost:B Equipment cost
Cost Basis:A Source of the equipment cost, e.g., ICARUS or VENDORCost Year:B Year for which the cost estimate is basedBase for Scaling:B Value of the scaling stream or variable used to obtain the base cost of the
equipment
Base Type: Type of variable used for scaling, e.g., FLOW, DUTY, etc.Base Units: Units of the scaling stream or variable, e.g., KG/HR, CAL/S
Installation Factor:B Value of the installation factor. Installed Cost = Base Cost x InstallationFactor
Installation Factor Basis: Source of the installation factor value, e.g., ICARUS, VENDOR
Scale Factor Exponent:B Value of the exponential scaling equationScale Factor Basis: Source of the scaling exponent value, e.g., GARRETT, VENDORMaterial of Construction:A Material of Construction
Notes: Any other important information about the design or costDocument: Complete, multi-page document containing design calculations, vendor
literature and quotations and any other important information. This is stored
as an electronic document and can be pages from a spreadsheet otherelectronic sources or scanned information from vendors.
Design Date: Original date for the design of this piece of equipmentModified Date: The system automatically marks the date in this field whenever any field ischanged
A These fields are listed for all pieces of equipment in this Appendix.B These fields are part of the equipment cost listing in Appendix B.

8/4/2019 NRL Report
http://slidepdf.com/reader/full/nrl-report 101/154
NREL Biofuels Process Design Database Summary
Equipment
Number Equipment Name Equipment Category Equipment Type Equipment Description Cost Basis Install. Factor Basis Scale Factor Basis Material of Construction
PFD-P110-A101
C-101 Bale Transport Conveyor CONVEYOR BELT Bale Transport Conveyor, 400 ft long, 8' wide, 50 HP motor HARRIS00 HARRIS00 DEFAULT CS
C-102 Bale Unwrapping Conveyor CONVEYOR BELT Bale Unwrapping Conveyor, 90 bale / hr HARRIS00 HARRIS00 DEFAULT CS
C-103 Belt Press Discharge Conveyor CONVEYOR BELT Belt Press Discharge Conveyor, 3' wide X 50' long. HARRIS00 HARRIS00 DEFAULT CS
C-104 Shredder Feed Conveyor CONVEYOR BELT Shredder Feed Conveyor, 8' wide X 30' long. 6001 lbs 31 fpm HARRIS00 HARRIS00 DEFAULT CS
M-101 Truck Scales SCALE TRUCK-SCA LE Truck Scales; 10' X 50' 50tn HARRIS00 HARRIS00 DEFAULT CONCRETE
M-102 Truck Unloading Forklift VEHICLE LOADER Truck Unloading Propane Gas Forklift HARRIS00 HARRIS00 ASSUMED
M-103 Bale Moving Forklift VEHICLE LOADER Bale Moving Propane Gas Forklift HARRIS00 HARRIS00 ASSUMED
M-104 Corn Stover Wash Table SIZE-REDUCT ION Corn Stover Wash Table (55 ton/hr) HARRIS00 HARRIS00 DEFAULT A283
M-105 Shredder SIZE-REDUCT ION Shredder (28 ton/hr) HARRIS00 HARRIS00 DEFAULT ALLOY STEEL
M-106 Concrete Feedstock-Storage Slab MISCELLANEOUS CON CRETE-SLAB Concrete Feedstock-Storage Slab 350' X 538' HARRIS00 HARRIS00 HARRIS00 CONCRETE
M-107 Polymer Feed System MISCELLANEOUS MISCELLANEOUS Polymer Feed System HARRIS00 HARRIS00 DEFAULT CS
P-101 Wash Table Pump PUMP CENTRIFUG AL 2500 gpm, 50 ft head. HARRIS00 HARRIS00 GARRETT CS; RUBBER
P-102 Wash Water Pump PUMP CENTRIFUG AL 5000 gpm, 50 ft head. HARRIS00 HARRIS00 GARRETT CS; SS316
P-103 Clarifier Underflow Pump PUMP RECIPROCATIN G Clarifier Underflow Pump MOD SRL 2X3-10 100 GPM -- 50 TDH HARRIS00 HARRIS00 GARRETT CS; RUBBER
P-104 Clarifie d Water Pump PUMP CENTRIFUG AL 5000 gpm, 50 ft head. HARRIS00 HARRIS00 GARRETT CS; SS316P-105 Bel t Press Sump Pump PUMP SLURRY Belt Press Sump Pump VJC 1.5X2.11 100 GPM -- 40 TDH HARRIS00 HARRIS00 GARRETT CS
S-101 Clarifier Thickener SEPARATOR Clarifier Thickener 5000 GPM mechanism HARRIS00 HARRIS00 DEFAULT CS
S-102 Belt Press S/L SEPARATION FILTER-PRESS Belt Press 1.5 meter HARRIS00 HARRIS00 DEFAULT 304SS; FILTER
S-103 Magnetic Separator SEPARATOR MAGNET Tramp iron magnet separator. VENDOR DELTA-T98 DEFAULT
T-101 Wash Water Tank TANK VERTICAL- VESSEL Wash Water Tank (20' Diameter X 22' Tall, 50,000 gal) HARRIS00 HARRIS00 GARRETT CS
T-102 Clarifier Thickener Tank TANK CLARIFER Clarifier Thickener Tank (80' diameter) HARRIS00 HARRIS00 GARRETT CEMENT
PFD-P110-A201-3
A-201 In-line Sulfuric Acid Mixer MIXER STATIC Static Mixer, 248 gpm total flow. ICARUS DELTA-T98 ICARUS SS304
A-205 Hydrolysate Mix Tank Agitator AGITATOR FIXED-PROP Top-Mounted, 1800 rpm, 50 hp ICARUS DELTA-T98 GARRETT SS
A-209 Overliming Tank Agitator AGITATOR FIXED-PROP Top Mounted, 1800 rpm, 25 hp ICARUS DELTA-T98 GARRETT SS
A-224 Reacidification Tank Agitator AGITATOR FIXED-PROP Top-Mounted, 1800 rpm, 93 hp ICARUS DELTA- T98 GARRETT SS
A-232 Reslurrying Tank Agitator AGITATOR FIXED-PROP Top- Mounted, 1800 rpm, 50 hp ICARUS DELTA-T98 GARRETT SS
C-201 Hydrolyzate Screw Conveyor CONVEYOR SCREW 18" dia. X 33' long, 7600 cfh max flow ICARUS DELTA-T98 GARRETT SS316
C-202 Hydrolysate Washed Solids Belt Conveyor CONVEYOR BELT 4' X 60' belt conveyor HARRIS00 HARRIS00 GARRETT
C-225 Lime Solids Feeder CONVEYOR ROTARY-VALVE 8" dia., 140 cfh, 7000 lb/hr max flow ICARUS DELTA-T98 A285C
H-200 Hydrolyzate Cooler HEATX SHELL-TUBE Fixed Tube Sheet,1990 sf, 27" dia. X 20' long ICARUS DELTA-T98 GARRETT 304SS;CS
H-201 Beer Column Feed Economizer HEATX SHELL-TUBE Floating Head, 6266 sf, 48" dia x 23' long ICARUS DELTA-T98 GARRETT 304SS
H-205 Pneumapress Vent Condensor HEATX SHELL-TUBE Fixed Tube Sheet, 120 sf, CS construction ICARUS DELTA-T98 GARRETT CS
H-244 Waste Vapor Condensor HEATX SHELL-TUBE Floating Head, 6266 sf, 48" dia x 23' long ICARUS DELTA-T98 GARRETT 304SS
M-202 Prehydrolysis/Sc rew Feeder/Impregnator ReactorREACTOR SCREW Vertical Screw, 10 min residence time VENDOR CHEMSYST94 GARRETT HASTELLOY-C 200;SS316L
P-201 Sulfuric Acid Pump PUMP CENTRIFUG AL 4 gpm, 245 ft. head ICARUS DELTA-T98 GARRETT SS304
P-205 Pneumapress Feed Pump PUMP CENTRIFUG AL Goulds Mod 3196 ^X8-13 1000 gpm 60 ft TDH 25 hp 1200 RPM HARRIS00 HARRIS00 GARRETT SS316
P-209 Overlimed Hydrolyzate Pump PUMP CENTRIFUG AL 687 gpm, 150 ft. head ICARUS DELTA-T98 GARRETT 304SS
P-211 Primary Filtrate Pump PUMP CENTRIFUG AL Goulds Mod 3410 10X12-17 1000 GPM 60 ft TDH HARRIS00 HARRIS00 GARRETT SS316
P-213 Wash Filtrate Pump PUMP CENTRIFUG AL Goulds Mod 3410 10X12-17 6000 GPM 200 ft TDH HARRIS00 HARRIS00 GARRETT SS316
P-222 Filtered Hydrolyzate Pump PUMP CENTRIFUG AL 721 gpm, 150 ft head ICARUS DELTA-T98 GARRETT 304SS
P-223 Lime Unloading Blower FAN CENTRIFUG AL 7425 cfm, 6 psi, 22275 lb/hr DELTA-T98 DELTA-T98 GARRETT C.S.
P-224 Fermentation Feed Pump PUMP ROTARY-LOBE 737 gpm, 200 ft head VENDOR ICARUS VENDOR 304SS
P-239 Reacidified Liquor Pump PUMP CENTRIFUG AL 720 gpm, 100 ft head ICARUS DELTA-T98 GARRETT SS304
S-205 Pneumapress Filter SEPARATOR PNEUMAPRESS MOD 30-12-316 285 GPM 360 SQ FT AREA HARRIS00 HARRIS00 DEFAULT SS316S-222 Hydroclone & Rotary Drum Filter S/L SEPARATOR ROTARY-DRU M Hydrocyclone and Vacuum Filter VENDOR DELTA-T98 GARRETT EPOXY LINED
S-227 LimeDust Vent Baghouse SEPARATOR FABRIC-FILTER 8333 cfm, 1389 sf, 6 cfm/sf ICARUS DELTA-T98 ICARUS A285C;POLYESTER
T-201 Sulfuric Acid Storage TANK VERTICAL- VESSEL 6444 gal., 24 hr. residence time, 90% wv DELTA-T98 DELTA-T98 GARRETT PLASTIC
T-203 Blowdown Tank TANK VERTICAL- VESSEL 14500 gal., 11' dia x 30' high, 10 min. res. time, 75% wv, 15 psig ICARUS ICARUS GARRETT SS316
T-205 Hydrolysate Mixing Tank TANK FLAT-BTM-STOR AGE Modeled after Tank T-232 in Enzyme Process. 15 min. res. Time ICARUS DELTA-T98 GARRETT SS304
T-209 Overliming Tank TANK VERTICAL- VESSEL 46200 gal., 16' dia. X 32' high, 1 hr. res. time, 90% wv, 15 psig ICARUS DELTA-T98 GARRETT SS304
T-211 Primary Filtrate Tank TANK VERTICAL- VESSEL 12'6" D X 13' high 12,000 gal HARRIS00 HARRIS00 GARRETT SS316
T-213 Wash Filtrate Tank TANK VERTICAL- VESSEL 10' D X 11' high 6000 gal HARRIS00 HARRIS00 GARRETT SS316
T-220 Lime Storage Bin TANK LIVE-BTM-BIN 4455 cf, 14' dia x 25' high, 1.5x rail car vol., atmospheric ICARUS DELTA-T98 ICARUS CS
T-224 Reacidification Tank TANK FLAT-BTM-STOR AGE 185200 gal., 32' dia x 32' high, 4 hr. res. time, 90% wv, atmospheric ICARUS DELTA-T98 GARRETT SS304
T-232 Slurrying Tank TANK FLAT-BTM-STOR AGE 24770 gal., 13' dia. X 25' high, 15 min. res. time, 90% wv, atmospheric ICARUS DELTA-T98 GARRETT SS304
Note: Equipment sizes listed are for a base case and may have been scaled up or down in the final cost estimation. Appendix A - Page 1

8/4/2019 NRL Report
http://slidepdf.com/reader/full/nrl-report 102/154
NREL Biofuels Process Design Database Summary
Equipment
Number Equipment Name Equipment Category Equipment Type Equipment Description Cost Basis Install. Factor Basis Scale Factor Basis Material of Construction
PFD-P110-A301-2
A-300 Ethanol Fermentor Agitator AGITATOR FIXED-PROP Side Mounted, 2 per vessel, 75 hp each, 0.15 hp/1000 gal DELTA-T98 DELTA-T98 SS304
A-301 Seed Hold Tank Agitator AGITATOR FIXED-PROP Top Mounted, 1800 rpm, 23 hp, 0.1 hp/1000 gal DELTA-T98 DEL TA-T98 GARRETT SS304
A-304 4th Seed Vessel Agitator AGITATOR FIXED-PROP Top Mounted, 1800 rpm, 6 hp, 0.3 hp/1000 gal ICARUS DELTA-T98 GARRETT SS
A-305 5th Seed Vessel Agitator AGITATOR FIXED-PROP Top Mounted, 1800 rpm, 19 hp, 0.1 hp/1000 gal DELTA-T98 DEL TA-T98 GARRETT SS
A-306 Beer Surge Tank Agitator AGITATOR FIXED-PROP Top Mounted, 1800 rpm, 4 hp, 0.3 hp/1000 gal ICARUS DELTA-T98 GARRETT SS304
A-310 Saccharificati on Tank Agitator AGITATOR FIXED-PROP Side Mounted, 2 per vessel, 75 hp each, 0.15 hp/1000 gal DELTA-T98 DELTA-T98 SS304
F-300 Ethanol Fermentor TANK FLAT-BTM-STOR AGE 962,651 gal. each, 7 day residence total, 90% wv, API, atmospheric VENDOR DELTA-T98 MULTI-UNIT SS304
F-301 1st Seed Fermentor REACTOR VERTICAL- VESSEL 20 gal, jacketed, agitated, 1.3' dia., 2' high, 15 psig ICARUS DELTA-T98 SS304
F-302 2nd Seed Fermentor REACTOR VERTICAL- VESSEL 194 gal., jacketed, agitated, 3' dia., 4' high, 2.5 psig ICARUS ICARUS SS304
F-303 3rd Seed Fermentor REACTOR VERTICAL- VESSEL 1950 gal., jacketed, agitated, 6.5' dia, 8' high, 2.5 psig ICARUS DELTA-T98 SS304
F-304 4th Seed Fermentor REACTOR FLAT-BTM-STOR AGE 19444 gal., 12' dia x 23' high, atmospheric ICARUS DELTA-T98 GARRETT SS304
F-305 5th Seed Fermentor REACTOR FLAT-BTM-STOR AGE 194500 gal., API, atmospheric VENDOR DELTA-T98 GARRETT SS304
H-300 Fermentation Cooler HEATX PLATE-FRAME 2393 sf, 300 BTU/hr sf F ICARUS DELTA-T98 GARRETT SS304
H-301 Hydrolyzate Heater HEATX PLATE-FRAME 773 sf, 300 BTU/hr sf F DELTA-T98 DELTA-T98 GARRETT SS304
H-302 Saccharified Slurry Cooler HEATX PLATE-FRAME 3765 sf total, 1255 sf each, 300 BTU/hr sf F DELTA-T98 DELTA-T98 GARRETT SS304H-304 4th Seed Fermentor Coils HEATX IMMERSED-COIL 27 sf, 1" sch 40 pipe, 105 BTU/hr sf F ICARUS DELTA-T98 ICARUS SS
H-305 5th Seed Fermentor Coils HEATX IMMERSED-COIL 307 sf, 3" sch 40 pipe, 92 BTU/hr sf F ICARUS DELTA-T98 ICARUS SS
H-310 Fermentation Cooler HEATX PLATE-FRAME 2393 sf, 300 BTU/hr sf F ICARUS DELTA-T98 GARRETT SS304
P-300 Fermentation Recirculation and Transfer Pump PUMP CENTRIFUG AL 1060 gpm, 150 ft head ICARUS DELTA-T98 GARRETT SS304
P-301 Seed Hold Transfer Pump PUMP ROTARY-LOBE 172 gpm, 150 ft head VENDOR CHEMSYST94 VENDOR SS304
P-302 Seed Transfer Pump PUMP ROTARY-LOBE 1231 gpm total, 615 gpm each, 100 ft head VENDOR CHEMSYST94 VENDOR SS304
P-306 Beer Transfer Pump PUMP CENTRIFUG AL 1632 gpm each, 171 ft head ICARUS DELTA-T98 GARRETT SS304
P-310 Saccharification Recirculation and Transfer PumpPUMP CENTRIFUG AL 1060 gpm, 150 ft head ICARUS DELTA-T98 GARRETT SS304
T-301 Seed Hold Tank TANK FLAT-BTM-STOR AGE 233,333 gal., API atmospheric VENDOR DELTA-T98 GARRETT SS304
T-306 Beer Storage Tank TANK FLAT-BTM-STOR AGE 456617 gal., 45' dia x 40' high, 4 hr res. Time, 90% wv, atmospheric ICARUS DELTA-T98 GARRETT SS304
T-310 Saccharification Tank TANK FLAT-BTM-STOR AGE 962,651 gal. each, 7 day residence total, 90% wv, API, atmospheric VENDOR DELTA-T98 MULTI-UNIT SS304
PFD-P110-A501-5
A-530 Recycled Water Tank Agitator AGITATOR FIXED-PROP 5 hp, 50 rpm, VENDOR DELTA-T98 GARRETT CS
C-501 Lignin Wet Cake Screw CONVEYOR SCREW 14" Dia X 100' Long ICARUS DELTA-T98 GARRETT CS
D-501 Beer Column COLUMN DISTILLATION 13.5' dia, 32 Actual Trays, Nutter V-Grid Trays ICARUS DELTA-T98 ICARUS SS304
D-502 Rectification Column COLUMN DISTILLATION 11.5' dia.(rect). , 4' dia. (strip) x 18" T.S., 60 act. Trays, 60% eff., Nutter V-Grid trays DELTA-T98 DELTA-T98 ICARUS SS
E-501 1st Effect Evaporation HEATX SHELL-TUBE 22280 sf each., 135 BTU/hr sf F DELTA-T98 DELTA-T98 GARRETT SS316
E-502 2nd Effect Evaporation HEATX SHELL-TUBE 22278 sf., 170 BTU/hr sf F DELTA-T98 DELTA-T98 GARRETT SS316
E-503 3rd Effect Evaporation HEATX SHELL-TUBE 22278 sf each., 170 BTU/hr sf F DELTA-T98 DELTA-T98 GARRETT SS316
H-501 Beer Column Reboiler HEATX SHELL-TUBE Fixed TS, 13899 sf, 41" dia., 20' long, 178 BTU/hr sf F DELTA-T98 DELTA-T98 GARRETT SS304;CS
H-502 Rectification Column Reboiler HEATX SHELL-TUBE Thermosyphon, 1089 sf, 20" dia., 20' long, 130 BTU/hr sf F ICARUS DELTA-T98 GARRETT SS304;CS
H-504 Beer Column Condenser HEATX SHELL-TUBE Floating Head, 880 sf, 20" dia., 22' long, 92 BTU/hr sf F DELTA-T98 DELTA-T98 GARRETT SS304;CS
H-505 Rectification Column Condenser HEATX SHELL-TUBE Fixed TS, 4146 sf, 39" dia, 20' long, 157 BTU/hr sf F DELTA-T98 DELTA-T98 GARRETT SS304;CS
H-512 Beer Column Feed Interchange HEATX PLATE-FRAME 909 sf, 200 BTU/hr sf F DELTA-T98 DELTA-T98 GARRETT SS
H-517 Evaporator Condenser HEATX SHELL-TUBE Fixed TS, 8223 sf, 39" dia., 20' long, 220 BTU/hr sf F DELTA-T98 DELTA-T98 GARRETT SS304;CS
M-503 Molecular Sieve (9 pieces) MISCELLANEOUS PACKAGE Superheater, twin mole sieve columns, product cooler, condenser, pumps, vacuum source.VENDOR DELTA-T98 SS
P-501 Beer Column Bottoms Pump PUMP CENTRIFUG AL 5053 gpm, 150 ft head ICARUS ICARUS GARRETT SS
P-503 Beer Column Reflux Pump PUMP CENTRIFUG AL 12 gpm, 140 ft head DELTA-T98 DELTA-T98 GARRETT SS
P-504 Rectificati on Column Bottoms Pump PUMP CENTRIFUG AL 154 gpm, 158 ft head DELTA-T98 DELTA-T98 GARRETT SS
P-505 Rectification Column Reflux Pump PUMP CENTRIFUG AL 437 gpm, 110 ft head DELTA-T98 DELTA-T98 GARRETT SSP-511 1st Effect Pump PUMP CENTRIFUG AL 2393 gpm each, 110 ft head ICARUS DELTA-T98 GARRETT SS
P-512 2nd Effect Pump PUMP CENTRIFUG AL 1261 gpm, 110 ft head ICARUS DELTA-T98 GARRETT SS
P-513 3rd Effect Pump PUMP CENTRIFUG AL 412 gpm each, 110 ft head ICARUS DELTA-T98 GARRETT SS
P-514 Evaporator Condensate Pump PUMP CENTRIFUG AL 617 gpm, 125 ft head ICARUS DELTA-T98 GARRETT SS304
P-515 Scrubber Bottoms Pump PUMP CENTRIFUG AL 69 gpm, 104 ft head DELTA-T98 DELTA-T98 GARRETT SS
P-530 Recycled Water Pump PUMP CENTRIFUG AL 790 gpm, 150 ft head ICARUS DELTA-T98 GARRETT CS
S-505 Pneumapress Filter SEPARATOR PNEUMAPRESS 3@MOD 30-10-316 285 GPM 300 SQ FT AREA & 1@MOD 30-11-316 314 GPM 314 SQ FT AREAHARRIS00 HARRIS00 DEFAULT SS316
T-503 Beer Column Relfux Drum TANK HORIZONTAL -VESSEL 346 gal, 15 min res. Time, 50% wv, 3' dia., 6.5' long, 25 psig ICARUS DELTA-T98 GARRETT SS304
T-505 Rectification Column Reflux Drum TANK HORIZONTAL -VESSEL 13106 gal, 15 min res time, 50% wv, 9' dia, 27.5' long, 25 psig ICARUS DELTA-T98 GARRETT SS304
T-512 Vent Scrubber COLUMN ABSORBER 7' dia x 25' high, 4 stages, plastic Jaeger Tri-Packing DELTA-T98 DELTA-T98 GARRETT SS304;PLASTIC
T-514 Evaporator Condensate Drum TANK HORIZONTAL -VESSEL 10233 gal, 10 min res. Time, 75% wv, 9' dia., 21.5' long, 1 psig ICARUS DELTA-T98 GARRETT SS304
T-530 Recycled Water Tank TANK FLAT-BTM-STOR AGE 13218 gal, Residence time 20 min, 2.5 psig VENDOR DELTA-T98 VENDOR CS
Note: Equipment sizes listed are for a base case and may have been scaled up or down in the final cost estimation. Appendix A - Page 2

8/4/2019 NRL Report
http://slidepdf.com/reader/full/nrl-report 103/154
NREL Biofuels Process Design Database Summary
Equipment
Number Equipment Name Equipment Category Equipment Type Equipment Description Cost Basis Install. Factor Basis Scale Factor Basis Material of Construction
PFD-P110-A601-2
A-602 Equalization Basin Agitator AGITATOR FIXED-PROP 38 hp each, Fixed Prop, 0.1 hp/1000 gal ICARUS DELTA-T98 GARRETT SS
A-606 Anaerobic Agitator AGITATOR FIXED-PROP Fixed Prop, 41 hp, 0.05 hp/1000 gal ICARUS DELTA-T98 GARRETT SS
A-608 Aerobic Lagoon Agitators AGITATOR SURFACE-A ERATOR Twister Surface Aerators, 50 HP ea VENDOR MERRICK98 GARRETT CS
C-614 Aerobic Sludge Screw CONVEYOR SCREW 9" Dia X 25' Long ICARUS DELTA-T98 GARRETT CS
H-602 Anaerobic Digestor Feed Cooler HEATX SHELL-TUBE TEMA BES Type, Floating Head ICARUS DELTA-T98 VENDOR SS316;CS
M-604 Nutrient Feed System MISCELLANEOUS PACKAGE 5 Tanks and Pumps VENDOR VENDOR CS
M-606 Biogas Emergency Flare MISCELLANEOUS MISCELLANEOUS Flare and Pilot VENDOR VENDOR DEFAULT SS
M-612 Filter Precoat System MISCELLANEOUS MISCELLANEOUS Tank, Agitator, Pump MERRICK98 CS
P-602 Anaerobic Reactor Feed Pump PUMP CENTRIFUG AL 876 gpm, 150 ft head ICARUS DELTA- T98 GARRETT CS
P-606 Aerobic Digestor Feed Pump PUMP CENTRIFUG AL 830 gpm, 150 ft head ICARUS DELTA-T 98 GARRETT CS
P-608 Aerobic Sludge Recycle Pump PUMP SLURRY 2.5 gpm, 150 ft head ICARUS DELTA-T98 GARRETT SS316
P-610 Aerobic Sludge Pump PUMP SLURRY 25.3 gpm, 150 ft head ICARUS DELTA-T98 GARRETT SS316
P-611 Aerobic Digestion Outlet Pump PUMP CENTRIFUG AL 828 gpm, 150' head ICARUS DELTA-T98 GARRETT CS
P-614 Sludge Filtrate Recycle Pump PUMP CENTRIFUG AL 22 gpm, 150' head ICARUS DELTA-T98 GARRETT CS
P-616 Treated Water Pump PUMP CENTRIFUG AL 803 gpm, 100 ft head ICARUS DELTA-T98 GARRETT CSS-600 Bar Screen SEPARATOR SCREEN 0.5" Mech. cleaned Screen CH2MHL91 DELTA-T98 ASSUMED CS
S-614 Belt Filter Press S/L SEPARATOR FILTER-PRESS BELT THICKNESS VENDOR VENDOR VENDOR 304SS;BUNA N
T-602 Equalization Basin TANK FLAT-BTM-STOR AGE 377516 gal, Residence time 7.2 hr, VENDOR VENDOR GARRETT CONCRETE
T-606 Anaerobic Digestor TANK FLAT-BTM-STOR AGE 810250 gal each, space velocity 12g COD/L/DAY VENDOR VENDOR GARRETT EPOXY-LINED
T-608 Aerobic Digestor REACTOR LINED-PIT 19500000 gal, 16.3 day residence time MERRICK98 MERRICK98 POLYMER LINED
T-610 Clarifier SEPARATOR CLARIFIER 195289 gal, Residence time 3.9 hr. VENDOR VENDOR GARRETT CONCRETE
PFD-P110-A701
A-701 Denaturant In-line Mixer MIXER STATIC Static Mixer, total flow 341 gpm ICARUS DELTA-T98 ICARUS SS304
A-720 CSL Storage Tank Agitator AGITATOR FIXED-PROP Top Mounted, 1800 rpm, 23 hp, 0.1 hp/1000 gal DELTA-T98 DELTA-T98 GARRETT SS304
A-760 CSL/DAP Day Tank Agitator AGITATOR FIXED-PROP Top Mounted, 1800 rpm, 5 hp, 0.5 hp/1000 gal ICARUS DELTA-T98 GARRETT SS304
C-755 DAP Solids Feeder CONVEYOR ROTARY-VALVE 8" dia., 140 cfh, 7000 lb/hr max flow ICARUS DELTA-T98 A285C
P-701 Ethanol Product Pump PUMP CENTRIFUG AL 324 gpm, 112 ft head ICARUS DELTA-T98 GARRETT CS
P-703 Sulfuric Acid Pump PUMP CENTRIFUG AL 215 gpm, 150 ft head ICARUS DELTA-T98 GARRETT SS316
P-704 Firewater Pump PUMP CENTRIFUG AL 2500 gpm, 50 ft head ICARUS DELTA-T98 GARRETT CS
P-710 Gasoline Pump PUMP CENTRIFUG AL 17 gpm, 200 ft head ICARUS DELTA-T98 GARRETT CS
P-720 CSL Pump PUMP CENTRIFUG AL 431 gpm, 150 ft head ICARUS DELTA-T98 GARRETT CS
P-750 Cellulase Pump PUMP CENTRIFUG AL 2500 gpm, 50 ft head ICARUS DELTA-T98 GARRETT CS
P-755 DAP Unloading Blower FAN CENTRIFUG AL 7425 cfm, 6 psi, 22275 lb/hr DELTA-T98 DELTA-T98 GARRETT CS
P-760 CSL/DAP Pump PUMP CENTRIFUG AL 431 gpm, 150 ft head ICARUS DELTA-T98 GARRETT CS
S-755 DAP Vent Baghouse SEPARATOR FABRIC-FILTER 8333 cfm, 1389 sf, 6 cfm/sf ICARUS DELT A-T98 ICARUS A285C;POLYESTER
T-701 Ethanol Product Storage Tank TANK FLAT-BTM-STOR AGE 604,133 gal, 7 day res time total, 90% wv, 51' dia x 40' high, atmospheric ICARUS DELTA-T98 GARRETT A285C
T-703 Sulfuric Acid Storage Tank TANK FLAT-BTM-STOR AGE 18697 gal, 120 hr res time, 90% wv, 12' dia x 22' high, atmospheric ICARUS ICARUS GARRETT SS316
T-704 Firewater Storage Tank TANK FLAT-BTM-STOR AGE 600,000 gal, 4 hr res time, 51' dia x 40' high, atmospheric ICARUS DELTA-T98 GARRETT A285C
T-709 Propane Storage Tank TANK HORIZONTAL STORAGE2000 gal, 10 day res time, 90% wv, 4' dia x 23.6' length, 250 psig ICARUS DELTA-T98 GARRETT A515
T-710 Gasoline Storage Tank TANK FLAT-BTM-STOR AGE 63,593 gal, 168 hr res time, 90% wv, 19' dia x 32' high, atmospheric ICARUS DELTA-T98 GARRETT A285C
T-720 CSL Storage Tank TANK FLAT-BTM-STOR AGE 71,918 gal, 120 hr res time, 90% wv, 20' dia x 32' high, atmospheric ICARUS ICARUS GARRETT SS304
T-750 Cellulase Storage Tank TANK FLAT-BTM-STOR AGE 130,115 gal, 48 hr res time, 90% wv, 27' dia x 37' high, atmospheric ICARUS ICARUS GARRETT SS304
T-755 DAP Storage Bin TANK LIVE-BTM-BIN 1425 cf, 9' dia x 19.5' high, 1.5x vessel vol. Req. for 7-day res time, atmospheric ICARUS DELTA-T98 ICARUS CS
T-760 CSL/DAP Day Tank TANK FLAT-BTM-STOR AGE 10,000 gal, 24 hr res time, 90% wv, 9.5' dia x 18.9' high, atmospheric ICARUS ICARUS GARRETT SS304
PFD-P110-A801-4
H-801 Burner Combustion Air Preheater MISCELLANEOUS MISCELLANEOUS 37000 sf combustion air/exhaust interchanger ICARUS NREL-ESTM DEFAULT
H-811 BFW Preheater HEATX SHELL-TUBE Floating Head, 500 SF ICARUS DELTA-T98 GARRETT SS304
M-803 Fluidized Bed Combustion Reactor MISCELLANEOUS MISCELLANEOUS 900 to 1250 psig/950F Circ. Fluid Bed VENDOR DELTA-T98 VENDOR CS
M-804 Combustion Gas Baghouse SEPARATOR FABRIC-FILTER Pulse Shaker, 545000 cfm, 135,135 SF VENDOR VENDOR MULTI-UNIT A285C;FABRIC
M-811 Turbine/Generator GENERATOR STEAM-TURBIN E 52-61 MW; 281000 KG/HR STEAM VENDOR DELTA-T98 VENDOR
M-820 Hot Process Water Softener System MISCELLANEOUS PACKAGE 1000 gpm flow, 24" dia softener. Includes filters, chemical feeders, piping, valves RICHARDSON NREL-ESTM MULTI-UNIT
M-830 Hydrazine Addition Pkg. MISCELLANEOUS PACKAGE 150 gal tank, agitator, 2 metering pumps CHEMSYST94 CHEMSYST94 DEFAULT
M-832 Ammonia Addition Pkg MISCELLANEOUS PACKAGE 150 gal tank, agitator, 2 metering pumps CHEMSYST94 CHEMSYST94 DEFAULT
M-834 Phosphate Addition Pkg. MISCELLANEOUS PACKAGE 150 gal tank, agitator, 2 metering pumps CHEMSYST94 CHEMSYST94 DEFAULT
P-804 Condensate Pump PUMP CENTRIFUG AL 272 gpm 150' head ICARUS DELTA-T98 GARRETT SS316
P-811 Turbine Condensate Pump PUMP CENTRIFUG AL 175 gpm, 150 ft head. ICARUS DELTA-T98 GARRETT SS304
P-824 Deaerator Feed Pump PUMP CENTRIFUG AL 650 gpm, 115 ft head. ICARUS DELTA-T98 GARRETT SS304
P-826 BFW Pump PUMP CENTRIFUG AL 500 gpm, 2740 ft head. VENDOR DELTA-T98 GARRETT SS316
P-828 Blowdown Pump PUMP CENTRIFUG AL 29 gpm, 150 ' head ICARUS DELTA-T98 GARRETT CS
P-830 Hydrazine Transfer Pump PUMP CENTRIFUG AL 5 gpm, 75 ft head DELTA-T98 DELTA-T98 GARRETT CS
T-804 Condensate Collection Tank TANK VERTICAL- VESSEL 1600 gal, Residence time 1.5 minutes, atmospheric ICARUS DELTA-T98 GARRETT A285C
T-824 Condensate Surge Drum TANK HORIZONTAL -VESSEL 11,400 gal, 24' x 9'dia, 15psig, Residence time 11 min. ICARUS DELTA-T98 GARRETT SS304
T-826 Deaerator TANK HORIZONTAL -VESSEL 18,170 gal hold tank, 150 psig design pressure, 10 min residence time VENDOR CHEMSYST94 GARRETT CS;SS316
T-828 Blowdown Flash Drum TANK HORIZONTAL -VESSEL 424 gal, 4.5' x 4'dia, 15 psig ICARUS DELTA-T98 GARRETT CS
T-830 Hydrazine Drum TANK VERTICAL- VESSEL 260 gal, 4.9' x 3'dia., 10psig ICARUS DELTA-T98 GARRETT SS316
Note: Equipment sizes listed are for a base case and may have been scaled up or down in the final cost estimation. Appendix A - Page 3

8/4/2019 NRL Report
http://slidepdf.com/reader/full/nrl-report 104/154
NREL Biofuels Process Design Database Summary
Equipment
Number Equipment Name Equipment Category Equipment Type Equipment Description Cost Basis Install. Factor Basis Scale Factor Basis Material of Construction
PFD-P110-A901-3
M-902 Cooling Tower System COOLING-TOWER INDUCED-DRAF T 71000 gpm, 147.8 x E6 kcal/hr, 5 cell DELTA-T98 DELTA-T98 GARRETT FIBERGLASS
M-904 Plant Air Compressor COMPRESSOR RECIPROCATIN G 450 cfm, 125 psig outlet ICARUS DELTA-T98 GARRETT CSM-910 CIP System MISCELLANEOUS MISCELLANEOUS Designed by Delta-T. Same cost as sum of previous units. DELTA-T98 DELTA-T98 NREL-ESTM CS
P-902 Cooling Water Pumps PUMP CENTRIFUG AL 41000 gpm, 70 ft head. ICARUS DELTA-T98 GARRETT CS
P-912 Make-up Water Pump PUMP CENTRIFUG AL 1083 gpm, 75 ft. head ICARUS DELTA-T98 GARRETT CS
P-914 Process Water Circulati ng Pump PUMP CENTRIFUG AL 1199 gpm ea, 75 ft. head ICARUS DELTA-T98 GARRETT CS
S-904 Instrument Air Dryer DRYER PACKAGE 400 SCFM Air Dryer, -40F Dewpoint RICHARDSON DELTA-T98 DEFAULT CS
T-902 Pretreatment Pressure Filter Press Air ReceiverTANK HORIZONTAL-PRESSURE1000 gal HARRIS00 HARRIS00 GARRETT CS
T-904 Plant Air Receiver TANK HORIZONTAL -VESSEL 900 gal., 200 psig ICARUS DELTA-T98 GARRETT CS
T-905 Product Recovery Pressure Filter Press Air ReceiverTANK HORIZONTAL-PRESSURE1000 gal HARRIS00 HARRIS00 GARRETT CS
T-914 Process Water Tank TANK FLAT-BTM-STOR AGE 756000 gal. 8 hr res time ICARUS DELTA-T 98 GARRETT CS
Note: Equipment sizes listed are for a base case and may have been scaled up or down in the final cost estimation. Appendix A - Page 4

8/4/2019 NRL Report
http://slidepdf.com/reader/full/nrl-report 105/154
Appendix BIndividual Equipment Costs Summary

8/4/2019 NRL Report
http://slidepdf.com/reader/full/nrl-report 106/154
Individual Equipment Cost Summary
Equipment
Number
Number
Required
Number
Spares Equipment Name Scaled On
Size
Ratio
(Base/
Current)
Original
Equip Cost
(per unit) Base Year
Total Original
Equip Cost
(Req'd &
Spare) in Base
Year
Scaling
Exponent
Scaled Cost in
Base Year
Installation
Factor
Installed Cost in
Base Year
Installed
in 200
C-101 2 Bale Transport Conveyor Flow 1.00 $400,000 2000 $800,000 0.6 $799,996 1.62 $1,295,994 $1,2
C-102 2 Bale Unwrapping Conveyor Flow 1.00 $150,000 2000 $300,000 0.6 $299,999 1.19 $356,998 $3
C-103 1 Belt Press Discharge Conveyor Flow 1.00 $50,000 2000 $50,000 0.6 $50,000 1.89 $94,500 $
C-104 4 Shredder Feed Conveyor Flow 1.00 $60,000 2000 $240,000 0.6 $239,999 1.38 $331,198 $3
M-101 2 Truck Scales Flow 1.00 $34,000 2000 $68,000 0.6 $68,000 2.47 $167,959 $1
M-102 4 1 Truck Unloading Forklift Flow 1.00 $18,000 2000 $90,000 1 $89,999 1 $89,999 $
M-103 4 Bale Moving Forklift Flow 1.00 $18,000 2000 $72,000 1 $71,999 1 $71,999 $
M-104 2 Corn Stover Wash Table Flow 1.00 $104,000 2000 $208,000 0.6 $207,999 2.39 $497,118 $4
M-105 4 Shredder Flow 1.00 $302,000 2000 $1,208,000 0.6 $1,207,994 1.38 $1,667,032 $1,6
M-106 1 Concrete Feedstock-Storage Slab Flow 1.00 $450,655 2000 $450,655 1 $450,651 2.2 $991,433 $9
M-107 1 Polymer Feed System Flow 1.00 $30,000 2000 $30,000 0.6 $30,000 2.28 $68,400 $
P-101 2 1 Wash Table Pump Flow 1.00 $20,000 2000 $60,000 0.79 $60,000 3.87 $232,199 $2
P-102 2 1 Wash Water Pump Flow 1.00 $15,000 2000 $45,000 0.79 $45,000 5.19 $233,549 $2
P-103 1 1 Clarifier Underflow Pump Flow 1.00 $6,000 2000 $12,000 0.79 $12,000 13.41 $160,919 $1
P-104 1 1 Clarified Water Pump Flow 1.00 $15,000 2000 $30,000 0.79 $30,000 7.07 $212,099 $2
P-105 1 1 Belt Press Sump Pump Flow 1.00 $19,000 2000 $38,000 0.79 $38,000 2.92 $110,959 $1
S-101 1 Clarifier Thickener Flow 1.00 $135,000 2000 $135,000 0.6 $134,999 1.51 $203,849 $2
S-102 1 Belt Press Flow 1.00 $100,000 2000 $100,000 0.6 $100,000 1.25 $124,999 $1
S-103 1 Magnetic Separator Flow 0.61 $13,863 1998 $13,863 0.6 $10,335 1.3 $13,435 $
T-101 1 Wash Water Tank Flow 1.00 $50,000 2000 $50,000 0.51 $50,000 2.8 $139,999 $1
T-102 1 Clarifier Thickener Tank Flow 1.00 $135,000 2000 $135,000 0.51 $134,999 3.04 $410,398 $4
A100 Subtotal* $4,135,518 $4,131,968 1.81 $7,475,036 $7,4
*Sections are subtotaled and an average "Installation Factor" is back-calculated for the section. Appendix B - Page 1 of 8

8/4/2019 NRL Report
http://slidepdf.com/reader/full/nrl-report 107/154
Individual Equipment Cost Summary
Equipment
Number
Number
Required
Number
Spares Equipment Name Scaled On
Size
Ratio
(Base/
Current)
Original
Equip Cost
(per unit) Base Year
Total Original
Equip Cost
(Req'd &
Spare) in Base
Year
Scaling
Exponent
Scaled Cost in
Base Year
Installation
Factor
Installed Cost in
Base Year
Installed
in 200
A-201 1 In-line Sulfuric Acid Mixer Flow 1.83 $1,900 1997 $1,900 0.48 $2,542 1 $2,542
A-205 1 Hydrolyzate Mix Tank Agitator Flow 0.63 $36,000 1997 $36,000 0.51 $28,421 1.2 $34,105 $
A-209 1 Overliming Tank Agitator Flow 1.62 $19,800 1997 $19,800 0.51 $25,349 1.3 $32,953 $
A-224 1 Reacidification Tank Agitator Flow 1.63 $65,200 1997 $65,200 0.51 $83,599 1.2 $100,318 $1
A-232 1 Reslurrying Tank Agitator Flow 1.19 $36,000 1997 $36,000 0.51 $39,423 1.2 $47,308 $
C-201 1 Hydrolyzate Screw Conveyor Flow 1.00 $59,400 1997 $59,400 0.78 $59,518 1.3 $77,373 $
C-202 1 Hydrolysate Washed Solids Belt Conveyor Flow 0.95 $80,000 2000 $80,000 0.76 $77,213 1.45 $111,959 $1
C-225 1 Lime Solids Feeder None $3,900 1997 $3,900 $3,900 1.3 $5,070
H-200 1 Hydrolyzate Cooler Area 0.27 $45,000 1997 $45,000 0.51 $23,266 2.1 $48,859 $
H-201 2 1 Beer Column Feed Economizer Area 1.16 $132,800 1997 $398,400 0.68 $441,162 2.1 $926,441 $9
H-205 1 Pneumapress Vent Condensor Area 0.84 $15,385 2000 $15,385 0.68 $13,620 2.1 $28,603 $
H-244 2 1 Waste Vapor Condensor Area 0.24 $132,800 1997 $398,400 0.68 $152,180 2.1 $319,578 $3
M-202 3 Prehydrolysis/Screw Feeder/Reactor Flow 1.03 $2,457,487 2000 $7,372,462 0.6 $7,494,911 2.29 $17,163,347 $17,1
P-201 1 1 Sulfuric Acid Pump Flow 2.00 $4,800 1997 $9,600 0.79 $16,577 2.8 $46,416 $
P-205 2 1 Pneumapress Feed Pump Solids Flow 0.95 $15,416 2000 $46,248 0.79 $44,579 3.34 $148,893 $1
P-209 1 1 Overlimed Hydrolyzate Pump Flow 1.62 $10,700 1997 $21,400 0.79 $31,377 2.8 $87,855 $
P-211 1 1 Primary Filtrate Pump Flow 1.02 $32,549 2000 $65,098 0.79 $65,931 3.56 $234,716 $2
P-213 1 1 Wash Filtrate Pump Flow 0.99 $49,803 2000 $99,606 0.79 $98,809 2.71 $267,772 $2
P-222 1 1 Filtered Hydrolyzate Pump Flow 1.64 $10,800 1997 $21,600 0.79 $31,862 2.8 $89,214 $
P-223 1 Lime Unloading Blower Flow 4.38 $47,600 1998 $47,600 0.5 $99,594 1.4 $139,432 $1
P-224 2 1 Saccharification Feed Pump Flow 1.19 $61,368 1998 $184,104 0.7 $208,550 2.8 $583,941 $5
P-239 1 1 Reacidified Liquor Pump Flow 1.63 $10,800 1997 $21,600 0.79 $31,745 2.8 $88,886 $
S-205 3 Pneumapress Filter Solids Flow 0.95 $1,575,000 2000 $4,725,000 0.6 $4,594,911 1.05 $4,824,657 $4,8
S-222 1 Hydroclone & Rotary Drum Filter Flow 1.39 $165,000 1998 $165,000 0.39 $187,567 1.4 $262,594 $2
S-227 1 LimeDust Vent Baghouse Flow 4.37 $32,200 1997 $32,200 1 $140,707 1.5 $211,061 $2
T-201 1 Sulfuric Acid Tank Flow 2.00 $5,760 1996 $5,760 0.71 $9,411 1.4 $13,175 $
T-203 1 Blowdown Tank Flow 1.03 $64,100 1997 $64,100 0.93 $65,987 1.2 $79,184 $
T-205 1 Hydrolyzate Mixing Tank Flow 0.63 $44,800 1997 $44,800 0.71 $32,237 1.2 $38,684 $
T-209 1 Overliming Tank Flow 1.62 $71,000 1997 $71,000 0.71 $100,144 1.4 $140,201 $1
T-211 1 Primary Filtrate Tank Flow 1.02 $36,000 2000 $36,000 0.71 $36,414 2.45 $89,214 $
T-213 1 Wash Filtrate Tank Flow 0.99 $18,000 2000 $18,000 0.71 $17,870 3.68 $65,763 $
T-220 1 Lime Storage Bin Flow 4.37 $69,200 1997 $69,200 0.46 $136,370 1.3 $177,281 $1
T-224 1 Reacidification Tank Flow 1.63 $147,800 1997 $147,800 0.51 $189,507 1.2 $227,409 $2
T-232 1 Slurrying Tank Flow 1.19 $44,800 1997 $44,800 0.71 $50,839 1.2 $61,007 $
A200 Subtotal* $14,472,363 $14,636,094 1.83 $26,775,812 $26,8
*Sections are subtotaled and an average "Installation Factor" is back-calculated for the section. Appendix B - Page 2 of 8

8/4/2019 NRL Report
http://slidepdf.com/reader/full/nrl-report 108/154
Individual Equipment Cost Summary
Equipment
Number
Number
Required
Number
Spares Equipment Name Scaled On
Size
Ratio
(Base/
Current)
Original
Equip Cost
(per unit) Base Year
Total Original
Equip Cost
(Req'd &
Spare) in Base
Year
Scaling
Exponent
Scaled Cost in
Base Year
Installation
Factor
Installed Cost in
Base Year
Installed
in 200
A-300 10 Ethanol Fermentor Agitator None $19,676 1996 $196,760 $196,760 1.2 $236,112 $2
A-301 1 Seed Hold Tank Agitator Flow 0.99 $12,551 1996 $12,551 0.51 $12,492 1.2 $14,990 $
A-304 2 4th Seed Vessel Agitator Flow 0.99 $11,700 1997 $23,400 0.51 $23,289 1.2 $27,947 $
A-305 2 5th Seed Vessel Agitator Flow 0.99 $10,340 1996 $20,680 0.51 $20,582 1.2 $24,699 $
A-306 2 Beer Surge Tank Agitator Flow 1.18 $48,700 1998 $97,400 0.51 $105,852 1.2 $127,023 $1
A-310 10 Saccharification Tank Agitator None $19,676 1996 $196,760 $196,760 1.2 $236,112 $2
F-300 5 Ethanol Fermentor None $493,391 1998 $2,466,955 $2,466,955 1.2 $2,960,346 $2,9
F-301 2 1st Seed Fermentor None $14,700 1997 $29,400 $29,400 2.8 $82,320 $
F-302 2 2nd Seed Fermentor None $32,600 1997 $65,200 $65,200 2.8 $182,560 $1
F-303 2 3rd Seed Fermentor None $81,100 1997 $162,200 $162,200 2.8 $454,160 $4
F-304 2 4th Seed Fermentor Flow 0.99 $39,500 1997 $79,000 0.93 $78,320 1.2 $93,984 $
F-305 2 5th Seed Fermentor Flow 0.99 $147,245 1998 $294,490 0.51 $293,097 1.2 $351,717 $3
H-300 5 1 Fermentation Cooler Heat Duty 1.97 $4,000 1997 $24,000 0.78 $40,684 2.1 $85,437 $
H-301 1 1 Hydrolyzate Heater Area 2.49 $19,040 1996 $38,080 0.68 $70,858 2.1 $148,802 $1
H-302 3 Saccharified Slurry Cooler Area 0.85 $25,409 1998 $76,227 0.78 $67,038 2.1 $140,779 $1
H-304 1 4th Seed Fermentor Coil Heat Duty 1.51 $3,300 1997 $3,300 0.83 $4,658 1.2 $5,589
H-305 1 5th Seed Fermentor Coil Heat Duty 1.51 $18,800 1997 $18,800 0.98 $28,238 1.2 $33,886 $
H-310 5 1 Fermentation Cooler Heat Duty 0.07 $4,000 1997 $24,000 0.78 $3,054 2.1 $6,413
P-300 5 1 Fermentation Recirc/Transfer Pump Heat Duty 1.97 $8,000 1997 $48,000 0.79 $82,000 2.8 $229,600 $2
P-301 1 1 Seed Hold Transfer Pump Flow 0.99 $22,194 1998 $44,388 0.7 $44,100 1.4 $61,740 $
P-302 2 Seed Transfer Pump Flow 0.99 $54,088 1998 $108,176 0.7 $107,474 1.4 $150,464 $1
P-306 1 1 Beer Transfer Pump Flow 1.18 $17,300 1997 $34,600 0.79 $39,360 2.8 $110,209 $1
P-310 5 1 Saccharification Recirc/Transfer Pump Heat Duty 0.07 $8,000 1997 $48,000 0.79 $5,954 2.8 $16,671 $
T-301 1 Seed Hold Tank Flow 0.99 $161,593 1998 $161,593 0.51 $160,829 1.2 $192,995 $1
T-306 1 Beer Storage Tank Flow 1.18 $237,700 1998 $237,700 0.71 $266,897 1.2 $320,276 $3
T-310 5 Saccharification Tank None $493,391 1998 $2,466,955 $2,466,955 1.2 $2,960,346 $2,9
A300 Subtotal* $6,978,615 $7,039,007 1.3 $9,255,176 $9,3
*Sections are subtotaled and an average "Installation Factor" is back-calculated for the section. Appendix B - Page 3 of 8

8/4/2019 NRL Report
http://slidepdf.com/reader/full/nrl-report 109/154
Individual Equipment Cost Summary
Equipment
Number
Number
Required
Number
Spares Equipment Name Scaled On
Size
Ratio
(Base/
Current)
Original
Equip Cost
(per unit) Base Year
Total Original
Equip Cost
(Req'd &
Spare) in Base
Year
Scaling
Exponent
Scaled Cost in
Base Year
Installation
Factor
Installed Cost in
Base Year
Installed
in 200
A-530 1 Recycled Water Tank Agitator Flow 1.45 $5,963 1998 $5,963 0.51 $7,197 1.3 $9,356
C-501 1 Lignin Wet Cake Screw Flow 0.44 $31,700 1997 $31,700 0.78 $16,837 1.4 $23,571 $
D-501 1 Beer Column
Diameter
Squared 1.13 $478,100 1998 $478,100 0.68 $520,236 2.1 $1,092,496 $1,1
D-502 1 Rectification Column Flow 1.25 $525,800 1996 $525,800 0.68 $613,596 2.1 $1,288,553 $1,3
E-501 2 1st Effect Evaporation Area 1.70 $544,595 1996 $1,089,190 0.68 $1,560,371 2.1 $3,276,779 $3,3
E-502 1 2nd Effect Evaporation Area 1.70 $435,650 1996 $435,650 0.68 $624,111 2.1 $1,310,634 $1,3
E-503 2 3rd Effect Evaporation Area 1.70 $435,650 1996 $871,300 0.68 $1,248,222 2.1 $2,621,267 $2,7
H-501 1 1 Beer Column Reboiler Heat Duty 1.19 $158,374 1996 $316,748 0.68 $357,008 2.1 $749,716 $7
H-502 1 Rectification Column Reboiler Heat Duty 1.18 $29,600 1997 $29,600 0.68 $33,192 2.1 $69,703 $
H-504 1 Beer Column Condenser Heat Duty 0.37 $29,544 1996 $29,544 0.68 $15,042 2.1 $31,588 $
H-505 1 Start-up Rect. Column Condenser Heat Duty 1.39 $86,174 1996 $86,174 0.68 $107,911 2.1 $226,613 $2
H-512 1 1 Beer Column Feed Interchanger Area 1.18 $19,040 1996 $38,080 0.68 $42,690 2.1 $89,650 $
H-517 1 1 Evaporator Condenser Heat Duty 1.75 $121,576 1996 $243,152 0.68 $355,539 2.1 $746,633 $7
M-503 1 Molecular Sieve (9 pieces) Flow 1.20 $2,700,000 1998 $2,700,000 0.7 $3,075,992 1 $3,075,992 $3,1
P-501 1 1 Beer Column Bottoms Pump Flow 1.20 $42,300 1997 $84,600 0.79 $97,723 2.8 $273,623 $2
P-503 1 1 Beer Column Reflux Pump Heat Duty 0.37 $1,357 1998 $2,714 0.79 $1,239 2.8 $3,469
P-504 1 1 Rectification Column Bottoms Pump Flow 1.19 $4,916 1998 $9,832 0.79 $11,316 2.8 $31,685 $
P-505 1 1 Rectification Column Reflux Pump Heat Duty 1.39 $4,782 1998 $9,564 0.79 $12,418 2.8 $34,772 $
P-511 2 1 1st Effect Pump Flow 1.09 $19,700 1997 $59,100 0.79 $63,251 2.8 $177,103 $1
P-512 1 1 2nd Effect Pump Flow 1.28 $13,900 1997 $27,800 0.79 $33,843 2.8 $94,759 $
P-513 2 1 3rd Effect Pump Flow 0.83 $8,000 1997 $24,000 0.79 $20,748 2.8 $58,095 $
P-514 1 1 Evaporator Condensate Pump Flow 1.69 $12,300 1997 $24,600 0.79 $37,312 2.8 $104,475 $1
P-515 1 Scrubber Bottoms Pump Flow 2.41 $2,793 1998 $2,793 0.79 $5,604 2.8 $15,692 $
P-530 1 1 Recycled Water Pump Flow 1.45 $10,600 1997 $21,200 0.79 $28,372 2.8 $79,441 $
S-505 4 Pneumapress Filter Solids Flow 0.85 $1,418,750 2000 $5,675,000 0.6 $5,142,942 1.04 $5,348,660 $5,3
T-503 1 Beer Column Relfux Drum Heat Duty 0.37 $11,900 1997 $11,900 0.93 $4,727 2.1 $9,927 $
T-505 1 Rectification Column Reflux Drum Heat Duty 1.39 $45,600 1997 $45,600 0.72 $57,855 2.1 $121,496 $1
T-512 1 Vent Scrubber Flow 1.37 $99,000 1998 $99,000 0.78 $126,355 2.1 $265,346 $2
T-514 1 Evaporator Condensate Drum Flow 1.44 $37,200 1998 $37,200 0.93 $52,286 2.1 $109,800 $1
T-530 1 Recycled Water Tank Flow 1.45 $14,515 1998 $14,515 0.745 $19,106 1.4 $26,748 $
A500 Subtotal* $13,030,419 $14,293,042 1.49 $21,367,640 $21,7
*Sections are subtotaled and an average "Installation Factor" is back-calculated for the section. Appendix B - Page 4 of 8

8/4/2019 NRL Report
http://slidepdf.com/reader/full/nrl-report 110/154
Individual Equipment Cost Summary
Equipment
Number
Number
Required
Number
Spares Equipment Name Scaled On
Size
Ratio
(Base/
Current)
Original
Equip Cost
(per unit) Base Year
Total Original
Equip Cost
(Req'd &
Spare) in Base
Year
Scaling
Exponent
Scaled Cost in
Base Year
Installation
Factor
Installed Cost in
Base Year
Installed
in 200
A-602 1 Equalization Basin Agitator Flow 0.52 $28,400 1997 $28,400 0.51 $20,286 1.2 $24,343 $
A-606 1 Anaerobic Agitator Volume 1.03 $30,300 1997 $30,300 0.51 $30,730 1.2 $36,875 $
A-608 16 Aerobic Lagoon Agitator Power 0.26 $31,250 1998 $500,000 0.51 $253,438 1.4 $354,813 $3
C-614 1 Aerobic Sludge Screw Flow 0.22 $5,700 1997 $5,700 0.78 $1,768 1.4 $2,475
H-602 1 Anaerobic Digestor Feed Cooler Area 0.43 $128,600 1997 $128,600 0.74 $68,759 2.1 $144,393 $1
M-604 1 Nutrient Feed System None $31,400 1998 $31,400 $31,400 2.58 $81,012 $
M-606 1 Biogas Emergency Flare Flow 0.24 $20,739 1998 $20,739 0.6 $8,877 1.68 $14,914 $
M-612 1 Filter Precoat System None $3,000 1998 $3,000 $3,000 1.4 $4,200
P-602 1 1 Anaerobic Reactor Feed Pump Flow 0.52 $11,400 1997 $22,800 0.79 $13,539 2.8 $37,910 $
P-606 1 1 Aerobic Digestor Feed Pump Flow 0.52 $10,700 1997 $21,400 0.79 $12,775 2.8 $35,771 $
P-608 1 Aerobic Sludge Recycle Pump Flow 0.22 $11,100 1997 $11,100 0.79 $3,356 1.4 $4,699
P-610 1 Aerobic Sludge Pump Flow 0.22 $11,100 1997 $11,100 0.79 $3,356 1.4 $4,699
P-611 1 1 Aerobic Digestion Outlet Pump Flow 0.52 $10,700 1997 $21,400 0.79 $12,707 2.8 $35,579 $
P-614 1 1 Sludge Filtrate Recycle Pump Flow 0.22 $6,100 1997 $12,200 0.79 $3,681 2.8 $10,306 $
P-616 1 1 Treated Water Pump Flow 0.53 $10,600 1997 $21,200 0.79 $12,772 2.8 $35,760 $
S-600 1 Bar Screen Flow 0.52 $117,818 1991 $117,818 0.3 $96,663 1.2 $115,996 $1
S-614 1 Belt Filter Press COD 0.26 $650,223 1998 $650,223 0.72 $248,935 1.8 $448,083 $4
T-602 1 Equalization Basin Flow 0.52 $350,800 1998 $350,800 0.51 $250,578 1.42 $355,821 $3
T-606 1 Anaerobic Digestor Volume 1.03 $881,081 1998 $881,081 0.51 $893,571 1.04 $929,314 $9
T-608 1 Aerobic Digestor Volume 0.52 $635,173 1998 $635,173 1 $330,629 1 $330,629 $3
T-610 1 Clarifier Flow 0.52 $174,385 1998 $174,385 0.51 $124,991 1.96 $244,981 $2
A600 Subtotal* $3,678,819 $2,425,810 1.34 $3,252,573 $3,3
*Sections are subtotaled and an average "Installation Factor" is back-calculated for the section. Appendix B - Page 5 of 8

8/4/2019 NRL Report
http://slidepdf.com/reader/full/nrl-report 111/154
Individual Equipment Cost Summary
Equipment
Number
Number
Required
Number
Spares Equipment Name Scaled On
Size
Ratio
(Base/
Current)
Original
Equip Cost
(per unit) Base Year
Total Original
Equip Cost
(Req'd &
Spare) in Base
Year
Scaling
Exponent
Scaled Cost in
Base Year
Installation
Factor
Installed Cost in
Base Year
Installed
in 200
A-701 1 Denaturant In-line Mixer Flow 1.32 $1,900 1997 $1,900 0.48 $2,173 1 $2,173
A-720 1 CSL Storage Tank Agitator Flow 0.03 $12,551 1996 $12,551 0.51 $2,143 1.2 $2,572
A-760 1 CSL/DAP Day Tank Agitator Flow 0.93 $12,795 2001 $12,795 0.51 $12,348 1.2 $14,817 $
C-755 1 DAP Solids Feeder None $3,900 1997 $3,900 $3,900 1.3 $5,070
P-701 2 1 Ethanol Product Pump Flow 1.33 $7,500 1997 $22,500 0.79 $28,200 2.8 $78,959 $
P-703 1 1 Sulfuric Acid Pump Flow 2.00 $8,000 1997 $16,000 0.79 $27,628 2.8 $77,359 $
P-704 1 1 Firewater Pump Flow 1.33 $18,400 1997 $36,800 0.79 $46,120 2.8 $129,137 $1
P-710 1 1 Gasoline Pump Flow 1.15 $4,500 1997 $9,000 0.79 $10,041 2.8 $28,114 $
P-720 1 1 CSL Pump Flow 0.64 $8,800 1997 $17,600 0.79 $12,376 2.8 $34,652 $
P-750 1 1 Cellulase Pump Flow 1.00 $18,400 1997 $36,800 0.79 $36,803 2.8 $103,049 $1
P-755 1 DAP Unloading Blower Flow 1.06 $47,600 1998 $47,600 0.5 $49,014 1.4 $68,620 $
P-760 1 1 CSL/DAP Pump Flow 0.64 $8,800 1997 $17,600 0.79 $12,376 2.8 $34,652 $
S-755 1 DAP Vent Baghouse Flow 0.30 $32,200 1997 $32,200 1 $9,595 1.5 $14,392 $
T-701 2 Ethanol Product Storage Tank Flow 1.33 $165,800 1997 $331,600 0.51 $383,637 1.4 $537,092 $5
T-703 1 Sulfuric Acid Storage Tank Flow 2.00 $42,500 1997 $42,500 0.51 $60,470 1.2 $72,564 $
T-704 1 Firewater Storage Tank Flow 1.33 $166,100 1997 $166,100 0.51 $192,175 1.4 $269,045 $2
T-709 1 Propane Storage Tank Flow 1.35 $24,834 2001 $24,834 0.72 $30,825 1.4 $43,155 $
T-710 1 Gasoline Storage Tank Flow 1.15 $43,500 1997 $43,500 0.51 $46,684 1.4 $65,358 $
T-720 1 CSL Storage Tank Flow 0.64 $88,100 1997 $88,100 0.79 $61,949 1.4 $86,729 $
T-750 1 Cellulase Storage Tank Flow 0.74 $125,900 2001 $251,800 0.79 $198,278 1.4 $277,589 $2
T-755 1 DAP Storage Bin Flow 1.06 $33,384 2001 $33,384 0.44 $34,255 1.3 $44,532 $
T-760 1 CSL/DAP Day Tank Flow 0.93 $30,084 2001 $30,084 0.79 $28,470 1.4 $39,858 $
A700 Subtotal* $1,216,864 $1,251,396 1.6 $1,975,238 $1,9
*Sections are subtotaled and an average "Installation Factor" is back-calculated for the section. Appendix B - Page 6 of 8

8/4/2019 NRL Report
http://slidepdf.com/reader/full/nrl-report 112/154
Individual Equipment Cost Summary
Equipment
Number
Number
Required
Number
Spares Equipment Name Scaled On
Size
Ratio
(Base/
Current)
Original
Equip Cost
(per unit) Base Year
Total Original
Equip Cost
(Req'd &
Spare) in Base
Year
Scaling
Exponent
Scaled Cost in
Base Year
Installation
Factor
Installed Cost in
Base Year
Installed
in 200
H-801 1 Burner Combustion Air Preheater Heat Duty 0.49 $1,049,900 1997 $1,049,900 0.6 $687,152 1.5 $1,030,728 $1,0
H-811 1 BFW Preheater Area 0.48 $58,400 1997 $58,400 0.68 $35,477 2.1 $74,502 $
M-803 1 Fluidized Bed Combustion Reactor Flow 0.54 $24,900,000 1998 $24,900,000 0.75 $15,716,316 1.3 $20,431,211 $20,6
M-804 1 Combustion Gas Baghouse Flow 0.55 $2,536,300 1998 $2,536,300 0.58 $1,784,255 1.5 $2,676,383 $2,7
M-811 1 Turbine/Generator Flow 0.66 $10,000,000 1998 $10,000,000 0.71 $7,422,186 1.5 $11,133,279 $11,2
M-820 1 Hot Process Water Softener System Flow 0.77 $1,381,300 1999 $1,381,300 0.82 $1,114,233 1.3 $1,448,503 $1,4
M-830 1 Hydrazine Addition Pkg. Flow 0.83 $19,000 1994 $19,000 0.6 $16,995 1 $16,995 $
M-832 1 Ammonia Addition Pkg Flow 0.83 $19,000 1994 $19,000 0.6 $16,995 1 $16,995 $
M-834 1 Phosphate Addition Pkg. Flow 0.83 $19,000 1994 $19,000 0.6 $16,995 1 $16,995 $
P-804 2 Condensate Pump Flow 1.94 $7,100 1997 $14,200 0.79 $23,987 2.8 $67,162 $
P-811 2 Turbine Condensate Pump Flow 0.42 $7,800 1997 $15,600 0.79 $7,819 2.8 $21,892 $
P-824 2 Deaerator Feed Pump Flow 0.59 $9,500 1997 $19,000 0.79 $12,557 2.8 $35,161 $
P-826 5 BFW Pump Flow 0.34 $52,501 1998 $262,505 0.79 $111,259 2.8 $311,526 $3
P-828 2 Blowdown Pump Flow 0.86 $5,100 1997 $10,200 0.79 $9,089 2.8 $25,448 $
P-830 1 Hydrazine Transfer Pump Flow 0.83 $5,500 1997 $5,500 0.79 $4,749 2.8 $13,297 $
T-804 1 Condensate Collection Tank Flow 0.52 $7,100 1997 $7,100 0.71 $4,472 1.4 $6,261
T-824 1 Condensate Surge Drum Flow 0.78 $49,600 1997 $49,600 0.72 $41,541 1.7 $70,619 $
T-826 1 Deaerator Flow 0.72 $165,000 1998 $165,000 0.72 $129,664 2.8 $363,059 $3
T-828 1 Blowdown Flash Drum Flow 0.87 $9,200 1997 $9,200 0.72 $8,327 2.8 $23,316 $
T-830 1 Hydrazine Drum Flow 0.83 $12,400 1997 $12,400 0.93 $10,432 1.7 $17,734 $
A800 Subtotal* $40,553,205 $27,174,501 1.4 $37,801,069 $38,2
*Sections are subtotaled and an average "Installation Factor" is back-calculated for the section. Appendix B - Page 7 of 8

8/4/2019 NRL Report
http://slidepdf.com/reader/full/nrl-report 113/154
Individual Equipment Cost Summary
Equipment
Number
Number
Required
Number
Spares Equipment Name Scaled On
Size
Ratio
(Base/
Current)
Original
Equip Cost
(per unit) Base Year
Total Original
Equip Cost
(Req'd &
Spare) in Base
Year
Scaling
Exponent
Scaled Cost in
Base Year
Installation
Factor
Installed Cost in
Base Year
Installed
in 200
M-902 1 Cooling Tower System Heat Duty 0.70 $1,659,000 1998 $1,659,000 0.78 $1,250,136 1.2 $1,500,163 $1,5
M-904 2 1 Plant Air Compressor Flow 1.00 $278,200 2000 $834,600 0.34 $834,598 1.3 $1,084,977 $1,0
M-910 1 CIP System Flow 1.00 $95,000 1995 $95,000 0.6 $95,036 1.2 $114,043 $1
P-902 1 1 Cooling Water Pump Flow 0.67 $332,300 1997 $664,600 0.79 $484,432 2.8 $1,356,409 $1,3
P-912 1 1 Make-up Water Pump Flow 0.76 $10,800 1997 $21,600 0.79 $17,470 2.8 $48,917 $
P-914 2 1 Process Water Circulating Pump Flow 0.75 $11,100 1997 $33,300 0.79 $26,453 2.8 $74,067 $
S-904 1 1 Instrument Air Dryer Flow 0.61 $15,498 1999 $30,996 0.6 $23,108 1.3 $30,040 $
T-902 3 Prehydrolysis Filter Air Receiver Flow 0.89 $17,000 2000 $51,000 0.72 $46,942 1.2 $56,331 $
T-904 1 Plant Air Receiver Flow 0.61 $13,000 1997 $13,000 0.72 $9,139 1.3 $11,880 $
T-905 4 Product Recovery Filter Air Receiver Flow 1.04 $17,000 2000 $68,000 0.72 $69,887 1.2 $83,865 $
T-914 1 Process Water Tank Flow 0.75 $195,500 1997 $195,500 0.51 $168,502 1.4 $235,903 $2
A900 Subtotal* $3,666,596 $3,025,703 1.5 $4,596,596 $4,6
Total Equipment Cost $87,764,599 $73,987,116 1.52 $112,513,533 $113,6
*Sections are subtotaled and an average "Installation Factor" is back-calculated for the section. Appendix B - Page 8 of 8

8/4/2019 NRL Report
http://slidepdf.com/reader/full/nrl-report 114/154
Appendix CChemical Costs and Sources

8/4/2019 NRL Report
http://slidepdf.com/reader/full/nrl-report 115/154
Chemical Cost and Sources
Raw Material Cost ($/lb) in 2000 $Reference
Clarifier Polymer 1.2500 Harris Group, 2000
Sulfuric Acid 0.0124 $25/ton, Chemical Marketing Reporter, 2001
Hydrated Lime 0.0348 $70/ton, Chemical Marketing Reporter, 2001
Corn Steep Liquor 0.0804 Analysis of CSL market, Ruth, M. Report to Process Engineering Team, 5 June 1998
Purchased Cellulase Enzyme 0.0552 Set to $0.10/gal ethanol, based on purchased, delivered enzyme
Diammonium Phosphate 0.0706 $142/ton, Chemical Marketing Reporter, 2001
Propane 0.0022 $0.734/gal, 1999 average from DOE Energy Information Administration
Makeup Water 0.0001 $1/1000 gal, Middle of range $0.35-$1.50/1000 gal in Peters/Timmerhaus, pg. 815Boiler Chemicals 1.3497 Radian Report, Cases
Cooing Tower Chems 1.0204 Unknown
WasteWater Chems 0.1579 Merrick Report Appendix G
WasteWater Polymer 2.5510 Merrick Report Appendix G
Gasoline Denaturant 0.0967 $0.555/gal, Analysis of Corn ethanol producers' cost, 1999 average
Utility
Solid Disposal 0.0094 $20/ton, Chem Systems Report 1993
Co-product credit
Electricity $0.041/kWh Chem Systems Report, 1994
Appendix C

8/4/2019 NRL Report
http://slidepdf.com/reader/full/nrl-report 116/154
Appendix DDiscounted Cash Flow Rate of Return Summary

8/4/2019 NRL Report
http://slidepdf.com/reader/full/nrl-report 117/154
Discounter Cash Flow Rate of Return Appendix D
Year -2 -1 0 1 2 3 4 5 6 7 8 9 10
$15,794,024 $118,455,184 $63,176,098
Working Capital $9,871,265
Fixed Capital Investment
Ethanol Sales $55,407,468 $73,876,624 $73,876,624 $73,876,624 $73,876,624 $73,876,624 $73,876,624 $73,876,624 $73,876,624 $73,876,624
By-Product Credit $4,824,203 $6,432,270 $6,432,270 $6,432,270 $6,432,270 $6,432,270 $6,432,270 $6,432,270 $6,432,270 $6,432,270
Total Annual Sales $60,231,670 $80,308,894 $80,308,894 $80,308,894 $80,308,894 $80,308,894 $80,308,894 $80,308,894 $80,308,894 $80,308,894
Annual Manufacturing Cost
Raw Mater ials $20,272,908 $23,169,038 $23,169,038 $23,169,038 $23,169,038 $23,169,038 $23,169,038 $23,169,038 $23,169,038 $23,169,038
Ion Exchange Resin $0 $0
Baghouse Bags $349,682 $349,682
Other Variab le Costs $12,932,287 $14,779,757 $14,779,757 $14,779,757 $14,779,757 $14,779,757 $14,779,757 $14,779,757 $14,779,757 $14,779,757
Fixed Operating Costs $7,540,360 $7,540,360 $7,540,360 $7,540,360 $7,540,360 $7,540,360 $7,540,360 $7,540,360 $7,540,360 $7,540,360
Total Product Cost $41,095,237 $45,489,155 $45,489,155 $45,489,155 $45,489,155 $45,838,837 $45,489,155 $45,489,155 $45,489,155 $45,489,155
Annual Depreciation
General Plant
DDB $37,422,543 $26,730,388 $19,093,134 $13,637,953 $9,741,395 $6,958,139 $4,970,099
SL $18,711,271 $15,592,726 $13,365,194 $11,933,209 $11,364,961 $11,364,961 $11,364,961
Remainin g Value $93,556,357 $66,825,969 $47,732,835 $34,094,882 $24,353,487 $17,395,348 $12,425,249
Actual $37,422,543 $26,730,388 $19,093,134 $13,637,953 $11,364,961 $11,364,961 $11,364,961
Steam Plant
DDB $4,983,480 $4,609,719 $4,263,990 $3,944,191 $3,648,377 $3,374,749 $3,121,642 $2,887,519 $2,670,955 $2,470,634
SL $3,322,320 $3,234,891 $3,158,511 $3,093,483 $3,040,314 $2,999,777 $2,972,993 $2,961,558 $2,961,558 $2,961,558
Remainin g Value $61,462,926 $56,853,206 $52,589,216 $48,645,025 $44,996,648 $41,621,899 $38,500,257 $35,612,738 $32,941,782 $30,471,149
Actual $4,983,480 $4,609,719 $4,263,990 $3,944,191 $3,648,377 $3,374,749 $3,121,642 $2,961,558 $2,961,558 $2,961,558
Net Revenue ($23,269,590) $3,479,632 $11,462,614 $17,237,595 $19,806,401 $19,730,348 $20,333,136 $31,858,181 $31,858,181 $31,858,181
Losses Forward ($23,269,590) ($19,789,958) ($8,327,344) $0 $0 $0 $0 $0 $0
Taxable Income ($23,269,590) ($19,789,958) ($8,327,344) $8,910,250 $19,806,401 $19,730,348 $20,333,136 $31,858,181 $31,858,181 $31,858,181
Income Tax $0 $0 $0 $3,474,998 $7,724,496 $7,694,836 $7,929,923 $12,424,690 $12,424,690 $12,424,690
Annual Cash Income $19,136,433 $34,819,739 $34,819,739 $31,344,741 $27,095,242 $26,775,222 $26,889,816 $22,395,048 $22,395,048 $22,395,048
Discount Factor 1.21 1.1 1 0.909090909 0.826446281 0.751314801 0.683013455 0.620921323 0.56447393 0.513158118 0.46650738 0.424097618 0.385543289
Annual Present Value $220,991,534 $17,396,757 $28,776,644 $26,160,585 $21,408,880 $16,824,014 $15,113,915 $13,798,727 $10,447,455 $9,497,687 $8,634,261
Total Capital Investment + Interest $19,110,770 $130,300,702 $73,047,363
Net Present Worth $0
If income taxable income < 0, tax = $0 Loan Interest subtracted from taxable income.Loan payment subtracted from annual cash incomeInterest on construction loan added to investment
NPV of Income Tax $60,794,932 $0 $0 $0 $2,373,470 $4,796,305 $4,343,534 $4,069,304 $5,796,210 $5,269,282 $4,790,256
NPV of Ethanol Income $612,163,202 $50,370,425 $61,055,061 $55,504,601 $50,458,728 $45,871,571 $41,701,428 $37,910,389 $34,463,990 $31,330,900 $28,482,637

8/4/2019 NRL Report
http://slidepdf.com/reader/full/nrl-report 118/154
Discounter Cash Flow Rate of Return Appendix D
Year 11 12 13 14 15 16 17 18 19 20Fixed Capital InvestmentWorking Capital ($9,871,265)
Ethanol Sales $73,876,624 $73,876,624 $73,876,624 $73,876,624 $73,876,624 $73,876,624 $73,876,624 $73,876,624 $73,876,624 $73,876,624
By-Product Credit $6,432,270 $6,432,270 $6,432,270 $6,432,270 $6,432,270 $6,432,270 $6,432,270 $6,432,270 $6,432,270 $6,432,270
Total Annual Sales $80,308,894 $80,308,894 $80,308,894 $80,308,894 $80,308,894 $80,308,894 $80,308,894 $80,308,894 $80,308,894 $80,308,894
Annual Manufacturing Cost
Raw Mater ials $23,169,038 $23,169,038 $23,169,038 $23,169,038 $23,169,038 $23,169,038 $23,169,038 $23,169,038 $23,169,038 $23,169,038
Ion Exchange Resin $0 $0
Baghouse Bags $349,682 $349,682
Other Variab le Costs $14,779,757 $14,779,757 $14,779,757 $14,779,757 $14,779,757 $14,779,757 $14,779,757 $14,779,757 $14,779,757 $14,779,757
Fixed Operating Costs $7,540,360 $7,540,360 $7,540,360 $7,540,360 $7,540,360 $7,540,360 $7,540,360 $7,540,360 $7,540,360 $7,540,360
Total Product Cost $45,838,837 $45,489,155 $45,489,155 $45,489,155 $45,489,155 $45,838,837 $45,489,155 $45,489,155 $45,489,155 $45,489,155
Annual Depreciation
General Plant
DDB
SL
Remaining Value
Actual
Steam Plant
DDB $2,285,336 $2,113,936 $1,955,391 $1,808,736 $1,673,081 $1,547,600 $1,431,530 $1,324,165 $1,224,853 $1,132,989
SL $2,961,558 $2,961,558 $2,961,558 $2,961,558 $2,961,558 $2,961,558 $2,961,558 $2,961,558 $2,961,558 $2,961,558
Remaining Value $28,185,812 $26,071,877 $24,116,486 $22,307,749 $20,634,668 $19,087,068 $17,655,538 $16,331,373 $15,106,520 $13,973,531
Actual $2,961,558 $2,961,558 $2,961,558 $2,961,558 $2,961,558 $2,961,558 $2,961,558 $2,961,558 $2,961,558 $2,961,558
Net Revenue $31,508,499 $31,858,181 $31,858,181 $31,858,181 $31,858,181 $31,508,499 $31,858,181 $31,858,181 $31,858,181 $31,858,181
Losses Forward $0 $0 $0 $0 $0 $0 $0 $0 $0 $0
Taxable Income $31,508,499 $31,858,181 $31,858,181 $31,858,181 $31,858,181 $31,508,499 $31,858,181 $31,858,181 $31,858,181 $31,858,181
Income Tax $12,288,315 $12,424,690 $12,424,690 $12,424,690 $12,424,690 $12,288,315 $12,424,690 $12,424,690 $12,424,690 $12,424,690
Annual Cash Income $22,181,743 $22,395,048 $22,395,048 $22,395,048 $22,395,048 $22,181,743 $22,395,048 $22,395,048 $22,395,048 $22,395,048
Discount Factor 0.350493899 0.318630818 0.28966438 0.263331254 0.239392049 0.217629136 0.197844669 0.17985879 0.163507991 0.148643628
Annual Present Value $7,774,565 $7,135,753 $6,487,048 $5,897,316 $5,361,197 $4,827,393 $4,430,741 $4,027,946 $3,661,769 $3,328,881
Total Capital Investment + Interest ($1,467,301)
Net Present Worth
NPV of Income Tax $4,306,979 $3,958,889 $3,598,990 $3,271,809 $2,974,372 $2,674,295 $2,458,159 $2,234,690 $2,031,536 $1,846,851
$25,893,306 $23,539,369 $21,399,426 $19,454,024 $17,685,476 $16,077,706 $14,616,096 $13,287,360 $12,079,418 $10,981,289NPV of Ethanol Income

8/4/2019 NRL Report
http://slidepdf.com/reader/full/nrl-report 119/154
Ethanol Production Process Engineering AnalysisCorn Stover Design Report Case, process P110: 2010 plant start-up
Dilute Acid Prehydrolysis with Saccharification and Co-Fermentation
All Values in 2000$
Minimum Ethanol Selling Price $1.07
Ethanol Production (MM Gal. / Year) 69.3 Ethanol at 68°F
Ethanol Yield (Gal / Dry US Ton Feedstock) 89.7
Feedstock Cost $/Dry US Ton $30
Internal Rate of Return (After-Tax) 10%
Equity Percent of Total Investment 100%
Capital Costs
Feed Handling $7,500,000
Pretreatment $19,000,000
Neutralization/Conditioning $7,800,000
Saccharification & Fermentation $9,400,000
Distillation and Solids Recovery $21,800,000Wastewater Treatment $3,300,000
Storage $2,000,000
Boiler/Turbogenerator $38,300,000
Utilities $4,700,000
Total Installed Equipment Cost $113,700,000
Added Costs $83,700,000
(% of TPI) 42%
Total Project Investment $197,400,000
Loan Rate N/A
Term (years) N/ACapital Charge Factor 0.176
Denatured Fuel Prod. (MMgal / yr) 72.5
Denatured Fuel Min. Sales Price $1.04
Denaturant Cost ($/gal denaturant) $0.555
Maximum Yields (100% of Theoretical)
Ethanol Production (MM Gal/yr) 87.0
Theoretical Yield (Gal/ton) 112.7
Current Yield (Actual/Theoretical) 80%
Operating Costs (cents/gal ethanol)
FeedstockBiomass to BoilerCSLCellulaseOther Raw MaterialsWaste DisposalElectricityFixed CostsCapital DepreciationAverage Income TaxAverage Return on Investment
33.4
0.0
2.8
10.1
5.52.9
-9.3
10.9
14.3
10.6
25.4
106.8
Operating Costs ($/yr)
FeedstockBiomass to BoilerCSLCellulaseOther Raw Matl. CostsWaste DisposalElectricityFixed CostsCapital DepreciationAverage Income TaxAverage Return on Investment
Excess Electricity (KWH/gal)Plant Electricity Use (KWH/gal)Plant Steam Use (kg steam/gal)Boiler Feed -- LHV (Btu/lb)Boiler Feed -- Water Fraction
$23,200,000
$0
$1,900,000
$7,000,000$3,800,000
$2,000,000
-$6,400,000
$7,500,000
$9,900,000
$7,300,000
$17,600,000
$73,800,000
2.28
1.42
16.7
2,870
0.518
Appendix D

8/4/2019 NRL Report
http://slidepdf.com/reader/full/nrl-report 120/154
Variable and Fixed Operating Costs
Production
Rate (MM
gal/yr) 69.27 24,686
Feedstock Dry
Tons/yr 772168
gal/ton 90
Hours per
Year 8,406
Variable Operating Costs
Costing
Cod e Raw Material
Stream
No. kg/hr lb/hr
Quoted
Price(cents /
ton)
Year ofPrice
Quote
2000 Cost(cents /
ton)
2000 Cost
($/lb) $/hour
MM$/yr
(2000)
Cents/Gallon
Ethanol (2000)
F-1 Feedstock STRM010 98,039 216,176 2550 2000 2550.00 0.0128 2756.25 23.17 33.45
F-1 Feedstock STRM084 0 0 2550 2000 2550.00 0.0128 0.00 0.00 0.00
S-11 Clarifier Polymer STRM010 28 63 250000 2000 250000.00 1.2500 78.24 0.66 0.95
R-5 Sulfuric Acid STRM071 3,288 7,251 2500 2001 2485.99 0.0124 90.13 0.76 1.09
R-4 Hydrated Lime STRM074 2,395 5,280 7000 2001 6960.77 0.0348 183.77 1.54 2.23
R-3 Corn Steep Liquor STRM073 1,306 2,879 15000 1998 16087.17 0.0804 231.57 1.95 2.81
R-7 Purchased Cellulase STRM075 6,824 15,046 10823 1999 11044.07 0.0552 830.86 6.98 10.08
R-8 Ammonium Phosphate STRM075 163 360 14200 2001 14120.42 0.0706 25.42 0.21 0.31
S-12 Propane 3 20 45 436 1999 444.90 0.0022 0.10 0.00 0.001
S-8 Makeup Water STRM090 189,649 411,562 24 1990 23.30 0.0001 48.67 0.40 0.58
S-1 Boiler Chemicals STRM092 1.0 2 280000 1991 269932.90 1.3497 2.98 0.03 0.04
S-2 Cooling Tower Chems STRM092 1.9 4 200000 1999 204081.02 1.0204 4.28 0.04 0.05
S-4 WasteWater Chems STRM063 57.9 128 30956 1999 31587.66 0.1579 20.18 0.17 0.24
S-5 WasteWater Polymer STRM063 0.2 0.43 500000 1999 510202.54 2.5510 1.10 0.01 0.01
Subtotal 4272.73 35.92 51.85
Waste Streams
W-2 Disposal of Steam 809 STRM080 4,492 9,906 1820 1993 1872.61 0.0094 92.75 0.78 1.13
W-3 Disposal of Stream 229 STRM022 7,217 15,913 1820 1993 1872.61 0.0094 148.99 1.25 1.81
Subtotal 241.74 2.03 2.93
By-Product Credits KW $/KW $/kWh
P-1 Electricity WKNET 18,747 na 0.040 1999 0.041 765.20 6.43 9.29
Subtotal 765.20 6.43 9.29
Total Variable Operating
Costs 3,749.29 31.52 45.50
Fixed Operating Costs
Plant Manager 80000 1 80,000
Plant Engineer 65000 1 65,000
Maintenance Supr 60000 1 60,000
Lab Manager 50000 1 50,000
Shift Supervisor 37000 5 185,000
Lab Technician 25000 2 50,000
Maintenance Tech 28000 8 224,000
Shift Operators 25000 20 500,001
Yard Employees 20000 32 640,001
General Manager 100000 1 100,000
Clerks & Secretaries 20000 5 100,000
Total Salaries 2,054,002 2.15 3.11
Overhead/Maint 60%
of Labor &
Supervison 1,292,976 1.29 1.87
Maintenance 2%
Equipment
Cost 2,273,396 2.27 3.28
Insurance & Taxes 1.5%
of Total
Installed Cost 1,819,029 1.82 2.63
Total Fixed Operating Costs 7.54 10.89
Total Cash Cost 39.06 56.38
Appendix D

8/4/2019 NRL Report
http://slidepdf.com/reader/full/nrl-report 121/154
Appendix EProcess Parameters
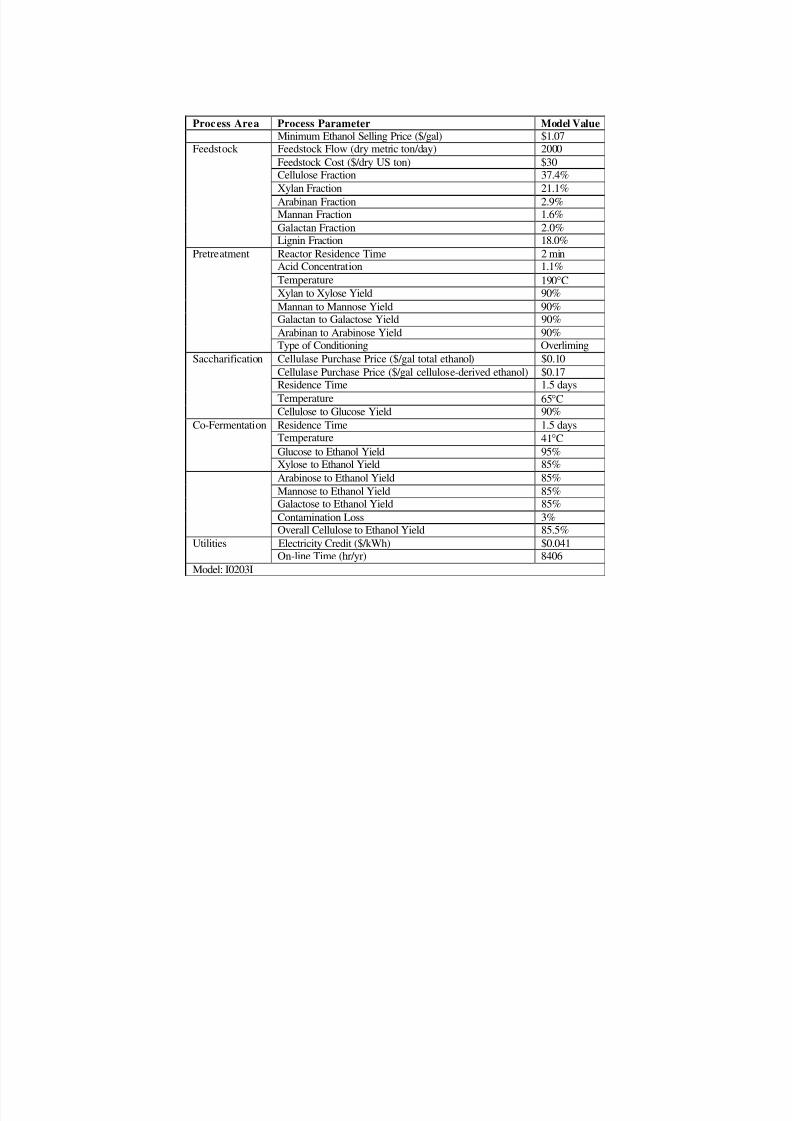
8/4/2019 NRL Report
http://slidepdf.com/reader/full/nrl-report 122/154
Process Area Process Parameter Model ValueMinimum Ethanol Selling Price ($/gal) $1.07
Feedstock Feedstock Flow (dry metric ton/day) 2000Feedstock Cost ($/dry US ton) $30Cellulose Fraction 37.4%
Xylan Fraction 21.1%
Arabinan Fraction 2.9%Mannan Fraction 1.6%
Galactan Fraction 2.0%Lignin Fraction 18.0%
Pretreatment Reactor Residence Time 2 minAcid Concentration 1.1%
Temperature 190°CXylan to Xylose Yield 90%
Mannan to Mannose Yield 90%Galactan to Galactose Yield 90%
Arabinan to Arabinose Yield 90%Type of Conditioning Overliming
Saccharification Cellulase Purchase Price ($/gal total ethanol) $0.10
Cellulase Purchase Price ($/gal cellulose-derived ethanol) $0.17Residence Time 1.5 days
Temperature 65°CCellulose to Glucose Yield 90%
Co-Fermentation Residence Time 1.5 daysTemperature 41°C
Glucose to Ethanol Yield 95%Xylose to Ethanol Yield 85%
Arabinose to Ethanol Yield 85%
Mannose to Ethanol Yield 85%Galactose to Ethanol Yield 85%
Contamination Loss 3%Overall Cellulose to Ethanol Yield 85.5%
Utilities Electricity Credit ($/kWh) $0.041On-line Time (hr/yr) 8406
Model: I0203I

8/4/2019 NRL Report
http://slidepdf.com/reader/full/nrl-report 123/154
Appendix FProcess Flow Diagrams
Note: Larger format (11” x 17”) versions of these Process Flow Diagrams are available upon request [email protected]

8/4/2019 NRL Report
http://slidepdf.com/reader/full/nrl-report 124/154
MPONENT UNITS 101 102 103 104 105 107al Flow kg/hr 98,039 43,017 11,400 1,009 128,676 28
oluble Solids % 77.4% 0.0% 0.0% 0.0% 59.0% 0.0%uble Solids % 7.6% 0.1% 0.1% 0.1% 5.8% 0.0%mperature C 20 74 74 74 45 20ssure atm 1.00 3.00 1.00 1.00 1.00 1.00
por Fraction 0.00 0.00 0.00 0.00 0.00 0.00anol kg/hr 31 8 1 22er kg/hr 14,706 42,546 11,275 970 45,007
cose (SS) kg/hrose (SS) kg/hr 0 0 0 0binose (SS) kg/hr 0
er Sugars (SS) kg/hrobiose (SS) kg/hrcose Oligomers (SS) kg/hrose Oligomers (SS) kg/hr 0 0 0 0er Oligomers (SS) kg/hr
n Steep Liquor (SS) kg/hr 58 15 1 41ers (Soluble Solids) kg/hr 7,417 7,417tic Acid kg/hr 325 86 7 232
uric Acid kg/hr 0 0 0 0ural kg/hr 48 13 1 34
F kg/hr 7 2 0 5bon Dioxide kg/hr
hane kg/hrgen kg/hr
ogen kg/hr
ers kg/hr 2 0 28 1 28ulose (IS) kg/hr 31,187 31,187
an (IS) kg/hr 17,570 17,570binan (IS) kg/hr 2,435 2,435
er Sugar Polymers (IS) kg/hr 2,919 2,919ulase (IS) kg/hrmass (IS) kg/hr
mo (IS) kg/hrin (IS) kg/hr 15,002 15,002sum (IS) kg/hrOH)2 (IS) kg/hr
ers (Insoluble Solids) kg/hr 6,804 6,804ha lpy Flo w ( mil li on s) Kcal /hr -170.1 - 16 0.0 -42.4 -3.8 - 28 4. 0 - 0. 1rage D ensity g/ml 1.4709 0.9442 0.9443 0.9443 1.3433 0.9983
Work Stream No. kW Work Stream No. kW
WC101 55.93 WP102WC102 11.18 WP103WC103 2.80 WP104WC104 11.18 WP105WM104 83.90 WS101WM105 1118.56 W S102WM107 25.00 WS103
WP101 37.06
I 0 2 0 3 I . x l s
Eq. No. Equipment Name R eq. Spare Equipment Type MatC-101 Bale Transport Conveyor 2 BELT CS
C-102 Bale Unwrapping Conveyor 2 BELT CSC-103 Belt Press Discharge Conveyor 1 BELT CSC-104 Shredder Feed Conveyor 4 BELT CSM-101 Truck Scales 2 TRUCK-SCALE CONM-102 Truck Unloading Forklift 4 1 LOADERM-103 Bale Moving Forklift 4 LOADERM-104 Corn Stover Wash Table 2 A28M-105 Shredder 4 ALLM-106 Concrete Feedstock-Storage Slab 1 CONCRETE-SLAB CONM-107 Polymer Feed System 1 MISCELLANEOUS CSP-101 Wash Table Pump 2 1 CENTRIFUGAL CS;P-102 Wash Water Pump 2 1 CENTRIFUGAL CSP- 103 Cl ar if ier Under fl ow Pump 1 1 R ECIPROCATING CS;P-104 Clarified Water Pump 1 1 CENTRIFUGAL CSP-105 Belt Press Sump Pump 1 1 SLURRY CS
S-101 Clarifier Thickener 1 CSS-102 Belt Press 1 FILTER-PRESS 304
S-103 Magnetic Separator 1 MAGNETT-101 Wash Water Tank 1 VERTICAL-VESSEL CST-102 Clarifier Thickener Tank 1 CLARIFER CEM

8/4/2019 NRL Report
http://slidepdf.com/reader/full/nrl-report 125/154
Heat Stream No. MM kcal/hr Work Stream No. kW
QH201 -0.19 WC201QH201B -22.31 WM202
QH244 3.64 WP201
U I 105 211 212 214 215 216 217 218 220 233 501 502 520 520 710al l ow kg/hr 128,676 99,344 2,104 101, 447 11,507 37,234 278,865 53,152 225,713 1,185 449,353 449,353 53,152 53,152 3,288luble olids % 59.0% 0.0% 0.0% 0.0% 0.0% 0.0% 17.2% 0.0% 21.3% 0.0% 5.0% 5.0% 0.0% 0.0% 0.0%
uble olids % 5.8% 0.1% 0.0% 0.1% 0.0% 0.0% 12.6% 0.1% 15.6% 0.0% 3.6% 3.6% 0.1% 0.1% 0.0%
mperature C 45 74 20 74 164 268 190 101 101 20 95 41 30 100 20ssure atm 1.00 3.00 3.40 4.00 4.42 13.00 12.05 1.00 1.00 3.40 4.00 0.90 1.00 1.00 1.00or Fraction 0.00 0.00 0.00 0.00 1.00 1.00 0.00 1.00 0.00 0.00 0.00 0.00 0.00 0.00 0.00
anol kg/hr 22 71 71 93 73 20 24,825 24,825 73 73er kg/hr 45,007 98,256 98,256 11,507 37,234 189,218 52,244 136,974 374,828 374,828 52,244 52,244cose ) kg/hr 2,426 2,426 82 82ose ) kg/hr 0 0 0 17,969 0 17,969 909 909 0 0binose ) kg/hr 0 0 2,490 0 2,490 217 217 0 0
er Sugars (SS) kg/hr 2,919 2,919 254 254obiose (SS) kg/hr 230 230 360 360cose Oligomers (SS) kg/hr 291 291 1,853 1,853ose Oligomers (SS) kg/hr 0 0 0 500 0 500 646 646 0 0er Oligomers (SS) kg/hr 750 750 969 969n Steep Liquor (SS) kg/hr 41 133 133 174 48 126 1,459 1,459 48 48ers (Soluble Solids) kg/hr 7,417 7,417 7,417 9,581 9,581
tic Acid kg/hr 232 751 751 3,426 268 3,158 5,258 5,258 268 268uric Acid kg/hr 0 0 2,104 2,104 2,104 0 2,104 1,185 154 154 0 0 3,288ural kg/hr 34 111 111 727 449 278 576 576 449 449
F kg/hr 5 17 17 114 70 43 90 90 70 70bon Dioxide kg/hr 440 440hane kg/hrgen kg/hr 0 0
ogen kg/hr 0 0
ers kg/hr 1 4 4 5 0 5 4,276 4,276 0 0ulose (IS) kg/hr 31,187 28,567 28,567 1,365 1,365n (IS) kg/hr 17,570 439 439 439 439binan I ) kg/hr 2,435 61 61 61 61er ugar olymers I ) kg/hr 2,919 73 73 73 73ulase I ) kg/hr 650 650mass I ) kg/hr 0 0
o (IS) kg/hr 1,088 1,088in (IS) kg/hr 15,002 14,251 14,251 14,252 14,252
psum (IS) kg/hr 28 2 8OH)2 (IS) kg/hrers Insoluble olids) kg/hr 6,804 4,620 4,620 4,620 4,620halpy low millions) Kcal/hr -284. 0 -369.5 - 4. 1 -373.6 -3 6. 2 - 115. 2 -809.0 -1 66. 8 -64 2. 2 -2.3 -1488.8 -1510 .9 -198.6 - 195. 0 -6.4rage Densit y g/ml 1. 3433 0.9442 1.8166 0.9489 0. 0022 0.0053 0.9973 0.0006 1.1246 1.8166 0.9585 0.9520 0.9903 0.9195 1.8166
Eq. No. Equipment Name Req. Spare Equipment Type Mat
A-201 In-line Sulfuric Acid Mixer 1 SS3C-201 Hydrolyzate Screw Conveyor 1 SCREW SS3
H-201 Beer Column Feed Economizer 2 1 S HELL-TUBE 3 04H-244 Waste Vapor Condensor 2 1 SHELL-TUBE 304M-202 Prehydrolysis/Screw Feeder/Reacto 3 VESSEL W/ PADDLEALL
P-201 Sulfuric Acid Pump 1 1 CENTRIFUGAL SS3T-201 Sulfuric Acid Tank 1 VERTICAL-VESSEL PLA
T-203 Blowdown Tank 1 VERTICAL-VESSEL SS3
I0203I.xls
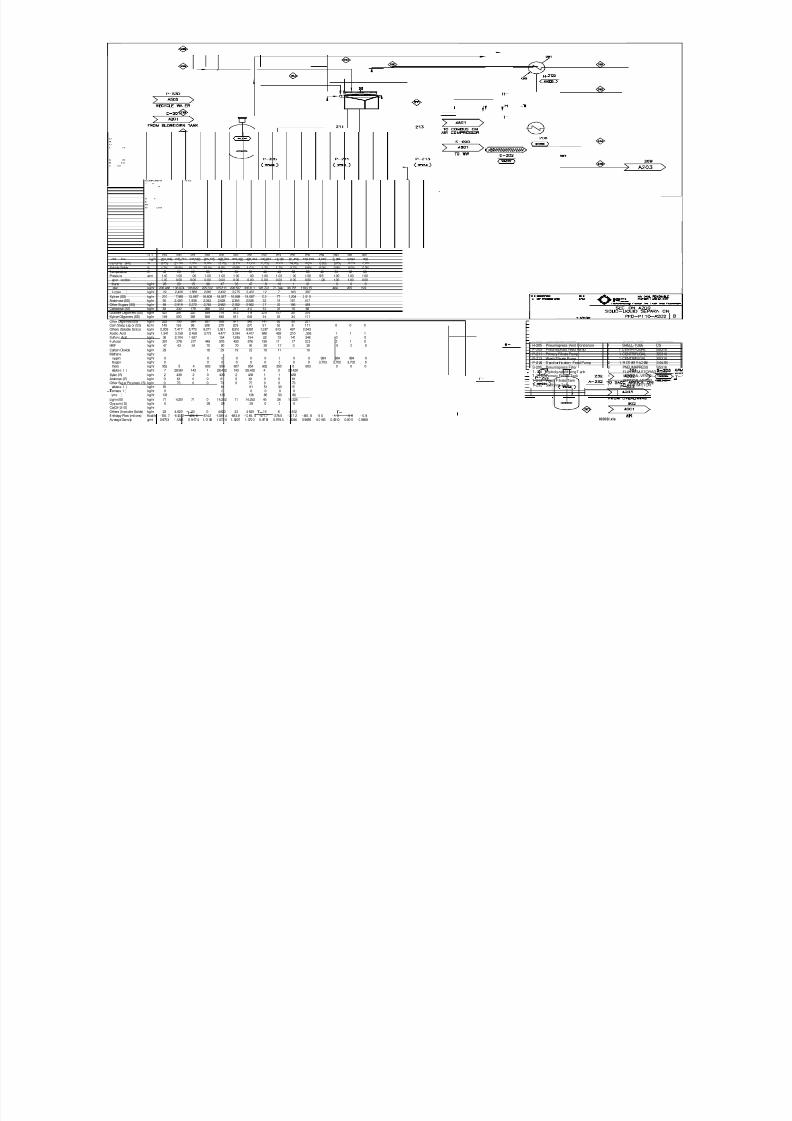
8/4/2019 NRL Report
http://slidepdf.com/reader/full/nrl-report 126/154
Heat Stream No. MM kcal/hr Work Stream No. kW
QH200 2.44 WC202QH205 0.13 WP205
WP211WP213WP224WS205
WT205WT232
U I 219 220 221 230 232 240 250 252 253 255 256 259 260 261 262 low kg/hr 207,096 225,713 138,563 265,125 428,764 268,762 428,764 130,913 76,182 87,456 130,199 4,687 5, 094 4,894 200uble olids % 0.2% 21.3% 0.2% 0.0% 11.2% 0.1% 11.2% 0.2% 0.2% 54.9% 0.0% 0.0% 0.0% 0.0% 0.0%
ble Solids % 1.7% 15.6% 19.7% 13.1% 9.0% 13.0% 9.0% 1.7% 1.7% 2.7% 5.9% 0.0% 0.0% 0.0% 0.0%perature C 46 101 101 53 51 50 51 46 46 50 55 40 50 38 38
ssure atm 1.00 1.00 1.00 1.00 1.00 1.00 1.00 1.00 1.00 1.00 1.00 9.51 1.00 1.00 1.00or raction 0.00 0.00 0.00 0.00 0.00 0.00 0.00 0.00 0.00 0.00 0.00 1.00 1.00 1.00 0.00nol kg/hr 28 20 15 36 47 36 47 18 10 1 21 0 0 0er kg/hr 200,466 136,974 106,622 225,312 335,811 226,537 335,811 126,722 73,744 36,755 119,915 404 205 199cose ) kg/hr 19 2,426 1,888 2,263 2,432 2,275 2,432 12 7 163 387
se (SS) kg/hr 210 17,969 13,987 16,806 18,087 16,898 18,087 132 77 1,204 2,910binose (SS) kg/hr 50 2,490 1,938 2,342 2,528 2,355 2,528 32 18 167 417er Sugars (SS) kg/hr 59 2,919 2,272 2,745 2,962 2,760 2,962 37 22 196 488obiose (SS) kg/hr 83 230 179 266 312 267 312 52 31 15 88cose Oligomers (SS) kg/hr 427 291 227 539 716 542 716 270 157 20 315se Oligomers (SS) kg/hr 149 500 389 558 646 561 646 94 55 34 171
er Oligomers (SS) kg/hr 223 750 584 837 969 841 969 141 82 50 257n Steep Liquor (SS) kg/hr 145 126 98 208 270 209 270 91 53 8 111 0 0 0ers (Soluble Solids) kg/hr 2,209 7,417 5,773 8,271 9,581 8,316 9,581 1,397 813 497 2,543tic Acid kg/hr 1,341 3,158 2,458 3,773 4,477 3,794 4,477 848 493 210 1,336 1 1 1uric Acid kg/hr 36 2,104 1,637 154 1,985 154 22 13 141 348 0 0ural kg/hr 301 278 217 448 576 450 576 190 111 17 233 2 1 0
kg/hr 47 43 34 70 90 70 90 30 17 3 36 0 0 0
bon Dioxide kg/hr 29 18 29 19 29 19 11 19hane kg/hrgen kg/hr 0 0 0 0 0 0 0 0 0 984 984 984 0gen kg/hr 0 0 0 0 0 0 0 0 0 3,703 3,702 3,702 0
ers kg/hr 952 5 4 603 954 607 954 602 350 0 603 0 0 0ulose I ) kg/hr 7 28,567 143 1 28,432 143 28,432 4 3 28,429
n (IS) kg/hr 2 439 2 0 439 2 439 1 1 438binan (IS) kg/hr 0 61 0 0 61 0 61 0 0 61er Sugar Polymers (IS) kg/hr 0 73 0 0 73 0 73 0 0 73ulase I ) kg/hr 81 81 81 51 30 51mass I ) kg/hr 0 0 0 0 0 0o I ) kg/hr 136 136 136 86 50 86
n (IS) kg/hr 71 14,251 71 0 14,252 71 14,252 45 26 14,225sum (IS) kg/hr 0 28 28 28 0 0 0OH)2 (IS) kg/hrers (Insoluble Solids) kg/hr 23 4,620 23 0 4,620 23 4,620 15 8 4,612alpy Flow (millions) Kcal/hr - 755. 7 -6 42. 2 -425. 6 -874.2 -1389 .4 -883.9 -1389. 4 -477.7 -278.0 - 237 .2 - 455. 8 0 .0 - 1. 3 - 0. 6 - 0. 8rage Densi ty g/ml 0.9793 1.1246 0 .9 97 4 1. 01 58 1 .072 0 1. 0207 1. 0720 0. 97 93 0 .979 3 1. 3246 0.9855 0.0106 0. 0010 0.0011 0.9808
Eq. N o. Equipment Name Req. Spare Equipment T ype MaA-205 Hydrolyzate Mix Tank Agitator 1 FIXED-PROP SSA-232 Reslurrying Tank Agitator 1 FIXED-PROP SSC-202 Hydrolysate Washed Solids Belt Co 1 BELT CSH-200 Hydrolyzate Cooler 1 SHELL-TUBE 304H-205 Pneumapress Vent Condensor 1 SHELL-TUBE CSP-205 Pneumapress Feed Pump 2 1 CENTRIFUGAL SS3P-211 Primary Filtrate Pump 1 1 CENTRIFUGAL SS3
P-213 Wash Filtrate Pump 1 1 CENTRIFUGAL SS3P -2 24 S acch ar if icat ion 2 1 ROTARY-LO BE 3 04S-205 Pneumapress Filter 3 PNEUMAPRESS SS3T- 205 Hydrolyzate M ixing T ank 1 FLAT-BTM-STORAG SS3T-211 Primary Filtrate Tank 1 VERTICAL-VESSEL SS3T-213 Wash Filtrate Tank 1 VERTICAL-VESSEL SS3T-232 Slurrying Tank 1 FLAT-BTM-STORAGSS3
I0203I.xls
Feed Pump

8/4/2019 NRL Report
http://slidepdf.com/reader/full/nrl-report 127/154
Heat Stream No. MM kcal/hr Work Stream No. kW
WC225WP209
WP222WP223
WP239
WS222WT209
WT224
MPONENT UNITS 227 228 229 230 233 239 240al Flow kg/hr 2,395 271,157 7,217 265,125 1,185 272,342 268,762
oluble Solids % 100.0% 1.7% 80.0% 0.0% 0.0% 2.1% 0.1%uble Solids % 0.0% 12.9% 2.6% 13.1% 0.0% 12.9% 13.0%
mperature C 50 53 53 20 53 50ssure atm 1.00 1.00 1.00 1.00 3.40 1.00 1.00por Fraction 0.00 0.00 0.00 0.00 0.00 0.00 0.00
anol kg/hr 36 0 36 36 36ater kg/hr 226,537 1,225 225,312 226,537 226,537cose (SS) kg/hr 2,275 12 2,263 2,275 2,275
ose (SS) kg/hr 16,898 91 16,806 16,898 16,898binose (SS) kg/hr 2,355 13 2,342 2,355 2,355
er Sugars (SS) kg/hr 2,760 15 2,745 2,760 2,760obiose (SS) kg/hr 267 1 266 267 267cose Oligomers (SS) kg/hr 542 3 539 542 542
ose Oligomers (SS) kg/hr 561 3 558 561 561er Oligomers (SS) kg/hr 841 5 837 841 841rn Steep Liquor (SS) kg/hr 209 1 208 209 209
ers (Soluble Solids) kg/hr 8,316 45 8,271 8,316 8,316etic Acid kg/hr 3,794 21 3,773 3,794 3,794
furic Acid kg/hr 1,185 1,985fural kg/hr 450 2 448 450 450F kg/hr 70 0 70 70 70
bon Dioxide kg/hr 19 0 18 19 19thane kg/hrygen kg/hr 0 0 0 0 0
ogen kg/hr 0 0 0 0 0ers kg/hr 607 3 603 607 607
ulose (IS) kg/hr 143 142 1 143 143an (IS) kg/hr 2 2 0 2 2binan (IS) kg/hr 0 0 0 0 0
er Sugar Polymers (IS) kg/hr 0 0 0 0 0ulase (IS) kg/hrmass (IS) kg/hr
mo (IS) kg/hrnin (IS) kg/hr 71 71 0 71 71
psum (IS) kg/hr 3,485 5,537 28 5,565OH)2 (IS) kg/hr 2,395 895ers (Insoluble Solids) kg/hr 23 23 0 23 23
halpy Flow (millions) Kcal/hr -7.6 -892.6 - 20.7 -87 4.2 - 2.3 -89 4.9 -8 83.9erage Density g/ml 2.3430 1.0397 2.0146 1.0158 1.8166 1.0422 1.0207
Eq. No. E quipment Name Req. S pa re E quipment Type MatA-209 Overliming Tank Agitator 1 FIXED-PROP SSA-224 Reacidification Tank Agitator 1 FIXED-PROP SSC-225 Lime Solids Feeder 1 ROTARY-VALVE A28P- 20 9 Overl imed Hydr ol yzate Pump 1 1 CENTRIFUGAL 304P-222 Filtered Hydrolyzate Pump 1 1 CENTRIFUGAL 304P-223 Lime Unloading Blower 1 CENTRIFUGAL C.SP-239 Reacidified Liquor Pump 1 1 CENTRIFUGAL SS3S-222 Hydroclone & Rotary Drum Fil te r 1 ROTARY-DRUM EPOS- 227 Li meD ust Vent Baghous e 1 FABRIC-FILTER A28T-209 Overliming Tank 1 VERTICAL-VESSEL SS3T-220 Lime Storage Bin 1 LIVE-BTM-BIN CST-224 Reacidification Tank 1 FLAT-BTM-STORAG SS3
I0203I.xls

8/4/2019 NRL Report
http://slidepdf.com/reader/full/nrl-report 128/154
Heat Stream No. MM kcal /hr Work Stream No. kW
QF301 0.21 W P301WP302
WT301WT304
WT305
MPONENT UNITS 303 304 304C 310 310Aal Flow kg/hr 43,559 41,391 2,415 28 219luble Solids % 5.0% 5.7% 0.0% 0.0% 0.0%
uble Solids % 15.7% 4.6% 0.0% 0.0% 100.0%mperature C 41 41 41 20 20ssure atm 1.00 1.00 1.00 1.00 1.00or Fraction 0.00 0.00 1.00 0.00 0.00
anol kg/hr 5 2,335 70
er kg/hr 33,919 33,881 76cose (SS) kg/hr 3,119 103ose (SS) kg/hr 1,809 156binose (SS) kg/hr 253 32
er Sugars (SS) kg/hr 296 37obiose (SS) kg/hr 36 36c ose O li gom er s (SS) k g/ hr 185 185se Oligomers (SS) kg/hr 65 65er Oligomers (SS) kg/hr 97 97
n Steep Liquor (SS) kg/hr 27 224 0 219ers (Soluble Solids ) k g/ hr 958 958tic Acid kg/hr 448 527 1uric Acid kg/hr 15 15 0ural kg/hr 58 57 1
F kg/hr 9 9 0bon Dioxide kg/hr 3 40 2,235hane kg/hrgen kg/hr 0 0 32
ogen kg/hr 0 0 0
ers kg/hr 95 292 0 28ulose (IS) kg/hr 136 136n (IS) kg/hr 44 44binan (IS) kg/hr 6 6er Sugar Polymers (IS) kg/ hr 7 7
ulase (IS) kg/hr 65 65mass (IS) kg/hr 0 0o (IS) kg/hr 14 193in (IS) kg/hr 1,425 1,425
psum (IS) kg/hr 3 3
OH)2 (IS) kg/hrers ( Inso luble Sol ids) kg/hr 462 462halpy Fl ow (mi llions ) Kca l/ hr - 14 1. 7 - 13 7. 7 - 5. 1 - 0. 1 - 0. 8rage Density g/ml 1.0754 1.0176 0.0016 1.0096 0.9983
Eq. No. Equipment Name Req. Spare Equipment Type Mat
A-301 Seed Hold Tank Agitator 1 FIXED-PROP SS3A-304 4th Seed Vessel Agitator 2 FIXED-PROP SS
A-305 5th Seed Vessel Agitator 2 FIXED-PROP SSF-301 1st Seed Fermentor 2 VERTICAL-VESSEL SS3
F-302 2nd Seed Fermentor 2 VERTICAL-VESSEL SS3F-303 3rd Seed Fermentor 2 VERTICAL-VESSEL SS3
F-304 4th Seed Fermentor 2 FLAT-BTM-STORAG SS3F-305 5th Seed Fermentor 2 FLAT-BTM-STORAG SS3
H-304 4th Seed Fermentor Coil 1 IMMERSED-COIL SSH-305 5th Seed Fermentor Coil 1 IMMERSED-COIL SS
P-301 Seed Hold Transfer Pump 1 1 R OTARY-LOBE SS3P-302 Seed Transfer Pump 2 ROTARY-LOBE SS3
T-301 Seed Hold Tank 1 FLAT-BTM-STORAG SS3
I0203I.xls

8/4/2019 NRL Report
http://slidepdf.com/reader/full/nrl-report 129/154
Heat Stream No. MM kcal/hr Work Stream No. kW
QF300A 0.09 W P300QF300 2.40 WP306
QH301 -4.89 W P310QH302 8.49 WT300
WT306WT310
U I 232 301 301 302 303 304 306 308 311 311 312 502 551 590 591al l ow kg/hr 428,764 428,764 435,588 392,029 43,559 41,391 412,222 22,420 136 1,087 6,824 449,353 37,130 9,490 9,490luble Solids % 11.2% 11.2% 5.0% 5.0% 5.0% 5.7% 5.5% 0.0% 0.0% 0.0% 8.3% 5.0% 0.0% 0.0% 0.0%
uble Solids % 9.0% 9.0% 15.7% 15.7% 15.7% 4.6% 4.0% 0.0% 0.0% 100.0% 0.0% 3.6% 0.0% 0.0% 0.0%mperature C 51 65 65 41 41 41 41 41 20 20 20 41 39 164 148ssure atm 1.00 1.00 1.00 1.00 1.00 1.00 1.00 1.00 1.00 1.00 1.00 0.90 0.90 4.42 4.42or Fraction 0.00 0.00 0.00 0.00 0.00 0.00 0.00 1.00 0.00 0.00 0.00 0.00 0.00 1.00 0.00
anol kg/hr 47 47 47 43 5 2,335 24,032 668 24,825 793er kg/hr 335,811 335,811 339,188 305,269 33,919 33,881 338,544 710 6,255 374,828 36,284 9,490 9,490cose (SS) kg/hr 2,432 2,432 31,193 28,074 3,119 103 82 82se (SS) kg/hr 18,087 18,087 18,087 16,279 1,809 156 909 909
binose (SS) kg/hr 2,528 2,528 2,528 2,275 253 32 217 217er Sugars (SS) kg/hr 2,962 2,962 2,962 2,666 296 37 254 254obiose (SS) kg/hr 312 312 360 324 36 36 360 360cose Oligomers (SS) kg/hr 716 716 1,853 1,668 185 185 1,853 1,853se ligomers ) kg/hr 646 646 646 581 65 65 646 646er ligomers ) kg/hr 969 969 969 872 97 97 969 969n teep Liquor ) kg/hr 270 270 270 243 27 224 1,456 3 1,087 1,459 4ers oluble olids) kg/hr 9,581 9,581 9,581 8,623 958 958 9,581 9,581tic cid kg/hr 4,477 4,477 4,477 4,029 448 527 5,251 6 5,258 7uric cid kg/hr 154 154 154 139 15 15 154 0 154 0ural kg/hr 576 576 576 518 58 57 568 7 576 8
kg/hr 90 90 90 81 9 9 89 1 90 1bon ioxide kg/hr 29 29 29 26 3 40 406 20,799 440 34hane kg/hrgen kg/hr 0 0 0 0 0 0 0 226 0 0ogen kg/hr 0 0 0 0 0 0 0 0 0 0ers kg/hr 954 954 954 859 95 292 4,276 0 136 4,276 0ulose (IS) kg/hr 28,432 28,432 1,365 1,228 136 136 1,365 1,365an (IS) kg/hr 439 439 439 395 44 44 439 439binan (IS) kg/hr 61 61 61 55 6 6 61 61er Sugar Polymers (IS) kg/hr 73 73 73 66 7 7 73 73ulase (IS) kg/hr 81 81 650 585 65 65 650 568 650mass (IS) kg/hr 0 0 0 0 0 0 0 0mo (IS) kg/hr 136 136 136 122 14 193 1,088 1,088
n (IS) kg/hr 14,252 14,252 14,252 12,827 1,425 1,425 14,252 14,252sum (IS) kg/hr 28 28 28 25 3 3 28 28OH)2 (IS) kg/hrers (Insoluble Solids) kg/hr 4,620 4,620 4,620 4,158 462 462 4,620 4,620hal py F lo w ( mi ll io ns) K ca l/ hr - 13 89 .4 - 13 84 .5 - 14 08 .7 - 127 5. 5 - 141 .7 - 13 7. 7 - 13 72 .7 - 47 .5 - 0. 4 - 4.1 - 24 .2 - 15 10 .9 - 13 8. 2 - 29 .8 - 34 .7rage D ensity g/ml 1.072 1.059 1.052 1.075 1.075 1.018 1.015 0.002 1.010 0.998 1.040 0.952 0.975 0.002 0.865
Eq. No. Equipment Name R eq. Spare Equi pment Ty pe MatA- 300 Ethanol Fermentor Agitator 10 FIXED-PROP SS3A-306 Beer Surge Tank Agitator 2 FIXED-PROP SS3A -3 10 Sac char ifi cat ion T ank Agi ta tor 10 FIXED-PROP SS3F-300 Ethanol Fermentor 5 FLAT-BTM-STORAG SS3H-300 Fermentation Cooler 5 1 PLATE-FRAME SS3H-301 Hydrolyzate Heater 1 1 PLATE-FRAME SSH-302 Saccharified Slurry Cooler 3 PLATE-FRAME SS3H-310 Fermentation Cooler 5 1 PLATE-FRAME SS3P-300 Fermentat ion Recirc/Transfer Pump 5 1 CENTRIFUGAL SS3P-306 Beer Transfer Pump 1 1 CENTRIFUGAL SS3
P-310 Saccharif icat ion Recirc/Transfer Pu 5 1 CENTRIFUGAL SS3T-306 Beer Storage Tank 1 FLAT-BTM-STORAG SS3
T-310 Saccharification Tank 5 FLAT-BTM-STORAG SS3
I0203I.xls

8/4/2019 NRL Report
http://slidepdf.com/reader/full/nrl-report 130/154
I0203I.xls
Eq. No.Equipment Name Req.Spa reEquipment Type MatD-501 Beer Column 1 DISTILLATION SS3
H-501 Beer Column Reboiler 1 1 SHELL-TUBE SS3H-504 Beer Column Condenser 1 SHELL-TUBE SS3H-512 Beer Column Feed Interchanger 1 1 PLATE-FRAME SS
P-501 Beer Column Bottoms Pump 1 1 CENTRIFUGAL SSP-503 Beer Column Reflux Pump 1 1 CENTRIFUGAL SST-503 Beer Column Relfux Drum 1 HORIZONTAL-VESS LSS3
U I 501 506 508 510 518 518 594 595al low kg/hr 449,353 449,353 491 62,329 386,533 386,533 65,505 65,505oluble olids % 5.0% 5.0% 0.0% 0.0% 5.8% 5.8% 0.0% 0.0%uble olids % 3.6% 3.6% 0.0% 0.2% 4.2% 4.2% 0.0% 0.0%mperature 95 100 60 113 123 117 164 148ssure atm 4.00 4.76 1.86 1.91 2.10 2.10 4.42 4.42
por Fraction 0.00 0.00 1.00 1.00 0.00 0.00 1.00 0.00anol kg/hr 24,825 24,825 60 24,583 182 182er kg/hr 374,828 374,828 20 36,990 337,819 337,819 65,505 65,505cose (SS) kg/hr 82 82 0 0 82 82ose (SS) kg/hr 909 909 0 0 909 909binose (SS) kg/hr 217 217 0 0 217 217er Sugars (SS) kg/hr 254 254 0 0 254 254obiose (SS) kg/hr 360 360 0 0 360 360cose Oligomers (SS) kg/hr 1,853 1,853 0 0 1,853 1,853ose Oligomers (SS) kg/hr 646 646 0 0 646 646er Oligomers (SS) kg/hr 969 969 0 0 969 969n Steep Liquor (SS) kg/hr 1,459 1,459 0 145 1,314 1,314
ers (Soluble Solids) kg/hr 9,581 9,581 0 0 9,581 9,581tic Acid kg/hr 5,258 5,258 0 259 4,998 4,998
furic Acid kg/hr 154 154 0 0 154 154fural kg/hr 576 576 0 278 298 298F kg/hr 90 90 0 43 46 46bon ioxide kg/hr 440 440 411 29hane kg/hr
ygen kg/hr 0 0 0 0 0 0ogen kg/hr 0 0 0 0ers kg/hr 4,276 4,276 0 1 4,275 4,275ulose I ) kg/hr 1,365 1,365 1,365 1,365
an I ) kg/hr 439 439 439 439
binan (IS) kg/hr 61 61 61 61er Sugar Polymers (IS) kg/hr 73 73 73 73ulase (IS) kg/hr 650 650 650 650mass (IS) kg/hr 0 0 0 0
mo (IS) kg/hr 1,088 1,088 1,088 1,088nin I ) kg/hr 14,252 14,252 14,252 14,252psum I ) kg/hr 28 28 28 28
H)2 I ) kg/hrers Insoluble olids) kg/hr 4,620 4,620 4,620 4,620h al py lo w m il li on s) K ca l/ hr - 14 88 .8 - 14 86 .6 - 1. 0 - 14 7. 3 - 13 04 .9 - 13 07 .1 - 20 5. 9 - 23 9. 7rage Densit y g/ml 0.9585 0.9534 0.0029 0.0014 0.9513 0.9570 0.0022 0.8653
Heat Stream No. MM kcal/hr Work Stream No. kWQCD501 0.37 WP501QH512 -2.18 WP503QRD501 -33.76

8/4/2019 NRL Report
http://slidepdf.com/reader/full/nrl-report 131/154
I0203I.xls
Heat Stream No. MM kcal/hr Work Stream No. kW
QRD502 -4.21 WP504WP505
WP515
MPONENT UNITS 304C 308 508 510 511 516 521 523 524 550 551 592 593al Flow kg/hr 2,415 22,420 491 62,329 33,232 37,643 8,546 25,325 35,912 24,107 37,130 8,164 8,164
oluble Solids % 0.0% 0.0% 0.0% 0.0% 0.0% 0.0% 0.0% 0.0% 0.0% 0.0% 0.0% 0.0% 0.0%uble Solids % 0.0% 0.0% 0.0% 0.2% 0.0% 0.4% 0.0% 0.0% 0.0% 0.0% 0.0% 0.0% 0.0%mperature C 41 41 60 113 92 121 70 41 26 29 39 164 148
ssure atm 1.00 1.00 1.86 1.91 1.70 4.29 1.53 1.00 1.00 0.90 0.90 4.42 4.42por Fraction 1.00 1.00 1.00 1.00 1.00 0.00 0.00 1.00 0.00 1.00 0.00 1.00 0.00anol kg/hr 70 668 60 24,583 30,740 19 6,176 797 4 793
ter kg/hr 76 710 20 36,990 2,492 36,868 2,370 806 35,912 434 36,284 8,164 8,164cose (SS) kg/hr 0 0 0
ose (SS) kg/hr 0 0 0 0binose (SS) kg/hr 0 0 0 0
er Sugars (SS) kg/hr 0 0 0obiose (SS) kg/hr 0 0 0cose Oligomers (SS) kg/hr 0 0 0ose Oligomers (SS) kg/hr 0 0 0 0
er Oligomers (SS) kg/hr 0 0 0n Steep Liquor (SS) kg/hr 0 3 0 145 145 4 0 4ers (Soluble Solids) kg/hr 0 0 0
etic Acid kg/hr 1 6 0 259 259 7 0 7furic Acid kg/hr 0 0 0 0 0 0 0 0fural kg/hr 1 7 0 278 278 8 0 8
F kg/hr 0 1 0 43 43 1 0 1bon Dioxide kg/hr 2,235 20,799 411 29 29 23,444 23,410 34hane kg/hr
ygen kg/hr 32 226 0 0 0 258 258 0ogen kg/hr 0 0 0 0 0 0 0 0
ers kg/hr 0 0 0 1 1 0 0 0ulose (IS) kg/hr
an (IS) kg/hr
binan (IS) kg/hrer Sugar Polymers (IS) kg/hrulase (IS) kg/hr
mass (IS) kg/hrmo (IS) kg/hrnin (IS) kg/hr
psum (IS) kg/hrOH)2 (IS) kg/hr
hers (Insoluble Solids) kg/hr
halpy Flow (millions) Kcal/hr -5.1 -47.5 -1.0 -147.3 -44.6 -137.3 -17.5 -53.6 -136.0 -51.4 -138.2 -25.7 -29.9erage Density g/ml 0.0016 0.0016 0.0029 0.0014 0.0023 0.8964 0.7943 0.0016 0.9925 0.0016 0.9750 0.0022 0.8653
Eq. No. Equipment Name R eq .Sp are Equipment Type Mat
D-502 Rectification Column 1 DISTILLATION SSH-502 Rectification Column Reboiler 1 SHELL-TUBE SS3
H-505 S tar t-u p Re ct. Co lumn Co nd ense r 1 SHELL-TUBE SS3P -5 04 R ec ti fi ca ti on Co lu mn Bo tt om s P um p 1 1 CENT RIFUGAL S SP -5 05 R ec ti fi ca ti on C ol um n R ef lu x P um p 1 1 CENT RIFUGAL S S
P-515 Scrubber Bottoms Pump 1 CENTRIFUGAL SST -5 05 R ec ti fi ca ti on C o lu mn R e fl ux D ru m 1 HORI ZONT AL -V ES S LSS3
T-512 Vent Scrubber 1 ABSORBER SS3

8/4/2019 NRL Report
http://slidepdf.com/reader/full/nrl-report 132/154
I0203I.xls
Eq. No. Equipment Name Req .Spa reEquipment Type MatM-503 Molecular Sieve (9 pieces) 1 PACKAGE SS
U I 511 511 515 515 517 519 521 522 596 597al low kg/hr 33,232 33,232 24,686 8,546 8,546 24,686 8,546 8,546 621 621luble olids % 0.0% 0.0% 0.0% 0.0% 0.0% 0.0% 0.0% 0.0% 0.0% 0.0%
ble Solids % 0.0% 0.0% 0.0% 0.0% 0.0% 0.0% 0.0% 0.0% 0.0% 0.0%mperature C 92 116 38 116 35 92 70 70 164 148ssure atm 1.70 1.70 1.00 1.70 0.14 1.44 1.53 1.53 4.42 4.42or raction 1.00 1.00 0.00 1.00 0.00 1.00 0.00 0.00 1.00 0.00
anol kg/hr 30,740 30,740 24,564 6,176 6,176 24,564 6,176 6,176er kg/hr 2,492 2,492 122 2,370 2,370 122 2,370 2,370 621 621cose ) kg/hr
se (SS) kg/hrbinose (SS) kg/hrer Suga rs (SS) k g/hrobiose (SS) kg/hrcose Oligomers (SS) kg/hrse Oligomers (SS) kg/hr
er Oligomers (SS) kg/hrn Steep Liquor (SS) kg/hrers (Soluble Solids) kg/hrtic cid kg/hruric cid kg/hrural kg/hr
kg/hr
bon Dioxide kg/hrhane kg/hrgen kg/hrogen kg/hrers kg/hrulose I ) kg/hr
n (IS) kg/hrbinan (IS) kg/hrer Sugar Polymers (IS) kg/hrulase I ) kg/hrmass (IS) kg/hro (IS) kg/hr
in (IS) kg/hrsum (IS) kg/hrOH)2 (IS) kg/hrers (Insoluble Solids) kg/hrhalpy Flow (millions) Kcal/hr -44.6 -44.3 -35.6 -14.8 -17.8 -29.7 -17.5 -17.5 -2.0 -2.3rage Density g/ml 0. 0023 0.0022 0. 7753 0.0017 0.8308 0.0022 0.7943 0.7943 0.0022 0.8653
Heat Stream No. MM kcal/hr Work Stream No. kWQH503 2.96 WM503QH506 -0.32QH507 0.24QH509 5.86

8/4/2019 NRL Report
http://slidepdf.com/reader/full/nrl-report 133/154
I0203I.xls
MPONENT UNITS 102 211 251 518A 525 526 527 528 529 530 531 532 533 534A 535 580 860a Flo w kg /h r 43,017 99,344 7 1, 46 6 3 86 ,53 3 303,646 82 ,8 87 8 2, 88 7 1 16 ,86 8 7 7, 75 2 77 ,7 52 39,922 76,946 76 ,94 6 2 37 ,58 5 23 ,75 9 194,620 4,858uble Solids % 0.0% 0.0% 0.0% 5.8% 7.4% 0.0% 0.0% 0.8% 0.0% 0.0% 2.4% 0.0% 0.0% 0.0% 0.0% 0.5% 0.0%ble Solids % 0.1% 0.1% 0.1% .2% 5.2% 0.4% 0.4% 8.8% 0.0% 0.0% 25.8% 0.0% 0.0% 0.1% 0.1% 5.3% 0.0%perature C 74 74 74 117 87 87 87 71 71 71 64 64 64 74 74 0 115
ssure atm 3.00 3.00 3.00 2.10 0.60 0.60 0.61 0.31 0.31 0.32 0.21 0.21 0.23 2.00 1.00 3.20 1.68or Fraction 0.00 0.00 0.00 0.00 0.00 1.00 0.00 0.00 1.00 0.00 0.00 1.00 0.00 0.00 0.00 0.00 0.97nol kg/hr 31 71 51 182 39 143 143 3 24 24 0 2 2 170 17 27er kg/hr 2,546 98,256 70,684 337,819 255,932 81,887 81,887 99,813 77,243 77,243 23,957 75,856 75,856 234,985 23,499 177,056 ,858cose (SS) kg/hr 82 82 57 57 57
se (SS) kg/hr 0 0 0 909 909 0 0 629 0 0 629 0 0 0 0 629inose (SS) kg/hr 0 0 0 217 217 0 0 150 150 0 0 150
er Sugars (SS) kg/hr 254 254 176 176 176obiose (SS) kg/hr 360 360 249 249 249ose Oligomers (SS) kg/hr 1,853 1,853 1,282 1,282 1,282se Oligomers (SS) kg/hr 0 0 0 646 646 0 0 447 0 0 447 0 0 0 0 447
er Oligomers (SS) kg/hr 969 969 670 670 670 Steep Liquor (SS) kg/hr 58 133 96 1,314 996 319 319 319 32
ers (Soluble Solids) kg/hr 9,581 9,581 6,628 6,628 6,628ic Acid kg/hr 325 751 540 ,998 ,689 309 309 2,827 18 18 1,757 1,070 1,070 1,796 180 3,244uric Acid kg/hr 0 0 0 154 154 0 0 107 0 0 107 0 0 0 0 107ural kg/hr 48 111 80 298 100 197 197 13 56 56 2 12 12 265 27 69
F kg/hr 7 17 12 6 16 31 31 2 9 9 0 2 2 1 11on Dioxide kg/hr
hane kg/hrgen kg/hr 0gen kg/hr
ers kg/hr 2 3 ,275 ,273 2 2 2,852 2 2 2,847 5 5 9 1 2,854ulose (IS) kg/hr 1,365 1,365 20 20 20n (IS) kg/hr 39 39 7 7 7inan (IS) kg/hr 61 61 1 1 1
er Sugar Polymers (IS) kg/hr 73 73 1 1 1ulase (IS) kg/hr 650 650 244 244 244mass (IS) kg/hr 0 0 0 0 0o (IS) kg/hr 1,088 1,088 408 408 408n (IS) kg/hr 14,252 14,252 214 214 214sum (IS) kg/hr 28 28 0 0 0OH)2 (IS) kg/hrers (Insoluble Solids) kg/hr ,620 ,620 69 69 69ha lp y F lo w ( mil li on s) Kcal/hr - 16 0. 0 - 36 9. 5 - 26 5. 8 - 13 07 .1 - 10 18 .2 -262. 3 - 30 7.3 - 374 .4 - 24 7.0 - 290 .0 - 88 .4 - 24 3. 9 - 28 6. 5 - 88 3. 7 - 88 .4 -665.5 - 15 .5age Density g/ml 0.944 0.944 0.944 0.957 1.003 0.000 0.932 0.983 0.000 0.948 1.085 0.000 0.954 0.944 0.944 0.999 0.001
8614,8580.0%0.0%1151.680.00
,858
-18.00.947
Stream No. MM kcal/hr Stream No. kWQCD502 24.58 WP511QE501A2 2.49 WP512QE502B 44.05 WP513QE503B 42.11 WP514QH517 42.58
Eq. No. Equipment Name Req. Spare Equipment Type Mat
E-501 1st Effect Evaporation 2 SHELL-TUBE SS3E-502 2nd Effect Evaporation 1 SHELL-TUBE SS3
E-503 3rd Effect Evaporation 2 SHELL-TUBE SS3H-517 Evaporator Condenser 1 1 SHELL-TUBE SS3
P-511 1st Effect Pump 2 1 CENTRIFUGAL SSP-512 2nd Effect Pump 1 1 CENTRIFUGAL SS
P-513 3rd Effect Pump 2 1 CENTRIFUGAL SSP -5 14 E vap or ato r Co nd en sa te Pu mp 1 1 C ENTRIFUGAL SS3
T -5 14 E va po ra to r C on de ns at e D ru m 1 H ORIZ ONTA L-V ESS ELSS3
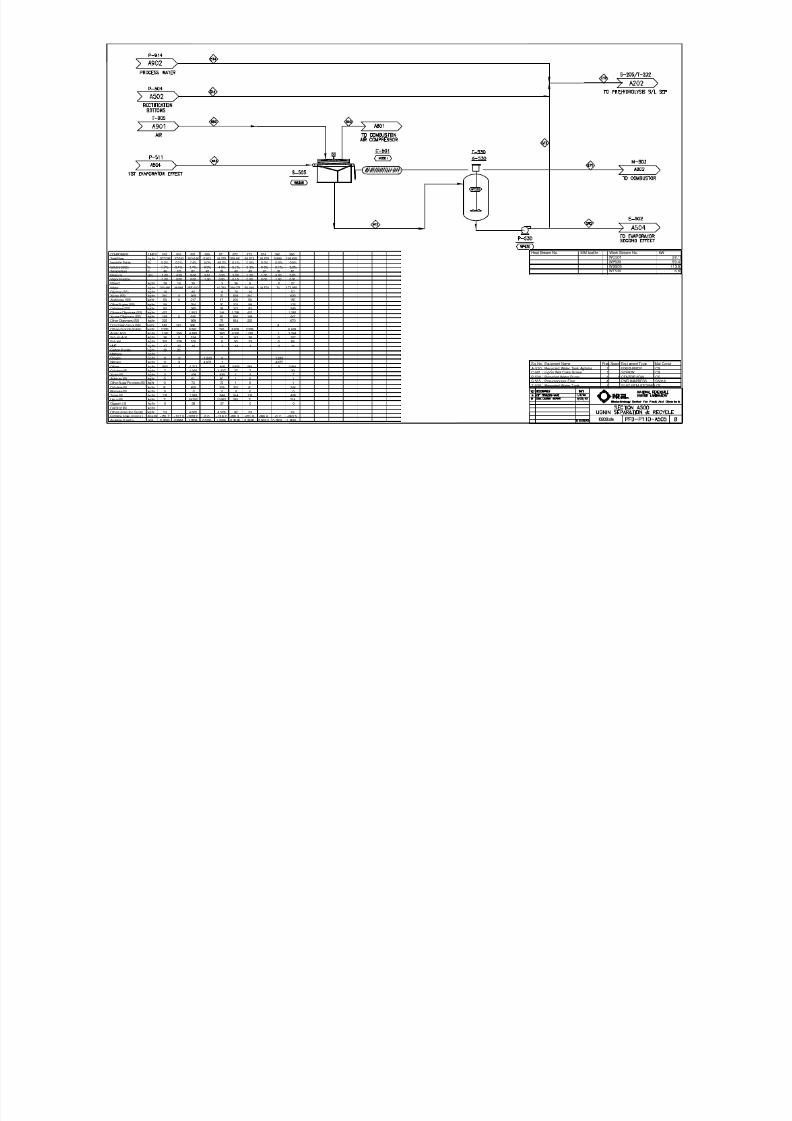
8/4/2019 NRL Report
http://slidepdf.com/reader/full/nrl-report 134/154
I0203I.xls
MPONENT UNITS 219 516 525 559 571 572 573 574 560 580al Flow kg/hr 207,096 37,643 303,646 5,921 44,075 259,493 64,873 104,579 5,999 194,620luble Solids % 0.2% 0.0% 7.4% 0.0% 48.3% 0.5% 0.5% 0.0% 0.0% 0.5%
uble Solids % 1.7% 0.4% 5.2% 0.0% 4.9% 5.3% 5.3% 0.0% 0.1% 5.3%mperature C 46 121 87 40 38 40 40 20 38 40ssure atm 1.00 4.29 0.60 9.51 3.20 3.20 3.20 1.00 3.20 3.20or Fraction 0.00 0.00 0.00 1.00 0.00 0.00 0.00 0.00 1.00 0.00
anol kg/hr 28 19 39 3 36 9 0 27
er kg/hr 200,466 36,868 255,932 19,783 236,075 59,019 104,579 74 177,056cose (SS) kg/hr 19 82 6 76 19 57se (SS) kg/hr 210 0 909 70 838 210 629binose (SS) kg/hr 50 0 217 17 200 50 150
er Sugars (SS) kg/hr 59 254 20 235 59 176obiose (SS) kg/hr 83 360 28 332 83 249cose Oligomers (SS) kg/hr 427 1,853 144 1,709 427 1,282ose Oligomers (SS) kg/hr 149 0 646 50 596 149 447er Oligomers (SS) kg/hr 223 969 75 894 223 670
n Steep Liquor (SS) kg/hr 145 145 996 992 4ers (Soluble Solids) kg/hr 2,209 9,581 743 8,838 2,209 6,628tic Acid kg/hr 1,341 259 4,689 363 4,326 1,081 1 3,244uric Acid kg/hr 36 0 154 12 142 36 0 107ural kg/hr 301 278 100 8 93 23 0 69
F kg/hr 47 43 16 1 14 4 0 11bon Dioxide kg/hr 29 29hane kg/hrgen kg/hr 0 0 1,243 0 1,243
ogen kg/hr 0 0 4,678 1 4,677
ers kg/hr 952 1 4,273 468 3,805 951 0 2,854ulose (IS) kg/hr 7 1,365 1,337 27 7 20an (IS) kg/hr 2 439 430 9 2 7binan (IS) kg/hr 0 61 60 1 0 1er Sugar Polymers (IS) kg/hr 0 73 72 1 0 1
ulase (IS) kg/hr 81 650 325 325 81 244mass (IS) kg/hr 0 0 0 0 0 0mo (IS) kg/hr 136 1,088 544 544 136 408
n (IS) kg/hr 71 14,252 13,967 285 71 214sum (IS) kg/hr 0 28 27 1 0 0
OH)2 (IS) kg/hrers (Insoluble Solids) kg/hr 23 4,620 4,528 92 23 69halpy Fl ow (mi llions ) Kca l/ hr - 755. 7 - 13 7. 3 -1018.2 0 .0 - 13 6. 2 -887.3 -221. 8 -396. 6 -0. 2 - 66 5. 5erage D ensit y g/ml 0. 9793 0.8964 1. 0034 0.0106 1.3326 0. 99 90 0. 99 90 0 .998 3 0. 0036 0. 9990
Eq. No. Equipment Name R eq. Spare Equi pment Ty pe Mat
A-530 Recycled Water Tank Agitator 1 FIXED-PROP CSC-501 Lignin Wet Cake Screw 1 SCREW CS
P-530 Recycled Water Pump 1 1 CENTRIFUGAL CSS-505 Pneumapress Filter 4 PNEUMAPRESS SS3T-530 Recycled Water Tank 1 FLAT-BTM-STORAG CS
Heat Stream No. MM kcal/hr Work Stream No. kWWC501WP530WS505WT530

8/4/2019 NRL Report
http://slidepdf.com/reader/full/nrl-report 135/154
I0203I.xls
MPONENT UNITS 262 520 535 612 613 615 618 630 821 944al Flow kg/hr 200 53,152 23,759 97,264 97,264 625 96,697 58 5,715 14,439oluble Solids % 0.0% 0.0% 0.0% 0.0% 0.0% 0.0% 0.0% 0.0% 0.0% 0.0%
uble Solids % 0.0% 0.1% 0.1% 0.1% 0.1% 0.0% 0.1% 0.0% 0.0% 0.0%mperature C 38 30 74 59 35 35 35 20 309 28ssure atm 1.00 1.00 1.00 2.00 2.00 1.00 1.00 1.00 96.26 1.00
por Fraction 0.00 0.00 0.00 0.00 0.00 1.00 0.00 0.00 0.00 0.00anol kg/hr 0 73 17 90 90 0 6
ter kg/hr 199 52,244 23,499 96,094 96,094 28 96,414 5,715 14,439cose (SS) kg/hrose (SS) kg/hr 0 0 0 0 0
abinose (SS) kg/hr 0 0 0 0 0
her Su gar s (SS) k g/ hrlobiose (SS) kg/hr
ucose Oligomers (SS) kg/hrose Oligomers (SS) kg/hr 0 0 0 0
her Oligomers (SS) kg/h r
rn Steep Liquor (SS) kg/hr 0 48 32 80 80 0 80hers (Soluble Solids) kg/hretic Acid kg/hr 1 268 180 449 449 0 31furic Acid kg/hr 0 0 0 0 0fural kg/hr 0 449 27 476 476 0 33
F kg/hr 0 70 4 74 74 0 5rbon Dioxide kg/hr 273 25thane kg/hr 324 1ygen kg/hr 0 0 0 0 0rogen kg/hr 0 0 0 0 0
hers kg/hr 0 0 1 1 1 0 58 58lulose (IS) kg/hran (IS) kg/hrbinan (IS) kg/hr
her Sugar Polymers (IS) kg/hr
lulase (IS) kg/hrmass (IS) kg/hr 43mo (IS) kg/hrnin (IS) kg/hrpsum (IS) kg/hr
OH)2 (IS) kg/hrhers (Insoluble Solids) kg/hrhalpy Flow (millions) Kcal/hr - 0.8 -198.6 -88. 4 -362.3 -364.6 -1.0 -365.0 -0.2 -19.9 -54.6
erage Density g/ml 0.9808 0.9903 0.9442 0.9604 0. 9846 0.0009 0.9841 0.9983 0. 6925 0.9906
Heat Stream No. MM kcal/hr Work Stream No. kWQH602 2.26 WM604
WP602WP606
WS600WT602WT606
Eq. N o. Equipment Name Req. Spar e E qui pment T ype MatA-602 Equalization Basin Agitator 1 FIXED-PROP SSA-606 Anaerobic Agitator 1 FIXED-PROP SSH-602 A naer ob ic Di ges to r F eed Cool er 1 SHELL-TUBE SS3M-604 Nutrient Feed System 1 PACKAGE CSM-606 Biogas Emergency Flare 1 MISCELLANEOUS SSP- 60 2 Anaer obi c React or F eed Pump 1 1 C ENTRIFUGAL CSP-606 Aerobic Digestor Feed Pump 1 1 C ENTRIFUGAL CSS-600 Bar Screen 1 SCREEN CST-602 Equalization Basin 1 FLAT-BTM-STORAG CONT-606 Anaerobic Digestor 1 FLAT-BTM-STORAG EPO

8/4/2019 NRL Report
http://slidepdf.com/reader/full/nrl-report 136/154
I0203I.xls
U I 618 620 621 623 624 625 626 627 631tal low kg/hr 96,697 40,204 97,095 218 95,805 1,290 39,531 1,072 0oluble olids % 0.0% 0.0% 0.1% 30.0% 0.0% 5.1% 0.0% 0.0% 0.0%uble olids % 0.1% 0.0% 0.1% 0.1% 0.1% 0.1% 0.0% 0.1% 0.0%mperature 35 21 21 21 21 21 20 21 20
essure atm 1.00 1.00 1.00 1.00 1.00 1.00 1.00 1.00 1.00por Fraction 0.00 1.00 0.00 0.00 0.00 0.00 1.00 0.00 0.00
hanol kg/hr 6 0 1 0 1 0 0ater kg/hr 96,414 627 96,881 152 95,658 1,222 1,070ucose ) kg/hrose ) kg/hr 0 0 0 0 0 0
abinose ) kg/hr 0her ugars ) kg/hrllobiose ) kg/hr
ucose Oligomers (SS) kg/hrose Oligomers (SS) kg/hr
her Oligomers (SS) kg/hrrn Steep Liquor (SS) kg/hr 80 1 80 0 79 1 1hers (Soluble Solids) kg/hretic Acid kg/hr 31 0 3 0 3 0 0furic Acid kg/hrrfural kg/hr 33 0 3 0 3 0 0
MF kg/hr 5 0 0 0 0 0 0
rbon Dioxide kg/hr 25 112 0 0 0 0 0thane kg/hr 1 1 0 0 0 0 0ygen kg/hr 0 8,235 1 0 1 0 8,302 0rogen kg/hr 0 31,228 1 0 1 0 31,230 0hers kg/hr 58 0 58 0 58 1 1 0lulose I ) kg/hran I ) kg/hr
abinan I ) kg/hrher ugar olymers I ) kg/hr
lulase (IS) kg/hrmass (IS) kg/hr 43 65 65 65mo (IS) kg/hrnin (IS) kg/hrpsum (IS) kg/hr
H)2 I ) kg/hrhers Insoluble olids) kg/hrthalpy l ow millions) Kcal/hr -365.0 -2.3 -367.9 -0.6 -363.2 -4.7 0.0 -4.1 0.0erage ensity g/ml 0.9841 0.0012 0.9976 1.1481 0.9973 1.0228 0.0012 0.9973 0.9983
Eq. No. Equipment Name Req. Spare Equi pment Type MatA- 608 Aerobic Lagoon Agitator 16 SURFACE-AERATO C SC-614 Aerobic Sludge Screw 1 SCREW CS
M-612 Filter Precoat System 1 MISCELLANEOUS CSP-608 Aerobic Sludge Recycle Pump 1 SLURRY SS3P-610 Aerobic Sludge Pump 1 SLURRY SS3P- 611 Aer obi c Di gesti on Outlet Pump 1 1 C ENTRIFUGAL CSP-614 Sludge Filtrate Recycle Pump 1 1 C ENTRIFUGAL CSP-616 Treated Water Pump 1 1 CENTRIFUGAL CSS-614 Belt Filter Press 1 FILTER-PRESS 304ST-608 Aerobic Digestor 1 LINED-PIT POLT-610 Clarifier 1 CLARIFIER CON
Heat Stream No. MM kcal/hr Work Stream No. kW
WC614WM612WP608WP610WP611WP614WP616WS614WT608WT610

8/4/2019 NRL Report
http://slidepdf.com/reader/full/nrl-report 137/154
OMPONENT UNITS 3 10 3 1 0 A 311 3 11 A 312 51 5 70 1 7 0 3 710 713 7 23 7 35 7 5 0 755ta l Flow k g / h r 28 219 136 1 , 08 7 6 , 82 4 24 ,686 1 ,019 25, 705 3 , 2 88 9 , 0 80 20 1, 306 6 ,824 16 3
so luble Sol ids % 0 . 0% 0 . 0 % 0.0% 0.0% 8.3% 0. 0 % 0 . 0 % 0.0% 0. 0% 0. 0% 0 . 0% 0 . 0 % 8.3% 0.0%
lub le S ol ids % 0 . 0% 100. 0% 0.0% 100 .0% 0.0% 0. 0 % 0 . 0 % 0.0% 0. 0% 0. 0% 0 . 0% 100. 0% 0.0% 0.0%mpera t u re C 20 20 20 2 0 2 0 38 20 20 2 0 2 0 20 20 20 2 0es sure atm 1. 00 1 .00 1 .00 1 . 0 0 1.00 1 .00 1. 00 1 . 00 1 . 0 0 1.00 1 . 00 1 .00 1 .00 1 . 0 0por rac t ion 0 . 00 0 . 00 0 .00 0 . 0 0 0.00 0 .00 0. 00 0 . 00 0 . 0 0 0.00 1 . 00 0 . 00 0 .00 0 . 0 0h ano l k g / h r 24 ,564 24, 564a t e r k g / h r 6 , 25 5 122 122 9 , 0 80 6 ,255
u c os e (S S) k g / h rl os e ( SS ) k g / h ra b i n os e ) k g / h r
he r uga rs ) k g / h rl lob ios e ) k g / h r
uc o se O l ig om er s ( SS ) k g / hryl os e Ol ig om er s (S S) k g /h rh er O li go me rs ( SS ) k g /h rrn t eep L iquo r ) k g / h r 219 1 , 08 7 1, 306h er s o lu bl e o l id s ) k g / hre t i c c i d k g / h r
l f ur i c Ac id k g / h r 3 , 2 88r f u ra l k g / h r
M F k g / h ra rbon Diox ide k g / h re thane k g / h r
x y g e n k g / h rt rogen k g / h rhers k g / h r 28 136 1 ,019 1 , 019 20 16 3llulose I ) k g / h rlan I ) k g / h rab inan I ) k g / h r
h e r S u g ar P o l y m e rs ( I S ) k g / h rl lulase (IS) k g / h r 5 6 8 5 68
omass I ) k g / h rmo I ) k g / h r
gnin I ) k g / h r
y psu m ( I S ) k g / h ra (OH)2 ( IS ) k g / h r
h er s ( I ns o l ub l e So l i ds ) k g / h rt ha lpy low mi l l i ons) Kc a l / h r - 0 . 1 -0.8 -0 .4 -4.1 -24 . 2 - 35 . 6 -0.5 -36.4 -6.4 - 34 . 4 0.0 -5.0 -24.2 -0.5e rag e D ens i t y g / ml 1 . 0 0 9 6 0 .9983 1. 0096 0.9983 1 . 0 4 0 3 0. 7753 0.6876 0 .7872 1 .8166 0 . 9 9 8 3 0 .0018 0 .9983 1. 0403 1.0096 I0203I.xls
Eq. N o. Equipment Name Req. Spar e E qui pment T ype MatA-701 Denaturant In-line Mixer 1 STATIC SS3A-720 CSL Storage Tank Agitator 1 FIXED-PROP SS3
A-760 CSL/DAP Day Tank Agitator 1 FIXED-PROP SS3C-755 DAP Solids Feeder 1 ROTARY-VALVE A28P-701 Ethanol Product Pump 2 1 CENTRIFUGAL CSP-703 Sulfuric Acid Pump 1 1 CENTRIFUGAL SS3P-704 Firewater Pump 1 1 CENTRIFUGAL CS
P-710 Gasoline Pump 1 1 CENTRIFUGAL CSP-720 CSL Pump 1 1 CENTRIFUGAL CS
P-750 Cellulase Pump 1 1 CENTRIFUGAL CSP-755 DAP Unloading Blower 1 CENTRIFUGAL CS
P-760 CSL/DAP Pump 1 1 CENTRIFUGAL CSS-755 DAP Vent Baghouse 1 FABRIC-FILTER A28T-7 01 E tha no l Produ ct S to rag e Tan k 2 FLA T-BTM-STORAG A2 8T -7 03 S ul fur ic Ac id St or ag e T an k 1 FLAT-BTM- STORAG SS3T-704 Firewater Storage Tank 1 FLAT-BTM-STORAG A28T-709 Propane Storage Tank 1 HORIZONTAL STOR A51T-710 Gasoline Storage Tank 1 FLAT-BTM-STORAG A28T-720 CSL Storage Tank 1 FLAT-BTM-STORAG SS3T-750 Cellulase Storage Tank 2 FLAT-BTM-STORAG SS3T-755 DAP Storage Bin 1 LIVE-BTM-BIN CST-760 CSL/DAP Day Tank 1 FLAT-BTM-STORAG SS3
Work Stream No. kW Work Stream No. kWWC755 0.06 WP750WP701 5.24 WP755WP703 0.40 WP760WP704 0.00 WT720WP710 0.43 WT760WP720 0.29

8/4/2019 NRL Report
http://slidepdf.com/reader/full/nrl-report 138/154
I0203I.xls
MPONENT UNITS 261 560 804 804A 804B 804D 809 809A 810al Flow kg/hr 4,894 5,999 260,116 271,009 271,009 355,828 4,492 355,828 351,336
oluble Solids % 0.0% 0.0% 0.0% 0.0% 0.0% 1.3% 100.0% 1.3% 0.0%uble Solids % 0.0% 0.1% 0.0% 0.0% 0.0% 0.3% 0.0% 0.3% 0.3%mperature C 38 38 24 26 204 278 164 164ssure atm 1.00 3.20 1.00 1.01 1.01 0.97 0.97 0.97
por Fraction 1.00 1.00 1.00 1.00 1.00 0.99 0.00 0.99 1.00anol kg/hr 0 0 0 0 0 0 0ter kg/hr 205 74 3,382 3,661 3,661 67,617 67,617 67,617cose (SS) kg/hr 1 1 1
ose (SS) kg/hr 7 7 7binose (SS) kg/hr 2 2 2er Sugars (SS) kg/hr 2 2 2obiose (SS) kg/hr 3 3 3
cose Oligomers (SS) k g/hr 14 14 14ose Oligomers (SS) kg/hr 5 5 5er Oligomers (SS) kg/hr 7 7 7n Steep Liquor (SS) kg/hr 0 4 4 4 996 996 996
ers (Soluble Solids) kg/hr 74 74 74tic Acid kg/hr 1 1 1 1 21 21 21furic Acid kg/hr 0 0 0 2 2 2fural kg/hr 1 0 2 2 0 0 0
F kg/hr 0 0 0 0 0 0 0bon Dioxide kg/hr 65,570 65,570 65,570hane kg/hr 3 3 3
ygen kg/hr 984 1,243 59,411 61,638 61,638 10,273 10,273 10,273
ogen kg/hr 3,702 4,677 197,324 205,703 205,703 206,283 206,283 206,283ers kg/hr 0 0 0 0 402 402 402ulose (IS) kg/hr 14 13 14 0an (IS) kg/hr 4 4 4 0
binan (IS) kg/hr 1 1 1 0er Sugar Polymers (IS) kg/hr 1 1 1 0ulase (IS) kg/hr 6 6 6 0mass (IS) kg/hr 1 1 1 0
mo (IS) kg/hr 10 9 10 0nin (IS) kg/hr 142 140 142 2psum (IS) kg/hr 28 27 28 0OH)2 (IS) kg/hr
ers (Insoluble Solids) kg/hr 4,342 4,290 4,342 52halpy Flow (millions) Kcal/hr -0.6 -0.2 -10.9 -11.7 0.2 -347.1 -12.0 -359.0 -347.0rage Density g/ml 0.0011 0.0036 0.0012 0.0012 0.0007 0. 0407 3.1415 0.0409 0.0012
Heat Stream No. MM kcal/hr Work Stream No. kWQH801 11.86 WCOMBFAN
WM804
Eq. No. Equipment Name Req. Spare Equipment Type Ma
H- 80 1 B ur ne r Co mb us ti on A i r Pr eh ea te r 1 MIS CE LL AN EOUSM-8 04 Combustion G as Baghouse 1 FABRIC-FILTER A28

8/4/2019 NRL Report
http://slidepdf.com/reader/full/nrl-report 139/154
I0203I.xls
U I 531 571 615 623 803 804 804 812 812 813 813 814 815 815 815 816 816al low kg/hr 39,922 44,075 625 218 84,215 271,009 355,828 184,771 14,240 190,485 190,485 37,234 95,287 16,665 16,486 16,486 16,486oluble Solids % 2.4% 48.3% 0.0% 30.0% 26.5% 0.0% 1.3% 0.0% 0.0% 0.0% 0.0% 0.0% 0.0% 0.0% 0.0% 0.0% 0.0%uble Solids % 25.8% 4.9% 0.0% 0.1% 14.8% 0.0% 0.3% 0.0% 0.0% 0.0% 0.0% 0.0% 0.0% 0.0% 0.0% 0.0% 0.0%
mperature C 64 38 35 21 55 204 278 510 268 139 177 268 164 164 46 46 46ssure atm 0.21 3.20 1.00 1.00 1.00 1.01 0.97 86.06 13.00 98.31 97.63 13.00 4.42 4.42 0.10 0.10 4.20por Fraction 0.00 0.00 1.00 0.00 0.00 1.00 0.99 1.00 1.00 0.00 0.00 1.00 1.00 1.00 0.87 0.00 0.00anol kg/hr 0 3 0 0 3 0 0ter kg/hr 23,957 19,783 28 152 43,893 3,661 67,617 184,771 14,240 190,485 190,485 37,234 95,287 16,665 16,486 16,486 16,486cose (SS) kg/hr 57 6 63 1ose (SS) kg/hr 629 70 0 699 7
binose (SS) kg/hr 150 17 167 2er Sugars (SS) kg/hr 176 20 196 2lobiose (SS) kg/hr 249 28 277 3cose Oligomers (SS) kg/hr 1,282 144 1,426 14ose ligomers ) kg/hr 447 50 497 5er ligomers ) kg/hr 670 75 746 7rn teep Liquor ) kg/hr 992 0 0 992 4 996ers oluble olids) kg/hr 6,628 743 7,372 74
etic cid kg/hr 1,757 363 0 0 2,120 1 21furic cid kg/hr 107 12 118 0 2fural kg/hr 2 8 0 0 9 2 0
kg/hr 0 1 0 0 1 0 0bon ioxide kg/hr 273 0 0 65,570thane kg/hr 324 0 0 3ygen kg/hr 0 0 0 0 61,638 10,273ogen kg/hr 1 0 0 1 205,703 206,283ers kg/hr 2,847 468 0 0 3,315 0 402lulose (IS) kg/hr 20 1,337 1,358 14an (IS) kg/hr 7 430 437 4binan (IS) kg/hr 1 60 61 1er Sugar Polymers (IS) kg/hr 1 72 73 1lulase (IS) kg/hr 244 325 568 6mass (IS) kg/hr 0 0 65 65 1mo (IS) kg/hr 408 544 952 10nin (IS) kg/hr 214 13,967 14,181 142psum (IS) kg/hr 0 27 28 28OH)2 (IS) kg/hrers (Insoluble Solids) kg/hr 69 4,528 4,597 4,342halpy Flow (millions) Kcal/hr -88.4 -136.2 -1.0 -0.6 -225.2 0.2 -347.1 -554.1 -44.2 -699.8 -692.4 -115.6 -300.3 -52.5 -53.9 -62.1 -62.1
erage Density g/ml 1.0845 1.3326 0.0009 1.1481 1.2092 0.0007 0.0407 0.0259 0.0055 0.9320 0.8963 0.0055 0.0023 0.0023 0.0001 0.9898 0.9899
Eq. No. Equipment Name Req. S pa re E quipment Type Mat
H-811 BFW Preheater 1 SHELL-TUBE SS3M -8 03 F lu id iz ed B e d Co mb us ti on R e ac to r 1 MISCEL LA NEOUS CSM-811 Turbine/Generator 1 STEAM-TURBINE
P-811 Turbine Condensate Pump 2 CENTRIFUGAL SS3
Heat Stream No. MM kcal/hr Work Stream No. kWQBOILER 118.35 WKNETQH811 -0.64 WP811QM811 8.22 WPLANT
WTOTAL
821 823 840 8605,715 14,240 0 4,8580.0% 0.0% 0.0% 0.0%0.0% 0.0% 0.0% 0.0%309 190 25 115
96.26 12.32 1.00 1.680.00 0.00 1.00 0.97
5,715 14,240 4,858
0
-19.9 -51.6 0.0 -15.50.6 925 0 .876 3 0 .0 00 7 0.00 10

8/4/2019 NRL Report
http://slidepdf.com/reader/full/nrl-report 140/154
I0203I.xls
U I 591 593 595 597 811 811 811 812 813 813 815 816 821 823 861al low kg/hr 9,490 8,164 65,505 621 54,456 119,364 173,820 0 190,485 190,485 16,665 16,486 5,715 14,240 4,858oluble olids % 0.0% 0.0% 0.0% 0.0% 0.0% 0.0% 0.0% 0.0% 0.0% 0.0% 0.0% 0.0% 0.0% 0.0% 0.0%uble olids % 0.0% 0.0% 0.0% 0.0% 0.0% 0.0% 0.0% 0.0% 0.0% 0.0% 0.0% 0.0% 0.0% 0.0% 0.0%mperature 148 148 148 148 26 115 87 137 139 164 46 309 190 115
ssure atm 4.42 4.42 4.42 4.42 3.40 1.70 3.40 3.30 3.30 98.31 4.42 4.20 96.26 12.32 1.68por Fraction 0.00 0.00 0.00 0.00 0.00 0.00 0.00 0.00 0.00 0.00 1.00 0.00 0.00 0.00 0.00anol kg/hrer kg/hr 9,490 8,164 65,505 621 54,456 119,364 173,820 190,485 190,485 16,665 16,486 5,715 14,240 4,858cose (SS) kg/hrose (SS) kg/hrbinose (SS) kg/hr
her Sugars (SS) k g/ hrobiose (SS) kg/hr
cose Oligomers (SS) kg/hrose Oligomers (SS) kg/hrher Oligomers (SS) kg/hrrn Steep Liquor (SS) kg/hrhers (Soluble Solids) kg/hrtic cid kg/hruric cid kg/hrfural kg/hr
kg/hr
bon Dioxide kg/hrhane kg/hr
ygen kg/hrogen kg/hrers kg/hrulose I ) kg/hr
an I ) kg/hrbinan I ) kg/hrer ugar olymers I ) kg/hr
ulase (IS) kg/hrmass (IS) kg/hr
mo (IS) kg/hrnin (IS) kg/hrpsum (IS) kg/hrOH)2 (IS) kg/hrers (Insoluble Solids) kg/hr
halpy Flow (millions) Kcal/hr -34.7 -29.9 -239.7 -2.3 -206.3 -441.6 -647.9 -700.4 -699.8 -52.5 -62.1 -19.9 -51.6 -18.0rage Density g/ml 0.8653 0.8653 0.8653 0.8653 0.9970 0.9467 0.9670 0.9283 0.9320 0.0023 0.9899 0.6925 0.8763 0.9466
Heat Stream No. MM kcal/hr Work Stream No. kWWP804WP824WP826WP828
Eq. No. Equipment Name Req. S pa re E quipment Type Mat
M -8 20 H ot Pr oc es s W at er So ft en er Sy st e 1 P ACK AGEP-804 Condensate Pump 2 CENTRIFUGAL SS3
P-824 Deaerator Feed Pump 2 CENTRIFUGAL SS3P-826 BFW Pump 5 CENTRIFUGAL SS3
P-828 Blowdown Pump 2 CENTRIFUGAL CST -8 04 C on de nsa te Co ll ect io n T an k 1 VERTICAL-VESSEL A 28
T-824 Condensate Surge Drum 1 HORIZONTAL-VESS LSS3T-826 Deaerator 1 HORIZONTAL-VESS LCS;S
T-828 Blowdown Flash Drum 1 HORIZONTAL-VESS LCS

8/4/2019 NRL Report
http://slidepdf.com/reader/full/nrl-report 141/154
I0203I.xls
MPONENT UNITSal Flow kg/hr
oluble Solids %uble Solids %mperature Cssure atm
por Fractionanol kg/hrter kg/hr
cose (SS) kg/hrose (SS) kg/hrbinose (SS) kg/hr
er Su ga rs (SS) kg/hrobiose (SS) kg/hrcose Oligomers (SS) kg/hrose Oligomers (SS) kg/hrer Oligomers (SS) kg/hr
rn Steep Liquor (SS) kg/hrhers (Soluble Solids) kg/hretic Acid kg/hr
furic Acid kg/hrfural kg/hrF kg/hrbon Dioxide kg/hr
hane kg/hrygen kg/hrogen kg/hr
ers kg/hrulose (IS) kg/hran (IS) kg/hrbinan (IS) kg/hr
er Sugar Polymers (IS) kg/hrulase (IS) kg/hrmass (IS) kg/hr
mo (IS) kg/hrnin (IS) kg/hrpsum (IS) kg/hrOH)2 (IS) kg/hr
hers (Insoluble Solids) kg/hrhalpy Flow (millions) Kcal/hr
erage Density g/ml
Eq. No. Equipment Name R eq. Spare Equi pment Ty pe MatM-830 Hydrazine Addition Pkg. 1 PACKAGEM-832 Ammonia Addition Pkg 1 PACKAGEM-834 Phosphate Addition Pkg. 1 PACKAGEP-830 Hydrazine Transfer Pump 1 CENTRIFUGAL CST-830 Hydrazine Drum 1 VERTICAL-VESSEL SS3
Heat Stream No. MM kcal/hr Work Stream No. kWWM830WM832WM834WP830

8/4/2019 NRL Report
http://slidepdf.com/reader/full/nrl-report 142/154
I0203I.xls
MPONENT UNITS 259 559 940 941 942 944 945 949al Flow kg/hr 4,687 5,921 12,256,909 158,828 9,330 14,439 12,256,909 135,059
oluble Solids % 0.0% 0.0% 0.0% 0.0% 0.0% 0.0% 0.0% 0.0%uble Solids % 0.0% 0.0% 0.0% 0.0% 0.0% 0.0% 0.0% 0.0%mperature C 40 40 37 28 28 28 28 28
ssure atm 9.51 9.51 4.08 1.00 1.00 1.00 4.08 0.04por Fraction 1.00 1.00 0.00 0.00 0.00 0.00 0.00 1.00anol kg/hrter kg/hr 12,256,909 158,828 9,330 14,439 12,256,909 135,059
cose (SS) kg/hrose (SS) kg/hrbinose (SS) kg/hr
er Su gar s (S S) kg/hrobiose (SS) kg/hrcose Oligomers (SS) kg/hr
ose Oligomers (SS) kg/hrer Oligomers (SS) kg/hrn Steep Liquor (SS) kg/hr
hers (Soluble Solids) kg/hr
etic Acid kg/hrfuric Acid kg/hrfural kg/hr
F kg/hrbon Dioxide kg/hrhane kg/hr
ygen kg/hr 984 1,243ogen kg/hr 3,703 4,678ers kg/hr
ulose (IS) kg/hran (IS) kg/hrbinan (IS) kg/hrer Sugar Polymers (IS) kg/hr
ulase (IS) kg/hrmass (IS) kg/hr
mo (IS) kg/hr
nin (IS) kg/hrpsum (IS) kg/hrOH)2 (IS) kg/hr
hers (Insoluble Solids) kg/hrhalpy Flow (millions) Kcal/hr 0.0 0.0 -46287.8 -601.1 - 35 .3 -5 4.6 -46390.7 -432.8
erage Density g/ml 0.0106 0.0106 0.9819 0.9906 0.9906 0.9906 0.9906 0.0000
Eq. No. Equipment Name Req. Spare Equipment Type Ma
M-902 Cooling Tower System 1 INDUCED-DRAFT FIBM-904 Plant Air Compressor 2 1 CENTRIFUGAL
P-902 Cooling Water Pump 1 1 CENTRIFUGAL CSS-904 Instrument Air Dryer 1 1 PACKAGE CS
T -9 02 P re hy dr ol ys is F il te r Ai r Re ce iv er 3 HORIZONTA L- PR ES CST-904 Plant Air Receiver 1 HORIZONTAL-VESSELCS
T-905 Produc t Recovery F il ter Air Receiv 4 HORIZONTAL-PRES CS
Heat Stream No. MM kcal/hr Work Stream No. kWQCWCAP 102.94 WM902
WM904WP902WS904
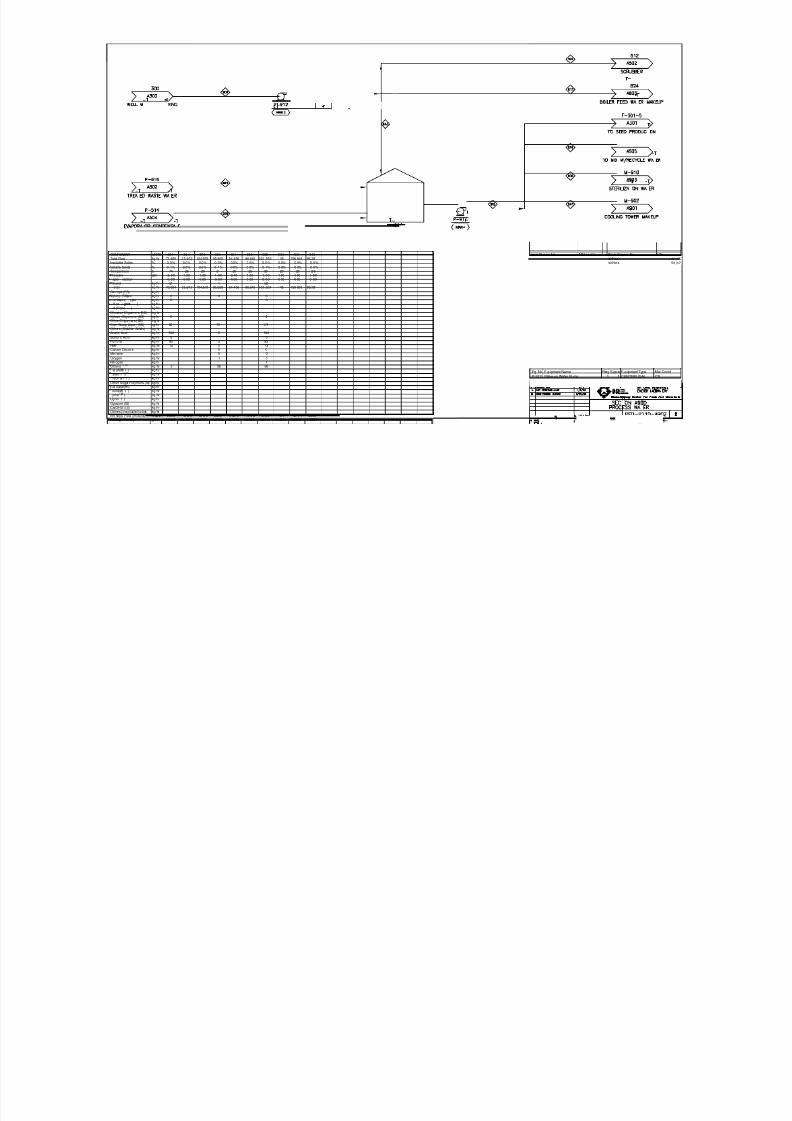
8/4/2019 NRL Report
http://slidepdf.com/reader/full/nrl-report 143/154
I0203I.xls
MPONENT UNITS 251 524 574 624 811 904 905 906 941 943al Flow kg/hr 71,466 35,912 104,579 95,805 54,456 186,649 263,552 145 158,828 96,281oluble Solids % 0.0% 0.0% 0.0% 0.0% 0.0% 0.0% 0.0% 0.0% 0.0% 0.0%
uble Solids % 0.1% 0.0% 0.0% 0.1% 0.0% 0.0% 0.1% 0.0% 0.0% 0.0%mperature C 74 26 20 21 26 26 38 20 28 26ssure atm 3.00 1.00 1.00 1.00 3.40 1.00 1.00 1.00 1.00 1.00
por raction 0.00 0.00 0.00 0.00 0.00 0.00 0.00 0.00 0.00 0.00anol kg/hr 51 1 52ter kg/hr 70,684 35,912 104,579 95,658 54,456 186,649 262,624 145 158,828 96,281
cose (SS) kg/hrose (SS) kg/hr 0 0 0binose ) kg/hr 0 0
er ugars ) kg/hrobiose ) kg/hr
cose Oligomers (SS) kg/hrose Oligomers (SS) kg/hr 0 0er Ol igomers (SS) kg/hrn Steep Liquor (SS) kg/hr 96 79 175ers (Soluble Solids) kg/hrtic Acid kg/hr 540 3 543
furic Acid kg/hr 0 0fural kg/hr 80 3 83F kg/hr 12 0 13bon Dioxide kg/hr 0 0hane kg/hr 0 0
ygen kg/hr 1 1ogen kg/hr 1 1ers kg/hr 3 58 60ulose I ) kg/hran I ) kg/hrbinan I ) kg/hr
er Sugar Polymers (IS) kg/hrulase (IS) kg/hrmass I ) kg/hrmo I ) kg/hrnin I ) kg/hr
psum (IS) kg/hrOH)2 (IS) kg/hrers (Insoluble Solids) kg/hrhalpy Flow (mil lions) K cal /h r -265.8 - 13 6. 0 - 39 6. 6 -363.2 -2 06. 3 - 70 6. 8 -993.6 - 0. 5 - 60 1. 1 -364.6rage Density g/ml 0.9442 0. 9925 0.9983 0.9973 0.9970 0.9925 0.9811 0. 9983 0.9906 0.9925
Eq. No. E quipment Name Req. S pa re E quipment Type MatP-912 Make-up Water Pump 1 1 CENTRIFUGAL CSP -9 14 P ro cess W at er C ircu la ti ng P ump 2 1 CENTRIFUGAL CST-914 Process Water Tank 1 FLAT-BTM-STORAGCS
Heat Stream No. MM kcal/hr Work Stream No. kW
WP912WP914

8/4/2019 NRL Report
http://slidepdf.com/reader/full/nrl-report 144/154
I0203I.xls
U I 906 909 914 916al low kg/hr 145 145 63 63oluble olids % 0.0% 0.0% 0.0% 0.0%uble olids % 0.0% 0.0% 0.0% 0.0%
mperature C 20 121 20 20ssure atm 1.00 1.00 1.00 1.00
por Fraction 0.00 1.00 0.00 0.00anol kg/hrer kg/hr 145 145 63 63cose ) kg/hrose ) kg/hrbinose ) kg/hr
her Sugars (SS) k g/ hrobiose (SS) kg/hrcose Oligomers (SS) kg/hrose Oligomers (SS) kg/hrer Oligomers (SS) kg /h r
rn Steep Liquor (SS) kg/hrhers (Soluble Solids) kg/hr
tic Acid kg/hruric Acid kg/hrfural kg/hr
kg/hrbon ioxide kg/hrhane kg/hr
ygen kg/hrogen kg/hr
ers kg/hrulose (IS) kg/hr
an (IS) kg/hrbinan I ) kg/hrer ugar olymers I ) kg/hrulase I ) kg/hrmass I ) kg/hr
mo (IS) kg/hrnin (IS) kg/hrpsum (IS) kg/hrOH)2 (IS) kg/hrers (Insoluble Solids) kg/hrhalpy Flow (millions) Kcal/hr -0.5 - 0. 5 -0.2 -0. 2rage Density g/ml 0.998 0.001 0.998 0.998
Heat Stream Mmkcal/hr Work Stream No. kW
QH910 -0.09 WM910
Eq. No. Equipment Name R eq. Spare Equi pment Ty pe MatM-910 CIP System 1 MISCELLANEOUS CS

8/4/2019 NRL Report
http://slidepdf.com/reader/full/nrl-report 145/154
Appendix GChanges from the 1999 Design Report

8/4/2019 NRL Report
http://slidepdf.com/reader/full/nrl-report 146/154
The following section describes the major changes that have been made since the 1999 designreport. In general, the process changes came from a new feedstock, better design and costinformation, the need to portray the current state of research in enzyme production, and thechange to target yields for pretreatment and co-fermentation that can be achieved in the nextseveral years. Other minor changes (to the mass and energy balance model) had a smallcombined cost effect.
Corn Stover Feedstock
The change in feedstock from yellow poplar hardwood chips to corn stover is a major one. Thereare fewer carbohydrates in corn stover than hardwood, so the theoretical of ethanol yield per tonof feedstock is lower. The feedstock cost of $30 per dry short ton is an increase from wood chipsat $25 per dry short ton. The cost represents our current understanding of the expected harvestingcapabilities, transportation and farmer costs required to obtain stover in 2010. ORNL has beeninstrumental in providing us with information on feedstock costs to use in the process model, andcontinues to work towards a better understanding of the availability and cost of stover.
It is assumed that the bales would be stored in several locations until needed. The cost of offsite
storage for the once-per-year harvest of stover was not included in this design.
The change from a loose, piled feedstock like wood chips to baled stover presented severalchanges in the feedstock receiving and handling area, including moving the bales, breaking themup, and making the stalks and other long pieces small enough to feed to the pretreatment reactors.Corn stover also contains a higher percentage of dirt and less moisture than wood chips, so dustand debris were issues. The Harris group looked at several designs for moving, unbaling,washing, and shredding baled corn stover, and picked one based on its performance in existingsimilar applications. The total installed cost of $7.5MM for stover handling equipment was$2.6MM higher than that for wood chips. The stover handling equipment was also sized on a dryfeed rate unlike the wood chip handling equipment, which was sized on a total feed rate basis. Itis conceivable that this system is overdone, and the washing and size reduction could be reduced
as we learn to handle or minimize the dirt picked up in harvesting and gain a better understandingof the effect of particle size.
Labor for the baled feedstock was a significant change - eight forklift operators per shift for cornstover versus two bulldozer drivers for chips. Because the bales are trucked in and must beunloaded, a substantial amount of bale moving is anticipated.
Pretreatment Reactor and Yields
The Harris Group contacted several vendors for design and cost information to augment theinformation we obtained from Sunds through Delta-T. Anco-Eaglin and Andritz provideddetailed estimates. Both companies specified lower cost metallurgy for the wetted parts (Incoloy
825 clad steel and Incoloy 825, respectively) than Sunds originally did (Hastelloy C-2000) for thepretreatment conditions. Harris contracted with a corrosion lab and corrosion consultant toconduct testing on these materials. The lower cost of the Anco-Eaglin system provided a savingsof about $5.5MM in purchased and $2.5MM in installed equipment cost over the Sunds unit. Thereason for this decrease in savings as the installation factor is applied is that the Anco-Eaglinsystem has a larger installation factor of 2.29 versus a factor of 1.5 for the Sunds unit. Yieldtargets were increased from 75 to 90% for hemicellulose to monomer conversion.

8/4/2019 NRL Report
http://slidepdf.com/reader/full/nrl-report 147/154
Solid-Liquid Separation Equipment
A significant portion of the Harris Group’s work was with solid-liquid separation vendors in anattempt to optimize the design of equipment for both separation of prehydrolyzate slurry andpost-distillate slurry. As a result of vendor testing over a wide range of separator types, a
Pneumapress pressure filter was chosen for the prehydrolyzate slurry application based on itsperformance in solid recovery, cake dryness, and washing ability. When compared against theother quotes (for horizontal belt filters), the Pneumapress filter’s estimated installed cost was$2.2MM more than the closest cost quote, but $18.5MM less than the highest quote. However,its separation and washing efficiencies were superior to the horizontal belt filters. The installedcost of the Pneumapress system was about $4MM higher than our current estimate for a belt filterpress ($6.3MM installed cost for the Pneumapress and peripherals compared to $2.1MM for thebelt filter press), however, it allows for washing with a minimal amount of liquid, and has beenverified through vendor testing.
For the post-distillate solids, the Pneumapress system used here is again about $4MM moreexpensive than the prior centrifuge cost ($6.4MM versus $2.4MM), but also allows the removal
of the solids dryer ($2.2MM). The flue gas, previously used for drying, can now be used in acombustion air preheater ($1.1MM). Also, Harris’ estimated installed cost for a centrifugesystem in this application (including all extraneous equipment such as pumps, conveyors, etc.)was $0.7MM more expensive than that of the Pneumapress system. Because this data was basedon vendor tests, we consider it more reliable than the previous separation equipment costs used
Enzymatic Hydrolysis (Saccharification) and Co-Fermentation
Based on our current understanding of what production of the first commercially availableenzyme preparation for lignocellulosic biomass will entail, a cost of $0.10 per gallon of ethanolwas used for enzyme delivered to the plant from a local enzyme facility. This is a major changefrom the previous design, which assumed on-site fermentation of the enzyme using T. Reesei
fungi (previously Area 400 in the design). The installed capital ($15.5MM) and operating costsassociated with that production were about $0.30 per gallon ethanol. The electrical demand of the plant is roughly halved without the enzyme production fermenters. Chilled water demand isalso greatly reduced by removing cellulase production.
In preparation for an improved thermal tolerant enzyme, the SSCF process was separated intoseparate saccharification and co-fermentation. The saccharification yield target was increasedand the fermentation yield target for glucose was also increased.
Other Changes
1. Distillation column costingBoth the beer column and rectification distillation column capital costs are now scaled by the square of the diameter (previously just the diameter), to better represent the size (and hence cost)by a variable that is proportional to cross-sectional flow.
2. Solids Dryer TestingIn the current design, the solids fed to the boiler are not being dried, due to the high efficiency of the Pneumapress unit. The previous design used a centrifuge, and required a dryer to get the total boiler feed moisture content low enough to support combustion. A rotary drum dryer, similar to those used to dry the Distiller’s Dried Grains (DDG) in the corn ethanol industry was used with

8/4/2019 NRL Report
http://slidepdf.com/reader/full/nrl-report 148/154
the hot flue gas as the heat source. The cost of the dryer was about $2.2MM, and wasincorporated into the design (replacing the rotary drum dryer) until the Pneumapress unit replacedit and the centrifuge in this new design.
Summary of Significant Changes
1999 Design Report 2002 Design Report Ethanol SellingPrice ($/gal)
1999 Reported Cost(Model: R9906A, 1997 $) $1.44Feedstock Hardwood Chips Corn Stover +$0.06Feedstock Cost $25 per dry ton $30 per dry ton +$0.07
Feedstock HandlingInstalled Cost $4.9MM $7.5MM +$0.02Feedstock Handling Labor 2 per shift 8 per shift +0.02
Pretreatment Reactor Hastelloy C-2000 Incoloy 825 clad steel -$0.01
Pretreatment Targets andConditions
75% Hemicellulose toMonomer Yield
190°C 0.5% acid, 10minutes
90% Hemicellulose toMonomer Yield
190°C, 1.1% acid, 2minutes -$0.06
Conditioning Ion exchange andoverliming Overliming only -$0.08
Solid-Liquid SeparationEquipment
Belt FilterPress/Centrifuge
Pneumapress PressureFilters +$0.01
Enzyme Produced on-site for$0.30 per gallon ethanol
Purchased for $0.10 pergallon ethanol -$0.20
Enzymatic Hydrolysis andFermentation Configuration
SSCF Saccharification and Co-Fermentation -$0.01
Fermentation Targets 73.6% Cellulose to
Ethanol Yield
85.5% Cellulose to
Ethanol Yield
-$0.15
85% Xylose to EthanolYield
85% all HemicelluosicSugars to Ethanol Yield
-$0.10
Cost Year Change 1997 2000 +$0.04
Other Minor Model Fixes +$0.02
2002 Reported Cost(Model: I0203I, 2000 $ $1.07

8/4/2019 NRL Report
http://slidepdf.com/reader/full/nrl-report 149/154
Appendix HChemical Formulas for Biomass Compounds

8/4/2019 NRL Report
http://slidepdf.com/reader/full/nrl-report 150/154
Chemical Formulas for Biomass Compounds
Compound Name Chemical Formula Notes
Acetate C2H4O2
Arabinan C5H8O4 Use Xylan Properties
Arabinose C5H10O5 Use Xylose properties
Cellobiose C12H22O11 Use Glucose propertiesCellulose C5H10O5
Corn Steep Liquor (CSL) Unknown Modeled as water
Furfural C5H4O2
Galactan C6H10O5 Use Cellulose properties
Galactose C6H12O6 Use Glucose properties
Glucose C6H12O6
HydroxyMethylFurfural (HMF) C5H4O2 Use Furfural properties
Lignin C10H13.9O1.3
Mannan C6H10O5 Use Cellulose properties
Mannose C6H12O6 Use Glucose propertiesSoluble Lignin C
10H
13.9O
1.3Use Glucose properties for
liquid-liquid interactions
Tar C5H8O4 Use Xylan PropertiesXylan C5H8O4
Xylose C5H10O5
Z. mobilis CH1.8O0.5N0.2

8/4/2019 NRL Report
http://slidepdf.com/reader/full/nrl-report 151/154
Appendix I
Physical Property Model and
Parameters for Distillation

8/4/2019 NRL Report
http://slidepdf.com/reader/full/nrl-report 152/154
Physical property models and parameters are important throughout a rigorous mass and energybalance model such as the one used here. This is even truer for distillation calculations involvingazeotropes such as the separation of ethanol from water. The physical property optioni selected
for this ASPEN model uses the NRTLii activity coefficient (γ i ) model for the liquid phase
fugacity, f iλ
, calculation. The vapor phase is modeled using the ideal gas law, which makes thevapor fugacity coefficient equal to one. The vapor phase fugacity coefficient is not nearly asimportant as the liquid phase fugacity because of the low-pressure operation.
The liquid phase equation for liquid fugacity is:
f iλ = xi γ i f i
*,λ
The pure component liquid fugacity, f i*,λ , reduces to the pure component vapor pressure, pi
*,λ , at
low pressures (the Poynting correction is unity). The NRTL activity coefficient model and vaporpressure models used by ASPEN are given below. Tables 11 and 12 give the ethanol and water
parameters for those equations.
∑ x jτ jiG ji x jGij ∑ xmτmjGmj
m
∑ xk Gki
+∑ln γ i = j
j ∑ xk Gkj
τ ij − ∑ xk Gkj
k k k Where:
Gij = exp(−α ijτ ij )
τij =
aij +
ij
T
b
+e
ij
ln T
+ f
ij
T
α ij = cij + d ij (T − 273.15)
τ ii = 0
Gii =1
aij ≠ a ji
bij ≠ b ji
cij = c ji
d ij = d ji
Vapor Pressure Correlation
*,λ ln pi = C 1i +C 2i + C 4iT +C 5i lnT + C 6iT
C 7 i
T +C 3i

8/4/2019 NRL Report
http://slidepdf.com/reader/full/nrl-report 153/154
NRTL Activity Coefficient Model Parameters ii i
aij 0aji 0
bij -55.1698bji 670.4442
cij 0.3031
dij 0eij 0
eji 0fij 0
fji 0Lower Temperature Limit 348.15
Upper Temperature Limit 373.15Note: i – ethanol, j – water
Vapor Pressure Model Parameters iii
Eq. Parameters Ethanol WaterC1 74.475 73.649C2 -7164.3 -7258.2
C3 0 0C4 0 0
C5 -7.3270 -7.3037C6 3.1340E-06 4.1653E-06
C7 2 2Lower Temperature Limit 159.05 273.16
Upper Temperature Limit 513.92 647.13Temperature Units, KelvinsPressure Units, Pascals
i “ASPEN Plus™, Reference Manual–Volume 2, Physical Property Methods and Models,” Release 9.3, Aspen Technology, Inc., Cambridge, MA, 1996.ii Renon, H., and J.M. Praustniz, “Local Composition in Thermodynamic Excess Functions for Liquid Mixtures,” AIChE J ., 14(1), 135, 1968.iii “ASPEN Plus™, Reference Manual–Volume 3, Physical Property Data,”Release 9.3, Aspen Technology, Inc., Cambridge, MA, 1996.

8/4/2019 NRL Report
http://slidepdf.com/reader/full/nrl-report 154/154
REPORT DOCUMENTATION PAGE Form Approved
OMB NO. 0704-0188
Public reporting burden for this collection of information is estimated to average 1 hour per response, including the time for reviewing instructions, searching existing data sourcesgathering and maintaining the data needed, and completing and reviewing the collection of information. Send comments regarding this burden estimate or any other aspect of thiscollection of information, including suggestions for reducing this burden, to Washington Headquarters Services, Directorate for Information Operations and Reports, 1215 JeffersDavis Highway, Suite 1204, Arlington, VA 22202-4302, and to the Office of Management and Budget, Paperwork Reduction Project (0704-0188), Washington, DC 20503.
1. AGENCY USE ONLY (Leave blank) 2. REPORT DATE
June 20023. REPORT TYPE AND DATES COVERED
Technical Report
4. TITLE AND SUBTITLE
Lignocellulosic Biomass to Ethanol Process Design and Economics Utilizing Co-Current DiluteAcid Prehydrolysis and Enzymatic Hydrolysis for Corn Stover
5. FUNDING NUMBERS
TA: BFP2.A410
6. AUTHOR(S)
A. Aden, M.Ruth, K. Ibsen, J. Jechura, K. Neeves, J. Sheehan, B. WallaceL. Montague, A. Slayton, J. Lukas
7. PERFORMING ORGANIZATION NAME(S) AND ADDRESS(ES)
Biotechnology Center for Fuels and ChemicalsNational Renewable Energy LaboratoryGolden, CO 80401
Harris GroupSeattle, WA 98109
8. PERFORMING ORGANIZATIONREPORT NUMBER
9. SPONSORING/MONITORING AGENCY NAME(S) AND ADDRESS(ES)
National Renewable Energy Laboratory1617 Cole Blvd.Golden, CO 80401-3393
10. SPONSORING/MONITORINGAGENCY REPORT NUMBER
NREL/TP-510-32438
11. SUPPLEMENTARY NOTES