Embed Size (px)
Citation preview

To be included in NUREG/CP-???? (???. 2001)Proceedings of the 28th Water Reactor Safety Meeting, Rockville Maryland, Oct. 1999
Page 1 of 25
NRC Review of the Technical Basis for Use of the Master Curve inEvaluation of Reactor Pressure Vessel Integrity
Mark KirkUnited States Nuclear Regulatory Commission • Office of Nuclear Regulatory Research
BACKGROUND
Fracture Toughness Characterization
The fracture toughness of the reactor pressure vessel (RPV) steel in a nuclear plant provides akey input to calculations that commercial licensees perform to demonstrate the fracture integrityof the vessel during both normal operations and postulated accident conditions (e.g. pressurizedthermal shock, or PTS). Currently, the ASME KIC and KIR curves, indexed to the RTNDT of thematerial, describe the fracture toughness of the RPV and its variance with temperature. Thesecurves were adopted in 1972 as a lower bound representation to a set of 173 linear elasticfracture toughness (KIC) values and 50 linear elastic arrest toughness (KIA) values for 11 heatsof RPV steel. The use of RTNDT to normalize temperature was intended to account for the heat-to-heat differences in fracture toughness transition temperature, thereby collapsing the fracturetoughness data onto a single curve. However, RTNDT is not always successful in this regard,often providing a conservative characterization of fracture toughness.
Developments since 1972 set the scene for substantial improvements to the KIC / RTNDT
characterization of fracture toughness. In 1980 Landes and Schaffer noticed a weakest link sizeeffect for specimens failing by transgranular cleavage. They demonstrated that largerspecimens fail at lower toughness values, even when the severe size requirements of linearelastic fracture mechanics (LEFM) are satisfied. Beginning in 1984, Wallin and co-workers fromVTT in Finland combined this weakest link size effect with micro-mechanical models of cleavagefracture. Wallin developed a model that accounts successfully for size effects, and provides ameans to calculate statistical confidence bounds on cleavage fracture toughness data. Theseconcepts, combined with the observation that ferritic steels exhibit a common variation ofcleavage fracture toughness with temperature, gave birth to the notion of a “master” fracturetoughness transition curve for all ferritic steels.
Recently Master Curve technology has been incorporated into ASTM and ASME codes andstandards. In 1997 ASTM adopted standard E1921 that describes how to measure an indextemperature for the Master Curve, To. To locates the Master Curve on the temperature axis forthe steel of interest. E1921 incorporates a modern understanding of elastic-plastic fracturemechanics, and so permits determination of To using specimens as small as a precracked CVN.In 1998 ASME published Code Cases N-629 and N-631. These Code Cases permit use of aMaster Curve-based index temperature (RTTo≡To+35° F) as an alternative to RTNDT. BecauseRTTo is calculated from fracture toughness data, it consistently positions bounding KIC and KIR
curves relative to fracture toughness data for all material and irradiation conditions encounteredin nuclear RPV service. Such consistency cannot be achieved via the correlative RTNDT
techniques used currently.
Motivation for a Improved Accuracy
Price deregulation of the electric power industry in the United States fundamentally changes theeconomics of continued of nuclear power plant (NPP) operation. Before deregulation NPPs,

To be included in NUREG/CP-???? (???. 2001)Proceedings of the 28th Water Reactor Safety Meeting, Rockville Maryland, Oct. 1999
Page 2 of 25
which provide primarily baseload, were paid based on capacity. Now NPPs must compete withother energy sources, so utility executives are considering new operational scenarios, some ofwhich were unheard of as little as five years ago: extending the licensed life of the plant beyond40 years, removal of flux reduction, up-rating of the reactor, etc. These actions all increase therate of embrittlement, causing current licensing limits to be approached at an earlier date. Also,the lead time needed to bring replacement power sources (e.g. gas turbines, coal, or licenserenewal of the NPP for an additional 20 years) on-line push back by nearly a decade from EOLthe date on which utilities, and consequently the NRC, must make the decisions and do theanalysis that decide the future of a NPP. In combination, these factors suggest that the fate ofnearly 30% of currently operating pressurized water reactors (PWRs) will be decided between2005 and 2010. Consequently, both the industry and the NRC are now considering refinementof the procedures used to estimate of RTNDT at EOL with an eye to reducing known over-conservatisms while adequately protecting the public safety. Use of the Master Curve is butone of these refinements
In addition to these economic motivations for change, regulatory motivations exist as well. Theperception, based on RTNDT, of a lower toughness RPV steel than actually exists canunnecessarily restrict the permissible pressure-temperature (P-T) envelope for routine heat-upand cool-down operations, which can reduce overall plant safety. For example, anunnecessarily narrow P-T envelope increases the possibility of damaging pump seals due toinsufficient cooling water pressure. Considering that pump seal failure produces a small-breakloss of coolant accident (a potential pressurized thermal shock initiator), this situation is clearlyundesirable. Additionally, the current perception of low RPV toughness (based on high RTNDT
values) produces the need for flux suppression systems to maintain an acceptable P-Tenvelope. Flux suppression produces higher fuel peaking and, consequently, less marginagainst fuel damage if an accident were to occur. The risk to the plant and the publicassociated with these situations can be mitigated by replacing the conservative RTNDT-basedcharacterization of fracture toughness with the more accurate characterization provided by theMaster Curve.
The use of Master curve-based approaches, is consistent with the NRC’s goal of moving towarda risk informed framework for rule and decision-making. This framework, and the probabilisticrisk assessment (PRA) methodologies that support it, require the use of best estimate valuesrather than bounding values whenever possible. The Master Curve provides best estimates offracture toughness, along with the explicit consideration of uncertainty. Conversely, RTNDT
technology provides bounding values, suggesting that the Master Curve fits better within a riskinformed framework than does RTNDT.
OBJECTIVE
In a recent NUREG, the Staff examined the technical basis for both the Master Curve itself, andfor its application to the assessment of nuclear RPV integrity against fracture [Kirk 00e]. Herewe focus attention on the application issues that need to be addressed to transition from thecurrent bounding approach to toughness estimation toward a best-estimate approach that ismore consistent with a risk-informed decision making process. To establish the baselineagainst which progress to this goal is measured, we begin by reviewing the origin ofconservatisms inherent to the current RTNDT / KIC procedures for fracture toughnesscharacterization.

To be included in NUREG/CP-???? (???. 2001)Proceedings of the 28th Water Reactor Safety Meeting, Rockville Maryland, Oct. 1999
Page 3 of 25
CURRENT PROCEDURE TO ESTIMATE THE FRACTURE TOUGHNESS OF NUCLEAR RPVSTEELS
Procedure Description
In all calculations to assess the integrity of a nuclear RPV against fracture, an estimate of thefracture toughness of the vessel after neutron embrittlement is needed. Practical limitationsregarding the volume of material that can be irradiated as part of a surveillance program restrictboth the quantity and size of the material samples used to obtain this estimate. Currently thefracture toughness of an RPV steel is estimated as follows:
1. The transition temperature of the material before irradiation (RTNDT(u)) is determinedusing either ASME NB-2331 procedures [ASME NB2331], or alternative proceduresintended to be conservative to NB-2331 [NRC MTEB5.2].
2. RTNDT(u) is shifted to account for the effects of neutron irradiation. The shift added is thedifference in the CVN 30 ft-lb transition temperature (∆T30) before and after irradiation.∆T30 may be either based on shift measurements (from a ASTM E185 qualifiedsurveillance program) or on shifts calculated from chemical composition using anembrittlement trend curve [NRC RG199R2].
3. Margins are added to account for uncertainties in the state of knowledge of the material,and for uncertainties in the calculational process [NRC RG199R2, Randall 87].
4. The estimated transition temperature of the vessel after some amount of neutronirradiation (now RTNDT(u) + ∆T30 + Margin) is used as an index temperature for the ASMEKIC and/or KIR curves, thus establishing the lower bound above which the actual fracturetoughness of the material is expected to lie.
It should be noted that nowhere in this process is the fracture toughness of the material actuallymeasured, rather it is inferred through a series of correlations. The components of thisprocedure began to be established as early as 1972, and the procedure was solidified inconcept as early as 1977 (NRC RG199R1). Two state-of-knowledge limitations that existed inthis timeframe necessitated adoption of a correlative approach to toughness estimation:
1. Linear Elastic Characterization of Fracture Behavior: Between 1972 and 1977, the onlymathematical description of fracture behavior sufficiently well developed for ASMEcodification was one premised on a linear elastic characterization of material constitutivebehavior. At temperatures in fracture mode transition, large fracture toughnessspecimens (minimum lineal dimension of ≈ 2-in.) of nuclear RPV steels need to be testedto meet the validity requirements of a linear elastic fracture theory [ASTM E399]. It is notpractical to use specimens of this size as part of a surveillance program.
2. Need to Determine the Entire Transition Curve: Calculations of the fracture integrity of anuclear RPV require as input the complete variation of toughness with temperaturethrough transition, not just the toughness at a fixed temperature. Between 1972 and1977 there was no procedure available from which such a comprehensive description oftransition fracture toughness behavior could be inferred based on tests of a limitednumber of specimens.
While approximate, the KIC / RTNDT procedure is believed to be, and indeed must be,conservative (i.e. always underestimate the measured fracture toughness of the material inquestion) due to the factors discussed further in the following section.

To be included in NUREG/CP-???? (???. 2001)Proceedings of the 28th Water Reactor Safety Meeting, Rockville Maryland, Oct. 1999
Page 4 of 25
Conservatism of Procedure
Due to the LEFM Representation of Fracture Toughness
In 1972, ASME adopted the KIC and KIR curves to describe the variation with temperature of thestatic and dynamic (respectively) fracture toughness of nuclear RPV steels [WRC 175, Marston87]. These curves were hand-drawn as lower bounds to a set of fracture toughness data validaccording to the LEFM requirements of ASTM E399 [ASTM E399].
ASTM E399 places severe restrictions on the size of the plastic zone at fracture relative to theoverall size of the specimen to ensure that a linear elastic description of material flow behavioris not violated in a significant way. The E399 size requirement is as follows:
2
5.2,,
≥
y
IKBba
σ(1)
where a is the crack length, b is the length of the uncracked ligament, B is the specimenthickness, Kq is the stress intensity factor at fracture, and σy is the yield strength at the testtemperature. Considering that the diameter of the plastic zone ahead of a deforming crack in athick structure can be expressed as follows:
2
3
1
=
y
Iplastic
Kd
σπ(2)
one concludes that E399 requires that the smallest length scale in the specimen (a, b, or B)must exceed the size of the plastic zone by a factor of approximately 25 (=2.5⋅ 3⋅ π). Thisrestriction invariably admits only the lowest part of the population of cleavage fracturetoughness values to further analysis, as illustrated in Fig. 1. Since the KIC and KIR curves werebased exclusively on these low fracture toughness values, it is clear that the requirement forLEFM validity forces establishment of a low bounding curve.
Due to the Use of RTNDT to Normalize Temperature
When using fracture toughness data to establish the bounding KIC and KIR curves, the fracturetoughness values were not plotted vs. temperature, but rather vs. the difference between thetest temperature and an index temperature called RTNDT [WRC 175, Marston 78]. RTNDT isdetermined from Charpy V-Notch (CVN) and nil-ductility temperature (NDT) data as per ASMENB-2331, as follows:
{ }60, 50/35 −= TTMAXRT NDTNDT (in °F) (3)
where TNDT is the nil-ductility temperature determined by testing NDT specimens as per ASTME208, and T35,50 is the transition temperature at which Charpy-V notch (CVN) specimens testedas per ASTM E23 exhibit at least 35 mills lateral expansion and 50 ft-lbs absorbed energy.RTNDT is intended to account for the heat-to-heat differences in fracture toughness transitiontemperature, and thereby collapse all of the transition toughness curves for specific heats ofsteel onto a single curve [ASME NB2331, ASTM E208, ASTM E23]. This procedure of usingRTNDT to normalize temperature conservatively places the KIC curve relative to measuredfracture toughness data for the following reasons:

To be included in NUREG/CP-???? (???. 2001)Proceedings of the 28th Water Reactor Safety Meeting, Rockville Maryland, Oct. 1999
Page 5 of 25
1. The NB-2331 Procedure for Determining RTNDT: This procedure requires first that TNDT
be established, and that that three CVN tests be conducted at 60° F above TNDT todemonstrate that the minimum CVN energy exceeds 50 ft-lbs, and that the minimumlateral expansion exceeds 0.035-in. NB-2331 does not require the user to either bracketthe NDT temperature (i.e. achieve both break and no-break results), nor does it requiredetermination of the temperature at which the 50 ft-lbs / 35 mil criteria is just exceeded.
0
100
200
300
400
-400 -300 -200 -100 0 100
T-RT NDT [oF]
KJc
[ksi
*in0.
5 ]
Cleavage (Invalid)
EPFM (E1921 Valid)
LEFM (E399 Valid)
ASME KIC Curve
Figure 1. Placement of LEFM (ASTM E399) valid data relative to the overall population ofcleavage fracture toughness data for nuclear RPV steels. All values are plotted as-measured, and are normalized relative to an ASME NB-2331 value of RTNDT.
Consequently, the NB-2331 procedure forces reported values of RTNDT toward the upperend of all RTNDT values for a particular heat of steel.
2. The Procedure by which the Relationship Between the ASME KIC curve and RTNDT wasEstablished: In the early 1970’s an ASME task group established the followingrelationship between RTNDT and the KIC curve:
( )[ ]1000198.0exp81.22.33 +−⋅⋅+= NDTIC RTTK (K in ksi √in, T in °F) (4)
This equation (a hand-drawn curve at the time) was constructed in 1972 such that noexisting measured KIC value in transition (i.e. at T-RTNDT > 100° F) fell below the KIC
curve*. This empirical approach to developing a transition toughness curve was neededbecause at the time no theoretical basis existed to account for the differences in loading,loading rate, crack geometry, and specimen thickness between NDT and CVN tests andthe conditions of interest in nuclear RPV service (i.e. a sharp crack in a thick structure).
The substantial collection of fracture toughness data available today (Fig. 1) testifies to thebounding characteristics achieved through the use of the ASME NB-2331 definition of RTNDT
along with the ASME KIC curve†. It is important to recognize that the combined effects of these
* The ASME committee did not enforce this bounding requirement on the lower shelf, as evidenced bythe considerable number of KIC values that fall below the 33.2 ksi√in asymptote in Fig. 2(a).
† Only one KIC value falls below the KIC curve in transition. A KIC value of 98¼ ksi√in measured using a6T C(T) of HSST Weld 72W falls 0.9 ksi√i n below the ASME KIC curve at T-RTNDT = +59.4° F.
To be included in NUREG/CP-???? (???. 2001)Proceedings of the 28th Water Reactor Safety Meeting, Rockville Maryland, Oct. 1999
Page 6 of 25
two factors produce a bounding curve. Neither the ASME NB 2331 definition of RTNDT nor theASME KIC equation acting individually ensures bounding.
Quantification of Conservatism
Because the index temperature RTNDT is determined with complete independence from thefracture toughness data it represents through its use with the ASME KIC curve (eq. (4)), there isno guarantee that, for example, a KIC curve positioned with respect to RTNDT will always under-estimate KIC data by the same amount. In fact, quite the contrary is true, as illustrated in Fig. 2.Recently, Bass et al. [Bass 00] quantified the range of possible conservatism inherent to a KIC
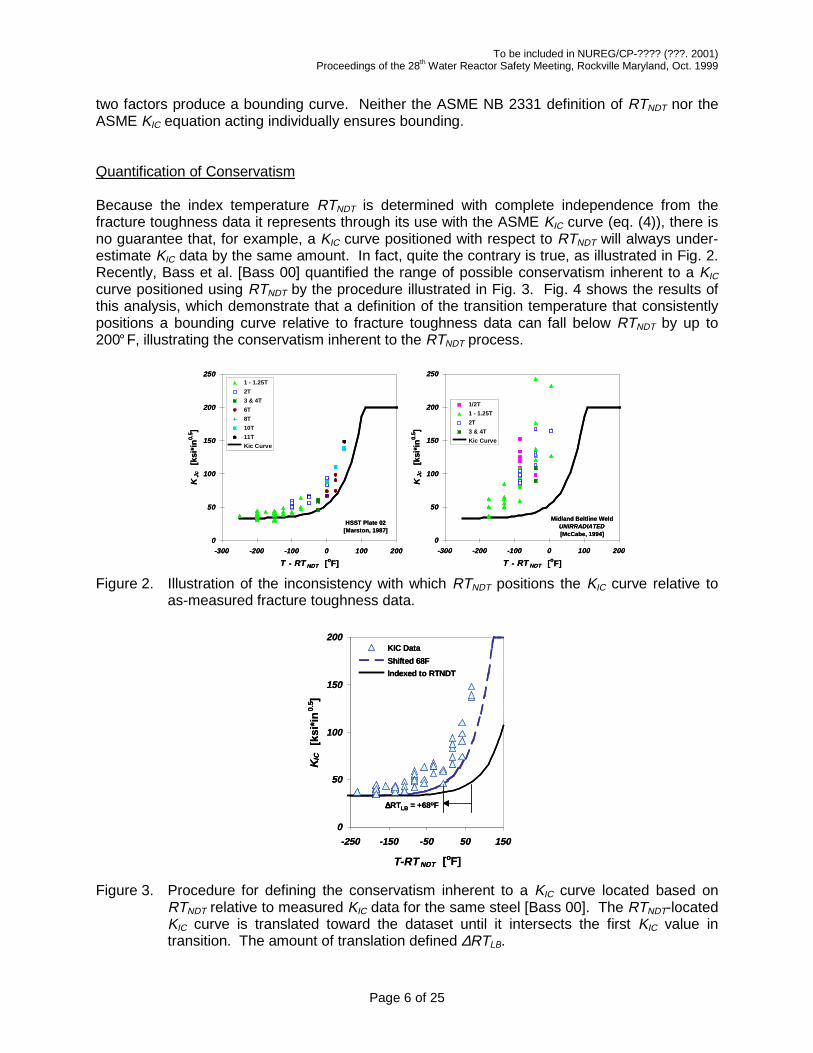
curve positioned using RTNDT by the procedure illustrated in Fig. 3. Fig. 4 shows the results ofthis analysis, which demonstrate that a definition of the transition temperature that consistentlypositions a bounding curve relative to fracture toughness data can fall below RTNDT by up to200°F, illustrating the conservatism inherent to the RTNDT process.
Midland Beltline WeldUNIRRADIATED[McCabe, 1994]
0
50
100
150
200
250
-300 -200 -100 0 100 200
T - RT NDT [oF]
KJc
[ksi
*in
0.5 ]
1/2T
1 - 1.25T
2T
3 & 4T
Kic Curve
HSST Plate 02[Marston, 1987]
0
50
100
150
200
250
-300 -200 -100 0 100 200
T - RT NDT [oF]
KJc
[ksi
*in
0.5 ]
1 - 1.25T
2T
3 & 4T
6T
8T
10T
11T
Kic Curve
Figure 2. Illustration of the inconsistency with which RTNDT positions the KIC curve relative toas-measured fracture toughness data.
0
50
100
150
200
-250 -150 -50 50 150
T-RT NDT [oF]
KIC
[ksi
*in
0.5 ]
KIC Data
Shifted 68F
Indexed to RTNDT
∆∆∆∆RTLB = +68oF
0
50
100
150
200
-250 -150 -50 50 150
T-RT NDT [oF]
KIC
[ksi
*in
0.5 ]
KIC Data
Shifted 68F
Indexed to RTNDT
∆∆∆∆RTLB = +68oF
Figure 3. Procedure for defining the conservatism inherent to a KIC curve located based onRTNDT relative to measured KIC data for the same steel [Bass 00]. The RTNDT-locatedKIC curve is translated toward the dataset until it intersects the first KIC value intransition. The amount of translation defined ∆RTLB.

To be included in NUREG/CP-???? (???. 2001)Proceedings of the 28th Water Reactor Safety Meeting, Rockville Maryland, Oct. 1999
Page 7 of 25
0%
20%
40%
60%
80%
100%
-50 0 50 100 150 200
∆∆∆∆ RTLB [oF]
Cum
ulat
ive
Pro
babi
lity
Data
5%
P
95%
Figure 4. Conservatism inherent to a KIC curve located based on RTNDT quantified by applyingthe procedure illustrated in Fig. 3 [Bass 00] to and expanded set of LEFM valid dataassembled by the Oak Ridge National Laboratory (ORNL) [Bowman 00].
APPLICATION OF THE MASTER CURVE IN RPV INTEGRITY ASSESSMENT
Table 1 summarizes the codes, standards, and regulations that concern estimation of fracturetoughness values used in nuclear RPV integrity calculations. The first two steps identified inTable 1 include a standard to measure toughness, and a procedure that uses this information toposition a reference toughness curve on the temperature axis. ASTM E1921-97 and ASMECode Cases N-629 and N-631 fulfill these needs for the Master Curve. Questions raisedpreviously by the Staff regarding the use of Master Curve technology in these codes andstandards [Mayfield 97, Kirk 00a] have received considerable attention over the past few years,and are now largely resolved [Kirk 00e]. These questions, and the resolution status of each, areas follows:
1. ASTM E1921-97a. Is the single temperature dependence of the Master Curve appropriate for all
RPV steels of interest, even after irradiation?: On-going research activitiesperformed by both Natishan (and co-workers) [Natishan 98, Natishan 99a,Natishan 99b, Wagenhofer 00a, Wagenhofer 00b, Kirk 00b] and Odette (and co-workers) [Odette 00] provide encouraging evidence that questions regarding thetheoretical limits on the universal Master Curve shape will soon be resolved.These results provide guidance on two related questions:
i. Breadth of Applicability: Research focused on establishing the physicalbasis for a universal Master Curve shape reveals that the lattice structurealone controls the temperature dependence of fracture toughness. Thus,the Master Curve will model well the temperature dependence of fracturetoughness for all pressure vessels steels of any product form both beforeand after irradiation because all of these steels have a BCC matrix phaselattice structure.
ii. Effect of Test Temperature: To values determined as per E1921-97 donot show a systematic bias or trend with test temperature, nor is thisexpected due to the common dependence of fracture toughness ontemperature for all ferritic steels. Revisions to E1921-97 propose further

To be included in NUREG/CP-???? (???. 2001)Proceedings of the 28th Water Reactor Safety Meeting, Rockville Maryland, Oct. 1999
Page 8 of 25
restriction to the range of temperatures within which one is permitted toperform toughness tests to estimate To. Available empirical evidencesuggests that this additional restriction is not necessary.
b. Does the ¼-power scaling rule adopted within the Master Curve reflectappropriately the effect of specimen size on fracture toughness?: Provided thematerial has a random distribution of cleavage initiations sites spreadhomogeneously throughout its volume, the Weibull model of cleavage fracturetoughness in transition relies only on the existence of a state of small scaleyielding to ensure its theoretical applicability. As the micro-scale inhomogenietyneeded to violate the assumption of a random distribution of cleavage initiationsites is not characteristic of RPV steels, applicability of the Master Curvestatistical fracture model can be assessed based on a calculation of thedeformation state at fracture. Under small scale yielding conditions, fracturetoughness will scale with thickness raised to the ¼-power. This result isanticipated theoretically and is well confirmed experimentally.
c. Are To values determined using precracked CVN specimens equivalent to To
values determined using larger specimens?: To values determined usingprecracked CVN specimens show a systematic bias relative to To valuesdetermined using physically larger samples. This bias depends on thedeformation level at fracture. Information is presented herein that can be used tocorrect for this bias. It is important that such a correction be reviewed andballoted by ASTM committee E08 due to the interest of nuclear licensees in usingprecracked CVN specimens removed from surveillance to estimate To.
2. ASME Code Cases N-629 and N-631a. Will KIC and KIR curves indexed using To provide an equivalent implicit margin to
current approaches?: These Code Cases provide a Master Curve-based indextemperature for the KIC and KIR curves that produce implicit margins functionallyequivalent to those historically accepted for RTNDT. The relationship betweenRTTo and To, i.e. F35o
oTo TRT +≡ , is defensible as it bounds a reasonablepercentage of all fracture toughness data now available (97.5%) for a crack frontlength (2.1-in.) that exceeds the great majority of flaws found in RPV fabrication.
In contrast to this substantial progress, Steps 3 and 4 in Table 1 have received little focus todate. Nevertheless, plant-specific Master Curve submittals have moved / are moving forward.In the next section we summarize these submittals, and discusses how each submittal hasaddressed Steps 3 and 4 in Table 1, both of which go beyond the scope of ASTM and ASMEcodes and standards. This discussion is followed by a section concerning the essentialcharacteristics a general framework to estimate the fracture toughness at EOL. Finally, wediscuss recent progress, or lack thereof, toward developing the various components of such ageneral framework.
Plant-Specific Applications of Master Curve Technology
To date the commercial nuclear power industry has brought two submittals before the NRC thatuse the Master Curve to estimate the vessel fracture toughness at EOL and assess compliancewith 10CFR50.61 (i.e., with the PTS Rule). These submittals concerned / concern the licensesof the Zion [Yoon 95] and Kewaunee [Lott 99, Lott 00, Server 00] NPPs‡:
‡ Since the NRC’s response to the Kewaunee submittal is still pending, a detailed discussion is notappropriate at this time. Consequently, reference is made only to information presented at ASMEconferences concerning the Kewaunee submittal.

To be included in NUREG/CP-???? (???. 2001)Proceedings of the 28th Water Reactor Safety Meeting, Rockville Maryland, Oct. 1999
Page 9 of 25
o Zion: In the Zion submittal the licensee sought to use Master Curve technology andfracture toughness data on the limiting vessel material (Linde 80 weld WF-70) toestablish a new un-irradiated value of RTNDT [Yoon 95]. The protocols of 10CFR50.61were then used to estimate the effects of both irradiation and uncertainties on this value,and to establish a PTS screening criteria to compare this value to. The Zion submittaldid not modify 10CFR50.61 protocols to account for the use of Master Curve technologyto estimate RTNDT.
o Kewaunee: In a series of papers concerning the Kewaunee submittal, Lott, et al. outlineseveral strategies to use measured values of To, both un-irradiated and irradiated, toestimate a RTNDT-like quantity at EOL [Lott 99, Lott 00, Server 00]. In developing theseestimation strategies, the authors sought to use To to estimate a RTNDT-like quantity in amanner that parallels and satisfies the intent of current regulations (i.e. 10CFR50.61). Inthe Kewaunee submittal this RTNDT-like quantity was compared to the current PTSscreening criteria [10CFR50.61]
In summary, lacking any established alternative approach, the Zion and Kewaunee submittalsboth align closely with current procedures to estimate the toughness for some future irradiationcondition, and to assess the adequacy of this toughness during a postulated PTS event. Thisapproach invariably leads to assignment of burdensome margins to account for mis-fits, bothreal and perceived, between Master Curve technology and the 10CFR50.61 framework. Weexamine the potential for moving away from this paradigm in the next section.
Table 1. Codes, Standards, and Regulations that Govern the Assessment of FractureToughness for Use in a PTS Analysis.
Step Current Technology Master CurveTechnology
1 Measure a Material Property CVN: ASTM E23NDT: ASTM E208 To: ASTM E1921
2Establish an Index Temperature
and Define a Reference ToughnessCurve
RTNDT
ASME NB-2331
RTTo
ASME N-629 andN-631
Expressed in:10CFR50.61, 10CFR50
APPG, ASME XI-G3
Estimate the Toughness of SomeFuture Irradiation Condition (e.g.,
at EOL)Based on: SECY 82-465, NRC MTEB5.2,
NRC MEMO 82,Randall 87
Not Yet Established
Expressed in:10CFR50.614 Establish a Screening Criteria for
PTS Based on: SECY 82-465
Not Yet Established
Progress Toward a Generic Master Curve Methodology
The information presented in Table 1 points out that factors exist beyond those considered thusfar by ASTM and ASME that need to be addressed to bring Master Curve technology to thepoint that it can be applied routinely to assess nuclear RPV integrity:

To be included in NUREG/CP-???? (???. 2001)Proceedings of the 28th Water Reactor Safety Meeting, Rockville Maryland, Oct. 1999
Page 10 of 25
1. Procedures to estimate the toughness at EOL: These procedures would predict To and/orRTTo for future irradiation conditions from available information (i.e. mechanical properties,chemical properties, fluence), and adjust these estimates to account for variousuncertainties. Toughness is determined through the association of these indextemperatures with fracture toughness transition curves. Reg. Guide 1.99 Rev. 2 describesthe procedures used currently to this end [NRC RG199R2]§. No parallel rule or guidanceexists currently for Master Curve-based methodologies.
2. A PTS screening criteria: This would be a value / values to which a Master Curve-basedestimate of To and/or RTTo at EOL would be compared to assess the suitability of thereactor for operation through EOL. SECY-82-465 establishes the technical basis for thecurrent criteria (300°F for circumferential welds, 270° F for longitudinal welds, plates, andforgings) of 10CFR50.61 [SECY 82465, 10CFR5061]. No parallel rule or guidance existsfor the Master Curve.
In this section we examine the current RTNDT-based procedure to estimate the fracturetoughness at EOL and discuss its role in establishing the current PTS screening criteria. Thisdiscussion provides a perspective on the obstacles that plant specific Master Curve applicationshave encountered in attempts to parallel current procedures. In the following sections we turnattention toward the future research and development achievements needed to eliminate theseobstacles.
The model used to estimate toughness in the PFM calculations that established the current PTSscreening criteria is as follows [SECY 82465]:
)()()( fNDTuNDTfNDT RTRTRT ∆⋅ℜ+= (5)
where
• RTNDT(f) is the estimated RTNDT of the vessel material after irradiation to the fluence f.Toughness is determined from RTNDT(f) through its use as an index temperature for theKIC and KIR curves
• RTNDT(u) can represent either of the following values:o A value of RTNDT in the unirradiated condition based on testing a specific vessel
material in accordance with ASME NB-2331, or , if such measurements areunavailable,
� For Welds: A generic mean value determined from a data set relevant tothe material class of interest. Currently accepted generic mean valuesinclude -56°F for welds made with Linde 0091, 1092, 0124, and ARCOSB-5 welding fluxes, and -5° F for welds made with Linde 80 flux.
� For Plates: If only CVN data are available, as is sometimes the case forplate materials, MTEB-5.2 provides procedures to estimate RTNDT valuesthat are intended to be conservative to (i.e. higher than) RTNDT valuesdetermined using ASME NB-2331 [NRC MTEB52].
§ These procedures find their origins in the work that led up to and provided the technical basis for thecurrent PTS screening criteria [NRC MTEB5.2, NRC MEMO 82, Randall 87, SECY 82-456].Nevertheless, the procedures are applied to estimate toughness not only for use in a PTS assessment(where 10CFR50.61 adopts Reg. Guide 1.99 Rev. 2 procedures and applies them at EOL fluence), butalso as part of the calculations that establish heat-up and cool-down limits for routine operation[10CFR50 APPG, ASME XI-G].

To be included in NUREG/CP-???? (???. 2001)Proceedings of the 28th Water Reactor Safety Meeting, Rockville Maryland, Oct. 1999
Page 11 of 25
• ∆RTNDT(f) is the mean value of the irradiation induced transition temperature shift, and iscalculated as follows:
)log1.028.0(
)()( f
fNDTfCFRT −=∆ (6)
∆RTNDT(f) can represent either of the following values:o It is the mean value of the of this shift for the material samples tested as part of
the credible surveillance program, or , if the surveillance data is not deemed to becredible,
o It is the mean value of this shift for a material having the composition (Cu and Ni)corresponding to the heat average for the entire heat of material in question.
In the former case, when credible surveillance data is used to establish ∆RTPTS, thevalue ℜ adjusts ∆RTPTS to account for differences between the chemical composition ofthe surveillance material and the heat average chemical composition. ℜ represents the“ratio procedure” as described in 10CFR50.61(2)(ii)(B). ℜ is defined as the chemistryfactor (CF) for the best estimate composition of the heat divided by the chemistry factorfor the specific composition of the surveillance weld. Tables in 10CFR50.61 definechemistry factors based on material product form, Cu, and Ni.
Natishan and co-workers have recently developed a diagrammatic representation of eq. (5), Fig.5, which illustrates how the value of an input parameter (e.g. Cu, Ni, φt, CVN, NDT, etc.) “flows”through eq. (5) to produce an estimate of the value of RTNDT after irradiation to EOL fluence [Li00]. Thus, in addition to its use in determining the PTS screening criteria, eq. (5) alsoestablishes the variability in estimates of RTNDT(f) that are compared to this screening criteria.This amount of variability, often called a “Margin,” is traditionally added to the estimate ofRTNDT(f) as follows [NRC RG199R2]:
MRTRTRT fNDTuNDTfNDT +∆⋅ℜ+= )()()( (7)
222 ∆+= σσ IM (8)
where
• σI is the standard deviation in the value of RTNDT(u). It can represent either of thefollowing values:
o σI is “determined from the precision of the test method” if RTNDT(u) is establishedeither (a) by testing the specific vessel material in accordance with ASME NB-2331, or (b) by MTEB-5.2 procedures. While not explicitly stated in 10CFR50.61,a value of σI = 0°F is used in this situation.
o If a measured value of RTNDT(u) is not available, σI is the standard deviation of thedata set used to establish the generic mean value of RTNDT(u). The most commonvalue of in this situation is 17° F [NRC MEMO 82]. This value applies to weldsmade with Linde 0091, 1092, 0124, ARCOS B-5, and Linde 80 welding fluxes.Other values, like 26.9°F for B&W plate materials have also been establishedand are recorded in RVID.
In both cases the sum {RTNDT(u) + 2σI} represents a bounding value of RTNDT beforeirradiation. When RTNDT is determined according to ASME NB-2331 or MTEB-5.2, theseprotocols produce a bounding estimate, so σI can be zero. However, when a mean

To be included in NUREG/CP-???? (???. 2001)Proceedings of the 28th Water Reactor Safety Meeting, Rockville Maryland, Oct. 1999
Page 12 of 25
value of RTNDT is used then 2σI =34° F needs to be added to produce a boundingestimate.
• σ∆ is the standard deviation in the value of ∆RTPTS. It can represent either of thefollowing values:
o If credible surveillance data is not available, the σ∆ values are 28° F for weldsand 17°F for plates
o If credible surveillance data is available, the σ∆ values are 14° F for welds and8.5°F for plates.
These observations illustrate that the main difficulty faced by plant specific Master Curveapplications has been the lack of an accepted framework by which to estimate the irradiatedfracture toughness of the vessel from To data (i.e. a version of eq. (5) for To), and the fact thatthis framework was never used to establish a PTS screening criteria for To. Consequently, thereis currently no To-based PTS screening criteria, and there is no To-based margin term (i.e. aneq. (8) for To) based on uncertainty in the input variables. Beyond these general difficulties, theZion and Kewaunee submittals have encountered certain specific concerns in their attempts toparallel eqs. (7) and (8), as follows:
1. Zion: If an un-irradiated To is used and shifted using the Reg. Guide 1.99 Rev. 2 fluencefunction, concerns have arisen regarding the appropriateness of applying a CVN-basedshift to fracture toughness data.
2. Kewaunee: With the current methodology, the toughness after irradiation can only beestimated from the sum of an un-irradiated reference temperature and an irradiation-induced shift in the reference temperature. Direct measurement of the irradiatedtransition temperature was not considered when the calculations that support the currentPTS rule were adopted. Consequently, this approach currently lacks an establishedbasis to account for differences between the composition of the surveillance samplesand the composition of the material in the vessel. The existing Ratio procedure operateson the irradiation-induced shift in the transition temperature, not on its absolute value,making the proper application of this procedure to an irradiated transition temperatureunclear.
Ultimately there is the nagging concern that forcing Master Curve-technology into the current,non-Master Curve, framework may produce systemic “lack of fit” uncertainties, thereby resultingin the need for higher margins. The only way to alleviate this concern is to establish a MasterCurve framework to estimate toughness at EOL, and use this framework as part of the PFMcalculations to establish a PTS screening criteria applicable specifically to Master Curve-basedestimates of fracture toughness. Work on the development of such a framework for the MasterCurve has only recently begun [Natishan 00]. In the following sections we review recentprogress in the developing some of the components of such a framework, including:
1. Generic values of To for use when plant specific data is unavailable2. Irradiation damage effects on To (Irradiation trend curves)3. Treatment of the newly recognized linkage between fracture toughness and crack front
length.4. Treatment of the loading rate effect on fracture toughness to establish the position of the
crack arrest curves used in establishing the PTS screening criteria.

To be included in NUREG/CP-???? (???. 2001)Proceedings of the 28th Water Reactor Safety Meeting, Rockville Maryland, Oct. 1999
Page 13 of 25
ÿþýüûúùø÷öúõôóòõþ÷
���üûúùø�ô��ô�ø�þ�ûüúøûò
�öùú�þ
�ù�õü�ú÷ùø
���üûúùø�ô��ü�û
ÿþýüûúùø÷öúõôóòõþ÷
���üûúùø�ô��ô�ø�þ�ûüúøûò
�öùú�þ
�ù�õü�ú÷ùø
���üûúùø�ô��ü�û
ÿ�������������
�� �������������
�� �����������
∆� �����������
�����
����
������������������������
�
�����
�����ÿ���
����� �� ������ ������
� ���������� ��
�
�
��
Epistemic
� �������
����������������������������
EpistemicEpistemic
� �������� �������
��������������������������������������������������������
�
���������
��� ������
��
��� ���������� ������������������
�� ��°��� ������
����������� ��� ���������� ����
���������������� ���°��
��������
������������������������������� ��� � ����
� ���
���� ô� øýò�
� üûý��
� � ����ô� ��� ô�ý��
� � ����ý�ô��
ó��
�°°°°�ó����ÿô� � ���
��°°°°�
�
� üûüôüûô� øþóþ�õ�ôûùô�ùø�ú��ôó��
ó��ô� úøú���
óóþ÷û���°°°°�
ó�üø÷�þ�÷þ� õþ�ú�þø÷
� ùûôóþ÷ûþ�
ó������������°°°°��
� øò
�üý��ýüûþô��� �����ûöþøô� þûþ��úøþôó���������
{ }F60,MAX )50,35(�−= CVNDTNDT TTRT
�� � �
�� ��
�� � �
�
∆∆∆∆ó�� � ô�� ��þ÷û
�÷ûú�üûþ
ÿüûúùô� ���÷û�þøû
��ô� þüû�þ÷ûô�÷û�
��ô� ����
���ü�úüûúùøóþ�õþ�üû��þ� ���÷û�þøû�∆∆∆∆ó���ü�úüûúùø�
�� �ô�ý�þø�þ
óÿ���ù�ôúøû��
ó÷���
��
� ú
��
� ú
∆∆∆∆ó��
��ù���ûô�ù��
��� ���þúýýüø�þ
�
��
��
��
��
��
� ú��
�þ÷�ôüø���þ�ú�ýþ
� ù�ôù�� ���þúýýüø�þôøùûô��þ�ú�ýþ
øô�üú�÷ôù�ô�∆∆∆∆ó���ô�ý�þø�þ�
�� ��ý�þø�þ
ó���ø����ü�úüûþ�
øô���ü�úüûþ�ó�� � þü÷��þ�þøû÷ô
���
��
��
��
�� ( ) )log1.028.0(30 )( ttCFT φφ −=∆
CF tables from 10CFR50.61
& ��
( ) )log1.028.0(30
ttT φφ −∝∆
nIrradiatioEstimateBest TTT ∆+∆⋅ℜ=∆ −|3030��
��
��
�� ( ) )log1.028.0(30 )( ttCFT φφ −=∆
CF tables from 10CFR50.61
& ��
( ) )log1.028.0(30
ttT φφ −∝∆
nIrradiatioEstimateBest TTT ∆+∆⋅ℜ=∆ −|3030
( )ℜ
���
���
Figure 5. Root cause diagram illustrating the methodology used currently to estimate thefracture toughness of a reactor pressure vessel steel after irradiation [Li 00].

To be included in NUREG/CP-???? (???. 2001)Proceedings of the 28th Water Reactor Safety Meeting, Rockville Maryland, Oct. 1999
Page 14 of 25
Generic Values of To
Current RTNDT-based procedures provide generic values of un-irradiated RTNDT for use whenmaterial specific information is not available. Similar generic values of RTTo will most likely beneeded as part of a Master Curve methodology that is usable by all plants. Here we use a largecollection of fracture toughness values [Rosinski 99] to establish candidate generic RTTo valuesby the following procedure:
1. The database is queried to identify all fracture toughness data available for a particularclass of RPV materials. Here we consider classes defined by flux type (for welds) andby ASTM material specification (for plates and forgings).
2. The fracture toughness values are normalized to a 2.1-in. thickness using the followingweakest-link relationship included in ASTM E1921-97:
( )4/1
min)(min)1.2( 1.2
−+= B
KKKK measuredJcTJc(9)
A “size” of 2.1-in. is selected to maintain consistency with the average size associatedwith the original KIC database used to establish the relationship between KIC data andRTNDT for the current ASME KIC curve [Marston 87].
3. These size-normalized fracture toughness values are plotted vs. test temperature. A KIC
curve, i.e.
( )[ ]1000198.0exp81.22.33 )( +−⋅⋅+= genericToIC RTTK , (K in ksi √in, T in °F) (10)
is then plotted, and the value of RTTo(generic) is adjusted position the curve so that it bounds97.5% of the fracture toughness values in fracture mode transition. While in principal anytolerance bound can be selected, we selected a 97.5% value to maintain consistency with howa RTTo positioned KIC curve bounds the original KIC data set [Wallin 97].
Fig. 6 illustrates this procedure for A533B Cl. 1 plate and for Linde 80 welds, while Table 2summarizes RTTo(generic) values for the different RPV material classes. This procedure toestablish generic values of RTTo incorporates the material uncertainty within the class into thevalue of RTTo(generic) by basing the position of the 97.5% tolerance bound curve on fracturetoughness data for a number of different heats from the same material class. Consequently, ifthese values of RTTo(generic) are used in a plant assessment, a non-zero uncertainty term(equivaluent to σI in the current methodology) should not be used.
Table 2. Generic RTTo values for different classes of nuclear RPV materials
Material Class RT To(Generic) [oF]Total Number of
KJc Values
Number of K Jc
Values notBounded
% Bounded
A508 Cl. 2 -14 38 0 100.0%A508 Cl. 3 -42 606 15 97.5%A302B 14 58 1 98.3%A302B Mod. -39 26 0 100.0%A533B Cl. 1 18 1481 36 97.6%Linde 0091 2 71 1 98.6%Linde 0124 -25 178 4 97.8%Linde 1092 -151 148 3 98.0%Linde 80 -34 213 5 97.7%

To be included in NUREG/CP-???? (???. 2001)Proceedings of the 28th Water Reactor Safety Meeting, Rockville Maryland, Oct. 1999
Page 15 of 25
0
100
200
300
400
500
-400 -250 -100 50 200
Temperature [ oF]
2.1-
TE
quiv
alen
tK
Jc[k
si*i
n0.
5 ]
KIC with RTTo = -34oF
Linde 80
Figure 6. Use of fracture toughness data for A533B Cl. 1 (left) and for Linde 80 (right) toestablish generic values of RTTo.
Estimate of Irradiation Damage Effects on To
As expressed by eq. (5), the current technique for estimating the transition temperature afterirradiation is to add an irradiation shift to an un-irradiated transition temperature value. The shiftin the CVN transition temperature at 30 ft-lbs is currently calculated from fluence andcomposition using the following formula [NRC RG199R2]:
)log1.028.0(30 )( ffCFT −=∆ (11)
Here the CF (chemistry factor) expresses the aggregate effect of Cu, Ni, and product form onirradiation sensitivity. Reg. Guide 1.99 Rev. 2 includes tables of CF values for a range ofcompositions. The form of the fluence function in eq. (11), i.e. )log1.028.0( ff − , was established bycurve-fitting a database of 177 ∆T30 values [Randall 87]. In Master Curve-based applications, aquestion arises regarding the appropriate form of the shift equation for To. Since the irradiationshifts in both Charpy and fracture toughness transitions are largely controlled by increases ofmaterial flow strength produced by irradiation, it seems reasonable that the fluence function forshifts of Charpy transition temperature might model shifts in the fracture toughness transitiontemperature (i.e. To) as well. Sokolov and Nanstad compared irradiation shifts of both CVNenergy and fracture toughness transition [Sokolov 96]. This comparison (see Fig. 7) showed a1:1 correlation for welds (42 data points). Conversely, examination of 47 plate materials showsthat irradiation shifts the fracture toughness transition temperature 16% more than it does theCVN transition temperature. In both cases the relationship between the two transitiontemperatures was linear. More recently, Onizawa and Suzuki presented results demonstratinga nearly 1:1 correlation (∆To = 1.03⋅ ∆T30) for 4 extensively characterized plates [Onizawa 00].Also Kirk et al. compared available data on To shifts produced by irradiation to the functionalform of eq. (11) (see Fig. 8). Figures 7 and 8 both suggest that the Reg. Guide 1.99 (Rev. 2)fluence function provides a reasonable description of the shift in To produced by irradiation.
These results are encouraging. However, the high cost of irradiated material testing will likelypreclude development of a sufficiently well populated database of To shift values to eitherdirectly develop a To-based irradiation trend curve, or even to test empirically the
0
100
200
300
400
500
-400 -250 -100 50 200
Temperature [ oF]
2.1-
TE
quiv
alen
tK
Jc[k
si*in
0.5 ]
KIC with RTTo = 18oF
A533B Cl. 1

To be included in NUREG/CP-???? (???. 2001)Proceedings of the 28th Water Reactor Safety Meeting, Rockville Maryland, Oct. 1999
Page 16 of 25
appropriateness of eq. (11) for the conditions of interest. Consequently, resolution of this issuecould rest with establishing a sound basis for why To and CVN shifts should be the same, or atleast related. Existence of such a rationale, which is not currently being investigated, wouldpave the way for establishing the appropriate functional form for To shifts based on extensivedatabases of CVN shifts values that are now available [Eason 98].
Figure 7. Comparison of irradiation induced CVN and To shifts for nuclear RPV welds andbase materials [Sokolov 96].
All ∆∆∆∆RTTo Values
Normalized to CF = 100 oF
0
50
100
150
200
0 1 2 3 4 5 6
Fluence (x 1x10 19) [n/cm 2]
∆∆ ∆∆R
TT
o*
100
/CF
[oF
]
80 weld 0091 weld
0124 weld Plate
CF = 100F
ÿ
Fluence (/ 1x10 19) [n/cm 2]
Figure 8. Variation of ∆RTTo with fluence, and comparison with Reg. Guide 1.99 Rev. 2fluence function developed to describe trends in Charpy V-Notch data [Kirk 99].

To be included in NUREG/CP-???? (???. 2001)Proceedings of the 28th Water Reactor Safety Meeting, Rockville Maryland, Oct. 1999
Page 17 of 25
The Effect of Crack Front Length on To
The Master Curve incorporates the following relationship between fracture toughness and thelength of the crack front based on a weakest-link model of cleavage fracture under small scaleyielding conditions:
( )4/1
1
2min)2(min)1(
−+=
Size
SizeSizeJcSizeJc B
BKKKK (12)
Here, Kmin = 20 MPa √m and represents the value of applied KI below which cleavage fracture isnot possible. The subscripts “Size1” and “Size2” refer to toughness (K) or thickness (B) valuesfor two different specimen thicknesses. Eq. 12 applies to straight-fronted cracks in a state ofsmall scale yielding. It predicts a decline in fracture toughness with increasing crack frontlength, a prediction in accord with considerable experimental evidence for fracture testspecimens [Kirk 98a, Rathbun 00]. Eq. (12) represents a significant departure from currentASME code practice that treats toughness and crack front length as independent variables.
The practice of positioning a bounding curve relative to fracture toughness data addresses theeffect of crack front length on toughness. This practice implicitly links to the bounding curve thecrack front length(s) characteristic of the fracture toughness data used to establish its position.Thus, both RTNDT and RTTo indexed KIC curves have the same implied crack front lengthbecause the original KIC data set [Marston 87] provided the basis for positioning both curves.However, once a fracture assessment methodology used the Master Curve directly rather thanjust using To to position a bounding curve, explicit procedures to determine the effect of crackfront length on fracture toughness will be needed. Since vessels contain either embeddedelliptical flaws or semi-elliptical surface breaking flaws, this methodology will need to treat crackfront length effects, and address their interaction with loss of constraint effects, for non-straightfronted cracks. Fig. 9(a) compares cleavage fracture toughness data for semi-elliptical surfacecracks in A515 steel with a Master Curve for this material [Joyce 97b, Porr 95]. Thiscomparison illustrates that the relationship between crack front length and fracture toughnessthat works so well for straight fronted cracks in fracture toughness specimens, eq. (12), placesdata for part-through surface cracks too high relative to the standard Master Curve. In Fig. 9(b)these data are brought into agreement with the Master Curve by using only 20% of the totalcrack front length of the past-through surface cracks when calculating their equivalent 1Tfracture toughness.
The analysis presented in Fig. 9 is a very rudimentary. It fails to discriminate between thevariable-KI field around the crack front or loss of full constraint where the crack front intersectsthe free surface as the cause of this change in the scaling relationship. Nevertheless, theanalysis does suggest that, whatever the cause, only a small fraction of the crack front length ina non-straight fronted crack contributes significantly to the probability of cleavage fracture. Toenable application of the Master Curve to structures, a form of eq. (12) that addresses non-straight fronted fatigue cracks, and can treat both statistical size effects and constraint effects, isneeded. Several on-going research programs address this goal using Weibull models coupledwith 3D elastic-plastic finite element analysis to predict fracture the conditions for crack initiationfrom semi-elliptical surface cracks [Gao 99, Bass 00b]. Ultimately, these efforts will need toboth provide a predictive model and assess the breadth of material / irradiation / loadingconditions to which the model applies.
Non-straight fronted cracks are considered in reactor pressure vessel integrity analysis in thefollowing three areas:

To be included in NUREG/CP-???? (???. 2001)Proceedings of the 28th Water Reactor Safety Meeting, Rockville Maryland, Oct. 1999
Page 18 of 25
1. Flaw specific-assessments performed according to ASME Section XI (IWB-3500, IWB-3600),
2. PTS analysis as described in 10CFR50.61 and performed in accordance with RegulatoryGuide 1.154, and
3. Calculation of permissible limits on heat-up and cool-down performed in accordance withASME Section XI Appendix G.
In the first two cases, the flaws used in the calculations represent flaws that exist, or could existin an operating RPV. Thus, a technical resolution of the effect of crack front length on fracturetoughness should provide an appropriate analysis methodology for these calculations.Conversely, heat-up and cool-down curves are calculated for a postulated flaw that penetratesone-quarter of the way through the reactor pressure vessel wall and has a 6:1 ratio of surfacebreaking length to depth. This size of this flaw exceeds considerably that observed in anyoperating RPV (an 8-in. thick vessel this flaw would have a crack front length of 14-in.), makingthe flaw size a conservatism implicit to this analysis methodology. Thus, before the MasterCurve can be used for Appendix G analyses, a reconciliation of the ¼-T flaw methodology andthe Master Curve approach is needed.
Figure 9. Comparison of data for part through surface cracks to a 1T equivalent MasterCurve [Joyce 97b, Porr 95]
The Effect of Loading Rate on To
Because the postulated failure of a RPV would likely involve a rapidly propagating crack, thefracture integrity assessment methodology needs to account for the effect of loading rate onfracture toughness. Rate effects enter the methodology via the separation between the staticand dynamic fracture toughness curves. This separation is currently fixed irrespective of eitherthe loading rate differential between the two curves, or the strength level / degree of irradiationof the material in question [Yoon 99]. Nevertheless, empirical evidence abounds that bothloading rate and material strength influence the fracture toughness transition temperature[Barsom 87].
Surface crack K Jc valuesscaled to 1T using the
total crack front length.
0
50
100
150
200
250
-100 -50 0 50 100T-T o [oF]
1TE
quiv
.K
Jc[k
si*in
0.5 ]
Link, Bending, 0.25 x 1.4
Link, Tension, 0.25 x 1.4
Porr, Bending, 0.5 x 3.0
Porr, Bending, 0.5 x 1.4
1T Master Curve w /5%/95% Bounds
Surface crack K Jc valuesscaled to 1T using 20% of the
total crack front length.
0
50
100
150
200
250
-100 -50 0 50 100T-T o [oF]
1TE
quiv
KJc
[ksi
*in
0.5 ]
Link, Bending, a=0.25 x 2c=1.4
Link, Tension, 0.25 x 1.4
Porr, Bending, 0.5 x 3.0
Porr, Bending, 0.5 x 1.4
1T Master Curve w / 5%/95%Bounds
2c
a
2c
a

To be included in NUREG/CP-???? (???. 2001)Proceedings of the 28th Water Reactor Safety Meeting, Rockville Maryland, Oct. 1999
Page 19 of 25
-150 -100 -50 0 500
50
100
150
200
250
95 %5 %
72W TKIa
=-13 oC
72W Irr. TKIa
=+76 oC
73W TKIa
=-14 oC
73W Irr. TKIa
=+70 oC
PTSE 1 TKIa
=+108 oC)
PTSE 2 TKIa
=+70 oC
15X2MØA T KIa=+17 oC
18X2MØA TKIa
=+47 oC
HSST 02 TKIa
=+24 oC
KIa
[MP
a√√ √√m
]
T-TKIa [°°°°C]
σσσσ = 18 %
Figure 10. Crack arrest Master Curve proposed by Wallin [Wallin 98b].
Currently the ASME KIR curve represents the lower-bound toughness for both crack initiation atan elevated loading rate, and for crack arrest. In a PTS calculation, a vessel is not consideredto have “failed” unless an initiated crack cannot be arrested [Dickson 95]. Absent a change inthis definition of vessel failure, treatment of crack arrest will be part of any comprehensive RPVintegrity assessment strategy. While crack initiation at elevated loading rates fits well within theMaster Curve framework, the same weakest link model used to characterize crack initiationclearly cannot describe crack arrest. Crack arrest will not occur until the local driving force forcontinued crack propagation falls below the local material arrest toughness over a significantportion of the propagating crack front [Wallin 98b]. The requirements for crack arrest aretherefore controlled by a distributed process on the micro-scale, in contrast to crack initiation,which is controlled by local properties. This simple model suggests that the scatter in crackarrest toughness values should be less than for crack initiation toughness values, and that crackarrest toughness should not exhibit a statistical size effect. A recent analysis by Wallin bearsout these expectations. In an examination of nine different sets of crack arrest data (sevendrawn from HSST/HSSI program records) Wallin demonstrated that crack arrest data aredistributed log-normally about a mean curve that has the same temperature dependence as theMaster Curve (see Fig. 10).
This similarity between the temperature dependence of initiation and arrest toughness suggeststhe possibility of describing the position of the arrest toughness curve in terms of a shift from theposition of static initiation toughness curve, e.g. as a shift relative to To. Wallin examined thispossibility using 55 sets of data for ferritic steels that included a variety of product forms,strength grades, and irradiation conditions [Wallin 98b]. Based on a statistical analysis of thesedata Wallin developed the following shift equation:
+
+−=∆=−868.0915.0
0)()()( 4.5722.119
27398.4exp y
arrestostaticoarrestoT
TTTσ
(13)
where To is in °C and σy is the static room temperature yield strength in MPa**.
** Wallin has also published a correlation, based on analysis of 59 data sets, that permits estimation ofthe temperature shift between a static and dynamic crack initiation toughness curves [Wallin 97b]:
Log Normalσσσσ = 18%⋅⋅⋅⋅ KIA(mean)

To be included in NUREG/CP-???? (???. 2001)Proceedings of the 28th Water Reactor Safety Meeting, Rockville Maryland, Oct. 1999
Page 20 of 25
ASME Code Cases N-629 and N-631 propose using RTTo as an index temperature for both theKIC and KIR curves, thereby maintaining the traditional fixed separation between these curves.Fig. 11 demonstrates that this procedure will produce a bounding estimate of crack arresttoughness provided the separation between the median curves for static initiation and crackarrest toughness falls below 95° F. In Fig. 12 we use eq. (13) determine the conditions for whichseparations of less than 95° F occur. This comparison is made over the range of To valuesobserved for irradiated and un-irradiated RPV steels using mean yield strength values for theseconditions (un-irradiated = 69 ksi, irradiated = 90 ksi) taken from the database (Appendix A).While only cursory in nature, this analysis suggests that the Code Case N-629 proposalprovides a bounding curve for plants approaching their end of license (i.e. To > 140° F). Thus,the Code Case proposal appears to provide an adequate approach for assessment of EOLconditions (and thereby PTS).
While the correlations presented in this section provide a useful summary of the trends exhibitedby available data, they cannot replace a more fundamental, physically based, understanding ofwhy such trends should occur. The absence of such an understanding raises questionsregarding the limits of applicability of these relationships, thereby impeding progress in theapplication of Master Curve concepts in nuclear RPV integrity assessment.
SUMMARY AND CONCLUSIONS
The information provided in this paper demonstrates that substantial progress has been maderecently concerning the adoption of a Master Curve testing standard, and the use of the To-index temperature measured by this standard to position bounding fracture toughness curvesfor use in vessel integrity calculations. Questions raised previously by the Staff regarding theuse of Master Curve technology in these codes and standards are now largely resolved. Themain difficulty faced when using the Master Curve to assess RPV integrity is now the lack of anaccepted framework by which to estimate the irradiated fracture toughness of the vessel from To
data, and the fact that this framework was never used to determine a PTS screening criteria forTo. Consequently, there is currently no To-based PTS screening criteria, and there is no To-based margin term to account for uncertainty in the input variables. Ultimately thesedeficiencies fuel a concern that forcing Master Curve-technology into the current, non-MasterCurve, framework may produce systemic “lack of fit” uncertainties, thereby resulting in the needfor higher margins. The only way to alleviate this concern is to establish a Master Curveframework to estimate toughness at EOL, and use this framework as part of PFM calculations toestablish a PTS screening criteria applicable specifically to Master Curve-based estimates offracture toughness. Work on the development of such a framework for the Master Curve hasonly recently begun. In this paper we reviewed recent progress in the developing some of thecomponents of such a framework, including the following:
)IKln(
)IK(lno(static)T
o(dynamic)T�
�
−Γ
⋅=∆ ,
+
+⋅=Γ
1.09
722y
1.66
190
273o(static)Texp9.9
σ
Differences in strain rate between crack initiation and crack arrest suggest that ∆To(arrest) will alwaysexceed ∆To(dynamic). Furthermore, PTS events do not usually produce rapid mechanical loading rates.Consequently, we focus exclusively on crack arrest in this discussion.

To be included in NUREG/CP-???? (???. 2001)Proceedings of the 28th Water Reactor Safety Meeting, Rockville Maryland, Oct. 1999
Page 21 of 25
1. Generic values of RTTo are provided for use when plant- or material-specific values ofRTTo are not available.
2. Data is provided that demonstrates a 1:1 correlation between the irradiation shift of theCharpy-V and To transition temperatures. This information suggests the possibility ofapplying embrittlement trend curves developed from CVN data to estimate the effect ofirradiation on To.
3. Available data suggests that weakest link scaling models developed for straight frontedcracks in test specimens systematically under-predict the fracture resistance of the semi-elliptical and buried cracks found in reactor pressure vessel service.
4. ASME Code Case N-629 uses RTTo to position both the KIC and KIR curves with a fixedtemperature separation between them. Information presented in this paperdemonstrates that this fixed separation under-estimates the crack arrest toughness ofRPV steels in some circumstances, and over estimates it in others. This findingsuggests that a revision of the Code Case is needed to ensure that the KIR curveprovides an appropriate degree of bounding to crack arrest data for all materialconditions of interest.
These findings provide cause for optimism that the issues surrounding application of MasterCurve-based methodologies to the assessment of nuclear reactor vessel safety can befavorably resolved providing focused efforts continue in a number of key areas.
0
50
100
150
200
-150 -75 0 75 150 225 300
T - T o [oF]
KIC
[ksi
*in
0.5 ]
0
50
100
150
200
KIC
[ksi
*in
0.5 ]
KIC CurvePositioned
with a N-629RTTo Value
5%/95%Tolerance
Bounds on 1TMaster Curve
KIR CurvePositioned
with a N-629RTTo Value
5%/95% Tolerance Boundson Crack Arrest Curve
Shifted95oF
from To
0
50
100
150
200
-150 -75 0 75 150 225 300
T - T o [oF]
KIC
[ksi
*in
0.5 ]
0
50
100
150
200
KIC
[ksi
*in
0.5 ]
KIC CurvePositioned
with a N-629RTTo Value
5%/95%Tolerance
Bounds on 1TMaster Curve
KIR CurvePositioned
with a N-629RTTo Value
5%/95% Tolerance Boundson Crack Arrest Curve
Shifted95oF
from To
Figure 11. Illustration of the largest shift between a static initiation toughness curve (MasterCurve) and a crack arrest toughness curve that will be bounded by a KIR curvelocated using RTTo.
( )[ ]1000198.0exp81.22.33 +−⋅⋅+= ToIC RTTK
( )[ ]16001456.0exp233.178.26 +−⋅⋅+= ToIR RTTK

To be included in NUREG/CP-???? (???. 2001)Proceedings of the 28th Water Reactor Safety Meeting, Rockville Maryland, Oct. 1999
Page 22 of 25
0
25
50
75
100
125
150
-250 -150 -50 50 150 250
T o (Static) [ oF]
To
Shi
ft[o
F]
Arrest, Sy = 69 ksi (Un-Irr)
Arrest, Sy = 90 ksi (Irr)
Arrest predictedconservativelyBy ASME N-629 / N-631
0
25
50
75
100
125
150
-250 -150 -50 50 150 250
T o (Static) [ oF]
To
Shi
ft[o
F]
Arrest, Sy = 69 ksi (Un-Irr)
Arrest, Sy = 90 ksi (Irr)
Arrest predictedconservativelyBy ASME N-629 / N-631
Figure 12. The shift in transition temperature between a static initiation toughness curve(Master Curve) and a crack arrest toughness curve [Wallin 98b].
REFERENCES
10CFR5061 Code of Federal Regulation 10CFR50.61, “Fracture Toughness Requirements forProtection Against Pressurized Thermal Shock Events.”
10CFR50 App. G Code of Federal Regulation 10CFR50 Appendix G, “Fracture Toughness Requirements{for Normal Operation}.”
ASME NB2331 ASME NB-2331, 1998 ASME Boiler and Pressure Vessel Code, Rules for Constructionof Nuclear Power Plants, Division 1, Subsection NB, Class 1 Components
ASME N629 ASME Boiler and Pressure Vessel Code Case N-629, “Use of Fracture Toughness TestData to Establish Reference Temperature for Pressure Retaining Materials, Section XI,Division 1,” 1999.
ASME N631 ASME Boiler and Pressure Vessel Code Case N-631, “Use of Fracture Toughness TestData to Establish Reference Temperature for Pressure Retaining Materials Other ThanBolting for Class 1 Vessels Section III, Division 1,” 1999.
ASME XI-G ASME Section XI, Appendix G.ASTM E23 ASTM E23, “Standard test Methods for Notched Bar Impact Testing of Metallic
Materials,” ASTM, 1998.ASTM E185 ASTM E185-94, “Standard Practice for Conducting Surveillance Tests for Light-Water
Cooled Nuclear Power Reactor Vessels,” ASTM, 1998.ASTM E208 ASTM E208, “Standard Test Method for Conducting Drop-Weight Test to Determine
Nil-Ductility Transition Temperature of Ferritic Steels,” ASTM 1998.ASTM E399 ASTM E399, “Test Method for Plane-Strain Fracture Toughness Testing of Metallic
Materials,” ASTM, 1998.ASTM E1921 ASTM E1921-97, “Test Method for Determination of Reference Temperature, To, for
Ferritic Steels in the Transition Range,” ASTM, 1998.Barsom 87 Barsom, J.M., and Rolfe, S.T., Fracture and Fatigue Control in Structures, Applications
of Fracture Mechanics, Prentice Hall, 1987.Bass 00 B. R. Bass, P. T. Williams, T. L. Dickson, J. G. Merkle, and R. K. Nanstad,
“Investigation of Model Uncertainty in the Reference Nil-Ductility TransitionTemperature RTNDT,” 1 Sep 2000 presentation.
Bass 00b Bass, B.R., et al., “Research Results Supporting Enhanced Fracture Analysis Methodsfor Nuclear Reactor Pressure Vessels,” NUREG/CR-6657, September 2000.

To be included in NUREG/CP-???? (???. 2001)Proceedings of the 28th Water Reactor Safety Meeting, Rockville Maryland, Oct. 1999
Page 23 of 25
Bowman 00 Bowman, K.O. and Williams, P.T., “Technical Basis for Statistical Models of ExtendedKIC and KIA Fracture Toughness Databases for RPV Steels, ORNL/NRC/LTR-99/27,February 2000.
Dickson 95 Dickson, T.L., “An Overview of FAVOR: A Fracture Analysis Computer Code ForNuclear Reactor Pressure Vessels,” Transactions of the 13th International Conferenceon Structural Mechanics in Reactor Technology (SMiRT 13), Vol. IV, pp. 701-706,Porto Alegre, Brazil, August 13-18, 1995.
Dickson 00 Dickson, T.L. and Malik, S.N.M., “An Updated Probabilistic Fracture MechanicsMethodology for Application to Pressurized Thermal Shock,” Proceedings of the IAEASpecialists Meeting on Methodology and Supporting Research for the PressurizedThermal Shock Evaluation, July, 2000 – Rockville, MD, USA.
Eason 87 Eason, E.D., Wright, J.E., and Odette, G.R., “Improved Embrittlement Correlations forReactor Pressure Vessel Steels,” NUREG/CR-6551, 1998.
Gao 99 Gao, X., Dodds, R., Tregoning, R., Joyce, J., and Link, R., “Cleavage Fracture inSurface Cracked Plates: Experiments and Numerical Predictions,” Proc. of the 1999ASME Pressure Vessel and Piping Conference, ASME, July 1999.
Joyce 97b Joyce, J.A., and Link, R.E., “Ductile-to-Brittle Transition Characterization using SurfaceCrack Specimens Loaded in Combined Bending and Tension,” Fatigue and FractureMechanics: 28th Volume, ASTM STP 1321, J.H. Underwood, B.A. MacDonald, andM.R. Mitchell, Eds., American Society for Testing and Materials, 1997.
Kirk 98a Kirk, M., Lott, R., Kim, C., and Server, W., “Empirical Validation Of The Master CurveFor Irradiated And Unirradiated Reactor Pressure Vessel Steels,” Proceedings of the1998 ASME/JSME Pressure Vessel and Piping Symposium, July 26-30, 1998, SanDiego, California, USA.
Kirk 99 Kirk, M., Lott, R., Server, W., and Rosinski, S., “Initial Reference Temperatures andIrradiation Trend Curves for use with RTTo, A Preliminary Assessment,” Proc. of the1999 ASME Pressure Vessel and Piping Conference, ASME, July 1999.
Kirk 00a Kirk, M and Mitchell, M., “A Review Of Technical And Regulatory DevelopmentsNeeded To Enable Application Of Master Curve Technology To The Fracture IntegrityAssessment Of Commercial Nuclear Power Reactors,” Proc. of the 2000 ASMEPressure Vessel and Piping Conference, ASME, July 2000.
Kirk 00b Kirk, M.T., Natishan, M.A.E., M. Wagenhofer, “Microstructural Limits of Applicability ofthe Master Curve,” 32nd Volume, ASTM STP-????, R. Chona, Ed., American Societyfor Testing and Materials, Philadelphia, PA 2001.
Kirk 00e Kirk, M.T., “The Technical Basis for Application of the Master Curve to the Assessmentof Nuclear Reactor Pressure Vessel Integrity”, Draft NUREG, In Review, October 2000.
Li 00 Li F., Modarres M., Natishan M., and Mosleh A., “KIc/KIa Uncertainty Characterization,”Proceedings of the IAEA Specialists Meeting on Methodology and SupportingResearch for the Pressurized Thermal Shock Evaluation, July, 2000 – Rockville, MD,USA.
Lott 99 Lott, R., Kirk, M., Kim, C., Server, W., Tomes, C., and Williams, J. “Application ofMaster Curve Technology to Estimation of End of License Adjusted ReferenceTemperature For a Nuclear Power Plant,” Proc. of the 1999 ASME Pressure Vesseland Piping Conference, ASME, July 1999.
Lott 00 R.G. Lott, C.C. Kim, W. Server, and C.A. Tomes, “Margins Assessment for ApplyingMaster Curve-Data to High Copper Welds,” Proc. of the 2000 ASME Pressure Vesseland Piping Conference, ASME, July 2000.
Marston 78 Marston, T.U., “Flaw Evaluation Procedures, Background and Application of ASMESection XI Appendix A,” EPRI Report NP-719-SR, Electric Power Research Institute,1978.
Mayfield 97 Mayfield, M.E., et al., “Application of Revised Fracture Toughness Curves in PressureVessel Integrity Analysis,” Paper #106, SMIRT Conference, Lyon, France, August1997.
To be included in NUREG/CP-???? (???. 2001)Proceedings of the 28th Water Reactor Safety Meeting, Rockville Maryland, Oct. 1999
Page 24 of 25
Natishan 98 Natishan, M. and Kirk, M., “A Micro-mechanical Evaluation of the Master Curve,”Fatigue and Fracture Mechanics, 30th Volume, ASTM STP-1360, K. Jerina and P.Paris, Eds., American Society for Testing and Materials, 1998.
Natishan 99a Natishan, M.E., Wagenhoefer, M., and Kirk, M.T., “Dislocation Mechanics Basis andStress State Dependency of the Master Curve,” Fracture Mechanics, 31st Symposium,ASTM STP 1389, K. Jerina and J. Gahallger, Eds., American Society for Testing andMaterials, 1999.
Natishan 99b Natishan, M. and Kirk, M., “A Physical Basis for the Master Curve,” Proc. of the 1999ASME Pressure Vessel and Piping Conference, ASME, July 1999.
Natishan 00 “A Rational Basis for Assigning Margins,” Presentation at the 1st Public MeetingConcerning the Influence of Material Variability on Application of the Master Curve toRPV Integrity Assessment, USNRC Headquarters, May 1, 2000.
NRC MEB5.2 METB 5-2, Branch Technical Position, Fracture Toughness Requirements, Rev. 1 –July 1981.
NRC RG199R1 Regulatory Guide 1.99, Revision 1, “Effects of Residual Elements on PredictedRadiation Damage to Reactor Vessel Materials,” U.S. Nuclear Regulatory Commission,April 1977.
NRC RG199R2 Regulatory Guide 1.99, Revision 2, “Radiation Embrittlement of Reactor VesselMaterials,” U.S. Nuclear Regulatory Commission, May 1988.
NRC MEMO 82 Memorandum dated August 30 1982 from M. Vagans to S. Hanauer (DST/NRR).Odette 00 Odette, G.R. and He, M.Y., “A Physical Model of the Master Curve Shape,” Proc. of the
2000 ASME Pressure Vessel and Piping Conference, ASME, July 2000.Onizawa 00 Onizawa, K. and Suzuki, M., “Comparison of Transition Temperature Shifts Between
Static Fracture Toughness and Charpy-V Impact Properties Due to Irradiation andPost-Irradiation Annealing for Japanese A533B-1 Steels,” Effects of Irradiation onMaterials: 20th International Symposium, ASTM STP-1405, S.T. Rosinski, M.L.Grossbeck, T.R. Allen, and A.S. Kumar, Eds., American Society for Testing andMaterials, West Conshohocken, PA, 2000.
Porr 95 Porr, W.C., Link, R.E., Waskey, J.P., and Dodds, R.H., “Experimental Application ofMethodologies to Quantify the Effect of Constraint on Jc for a 3-D Flaw Geometry,”Fracture Mechanics, 26th Volume, ASTM STP 1256, W.G. Reuter, J.H. Underwood andJ.C. Newman, Eds., American Society for Testing and Materials, 1995.
Randall 87 Randall, P.N., “Basis for Revision 2 of the U.S. Nuclear Regulatory Commission’sRegulatory Guide 1.99,” Radiation Embrittlement in Nuclear Pressure Vessel Steels:An International Review (Second Volume), ASTM STP-909, L.E. Steele, Ed., 1987.
Rathbun 00 Rathbun, H., Odette, R.G., and Lucas, G.H., “Size Scaling of Toughness in TheTransition: A Single Variable Experiment and Data Base Assessment,” Proc. of the2000 ASME Pressure Vessel and Piping Conference, ASME, July 2000.
Rosinski 99 Database of fracture toughness values for reactor pressure vessel materials, PersonalCommunication.
SECY82465 SECY-82-465, United States Nuclear Regulatory Commission, 1982.Siu 99 “Uncertainty Analysis and Pressurized Thermal Shock, An Opinion,” United States
Nuclear Regulatory Commission, 1999.Server 00 W. Server, T. Griesbach R.G. Lott, and C.C. Kim, “Determination of Margins and Heat
Adjustments for Master Curve Applications in RPV Integrity Analysis,” Proc. of the 2000ASME Pressure Vessel and Piping Conference, ASME, July 2000.
Sokolov 96 Sokolov, M.A., and Nanstad, R.K., “Comparison of Irradiation Induced Shifts of KJC andCharpy Impact Toughness for Reactor Pressure Vessel Steels,” ASTM STP-1325,American Society of Testing and Materials, 1996.
Wagenhofer 00a Wagenhofer, M., Gunawardane, H., and Natishan, M., “Yield and Toughness TransitionPredictions for Irradiated Steels Based on Dislocation Mechanics,” 20th InternationalSymposium on the Effects of Irradiation on Materials, ASTM STP-????, S. Rosinski,Ed., American Society for Testing and Materials, 2000.

To be included in NUREG/CP-???? (???. 2001)Proceedings of the 28th Water Reactor Safety Meeting, Rockville Maryland, Oct. 1999
Page 25 of 25
Wagenhofer 00b Wagenhofer, M., Natishan, M., and Gunawardane, H., “A Physically Based Model toPredict the Fracture Toughness Transition Behavior of Ferritic Steels,” EngineeringFracture Mechanics, to appear.
Wallin 97 Wallin, K. and Rintamaa, R., “Master Curve Based Correlation Between Static InitiationToughness KIC And Crack Arrest Toughness KIa,” 24th MPA-Seminar, Stuttgart, October8 and 9, 1998.
Wallin 97b Wallin, K., “Loading Rate Effect on the Master Curve To,” Paper IIW- X-1403-97, 1997.Wallin 98b Wallin, K., and Rintamaa, R., “Master Curve Based Correlation Between Static Initiation
Toughness KIC and Crack Arrest Toughness KIA,” Proceedings of the 24th MPA-Seminar, Stuttgart, October 8 and 9, 1998.
WRC 175 PVRC Ad Hoc Group on Toughness Requirements, “PVRC Recommendations onToughness Requirements for Ferritic Materials.” Welding Research Council BulletinNo. 175, August 1972.
Yoon 95 Yoon, K. K., “Alternative Method of RTNDT Determination for Some Reactor VesselWeld Metals Validated by Fracture Toughness Data,” J. of Pressure VesselTechnology, Vol. 117, pp. 378-382, Nov. 1995.
Yoon 99 Yoon, K.K., VanDerSluys, W.A., and Hour, K., “Effect Of Loading Rate On FractureToughness Of Pressure Vessel Steels,” Proc. of the 1999 ASME Pressure Vessel andPiping Conference, ASME, July 1999.