Embed Size (px)
Citation preview

November 2008 Examinations Strategic Level Paper P3 – Management Accounting – Risk and Control Strategy Question Paper 2 Examiner’s Brief Guide to the Paper 15 Examiner’s Answers 17 The answers published here have been written by the Examiner and should provide a helpful guide for both tutors and students. Published separately on the CIMA website (www.cimaglobal.com/students) from February is a Post Examination Guide for the paper which provides much valuable and complementary material including indicative mark information. © The Chartered Institute of Management Accountants. All rights reserved. No part of this publication may be reproduced, stored in a retrieval system, or transmitted, in any form or by any means, electronic, mechanical, photocopying, recorded or otherwise, without the written permission of the publisher.
© The Chartered Institute of Management Accountants 2008

Management Accounting Pillar
Strategic Level Paper
P3 – Management Accounting – Risk and Control Strategy
20 November 2008 – Thursday Morning Session Instructions to candidates
You are allowed three hours to answer this question paper.
You are allowed 20 minutes reading time before the examination begins during which you should read the question paper and, if you wish, highlight and/or make notes on the question paper. However, you will not be allowed, under any circumstances, to open the answer book and start writing or use your calculator during the reading time.
You are strongly advised to carefully read ALL the question requirements before attempting the question concerned (that is, all parts and/or sub-questions). The question requirements are contained in a dotted box.
ALL answers must be written in the answer book. Answers or notes written on the question paper will not be submitted for marking.
Answer the ONE compulsory question in Section A on pages 2 to 5.
Answer TWO questions only from Section B on pages 6 to 9.
Maths Tables and Formulae are provided on pages 10 to 13.
The list of verbs as published in the syllabus is given for reference on page 14.
Write your candidate number, the paper number and examination subject title in the spaces provided on the front of the answer book. Also write your contact ID and name in the space provided in the right hand margin and seal to close.
Tick the appropriate boxes on the front of the answer book to indicate which questions you have answered.
P3 –
Ris
k an
d C
ontr
ol S
trat
egy
P3 2 November 2008
SECTION A – 50 MARKS [the indicative time for answering this Section is 90 minutes] ANSWER THIS QUESTION. THE QUESTION REQUIREMENTS ARE ON PAGE 5, WHICH IS DETACHABLE FOR EASE OF REFERENCE Question One PLM: Background, organisational structure and financial controls PLM is one of the world’s largest manufacturers of energy saving products for use in construction. The group specialises in the manufacture of timber framed sections and of insulated panels, both being used in domestic and commercial construction. The insulated panels take the form of a “sandwich” of outer layers of wooden board with a polystyrene core, and so PLM is very dependent on access to timber supplies for the manufacture of both of its products. PLM owns manufacturing plants and distribution centres in various locations around the world. The group is largely based in Europe, and has its headquarters and Research and Development Unit in Germany, as well as manufacturing sites in Germany, Scotland and Poland. The European manufacturing operations are supported by distribution centres located in each of Germany, France and Scotland. An additional manufacturing plant and two distribution centres are located in Canada, to serve both the Canadian and US markets. PLM sells to customers located in 15 different countries in Europe and North America. The control structure in PLM is regionally rather than product based. Manufacturing and distribution centres are managed in combination as regional profit centres, whilst the Research and Development Unit is treated as a cost centre. For example, the Director of Operations for Western Europe is responsible for a single profit centre that covers the German and Scottish manufacturing plants together with the distribution centres in Germany, France and Scotland. Similarly, the Director of Operations for North America is responsible for a profit centre that includes all of the Canadian manufacturing and distribution centres. The Polish manufacturing plant is a separate profit centre managed by a UK based Director. Profit centre results are calculated before inclusion of the impact of any foreign exchange or interest rate movements. Product Development The Board of Directors regards new product development as vital to the continued success of the business, and 5% of group profit is allocated to Research and Development. All new products have to obtain certification on their suitability for purpose and compliance with health and safety and building regulations. Certification is granted by an internationally approved body such as the UK based Building Research Establishment, but obtaining certification can take up to three years to complete. Environmental Issues PLM’s timber based products appeal to customers because of the fact that timber is a renewable building material. There is, however, growing consumer concern about illegal logging and global depletion of major forestry resources. In response to these concerns, PLM’s strategic plan states that it aims, by 2010, to have 75% of timber supplies sourced from sustainable woodland. The timber used for both the timber framed sections and the insulated panels is primarily softwood which, in forestry terms, is fast growing. Trees reach the necessary level of maturity in approximately 20 years. Reliable market forecasts suggest that demand for sustainably produced timber is growing faster than its supply, and that severe competition for this resource will emerge over the next five to eight years.
November 2008 3 P3

A number of international schemes have developed with the aim of providing customer assurance on the sustainability of a timber source. PLM uses suppliers which are registered under a number of different such schemes including the Forestry Stewardship Council, Sustainable Forestry Initiative, and the Canadian Standards Association. Consumers, however, appear to be poorly informed about the different assurance systems and are unable to clearly distinguish between genuine and “rogue” assurance schemes. Market Conditions The business has expanded very rapidly since 2000 as a result of a growing awareness amongst architects of the need to use environmentally friendly building systems, combined with the potential of both product types to halve construction times. In the 1980s and 1990s there was a degree of mistrust within the industry about the use of timber frame construction techniques, and in Europe there were only a small number of contractors who were knowledgeable and experienced in their use. In contrast, the Canadian market for the product has been well established since the 1950s. Insulated panels have also been in widespread use in North America for many years, but PLM was the first company to introduce this building system into Europe in 1998. Since then a number of competitors have entered the European market, some of which provide customers with on site installation services as well as acting purely as panel manufacturers. An important reason for the market appeal of the panels lies in the fact that they offer very high levels of insulation, and the European market has expanded hugely following the introduction of strict new regulations on the energy efficiency of new buildings. The MD is aware of the impact of the 2007 credit crunch and has taken that into account when preparing the 2008-9 budget by suggesting that there will be zero sales growth. The customer base for both timber framed sections and the insulated panels is highly concentrated. For timber framed sections, 40% of global revenue is earned in Canada, whilst 80% of PLM’s substantial European revenue from the sale of the insulated panels comes from ten main construction companies. Retention of key customers is pursued by PLM through its policy of guaranteeing delivery, anywhere in the world, of all orders in excess of €0·5 million, within six weeks of the order being received. As a result, there are times when PLM is manufacturing in Canada for delivery in Europe and vice versa. Sales Mix and Profit Margins Year ended 30 June 2006 2007Sales: €m €m Global 350 420 North America 150 175 UK 45 65 France 10 10 Germany 60 70 Other countries 85 100 Global Ratio of timber frame to panel sales (by value) 60 : 40 52 : 48Average profit margin on panels 9·5% 9·0%Average profit margin on timber framed sections 12·5% 14·0%
P3 4 November 2008

Risk Management in PLM Overall responsibility for risk management systems within PLM rests with a senior manager (ranked immediately below Board level) who holds the title of Group Risk Controller. He was appointed five years ago, after promotion following 20 years service as PLM’s Head of Group Insurance. He works closely with the Head of Internal Audit, although their respective roles are not clearly defined and documented and they jointly report monthly to the Audit Committee and the Finance Director. The Board of Directors’ approach to risk management is to either avoid risk or transfer it. One consequence of this policy is that the insurance bill for the group is extremely high in comparison to its peers. The existing risk averse culture also means that all overseas customers are billed in Euros, and the Treasury unit is barred from using derivative financial instruments, even for hedging purposes, because they are “too risky.” The Group Risk Controller of PLM is due to retire in July 2009, and in its most recent review of internal controls within PLM the Audit Committee recommended that the Board of Directors should work with the new appointee to undertake a major review of current risk management practice within PLM.
Required: Using the information provided in the above scenario you are required to:
(a) Discuss the extent to which each of the following aspects of the operational and business environment of PLM creates potential risks for the group’s shareholders:
(i) Product development (ii) Environmental issues (iii) Market conditions (iv) Sales mix and profit margins (v) Financial controls
(20 marks)
(b) Recommend, with reasons, a risk management control system that could be used by PLM as a mechanism for recording, prioritising and managing the group’s risks.
(20 marks)
(c) Explain why the role of the Group Risk Controller extends beyond issues of insurance and conformance and is also concerned with performance against strategic objectives.
(10 marks)
(Total for Question One = 50 marks)
(Total for Section A = 50 marks)
November 2008 5 P3
SECTION B – 50 MARKS [the indicative time for answering this section is 90 minutes] ANSWER TWO QUESTIONS ONLY Question Two
Required:
(a) The shift towards fair value accounting has potentially increased the financial risks faced by companies that own high volumes of financial assets.
(i) Discuss the above statement.
(6 marks)
(ii) Explain the tools that might be used to monitor such risks. (4 marks)
(Total for requirement (a) = 10 marks)
(b) KRL plc is a UK based transport company that specialises in large scale business to business contracts, delivering items from original manufacturers to assembly plants across the whole of Western Europe. Fuel is one of the company’s main costs, and the Treasurer has decided to purchase oil futures to try and protect the company from the risk of rising fuel prices. The aim is to use any gains on the futures price to offset any increase in costs resulting from a fuel price rise. KRL forecasts that it will consume approximately 158,000 US gallons of fuel over the three month period to 1 March 2009 at an average cost of £5·45 per gallon. Crude oil futures are traded in the market in units of 1,000 US barrels (42,000 gallons) and on 1 December 2008 the price for delivery in three months time is US $116·00 per barrel. The current spot rate is US$ = £0·504. Assume that on 1 March 2009 the spot exchange rate is US$ = £0·51 and KRL is able to close out its contracts at a value of US$118·92 per barrel.
Required:
(i) Calculate, ignoring transaction costs, the profit or loss arising from the decision
to use futures contracts to hedge fuel costs. (10 marks)
(ii) Discuss the risks associated with hedging fuel prices via the purchase of crude
oil futures. (5 marks)
(Total for requirement (b) = 15 marks)
(Total for Question Two = 25 marks)
P3 6 November 2008
Question Three FDS is a large diversified company whose information technology and information management activities are carried out by a shared service centre. FDS25 is one of many business units operating as an investment centre within FDS. FDS25 has developed a new business strategy which requires a major new investment in information technology to support its business strategy. FDS25 needs to implement the new system as quickly as possible and within budget in order to meet its objectives.
Required:
(a) Recommend the controls that could be implemented by a business unit like FDS25 to mitigate against risk at each stage of information system design and implementation.
(15 marks)
(b) From the perspective of FDS25, identify the risk management advantages and disadvantages of each of
(i) utilising the shared service centre; and (ii) outsourcing
for the design and implementation of a new information system.
(10 marks)
(Total for Question Three = 25 marks)
Section B continues on the next page
November 2008 7 P3

Question Four HFD is a registered charity with 100 employees and 250 volunteers providing in-home care for elderly persons who are unable to fully take care of themselves. The company structure has no shareholders in a practical sense although a small number of issued shares are held by the sponsors who established the charity many years previously. HFD is governed by a seven-member Board of Directors. The Chief Executive Officer (CEO) chairs the Board which comprises the Chief Financial Officer (CFO) and five independent, unpaid non-executive directors who were appointed by the CEO based on past business relationships. You are one of the independent members of HFD’s Board. The CEO/Chair sets the Board agendas, distributes Board papers in advance of meetings and briefs Board members in relation to each agenda item. At each of its quarterly meetings the Board reviews the financial reports of the charity in some detail and the CFO answers questions. Other issues that regularly appear as agenda items include new government funding initiatives for the client group, and the results of proposals that have been submitted to funding agencies, of which about 25% are successful. There is rarely any discussion of operational matters relating to the charity as the CEO believes these are outside the directors’ experience and the executive management team is more than capable of managing the delivery of the in-home care services. The Board has no separate audit committee but relies on the annual management letter from the external auditors to provide assurance that financial controls are operating effectively. The external auditors were appointed by the CEO many years previously. HFD’s Board believes that the company’s corporate governance could be improved by following the principles applicable to listed companies.
Required:
(a) Recommend how HFD’s board should be restructured to comply with the principles of good corporate governance.
(16 marks)
(b) Explain the aspects of CIMA’s ethical principles and the conceptual framework underlying those principles which you would consider relevant to continuing in your role as an independent member of HFD’s board.
(9 marks)
(Total for Question Four = 25 marks)
P3 8 November 2008
Question Five SRN is a small listed clothing retailer operating a chain of 18 stores in suburban shopping centres together with a city-based Head Office. Orders for stock are placed centrally by Head Office and are delivered to Head Office by suppliers. Details of goods received are entered by Head Office employees to the company’s computer system. The goods are then despatched to the retail locations. There are typically between two and three full-time employees in each store (one of whom is the store manager) plus part-time employees during the busiest periods. They are responsible for display and sales. All sales are processed using the electronic point of sale (EPOS) terminals which have the facility for cash, and debit and credit card sales. Cash sales are banked daily by store employees and each day Head Office reconciles bank deposits with the EPOS reports for each store. Sales through the EPOS terminals automatically reduce stock levels and support Head Office purchasing and stock replenishment decisions. A physical stocktake is carried out by store employees six monthly. Usually the stocktakes reveal stock shortfalls for almost half the stores. Store employees attribute this to theft. Prices are set initially by Head Office as a standard mark-up on the purchase cost. This price is automatically displayed on the EPOS terminals. However, employees have the authority to discount prices based on the length of time stock has been in their store and the need to ensure constant stock rotation. Sales revenue and price discounts are monitored weekly by Head Office to ensure that sales levels and margins are on target and that excessive discounting does not take place. Sales, gross profits and net profits are reported quarterly for each store. A Head Office manager visits each store once per week, typically on the same day and at the same time, so that store employees can discuss any problems with the Head Office manager.
Required:
(a) Identify the risks of fraud and theft faced by SRN in relation to its employees.
(6 marks)
(b) Recommend (with reasons) the policies and internal controls that SRN could implement to prevent employee fraud and theft. In making your recommendations, you should consider both
(i) working conditions and the role of the Human Resource function; and (ii) operational internal controls.
(19 marks)
(Total for Question Five = 25 marks)
(Total for Section B = 50 marks)
End of question paper
November 2008 9 P3

P3 10 November 2008
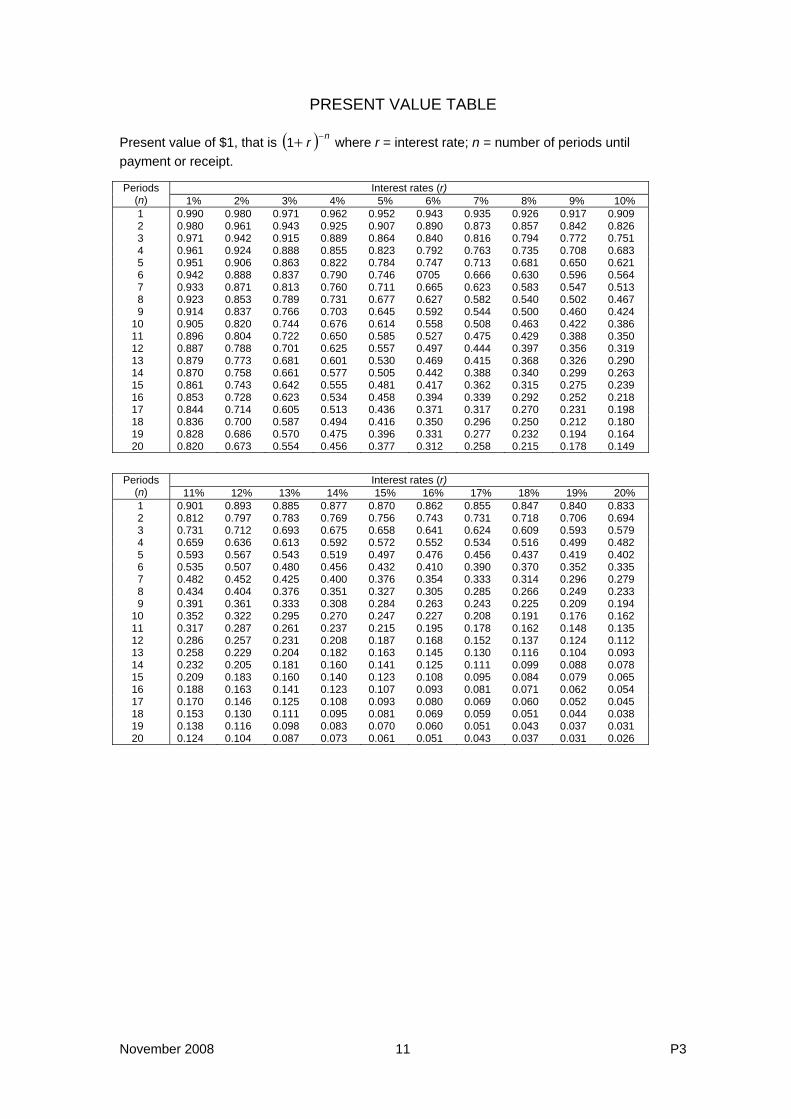
PRESENT VALUE TABLE
Present value of $1, that is where r = interest rate; n = number of periods until payment or receipt.
( ) nr −+1
Interest rates (r) Periods
(n) 1% 2% 3% 4% 5% 6% 7% 8% 9% 10% 1 0.990 0.980 0.971 0.962 0.952 0.943 0.935 0.926 0.917 0.909 2 0.980 0.961 0.943 0.925 0.907 0.890 0.873 0.857 0.842 0.826 3 0.971 0.942 0.915 0.889 0.864 0.840 0.816 0.794 0.772 0.751 4 0.961 0.924 0.888 0.855 0.823 0.792 0.763 0.735 0.708 0.683 5 0.951 0.906 0.863 0.822 0.784 0.747 0.713 0.681 0.650 0.621 6 0.942 0.888 0.837 0.790 0.746 0705 0.666 0.630 0.596 0.564 7 0.933 0.871 0.813 0.760 0.711 0.665 0.623 0.583 0.547 0.513 8 0.923 0.853 0.789 0.731 0.677 0.627 0.582 0.540 0.502 0.467 9 0.914 0.837 0.766 0.703 0.645 0.592 0.544 0.500 0.460 0.424 10 0.905 0.820 0.744 0.676 0.614 0.558 0.508 0.463 0.422 0.386 11 0.896 0.804 0.722 0.650 0.585 0.527 0.475 0.429 0.388 0.350 12 0.887 0.788 0.701 0.625 0.557 0.497 0.444 0.397 0.356 0.319 13 0.879 0.773 0.681 0.601 0.530 0.469 0.415 0.368 0.326 0.290 14 0.870 0.758 0.661 0.577 0.505 0.442 0.388 0.340 0.299 0.263 15 0.861 0.743 0.642 0.555 0.481 0.417 0.362 0.315 0.275 0.239 16 0.853 0.728 0.623 0.534 0.458 0.394 0.339 0.292 0.252 0.218 17 0.844 0.714 0.605 0.513 0.436 0.371 0.317 0.270 0.231 0.198 18 0.836 0.700 0.587 0.494 0.416 0.350 0.296 0.250 0.212 0.180 19 0.828 0.686 0.570 0.475 0.396 0.331 0.277 0.232 0.194 0.164 20 0.820 0.673 0.554 0.456 0.377 0.312 0.258 0.215 0.178 0.149
Interest rates (r) Periods
(n) 11% 12% 13% 14% 15% 16% 17% 18% 19% 20% 1 0.901 0.893 0.885 0.877 0.870 0.862 0.855 0.847 0.840 0.833 2 0.812 0.797 0.783 0.769 0.756 0.743 0.731 0.718 0.706 0.694 3 0.731 0.712 0.693 0.675 0.658 0.641 0.624 0.609 0.593 0.579 4 0.659 0.636 0.613 0.592 0.572 0.552 0.534 0.516 0.499 0.482 5 0.593 0.567 0.543 0.519 0.497 0.476 0.456 0.437 0.419 0.402 6 0.535 0.507 0.480 0.456 0.432 0.410 0.390 0.370 0.352 0.335 7 0.482 0.452 0.425 0.400 0.376 0.354 0.333 0.314 0.296 0.279 8 0.434 0.404 0.376 0.351 0.327 0.305 0.285 0.266 0.249 0.233 9 0.391 0.361 0.333 0.308 0.284 0.263 0.243 0.225 0.209 0.194 10 0.352 0.322 0.295 0.270 0.247 0.227 0.208 0.191 0.176 0.162 11 0.317 0.287 0.261 0.237 0.215 0.195 0.178 0.162 0.148 0.135 12 0.286 0.257 0.231 0.208 0.187 0.168 0.152 0.137 0.124 0.112 13 0.258 0.229 0.204 0.182 0.163 0.145 0.130 0.116 0.104 0.093 14 0.232 0.205 0.181 0.160 0.141 0.125 0.111 0.099 0.088 0.078 15 0.209 0.183 0.160 0.140 0.123 0.108 0.095 0.084 0.079 0.065 16 0.188 0.163 0.141 0.123 0.107 0.093 0.081 0.071 0.062 0.054 17 0.170 0.146 0.125 0.108 0.093 0.080 0.069 0.060 0.052 0.045 18 0.153 0.130 0.111 0.095 0.081 0.069 0.059 0.051 0.044 0.038 19 0.138 0.116 0.098 0.083 0.070 0.060 0.051 0.043 0.037 0.031 20 0.124 0.104 0.087 0.073 0.061 0.051 0.043 0.037 0.031 0.026
November 2008 11 P3
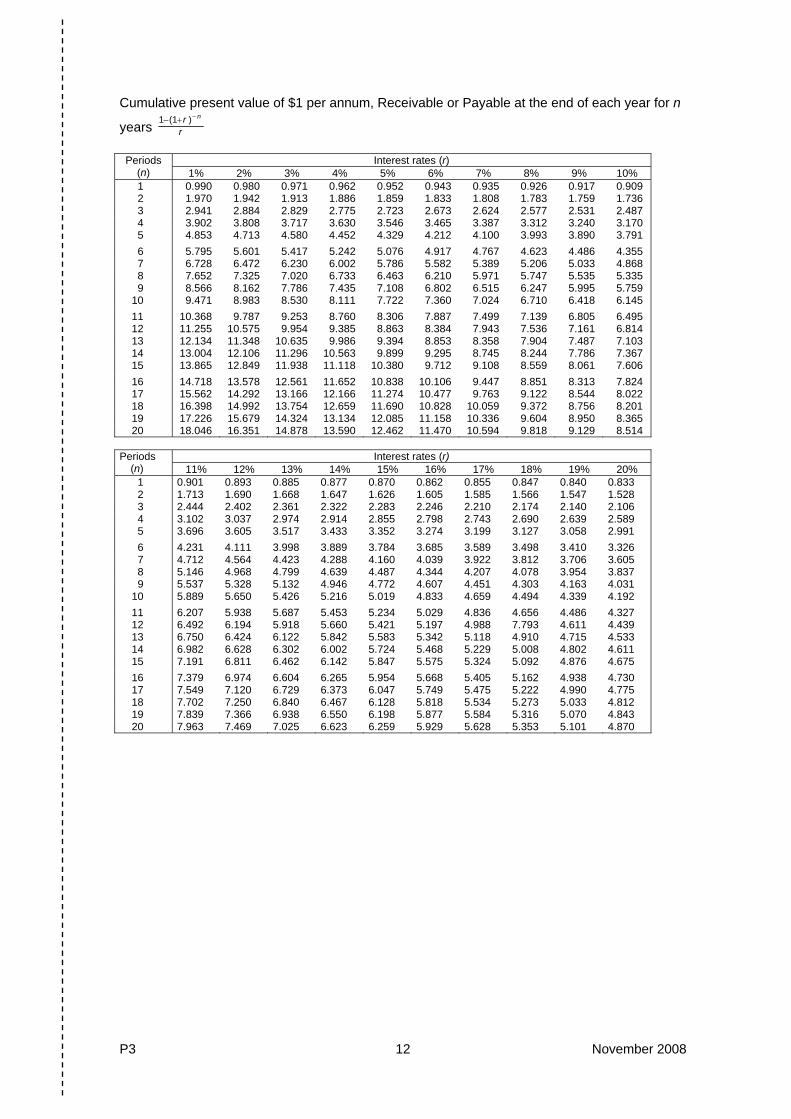
Cumulative present value of $1 per annum, Receivable or Payable at the end of each year for n
years rr n−+− )(11
Interest rates (r) Periods
(n) 1% 2% 3% 4% 5% 6% 7% 8% 9% 10% 1 0.990 0.980 0.971 0.962 0.952 0.943 0.935 0.926 0.917 0.909 2 1.970 1.942 1.913 1.886 1.859 1.833 1.808 1.783 1.759 1.736 3 2.941 2.884 2.829 2.775 2.723 2.673 2.624 2.577 2.531 2.487 4 3.902 3.808 3.717 3.630 3.546 3.465 3.387 3.312 3.240 3.170 5 4.853 4.713 4.580 4.452 4.329 4.212 4.100 3.993 3.890 3.791 6 5.795 5.601 5.417 5.242 5.076 4.917 4.767 4.623 4.486 4.355 7 6.728 6.472 6.230 6.002 5.786 5.582 5.389 5.206 5.033 4.868 8 7.652 7.325 7.020 6.733 6.463 6.210 5.971 5.747 5.535 5.335 9 8.566 8.162 7.786 7.435 7.108 6.802 6.515 6.247 5.995 5.759 10 9.471 8.983 8.530 8.111 7.722 7.360 7.024 6.710 6.418 6.145 11 10.368 9.787 9.253 8.760 8.306 7.887 7.499 7.139 6.805 6.495 12 11.255 10.575 9.954 9.385 8.863 8.384 7.943 7.536 7.161 6.814 13 12.134 11.348 10.635 9.986 9.394 8.853 8.358 7.904 7.487 7.103 14 13.004 12.106 11.296 10.563 9.899 9.295 8.745 8.244 7.786 7.367 15 13.865 12.849 11.938 11.118 10.380 9.712 9.108 8.559 8.061 7.606 16 14.718 13.578 12.561 11.652 10.838 10.106 9.447 8.851 8.313 7.824 17 15.562 14.292 13.166 12.166 11.274 10.477 9.763 9.122 8.544 8.022 18 16.398 14.992 13.754 12.659 11.690 10.828 10.059 9.372 8.756 8.201 19 17.226 15.679 14.324 13.134 12.085 11.158 10.336 9.604 8.950 8.365 20 18.046 16.351 14.878 13.590 12.462 11.470 10.594 9.818 9.129 8.514
Interest rates (r) Periods
(n) 11% 12% 13% 14% 15% 16% 17% 18% 19% 20% 1 0.901 0.893 0.885 0.877 0.870 0.862 0.855 0.847 0.840 0.833 2 1.713 1.690 1.668 1.647 1.626 1.605 1.585 1.566 1.547 1.528 3 2.444 2.402 2.361 2.322 2.283 2.246 2.210 2.174 2.140 2.106 4 3.102 3.037 2.974 2.914 2.855 2.798 2.743 2.690 2.639 2.589 5 3.696 3.605 3.517 3.433 3.352 3.274 3.199 3.127 3.058 2.991 6 4.231 4.111 3.998 3.889 3.784 3.685 3.589 3.498 3.410 3.326 7 4.712 4.564 4.423 4.288 4.160 4.039 3.922 3.812 3.706 3.605 8 5.146 4.968 4.799 4.639 4.487 4.344 4.207 4.078 3.954 3.837 9 5.537 5.328 5.132 4.946 4.772 4.607 4.451 4.303 4.163 4.031 10 5.889 5.650 5.426 5.216 5.019 4.833 4.659 4.494 4.339 4.192 11 6.207 5.938 5.687 5.453 5.234 5.029 4.836 4.656 4.486 4.327 12 6.492 6.194 5.918 5.660 5.421 5.197 4.988 7.793 4.611 4.439 13 6.750 6.424 6.122 5.842 5.583 5.342 5.118 4.910 4.715 4.533 14 6.982 6.628 6.302 6.002 5.724 5.468 5.229 5.008 4.802 4.611 15 7.191 6.811 6.462 6.142 5.847 5.575 5.324 5.092 4.876 4.675 16 7.379 6.974 6.604 6.265 5.954 5.668 5.405 5.162 4.938 4.730 17 7.549 7.120 6.729 6.373 6.047 5.749 5.475 5.222 4.990 4.775 18 7.702 7.250 6.840 6.467 6.128 5.818 5.534 5.273 5.033 4.812 19 7.839 7.366 6.938 6.550 6.198 5.877 5.584 5.316 5.070 4.843 20 7.963 7.469 7.025 6.623 6.259 5.929 5.628 5.353 5.101 4.870
P3 12 November 2008
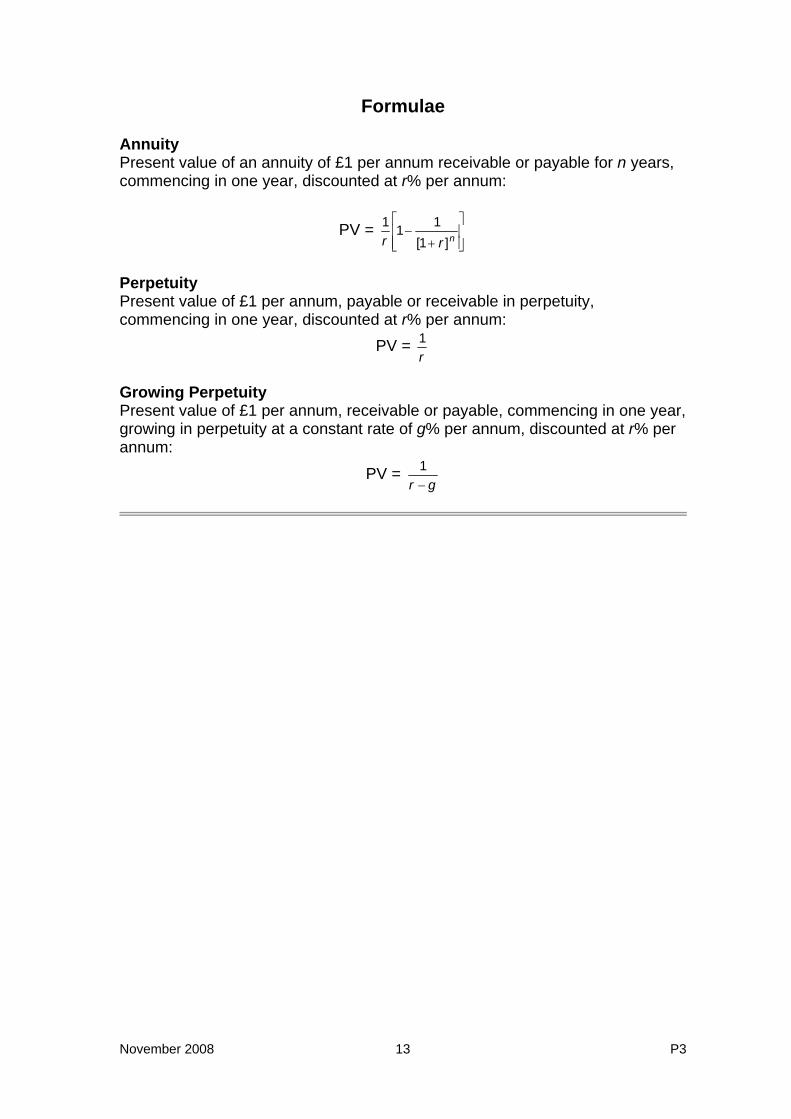
Formulae Annuity Present value of an annuity of £1 per annum receivable or payable for n years, commencing in one year, discounted at r% per annum:
PV = ⎥⎥⎦
⎤
⎢⎢⎣
⎡
+−
nrr ]1[111
Perpetuity Present value of £1 per annum, payable or receivable in perpetuity, commencing in one year, discounted at r% per annum:
PV = r1
Growing Perpetuity Present value of £1 per annum, receivable or payable, commencing in one year, growing in perpetuity at a constant rate of g% per annum, discounted at r% per annum:
PV = gr −
1
November 2008 13 P3
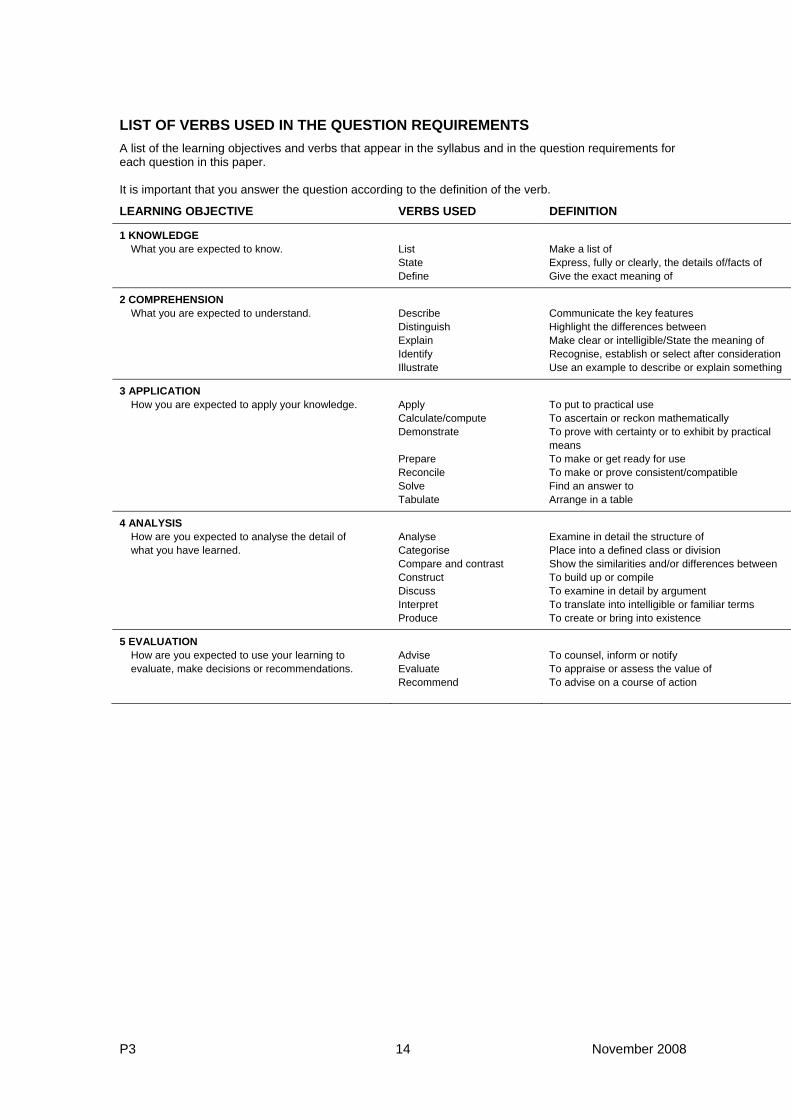
LIST OF VERBS USED IN THE QUESTION REQUIREMENTS A list of the learning objectives and verbs that appear in the syllabus and in the question requirements for each question in this paper. It is important that you answer the question according to the definition of the verb.
LEARNING OBJECTIVE VERBS USED DEFINITION
1 KNOWLEDGE
What you are expected to know. List Make a list of State Express, fully or clearly, the details of/facts of Define Give the exact meaning of
2 COMPREHENSION What you are expected to understand. Describe Communicate the key features
Distinguish Highlight the differences between Explain Make clear or intelligible/State the meaning of Identify Recognise, establish or select after consideration Illustrate Use an example to describe or explain something
3 APPLICATION How you are expected to apply your knowledge. Apply
Calculate/compute To put to practical use To ascertain or reckon mathematically
Demonstrate To prove with certainty or to exhibit by practical means
Prepare To make or get ready for use Reconcile To make or prove consistent/compatible Solve Find an answer to Tabulate Arrange in a table
4 ANALYSIS How are you expected to analyse the detail of what you have learned.
Analyse Categorise
Examine in detail the structure of Place into a defined class or division
Compare and contrast Show the similarities and/or differences between Construct To build up or compile Discuss To examine in detail by argument Interpret To translate into intelligible or familiar terms Produce To create or bring into existence
5 EVALUATION How are you expected to use your learning to evaluate, make decisions or recommendations.
Advise Evaluate Recommend
To counsel, inform or notify To appraise or assess the value of To advise on a course of action
P3 14 November 2008

The Examiners for Management Accounting – Risk and Control Strategy offer to future candidates and to tutors using this booklet for study purposes, the
following background and guidance on the questions included in this examination paper.
Section A – Question One – Compulsory Question One This case study is set in manufacturing company that supplies products for use in environmentally friendly construction. Although based in Europe, the group has both manufacturing and distribution plans around the world, which are managed as either cost or profit centres. The Group Risk Controller is risk averse, and the business faces challenges in terms of maintaining long term access to supplies and also ensuring sales growth. The first part of the question requires candidates to use the information provided in the scenario to discuss the extent to which specific aspects of the business, such as product development and market conditions, create potential risks for the group’s shareholders. Candidates are also asked to recommend a risk management control system that could be implemented by the case study business to record, prioritise and manage the group’s risks. The last part of the question tests a candidate’s understanding of the role of a risk controller by asking them to explain why risk management is concerned with performance against objectives as well as insurance and conformance. The syllabus areas covered are B (i) define and identify risks facing an organisation, B (ii) explain ways of measuring and assessing risks facing an organisation, including the organisation’s ability to bear such risks, and C (v)Recommend action to improve the efficiency, effectiveness and control of activities. Section B – answer two of four questions Question Two covers two different aspects relating to the management of financial risk. Part (a) requires candidates to discuss the impact of fair value accounting on the financial risk level of a company that holds high levels of financial assets, and to explain the tools that might be used to monitor financial risk exposure. The question does not require detailed knowledge of the financial accounting rules, but does require knowledge of the relative risks of different types of financial assets, and the potential for volatility in their values arising from the use of fair value accounting. Media coverage of such issues has been very extensive over the last six months. In explaining the tools for management of financial risk, candidates need to display an understanding that different asset types require the application of different tools of control. The syllabus areas covered in part (a) are Section D (i) Identify and evaluate financial risks facing an organisation, and part (b) covers Section D (ii) Identify and evaluate appropriate methods for managing financial risks. Question Three is a business unit of a diversified company which needs to introduce new business systems. Candidates are asked to recommend the controls that could mitigate risk in system design and implementation. Candidates are also asked to compare a shared services centre with outsourcing of the design and implementation process. The question requires candidates to relate the scenario to a commonly accepted standard such as the Systems Development Lifecycle. Candidates should also be able to compare and contrast the advantages and disadvantages of shared service centres with outsourcing. The syllabus areas covered are A (iv) evaluate the appropriateness of an organisation’s management accounting control systems and make recommendations for improvements; B (ii) explain ways of measuring and assessing risks facing an organisation, including the organisation’s ability to bear such risks and B (iv) evaluate risk management strategies.
November 2008 15 P3
Question Four contains the scenario of a charity and the role of governance in that charity. Candidates are asked to recommend improvements to governance through restructuring the Board. Candidates are also asked to relate CIMA’s ethical principles and the conceptual framework underlying those principles to the hypothetical situation of their role as an independent Board member. Candidates should be able to relate the scenario to the applicable elements of good governance as identified in the Combined Code on Corporate Governance, as well as explain the applicable ethical principles. The syllabus areas covered are B (vii) discuss the principles of good corporate governance for listed companies, particularly as regards the need for internal controls, and C (vii) discuss the importance of exercising ethical principles in conducting and reporting on internal reviews. Question Five is based on a retail chain where there is a risk of fraud and theft. Candidates are asked to identify the risks of employee fraud and recommend policies and controls to prevent employee fraud and theft. This question requires an understanding of the role of the Human Resources function in supporting an anti-fraud culture as well as the specific internal controls to reduce fraud. The syllabus areas covered are A (i) evaluate and recommend appropriate control systems for the management of organisations and make recommendations for improvements; B (i) define and identify risks facing an organisation; and E (ii) identify and evaluate IS/IT systems appropriate to an organisation’s needs for operational and control information.
P3 16 November 2008

Strategic Level Paper
P3 – Management Accounting – Risk and Control Strategy
Examiner’s Answers
SECTION A Answer to Question One (a) (i) Product Development Investment in Research and Development currently absorbs approximately 5% of group profit, and this will significantly affect shareholders by reducing the current earnings per share, and cash available to pay dividends. On the other hand, the investment in future products should also lead to higher future profits and potential capital gains for the company’s investors. The risk lies in the extent to which current research and development spending can be guaranteed to boost future profits. The company is very exposed to changes in technology and fashion. It needs more than two types of product – this would draw in new customers and reduce risk. The significant investment in R&D is presumably restricted to the timber framed sections and panels; it should be broadened. One factor which adds to this risk is the need for product certification, because there is no certainty that all products will be certified, and in any case the process itself is lengthy. If, however, a newly certified product allows the group to increase its market share or profit margins, then the net result may be very beneficial to shareholders. (ii) Environmental Issues PLM’s products are successful largely because of their environmentally friendly characteristics. These features create a general market appeal that is supplemented by the potential of government regulations to require the use of such building products in all new construction projects. The risk for shareholders is that the rapidly expanding demand can (a) not be met by PLM or (b) attracts new competition into the market place, which causes the company to suffer a drop in profits. Additionally, the company faces the challenge of demand exceeding supply for timber from sustainable sources, such that competition for supply will be extensive in five to eight years’ time. This competition may lead to price rises which will in turn erode company profits and shareholders need to be aware of this risk. Alternatively, without good supplier relations, PLM
November 2008 17 P3
may be unable to access the necessary supplies at all. This scenario could undermine the whole viability of the business. The certification schemes have presumably led to some increased customer awareness of sustainability issues and as such have possibly also increased pressures on the limited supplies of such timber. At the same time, however, the customers’ inability to distinguish between genuine and rogue schemes creates a huge risk for PLM and its shareholders. If certified sustainable supplies rise in price due to scarcity, the potential for market penetration by suppliers using rogue certifications increases substantially, and this competitive pressure is likely to hit profits. The company’s green credentials may suffer long term harm from the somewhat half-hearted move to sustainable timber. 25% non-sustainable sourcing is insufficient to keep costs low but is too high to prevent it trumpeting their environmental friendliness. It is falling between two stools and needs to move faster towards complete sustainability. (iii) Market Conditions Both product markets are relatively new in Europe and also highly concentrated. The concentration occurs on both a geographical level and in terms of dependence upon a small number of key customers. This poses a risk to shareholders that profits will be severely hit if a major customer is lost, or if strong competition emerges in a dominant market. Shareholders are also put at risk by the company’s policy of guaranteeing global delivery on orders over a certain (quite small) value. The delivery guarantee will create problems for both production and delivery scheduling, which could potentially increase costs and reduce profits. In the case of the insulated panels, where profit margins are falling anyway, additional delivery costs could possibly even lead to losses if PLM had a lot of separate orders of just above €0·5 million in a given year. With margins this tight, it is hard to see how it can be viable to manufacture in Canada for fast delivery into Europe or vice versa. The business is entirely focused on the construction sector, which is currently hit by the effects of the 2007 credit crunch. The marketing director has forecast zero growth for 2008-09 but even this forecast may prove optimistic. Shareholders therefore face the risk of investing in a business that is making an innovative product but in a declining market. (iv) Sales Mix and Profit Margins The use of just two years’ historical data to comment upon the risks facing shareholders has its limitations, but the information in the scenario does indicate several potential risks. Global sales growth appears good but also geographically uneven. The UK appears to be the country with the greatest growth potential but it is also one that is particularly hard hit by the credit crunch. 57% of global sales are in North America or the UK and the economies in both of these areas are under threat from a slowdown, if not recession. Shareholders therefore face the risk of declining sales and also profits. Labour costs in Germany, Scotland and Canada may be high internationally. Risk of uncompetitiveness would be mitigated by moving to manufacture more in lower cost economies. Profits may also be undermined by the slight shift in the group’s product mix, which is moving in favour of panel sales, despite the fact that the margin on these is significantly below that of timber framed sections. As a result, PLM’s shareholders face the risk of seeing the group’s overall rates of return, and therefore earnings per share remaining static, if not falling. Over 40% of the group’s revenue is in North America. Even if only one third of this is in the USA there is a massive risk of being out of touch with the US market without a cost or even a distribution centre there. Canadian lifestyle, fashions and so on are not synonymous with those of the US.
P3 18 November 2008
(v) Financial Controls The control system appears to be illogical and also inconsistent, so that it will be difficult to effectively compare financial performance across different parts of the group. Poor controls place investors at risk of poor management, and a resulting drop in their potential returns. The system is illogical because although it is geographically based, the different areas are not directly comparable. For example, the mix of manufacturing versus distribution plants is uneven across the areas although their respective profitability is likely to be significantly different. There is no indication of how the research and development costs are either recovered, or controlled, and also no indication of if, or how, product profitability is assessed. The only logical feature seems to be the exclusion of foreign exchange and interest rate movements from the performance evaluation. Presumably some form of budgetary control exists, although the detail is lacking, as is information on issues such as the use of approved suppliers etc which is essential to the achievement of PLM’s declared strategy. Risk management needs to be directly represented at Board level. (b) The description of the current risk management system does not include any information on how risks are identified, prioritised and managed on a day to day basis. The Group Risk Controller has an insurance background and so it is likely that he identifies and takes responsibility for all insurable risks, but this potentially leaves the company exposed to a wide range of other possible risks, as suggested in part (a) of this answer. It is assumed that the introduction of controls to record, prioritise and manage risks requires the establishment of a risk management system, the core elements of which are: • Risk assessment;
• Risk reporting;
• Risk response;
• Residual risk reporting. These elements come together to form a control system which is established against the background of a clearly articulated institutional risk policy, drafted by senior management and indicating the types of risk they want the organisation to take, those they want to avoid, and the overall appetite for risk-taking. For the sake of consistency, the Board of Directors should make it understood that risk is managed on a group-wide basis. Risk Assessment This control includes three subsidiary processes. The first of these is risk identification, which may be done via questionnaires, surveys, brainstorming sessions or a range of other techniques. The aim is to use staff expertise to identify and describe all of the potential financial risks to which the organisation may be exposed, and use this as the basis for a risk register, which can then be formally monitored and controlled. It is important to ensure that line management is involved in the risk identification process, because they have the in depth knowledge that is necessary, although the use of risk workshops to train staff in risk identification techniques is now extremely common. The risk register will be maintained centrally, and updated regularly. Good corporate governance should also ensure that the Audit Committee has access to the register and may request information on any individual risk and evidence of the accompanying monitoring and control procedures and their respective effectiveness.
November 2008 19 P3
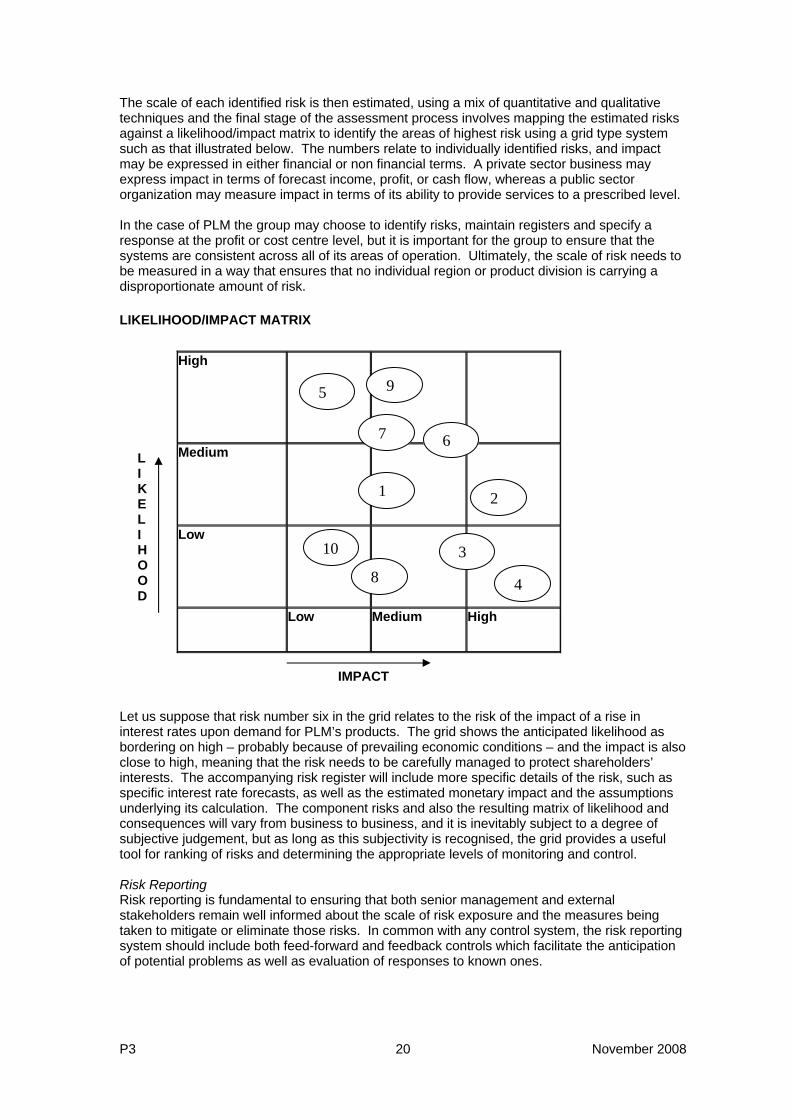
The scale of each identified risk is then estimated, using a mix of quantitative and qualitative techniques and the final stage of the assessment process involves mapping the estimated risks against a likelihood/impact matrix to identify the areas of highest risk using a grid type system such as that illustrated below. The numbers relate to individually identified risks, and impact may be expressed in either financial or non financial terms. A private sector business may express impact in terms of forecast income, profit, or cash flow, whereas a public sector organization may measure impact in terms of its ability to provide services to a prescribed level. In the case of PLM the group may choose to identify risks, maintain registers and specify a response at the profit or cost centre level, but it is important for the group to ensure that the systems are consistent across all of its areas of operation. Ultimately, the scale of risk needs to be measured in a way that ensures that no individual region or product division is carrying a disproportionate amount of risk. LIKELIHOOD/IMPACT MATRIX
High
Medium
Low
5
2
9
8
1
3
7
4
10
6
Low Medium High
L I K E L I H O O D
IMPACT
Let us suppose that risk number six in the grid relates to the risk of the impact of a rise in interest rates upon demand for PLM’s products. The grid shows the anticipated likelihood as bordering on high – probably because of prevailing economic conditions – and the impact is also close to high, meaning that the risk needs to be carefully managed to protect shareholders’ interests. The accompanying risk register will include more specific details of the risk, such as specific interest rate forecasts, as well as the estimated monetary impact and the assumptions underlying its calculation. The component risks and also the resulting matrix of likelihood and consequences will vary from business to business, and it is inevitably subject to a degree of subjective judgement, but as long as this subjectivity is recognised, the grid provides a useful tool for ranking of risks and determining the appropriate levels of monitoring and control. Risk Reporting Risk reporting is fundamental to ensuring that both senior management and external stakeholders remain well informed about the scale of risk exposure and the measures being taken to mitigate or eliminate those risks. In common with any control system, the risk reporting system should include both feed-forward and feedback controls which facilitate the anticipation of potential problems as well as evaluation of responses to known ones.
P3 20 November 2008
The starting point for risk reporting is the risk register, within which each risk will be allocated an “owner”. The “owner” takes responsibility for forecasting the level of risk, selecting an appropriate response, evaluating the level of residual risk remaining after the response, and ongoing monitoring and reporting of the current risk level. Some of these tasks may be delegated, but for key risks at Board of Director level, it remains vital to be able to identify who takes ultimate responsibility. Reporting styles vary between organisations, but it is common to use a form of escalation of responsibility for risks which do not appear to be effectively managed. For example, if the likelihood of a specific risk increases then it may become necessary for responsibility to be passed up the chain of command, not least because there may be a consequential increase in the anticipated impact. Similarly, the frequency of risk reporting will usually reflect its significance to the organisation. Key risks which may have a drastic impact upon reported profit may be monitored and reported daily or even hourly, while less significant risks that have a low expected impact may only be reviewed monthly or quarterly. The decision on frequency of reporting and monitoring rests with the risk management unit and not with line management. A clear specification of duties and responsibilities within risk management is therefore fundamental to effective control. The content and frequency of external risk reporting of risks is determined by a mix of accounting, capital market and governance regulations, which vary between countries. Extreme care needs to be taken to ensure that the information being reported is placed in context and presented in a style that will be understood by the external users. The underlying principle that governs the content of risk reports, however, is that a well informed market will price stock more accurately than an ill informed market. In order to ensure that risk reporting within PLM is effective, it is important that systems are installed to ensure that risk registers are maintained for each of the manufacturing and distribution centres, as well as the central functions such as research and development. These registers can then form the basis for the construction of a group wide list of core risks and allocation of responsibilities for risk management. Key risks, such as exchange rate risk in PLM, will then be monitored more closely and levels of exposure reported at board level where appropriate. Risk Response Armed with information about the nature of the risks to which the business is exposed, and their expected likelihood and impact, it becomes possible for managers to select an appropriate response. For example, the scenario shows PLM to be heavily exposed to a risk that a large proportion of its revenue from panel sales in Europe comes from just ten main companies. If just one of these businesses faced a cash flow problem then the impact upon PLM could be catastrophic. It is therefore vital that the group has a well thought out response to such a risk, that also reflects the risk appetite. The possibilities range from accepting the risk, the use of natural hedges or insurance to mitigate exposures, on to direct transfer of the risk via processes such as securitisation. The chosen response should reflect the internal risk appetite and take into account its expected effect upon both risk impact and likelihood. Consideration of the cost effectiveness of the various alternatives will also be relevant. Choosing to accept, reduce or avoid risks must however be done with full knowledge of the cost of the different options. In the case of the credit risk created by exposure to a limited number of large customers for example, PLM may consider purchasing credit insurance, selling on the debts, or accepting the exposure and the associated risks. The selection of a given risk response therefore requires an understanding of both its cost and its impact upon the level of exposure. In other words, it should be possible to identify the level of “gross” risk prior to a response, and the level of “net” risk post the response. The final component of the risk management system is therefore that of residual risk reporting.
November 2008 21 P3

In PLM the risk appetite will be common across the group, but it is likely that exposure to different types of risk will be unevenly spread across the various areas of operation. For example, the timber frame manufacturing plants may suffer a high risk of inadequate supplies of sustainable timber, whereas the risk for research and development may be defined in terms of access to suitably qualified staff. Risk reporting ensures that the key pieces of information about risk exposure are made available to senior management, and it is assumed that their response will reflect the organisation’s overall risk appetite. Residual risk reporting To close the control loop, it is important for management to know whether their risk responses have been effective and the scale of the remaining net risk exposures. This is the purpose of residual risk reporting, which can be initially simplified down to a revised likelihood: consequences matrix showing net risk positions instead of gross positions. The likelihood/impact matrix can be complemented by more detailed reporting on a risk by risk basis. This should include commentary upon the perceived effectiveness of the response, including a judgement on the relative costs versus benefits. Such reports are important in helping the Board of Directors and Audit Committee to evaluate the effectiveness of the risk control system. They also aid compliance with governance regulations around the world which now require listed companies to conduct such a review, or explain why they have not. (c) CIMA defines the role of risk management as “the process of understanding the risks that the organisation is inevitably subject to in attempting to achieve its corporate objectives.” This definition clearly indicates the link between risk management and strategic objectives, and if performance is evaluated in terms of strategic success then risk and performance are also closely interlinked. IFAC argues that risk management works to reconcile conformance and performance in the manner illustrated below:
Control Threat/hazard “bad things do happen”
Return/ opportunity “Good things might not happen
Risk Management
CONFORMANCE PERFORMANCE
Source: IFAC (1999) Enhancing Shareholder Wealth by Better Managing Risk
The diagram illustrates that the conformance dimension of risk management is concerned with controlling the downside risks that may threaten strategic objectives. Risk management in relation to performance is about taking advantage of opportunities to increase overall returns within a business. In other words, risk is not always a bad thing – it also has an upside. Nonetheless, risk management seeks to control the threats and ensure achievement of the opportunities. In the context of PLM the risk management system appears to be focused upon avoidance of losses/hazards. Credit risk insurance, for example, might be currently used by PLM to cover the risk of failure of a key customer. This transfers the risk to the insurer so that any business
P3 22 November 2008
losses will be compensated for if such a failure occurs. A compliance focused risk management system cannot, however, insure against market growth rates being below forecasts, that is insure against not gaining as much as anticipated from risk taking. The only way to manage this type of risk is through internal control systems that continually monitor market trends and highlight when performance is not against target. In this way, performance monitoring and risk management are fully integrated. When managers and staff undergo their individual performance reviews, the review will include an evaluation of whether or not the required goals were achieved. In order to hit their goals, the individuals will have had to make risk-related decisions, including whether or not to take risks in order to increase the likelihood of achieving the required goal. In other words, achieving the targeted level of performance has implicitly required the management of risks. It is therefore impossible for the role of the risk manager to be purely insurance or conformance-oriented. They must also be focused on the risks that need to be taken in order to achieve strategic objectives.
November 2008 23 P3

SECTION B Answer to Question Two (a) Financial assets can take a variety of forms, ranging in complexity from cash and debtors through market traded bonds or equities, to basic derivative contracts such as swaps, futures or forwards that are held either for hedging or for speculative purposes, or even the more complex instruments highlighted in the recent credit crunch such as credit derivatives, mortgage backed securities and collateralised debt obligations (CDO’s). Under current accounting these financial assets are valued on a mark to market basis, although even in the absence of fair value accounting, old rules would have required that they be valued at the lower of cost or net realisable value. The rules on how to arrive at a fair value are complex and reflect the level of price information available in respect of a given financial asset. At level 1, where there is a free and liquid market, then the asset value can be taken as the current market price, although there is still some theoretical debate over whether the entry or exit price is most appropriate. At level 2, where the asset is more specific and the market less liquid, it is necessary to take a price from the market of “equivalent” assets, and so price reliability is more open to question. In the case of illiquid financial assets, the price will be model based, where the model basically computes a present value of the future cash flows associated with the asset. In marking to model, the resulting value is therefore heavily dependent upon the underlying assumptions on the timing and size of relevant cash flows. Recent events have shown that once apparently liquid assets such as CDOs, can quickly become illiquid and cause major valuation problems for both the preparers of financial statements and also their auditors. Companies with a high volume of non-cash based financial assets therefore face market risks in relation to their value. Prices can move freely, and the relative liquidity of those markets may also change, causing a drop in prices. Market risk can be measured or monitored using techniques such as Value at Risk, sensitivity analysis or scenario planning. Value at Risk measures the maximum likely sum that may be lost on a multi asset portfolio over a target period at a specified probability level. For example a daily VaR of £20 million at a confidence level of 99% means that if there are 250 trading days in a year, then a maximum expected one day loss of £20 million might occur on 2·5 days in the year. The validity of the model can be checked by comparing actual losses against forecast. For example, if the VaR losses were exceeded on ten occasions (rather than 2·5) in any one year, the model probably needs to be re-estimated. Sensitivity analysis and scenario planning are very similar and both use the approach of asking the question of “what if” in respect of key variables that may affect the value of a portfolio. For example, if a company holds a large loan portfolio, the level of write downs on the loans will be sensitive to interest rate movements. It is therefore useful to estimate the change in value of the loans under a range of interest rate conditions. For example, if interest rates fall by X% the value of the loans held will increase by Y or vice versa. In many respects, financial assets are no different to other assets in terms of the risks that they pose, but the growing use of mark to market accounting means that their values are highly sensitive to market movements and if the financial markets are volatile, then the risk of holding high levels of such assets is increased.
P3 24 November 2008
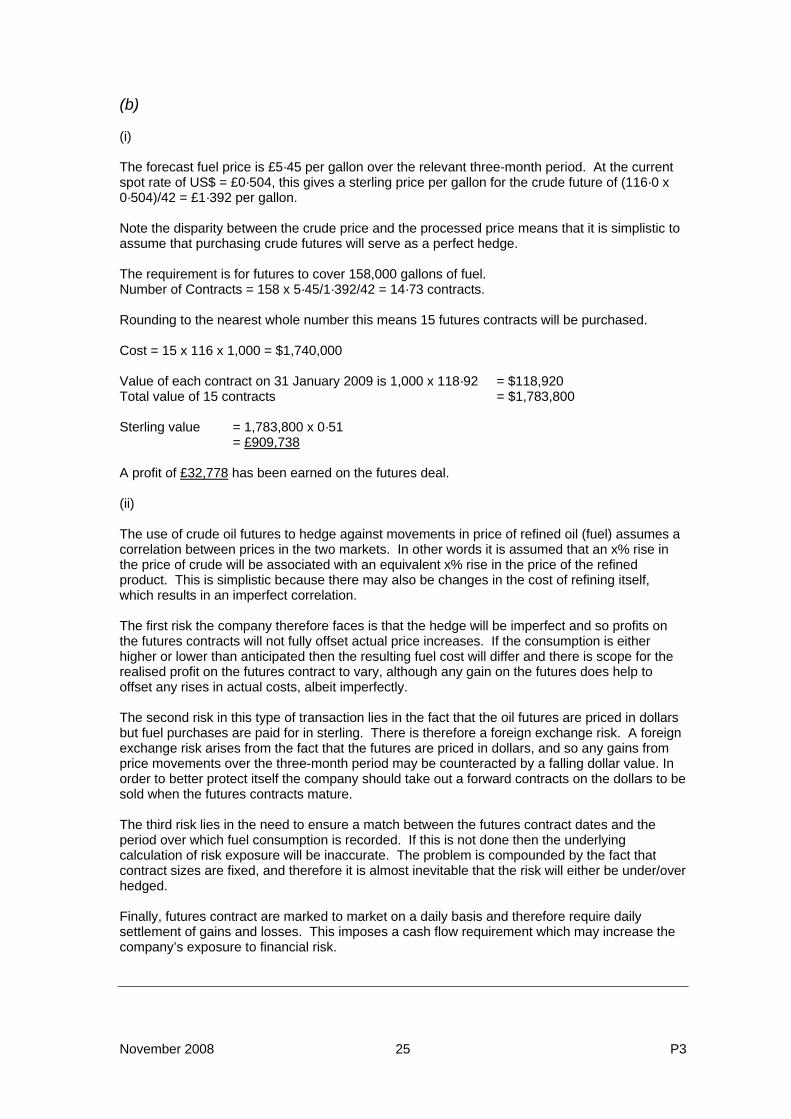
(b) (i) The forecast fuel price is £5·45 per gallon over the relevant three-month period. At the current spot rate of US$ = £0·504, this gives a sterling price per gallon for the crude future of (116·0 x 0·504)/42 = £1·392 per gallon. Note the disparity between the crude price and the processed price means that it is simplistic to assume that purchasing crude futures will serve as a perfect hedge. The requirement is for futures to cover 158,000 gallons of fuel. Number of Contracts = 158 x 5·45/1·392/42 = 14·73 contracts. Rounding to the nearest whole number this means 15 futures contracts will be purchased. Cost = 15 x 116 x 1,000 = $1,740,000 Value of each contract on 31 January 2009 is 1,000 x 118·92 = $118,920 Total value of 15 contracts = $1,783,800 Sterling value = 1,783,800 x 0·51
= £909,738 A profit of £32,778 has been earned on the futures deal. (ii) The use of crude oil futures to hedge against movements in price of refined oil (fuel) assumes a correlation between prices in the two markets. In other words it is assumed that an x% rise in the price of crude will be associated with an equivalent x% rise in the price of the refined product. This is simplistic because there may also be changes in the cost of refining itself, which results in an imperfect correlation. The first risk the company therefore faces is that the hedge will be imperfect and so profits on the futures contracts will not fully offset actual price increases. If the consumption is either higher or lower than anticipated then the resulting fuel cost will differ and there is scope for the realised profit on the futures contract to vary, although any gain on the futures does help to offset any rises in actual costs, albeit imperfectly. The second risk in this type of transaction lies in the fact that the oil futures are priced in dollars but fuel purchases are paid for in sterling. There is therefore a foreign exchange risk. A foreign exchange risk arises from the fact that the futures are priced in dollars, and so any gains from price movements over the three-month period may be counteracted by a falling dollar value. In order to better protect itself the company should take out a forward contracts on the dollars to be sold when the futures contracts mature. The third risk lies in the need to ensure a match between the futures contract dates and the period over which fuel consumption is recorded. If this is not done then the underlying calculation of risk exposure will be inaccurate. The problem is compounded by the fact that contract sizes are fixed, and therefore it is almost inevitable that the risk will either be under/over hedged. Finally, futures contract are marked to market on a daily basis and therefore require daily settlement of gains and losses. This imposes a cash flow requirement which may increase the company’s exposure to financial risk.
November 2008 25 P3

Answer to Question Three (a) There is a significant risk in IS development of obtaining a system that does not meet the needs of the user in terms of functionality, or is delivered later than scheduled due to delays in systems development or testing, or where costs exceed budget. FDS25 is an investment centre and so there is also the risk that the shared service centre may want to pursue its own goals rather than those of the other FDS business units. Therefore, it is important to have strong controls over systems development. Although there are several approaches to systems design and implementation, a commonly used approach is the Systems Development Life Cycle (SDLC). The key elements of the SDLC and the controls that could be introduced at each stage are: • Feasibility study: identifying the needs and objectives of the system by identifying current
problems and the technical, operational and economic feasibility of the proposed solution. Control: To avoid the risk of developing an unsuitable new system, at feasibility stage there should be a clear understanding of the objectives of the new system, the deliverables, its cost and its time to completion.
• Systems analysis: the design process necessary to generate the specification for the system through a methodical investigation of a problem and the identification and ranking of alternative solutions through obtaining more information than was contained in the feasibility study. This will result in a tender specification and a choice between in-house versus outsourced design. Control: The most significant risk here is the failure of the deign process to understand the needs of the business unit users and not meet functionality required in terms of the business unit’s business strategy. This problem can only be overcome by the analysts fully understanding the business and through close communication between analysts and users.
• Systems design: the conversion of specifications into a workable design including source data, input layout, file structure, reports, and interfaces with other systems and so on. Control: data security needs to be defined and the auditor needs to review system documentation, interfaces with other systems, and ensure that there has been acceptance of design by all in the project team, but especially by users.
• Implementation: this includes both hardware and software, testing, documentation and training and conversion from existing systems. Controls: Comprehensive testing needs to take place by systems development staff, programmers, users and internal auditors. There also needs to be a review of training and documentation, file conversion and operational issues, for example staffing and supervision. An implementation plan will also cover parallel running, where the new system is operated in conjunction with the existing system until such time as the new system is proven to work. IT also involves ensuring that users are satisfied with the new system and are confident about discontinuing the existing system.
• Systems operation and maintenance: The correction or enhancement of systems once they are in operation. Controls: A thorough post-implementation review of the new system should be carried out after implementation, by the project team, to establish whether the system is operating as intended and to confirm that user needs are being satisfied.
Examiners’ note: The suggestions above should be viewed as indicative rather than comprehensive. Other suitable examples would have been given credit in the marking process.
An important control throughout the design and implementation process is the establishment of a steering committee. The steering committee monitors the system implementation in comparison with the plan and ensures that specific deliverables are accepted at each stage of systems development. It has overall responsibility to ensure that the system meets requirements in terms of quality, time and cost. The steering committee brings together the sponsor of the project; the project manager who is responsible for the day-to-day delivery of the
P3 26 November 2008
project; specialist IT staff with responsibility for delivering the project; user representatives with responsibility for accepting the system; and internal auditors with responsibility for ensuring the adequacy of internal controls and system testing in conjunction with users. (b) The major risk faced by FDS25 is that the system delivered does not achieve the planned functionality, is late or exceeds the cost budget. These risks may arise whether the system is developed through either a shared service centre or through outsourcing and may then have a serious impact on the ability of FDS25 to achieve its new business strategy. (i) Shared services centres (or SSCs) provide services needed by business units within an
organisation. Shared service centres for IT offer a common service provision including systems design, data processing, IT security, generation of reports and so on. They are service-focused, enabling the internal business unit customers of the shared service centre to specify the level and nature of the service which is typically established, as for any other outsourced services, through a Service Level Agreement (SLA). Unlike outsourcing, while a split is maintained between provider and client, the IT services are retained in-house. Shared service centres have a focus on quality and customer service and the pooling of resources to achieve common aims.
Advantages of using shared service centre If IT and IM services are provided in-house, the providers need to have the ability to develop new systems, the ability to maintain and modify existing systems, the ability to support users, and adequate systems controls. • In-house IT provision has the benefit of meeting corporate IT requirements in terms of
information needed, controls and auditability;
• Detailed knowledge of the unit and its current IT requirements;
• Speed of response;
• Greater control over the service provision. Disadvantages of using shared service centre • In a SSC there may be a focus on control with policy and direction focused on Head
Office information requirements. In the context of risk, corporate requirements may impede achieving the requirements of a particular business unit;
• A further risk of developing IT and IM in-house is that the company may not have the resources or skills to undertake a major new systems development function that meets business unit requirements in terms of functionality, time and cost;
• Corporate requirements and competing business unit priorities may take precedence over the needs of a particular business unit.
• The SSC may not have the capability to provide what is required by the business unit. (ii) Outsourcing (or sub-contracting) support activities have become increasingly common in
organisations, especially in relation to the provision of IT services. Outsourcing enables organisations to concentrate on their core activities while subcontracting support activities to specialists. Outsourced services are provided to an agreed level of service, at an agreed cost and for an agreed period of time.
Advantages of outsourcing • More accurate prediction of costs, and therefore more accurate budgetary control;
• A higher standard of service because of the specialisation of the service provider;
• Economies of scale available to the outsource service provider;
• The outsourced service supplier may have a better knowledge of changing technologies.
November 2008 27 P3

Disadvantages of outsourcing IT • The difficulty of agreeing on a service level agreement (SLA) that clearly identifies the
obligations of each party;
• The loss of flexibility and inability to quickly respond to changing circumstances as the outsourced service is no longer under the control of the organisation;
• The risk of unsatisfactory quality and service, or even failure of supplier;
• Poor management of the outsource supplier;
• Risks are also involved in the tendering process, selecting a supplier and agreeing terms;
• The risk of failure of the outsource supplier;
• Risk of lack of compatibility between the system used by FDS25 and that used by the rest of the FDS group.
The risk of outsourcing and FM can be partly offset by retaining a small group of IT specialists in-house to monitor and work with the outsource supplier. Risk can also be reduced by building a long-term partnership or joint venture between both companies. Another option is to organise an outsourcing contract such that a member of the supplier’s staff is permanently located at the organisation’s premises to act as liaison between client and contractor. This is sometimes called an “implant”. Answer to Question Four (a) The principles of corporate governance that are in the Combined Code are equally applicable to public sector and third sector (not-for-profit) organisations. They are applicable whether a charity is limited by shares or limited by guarantee. There are six categories of corporate governance in the Combined Code: directors, remuneration, accountability and audit, relations with shareholders, institutional shareholders, and disclosure. The main principles applicable to HFD are in relation to directors, accountability and audit, and disclosure. Good corporate governance requires that a company be headed by an effective board with a clear division of responsibilities between running the board and running the company /charity with no individual having unfettered decision making power. There should be a balance of executive and non-executive directors so that no individual or group can dominate the board. There should be a formal and rigorous process for the appointment of directors who should receive induction training. Information should be supplied in a timely manner to board members so that the board can discharge its duties. The board should then evaluate its performance both individually and collectively each year. These principles do not seem to be applied for HFD as it is dominated by the chief executive who also acts as chair and appears to dominate the board through his appointment of non-executive directors and his control over the agenda.
P3 28 November 2008
To meet the principles of good corporate governance, HFD should • Separate the roles of chief executive and chairman with the chairman being a non-
executive director;
• Ensure that all directors are independent of influence by the chief executive. Positions should be advertised with interviews being conducted, perhaps initially by an independent person. Appointments should be for a defined period, after which directors should stand for re-election.
• Provide induction training to new board members in the goals and operations of the charity.
• Annually evaluate the performance of each director and the board as a whole.
Accountability and audit principles of good corporate governance require that a board should be able to present a balanced and understandable assessment of the company’s position and prospects, should maintain a sound system of internal control and maintain an appropriate relationship with the company’s auditors. HFD’s board does not seem to be able to make a balanced and understandable assessment of the company’s position and prospects, given the narrow confines of what the CEO/Chair allows it. The CEOs relationship with the external auditors is not appropriate as the appointment should be outside the control of a single individual. To meet the principles of good corporate governance, HFD should • Set an agenda for board meetings that encompasses a wide variety of strategic matters
including the charity’s strategy, operations, risk management, internal controls and not be limited to financial reports and proposals for funding;
• Consider meeting more frequently than quarterly;
• Obtain an independent assessment of the company’s internal controls by appointing a firm to act as (outsourced) internal auditor;
• Affirm the reporting relationship of the external auditors to the board as a whole, and not to the CEO. The external auditors may need to be changed if they are unwilling to accept this changed relationship;
• Although it is good practice, it is not necessary to have a separate audit committee, but if not, the functions of the audit committee should be carried out by the full board itself.
The disclosure principle requires that a company’s annual report contains a high level statement of how the board operates and the decisions taken by the board and management, details of board members, meetings, performance evaluation and so on. • HFD should provide adequate disclosure of board functioning in its annual report to make
this aspect of the charity transparent. (b) CIMA’s Code of Ethics for Professional Accountants makes clear that an accountant’s responsibility is more than satisfying the needs of a client, s/he must also act in the public interest. It is irrelevant whether or not the CIMA member is paid for his/her services, who are still expected to comply with the ethical principles. There are five fundamental principles in the Code of Ethics: integrity, objectivity, professional competence and due care, confidentiality, and professional behaviour. Of particular relevance to HFD are objectivity, and professional competence and due care. Objectivity may be impeded due to bias because of his/her appointment by the CEO or the influence of the CEO or other persons on the board who may align themselves with the CEO.
November 2008 29 P3
The demands of professional competence and due care mean that the accountant must look beyond the narrow agenda set by the CEO to a broader perspective than financial statements to non-financial risks (mainly in relation to the charity’s operation) and the adequacy of internal controls (as it is insufficient to rely wholly on the external auditor’s annual management letter). The conceptual framework underlying CIMA’s ethical principles requires accountants to risk manage their own position in relation to the work they are performing and in so doing to identify, evaluate and mitigate any risks they face. The main risks faced by an accountant include those relating to self-interested behaviour, self-review, advocacy, familiarity and intimidation. The major threats faced in relation to HFD are familiarity and intimidation. The accountant has been appointed to the board as a result of some prior business relationship which may affect his/her objectivity. The CEO/Chair of HFD also appears to be a dominating individual and the accountant may be intimidated by this individual, resulting in the accountant’s views not being presented accurately and/or forcefully. The accountant as board member needs to identify and evaluate the risks of familiarity and/or intimidation that s/he faces, and ensure that s/he takes appropriate action (ultimately resignation from the board) to maintain his/her independence and objectivity. Answer to Question Five (a) The major risks of fraud faced by SRN in relation to its employees can be summarised as follows: • Stock losses caused by short deliveries from Head Office. As stock is received centrally
and redistributed to each store, any of Head Office warehouse employees, delivery employees or retail store employees could steal stock as central inventory records are updated on the initial receipt of stock at Head Office and not at the retail store level.
• Stock could be stolen by employees after it is received, resulting in stock losses at the
time of a physical stocktake which is then attributed to shoplifting. • There may be unidentified stock losses as stocktakes are carried out by store employees.
Stock may have been stolen but the physical stock count may be inflated to disguise the theft.
• Discounting of stock by employees could be excessive and could result in employees
taking stock themselves or selling to friends at low prices. Theft of cash is unlikely as bank deposits are reconciled against EPOS reports on a daily basis. (b) (i) Working conditions and the HR function can play an important part in fraud/theft risk prevention as the motive for fraud can be reduced by having good working conditions and a supportive management and human resource function. The basis of fraud risk prevention is to develop an anti-fraud culture through (i) fraud prevention, and (ii) a fraud response plan.
P3 30 November 2008

Fraud prevention can take place through addressing the potential for dishonesty by employees, and reducing both the opportunities and motive for fraud. • Dishonesty can be prevented by undertaking pre-employment checks on all new
employees, in particular checking their previous job references and investigating any periods in which there was no employment (which may be the result of imprisonment);
• Supervisors need to monitor employees and where lifestyles are not supported by remuneration packages this may identify the possibility of theft taking place;
• Introducing employee discounts for purchasing can reduce the motivation for theft;
• A policy of enforced annual leave by all staff should be established and head office staff could also rotate between jobs;
• Placing managers on a profit-related bonus scheme for their store. Dishonesty can also be avoided by Head Office implementing a fraud response plan including instant dismissal, civil litigation to recover the loss, and police prosecution. When employees know the response the business will take, this leads to an anti-fraud culture being developed. An effective whistle-blowing policy will also support an anti-fraud culture through its impact on fraud prevention and response. Managers must also set the tone through their own actions. (ii) The opportunity for fraud can be reduced by separation of duties, controls over
transaction recording and the physical security of assets. Separation of duties is almost impossible in a small store with few employees and the opportunity for transaction mis-recording is limited other than for cash sales.
Operational internal controls to reduce fraud could include: • Monthly rather than quarterly reporting which would enable faster investigation of
discrepancies;
• Documentation to accompany transfers of stock from head office to stores with recording of discrepancies at the store level, and immediate notification to Head Office of discrepancies;
• All price discounting to be controlled by Head Office based on a formula linked to age of stock, and automatically applied by the EPOS terminal. This would remove local discounting. Overriding the central price should only take place by the store manager entering an authorisation code, with any discounting then becoming the responsibility of the store manager;
• Implementation of electronic tags to reduce shoplifting;
• Store manager checks of employee bags before they leave the store;
• CCTV to monitor employees, for review by Head Office security employees;
• Independent physical stocktakes by employees from other stores or from Head Office to identify unreported stock losses;
• More frequent and unscheduled visits by regional managers including carrying out spot checks on stock.
November 2008 31 P3