Embed Size (px)
Citation preview

NOVEL COMMINUTION MACHINE MAY VASTLY IMPROVE CRUSHING-GRINDING
EFFICIENCY
Lawrence Nordell and Alexander Potapov
Conveyor Dynamics, Inc.
1111 W Holly Street, Suite A
Bellingham, WA 98225

2
NOVEL COMMINUTION MACHINE MAY VASTLY IMPROVE
CRUSHING-GRINDING EFFICIENCY
ABSTRACT
A Conjugate Anvil-Hammer Mill (CAHM) has the potential to replace conventional crushers and
SAG mills, with their respective conveyors and stockpiles, in a SABC circuit. It may improve
comminution circuit efficiency by 100%. CAHM compresses rock in a more efficient way, similar to 19th
century stamp mills, which follows the fundamental research of Schönert (1990 & 1996). CAHM
efficiency is being proven through the use of ROCKY (2011) Discrete Element Method (DEM). ROCKY
features allow it to simulate realistic comminution. CAHM is customizable with many geometries that are
rock-property specific. ROCKY’s wear modeling compliments the structural integrity of the design.
KEYWORDS
Conjugate Anvil-Hammer Mill, Comminution, Crushing, DEM, ROCKY, SAG, HPGR, CAHM,
Sweet Spot, Gyratory Crusher
INTRODUCTION
Imagine a comminution machine with the following attributes:
As a Gyratory and Cone Crusher Alternative:
1. Comminutes >1000 mm rock depending on CAHM Anvil-Hammer ring sizes and machine width
2. Comminutes rock > 20 to 1 size reduction ratio in one pass
3. Grinding mechanical efficiency is greater than 90% – no eccentric; minimal gearing
4. In-pit crushing and underground versions are possible
5. Rock is fractured with high compressive force exerted by the hammer ring on a packed particle bed
6. Rock is comminuted in a compressed bed of particles similar to HPGR, but with a lower wear rate
7. Eccentric mechanism is not required – vibration, and other mechanical losses are minimized
8. No grinding media, water, air or other transport agents are required – gravity feed and discharge
Complements HPGR Circuit Design:
9. Controls comminution void ratio and is less sensitive to product moisture, plasticity, and cohesion
10. Dust removal not required
11. Many grind surface textures available – optimized for desired products
12. More efficient wear surface replacement with easy access, manage mass, and without roller removal
13. High volume comminution zone in one pass separating large and small rock fracture zones
14. Rock nip angle less than 16 degrees and becomes finer with smaller size fractions
15. Controls production on constant force not on constant gap with a packed particle bed
16. Can improve rock-machine edge seal and rock comminution differential present in many HPGRs
Capacity and Other Benefits:
17. Capacity can exceed 6,000 t/h when compared to present maximum HPGR 2.8 m dia. roller size
18. Capacity is controlled with variable speed drives and machine dimensions
19. Runs 6-10 times as fast as an HPGR, where HPGR is limited to ~1 m/s roller surface speed
20. Advantage of reducing carbon footprint and operating costs
21. Effective tramp metal release capability with half the roller mass as a similar sized HPGR
22. Screening and classification is not mandatory in some circuits

3
23. Circuit simplification through eliminating conveyors and stockpiles
24. Efficient particle bed packing created in the crush zone, thus improving efficient energy transfer
25. Minimal engineering footprint
26. Flexible design – opportunity to install units in series to achieve a target fine-grind
27. Much tighter size control that may enhance downstream liberation process (heap-leach; flotation)
CAHM may prove to exceed the above predictions.
HISTORY & FUTURE
This is a tale of two comminution machines. The first is the SAG mill: A well-respected and
highly used comminution device. The second is a novel comminution machine called CAHM: A machine
that may take the comminution circuit and plant performance to a much higher level.
SAG MILL ADVANCEMENTS
Improving SAG Mill Performance with Competent Rocks
SAG performance is claimed by many comminution practitioners to be a function of “charge
motion.” Computer generated models of the charge and liner interactions are said to modify the geometry
of the charge motion and in so doing improve the performance of the mill. But how is “charge motion”
improving performance?
Seasoned mill practitioners understand that “charge motion” is a two-part problem. First, the mill
liner shape increases the charge circulation rate, and second, it increases the critical particle-to-particle
contact intensity by lifting the charge higher on the mill wall. The particle-to-particle contact intensity
results from higher hydraulic head pressure exerted on the critical comminution zone discussed below.
Figure 1 - Cadia 40 ft SAG mill; 565 mm high CDI lifer in aqua & low in rose;
300 mm prior Cadia lifters in pink & green
The SAG mill still has performance potential that has yet to be realized. CDI introduced
performance potential in four separate SAG 2001 papers (Herbst & Nordell; Nordell, Potapov, & Herbst;
Qiu, Potapov, Song, & Nordell; Song, Qiu, Potapov, & Nordell) and again at SAG 2006 (Hart, Nordell, &
Faulkner) with an extension of the earlier work showing theory vs. practice and potential. Even though
the 2006 modification was successful in upgrading the Cadia 40 ft. SAG mill with longer liner life,
improved throughput, and more efficient kW-h/t, the upgrades fell short of the 40 ft mill’s potential.
Figure 1 shows the Cadia 565 mm high lifters. The liner height and pitch needed to be increased
further to realize this potential. DEM is the essential tool that has and will guide these improvements in
ore comminution, wear life, and in predicting machine stress limits.
4
Discrete Element Modeling (DEM) Tools
In our previous work, Nordell et al (2001) explained aspects of:
a) Comminution breakage mechanics
b) Improved SAG mill liner shapes
c) Liner wear prediction in mills
d) DEM-guided Population Balance Modeling (PBM) enhancements
These components served to better understand what was possible and what the obvious next steps
were. CDI and Metso showed that the full mill granular behavior could be simulated with rock, ball, fluid,
and gas using the Cadia 40 ft SAG mill (Hart et al, 2006). All of above mentioned advancements could
only be explored using the latest DEM code.
In 2010, Comminution Technology (CT), in association with CDI, grew our granular flow code
into a commercial version, ROCKY. CT has further advanced developments in ROCKY by improving run
time with speeds 100 times faster than previous versions. ROCKY, when run on 32-core computers, can
simulate full comminution processes including breakage and wear actions in crushers, mills, and HPGRs.
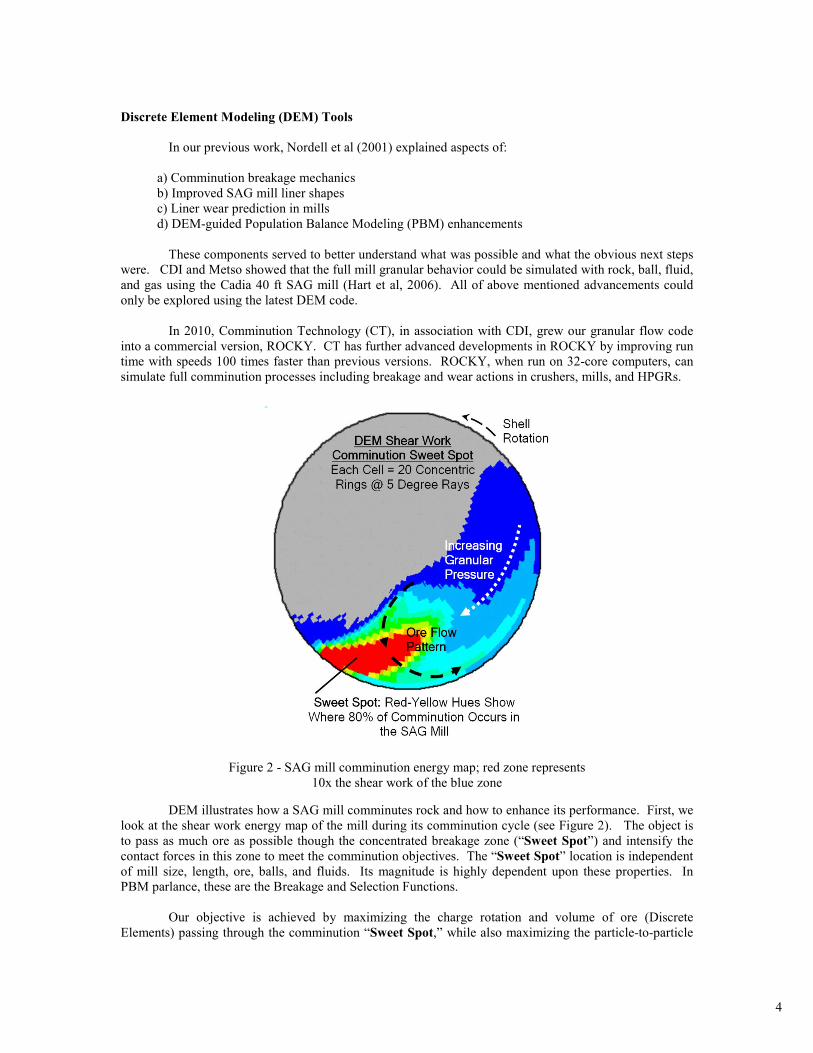
Figure 2 - SAG mill comminution energy map; red zone represents
10x the shear work of the blue zone
DEM illustrates how a SAG mill comminutes rock and how to enhance its performance. First, we
look at the shear work energy map of the mill during its comminution cycle (see Figure 2). The object is
to pass as much ore as possible though the concentrated breakage zone (“Sweet Spot”) and intensify the
contact forces in this zone to meet the comminution objectives. The “Sweet Spot” location is independent
of mill size, length, ore, balls, and fluids. Its magnitude is highly dependent upon these properties. In
PBM parlance, these are the Breakage and Selection Functions.
Our objective is achieved by maximizing the charge rotation and volume of ore (Discrete
Elements) passing through the comminution “Sweet Spot,” while also maximizing the particle-to-particle

5
contact shear work. Particle shear and impact work is maximized by lifting the ore charge (kidney) higher
up on the mill shoulder to intensify the pressure on the charge toe. This is achieved by increasing the lifter
height and pitch, while selecting its profile to release the ore from the charge shoulder without the ore and
balls’ trajectory impinging on the charge toe. The balls add density to the charge that magnifies granular
charge pressure, shear, and impact work as it passes through the “Sweet Spot.” The charge mass must be
balanced between more shear and impact work intensity, more ore volume to be circulated, vs. longer
lifter-liner life.
Cadia was a good starting point to test these concepts. However, Cadia did not proceed further
with the successes published in SAG 2006.
Improving SAG Mill Comminution Rate
Figure 3 - Patented SAG mill liner (CDI-9)
A patented liner (Nordell, 2009) was developed called CDI-9 (Figure 3) to enhance comminution
by minimizing particle slippage on the lifter face as it impacts the ore charge toe. The CDI-9 lifter height
was raised from 420 mm above the plate (565 mm overall) to 650 mm (55% increase) above the plate (800
mm overall). Lifter size, pitch, and shape were explored and compared with Cadia 2006 CDI-7 and their
bidirectional (Bi-Dir) lifter geometry installed before CDI-7. Figures 4 - 7 illustrate the comparisons.
0.001
0.01
0.1
1
10
10 100 1000
Single Collision Energy (J/kg)
Particle to Particle (W/kg)
1
10
100
1000
10000
Particle to Lifter (W)
BiDir 31mm CDI7 31mm CDI9 31mmBiDir 65mm CDI7 65mm CDI9 65mmBiDir 100mm CDI7 100mm CDI9 100mmBiDir Lifter CDI7 Lifter CDI9 Lifter
Figure 4 - Comparison of lifter profiles and shear energy rate bi-directional lifter
(Cadia old) vs. CDI-7 (present) vs. CDI-9 (proposed fluted or grooved face)
6
Figure 4 shows a DEM simulation by particle size of the work done on three Cadia designs. The
smallest particle group (31 mm diameter) could achieve more than 50% higher total collision energy with
the combined higher lift, fluted surface geometry, and decreased pitch to 39 lifters from the original 78.
Similar magnitudes in collision energy were noticeable at 100 mm particle size. Greater particle sizes do
not fit within the grooves and are likely less influenced by the restricted motion.
DEM can assist with SAG mill life and comminution improvements in many areas, including feed
chute entry and exit pan lifters, grate geometries, and exit pan geometries together with the lifter systems.
For example, the feed chute on most large mills decreases liner life due to the concentrated ore feed
impact. We estimate liner life is shortened by ~7% on the 40 ft Cadia SAG mill.
Example: Cadia SAG Mill Redesign
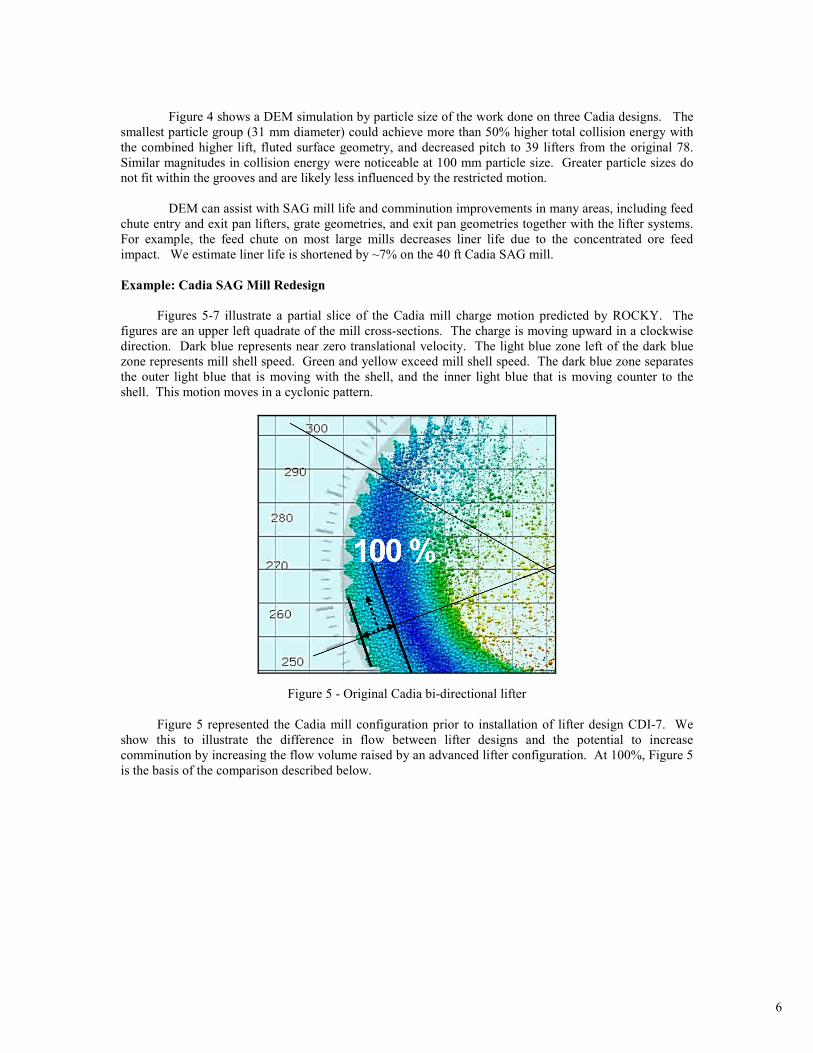
Figures 5-7 illustrate a partial slice of the Cadia mill charge motion predicted by ROCKY. The
figures are an upper left quadrate of the mill cross-sections. The charge is moving upward in a clockwise
direction. Dark blue represents near zero translational velocity. The light blue zone left of the dark blue
zone represents mill shell speed. Green and yellow exceed mill shell speed. The dark blue zone separates
the outer light blue that is moving with the shell, and the inner light blue that is moving counter to the
shell. This motion moves in a cyclonic pattern.
Figure 5 - Original Cadia bi-directional lifter
Figure 5 represented the Cadia mill configuration prior to installation of lifter design CDI-7. We
show this to illustrate the difference in flow between lifter designs and the potential to increase
comminution by increasing the flow volume raised by an advanced lifter configuration. At 100%, Figure 5
is the basis of the comparison described below.
7
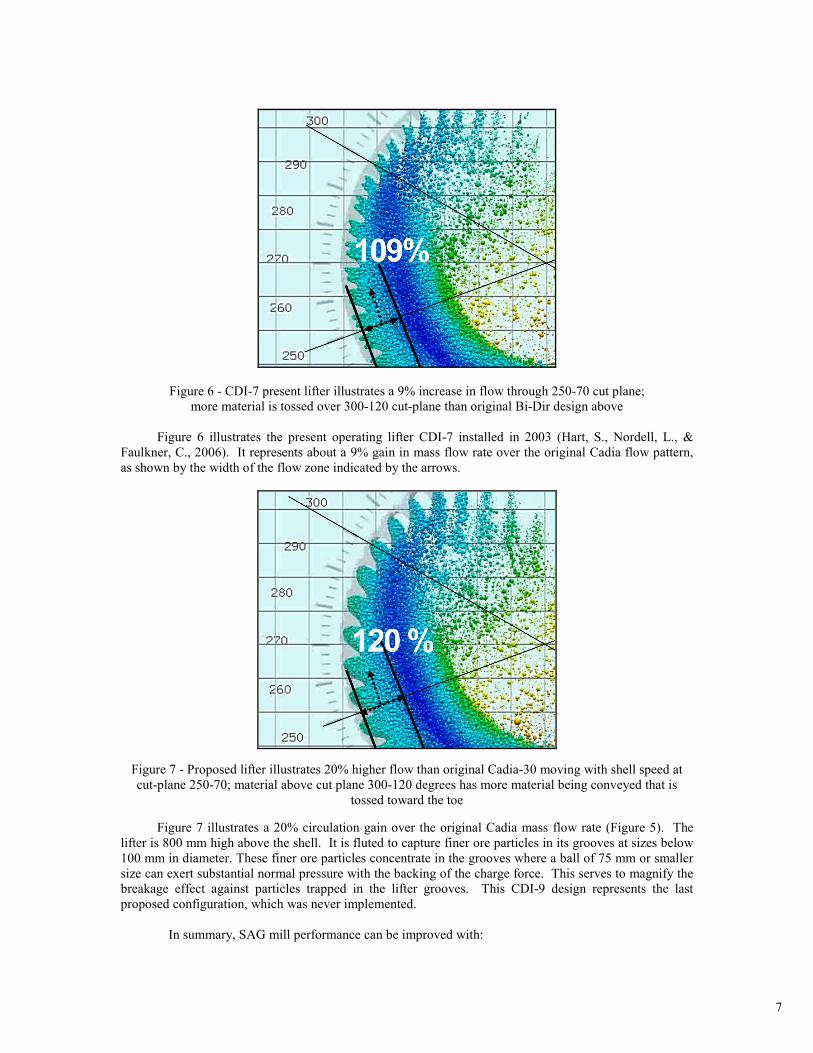
Figure 6 - CDI-7 present lifter illustrates a 9% increase in flow through 250-70 cut plane;
more material is tossed over 300-120 cut-plane than original Bi-Dir design above
Figure 6 illustrates the present operating lifter CDI-7 installed in 2003 (Hart, S., Nordell, L., &
Faulkner, C., 2006). It represents about a 9% gain in mass flow rate over the original Cadia flow pattern,
as shown by the width of the flow zone indicated by the arrows.
Figure 7 - Proposed lifter illustrates 20% higher flow than original Cadia-30 moving with shell speed at
cut-plane 250-70; material above cut plane 300-120 degrees has more material being conveyed that is
tossed toward the toe
Figure 7 illustrates a 20% circulation gain over the original Cadia mass flow rate (Figure 5). The
lifter is 800 mm high above the shell. It is fluted to capture finer ore particles in its grooves at sizes below
100 mm in diameter. These finer ore particles concentrate in the grooves where a ball of 75 mm or smaller
size can exert substantial normal pressure with the backing of the charge force. This serves to magnify the
breakage effect against particles trapped in the lifter grooves. This CDI-9 design represents the last
proposed configuration, which was never implemented.
In summary, SAG mill performance can be improved with:
8
• greatest ore volume movement per rotation cycle
• highest RPM that maximizes the charge shoulder height
• highest specific pressure at the charge toe
The charge toe region is where ore currents change direction between concurrent motion with the
shell and counter-current motion to the shell (Figure 2), thereby maximizing the shear work “Sweet Spot”
on the ore in a stirring motion.
CONJUGATE ANVIL-HAMMER MILL (CAHM) – A NEW COMMINUTION MACHINE
The idea for CAHM came from studying the SAG Mill comminution “Sweet Spot” (Figure 2).
How can the “Sweet Spot” be intensified aside from using uranium balls? One idea was to apply an
internal heavy roller assembly within the mill atop the toe charge surface. Exploring these concepts led to
a machine that processes ore without grinding media and water by using two rotating circular surfaces.
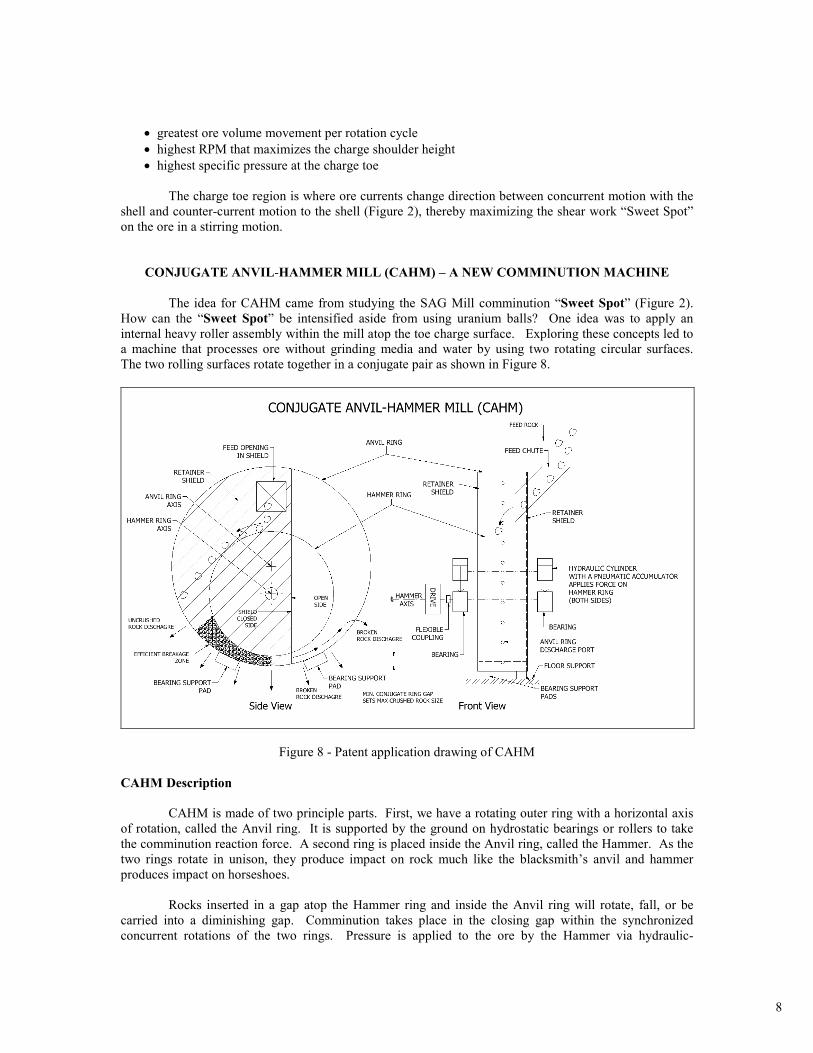
The two rolling surfaces rotate together in a conjugate pair as shown in Figure 8.
Figure 8 - Patent application drawing of CAHM
CAHM Description
CAHM is made of two principle parts. First, we have a rotating outer ring with a horizontal axis
of rotation, called the Anvil ring. It is supported by the ground on hydrostatic bearings or rollers to take
the comminution reaction force. A second ring is placed inside the Anvil ring, called the Hammer. As the
two rings rotate in unison, they produce impact on rock much like the blacksmith’s anvil and hammer
produces impact on horseshoes.
Rocks inserted in a gap atop the Hammer ring and inside the Anvil ring will rotate, fall, or be
carried into a diminishing gap. Comminution takes place in the closing gap within the synchronized
concurrent rotations of the two rings. Pressure is applied to the ore by the Hammer via hydraulic-

9
pneumatic pistons, acting on the hammer shaft similar to how HPGR applies pressure to a bed of particles
via the hydraulic-pneumatic system. Ore can be fed from one or both sides. Retainer shields are fitted at
the open ends to contain the feed within the compression zone.
Potential Applications of CAHM
From this overview, many design options are possible. The CAHM builds upon the work
completed by Dr. Klaus Schönert. Schönert et al. (Fuerstenau, D.W., Kapur, P.C., Schönert, K., &
Marktscheffel, M., 1990; Schönert, 1996) stated that the most efficient way to break a rock is to squash it
between two parallel platens. Out of this fundamental research the HPGR was patented and developed.
A noticeable trend in the minerals beneficiation industry is the ever increasing tonnages that
require processing. Multiple trains are the norm, and the industry is in need of a high capacity and a more
energy-efficient device.
CAHM administers the compression fracture in a much longer stroke, with over 90 degrees of
machine rotation, with a much smaller nip angle that can be controlled by the ratio of Anvil and Hammer
diameters. CAHM has the benefit of being able to process a much wider and coarser size distribution than
the HPGR. HPGR ore size is limited by feed preparation. The HPGR operating gap is largely dictated by
the dimension of the rolls. The operating gap is proportional to the roll diameter (2-3% of diameter).
CAHM geometry allows large rocks to be processed, the size of which will likely be a function of both ore
competency and the roll diameter. Recall also that CAHM can operate at or beyond 6x HPGR’s speed.
Large rocks can begin to comminute above the maximum nip angle or above the Anvil axis.
CAHM vs. Gyratory Crusher
The operating principle of the CAHM can be envisioned as a gyratory crusher (Gupta, A., & Yan,
D.S., 2006, p. 130, fig. 5.2) with its axis rotated horizontal and the mantle and concave surfaces both rotate
in unison.
Figure 9 represents a comparison of nip angle vs. rock diameter for 5 different noted crushing
machines.
Figure 9 - Nip angle vs. rock diameter
Comparisons are shown of the gyratory crusher with two configurations of nip angle (green and
light blue) plotted against the rock diameter above the minimum close side setting (CSS). These
geometries were taken from the two manufacturers’ catalog data. The 26 degree rated gap angle only
10
becomes efficient at grabbing all rocks when the nip angle is below 15 degrees, or < 200 mm rock size.
These curves represent gyratorys in 54”x74”; 60”x89” size class. A gyratory crusher mantle surface speed
is rated up to 30 m/s for the larger size ranges and at the mantle’s 2261 mm (89”) larger diameter and 275
rpm.
Therefore, it can be argued that CAHM could also be able to achieve this higher surface speeds.
Since CAHM has no eccentric motion, imbalance forces are not near the issue of the gyratory. It may not
be practical for less obvious reasons that will only become evident with testing. Comparing an HPGR at
2800 diameter and surface speed closer to 1 m/s, it can be demonstrated that CAHM’s possibility, for very
large capacities, will increase with respect to the HPGR.
The Hammer ring width becomes the size limiting factor for rock size and external bearing
supports. At 1000 mm rock size, the Hammer ring would need to be sized > 1200 mm.
We note the HPGR nip angle (dark blue) does not become efficient (< 15 degree nip angle) until
the rock size is below ~75 mm. The definition of HPGR’s nip angle is debatable. Is it the contact normal
with the rock or between rock normal and the horizontal plane, as noted by Gupta and Yan in 2006 (p. 144,
fig. 6.2.)
The geometry of CAHM allows a rock of 85 cm to enter the crushing chamber without the heave
and slide often noticed in the gap of a gyratory crusher. The maximum size reduction ratio for a gyratory
crusher is of the order of 6:1. CAHM is capable of higher reduction ratios above 10:1 with competent ore.
The reduction ratio limitation is strength-based as opposed to rock-size based. Reduction ratios greater
than 20:1 may be realized with medium competent ores. Our studies show there is also a much tighter size
range than offered by the gyratory or cone crusher. The minimum gap and exit ports produce a steeper %
passing range than the noted eccentric motion crushers. This should offer process optimization advantages
in the downstream heap leach or flotation circuit.
See also CAHM with a 0.7 and 0.75 ratio of Hammer to Anvil ring diameters (red and purple).
Nip angles vary with respect to the CAHM diameter ratios. For 800 mm rock, at 7.5m Hammer diameter
(purple), the nip angle is about 14 degrees. For the 2.8 m diameter Hammer (red), the maximum rock size
will likely be no greater than 500 mm and have a largest nip angle of 16 degrees. Larger rock may be
digested by the smaller machine if the Hammer width is capable.
A major issue is the size of competent rock that occupies one pocket once comminution begins.
Without the pocket’s exit ports or pressure-reducing ports between pockets shown (Figure 11), the force on
the CAHM frame would need to be much larger than an HPGR to capture the large rock breaking force. In
addition, the Hammer shaft bearing loads, from side to side, need further quantification with respect to the
rock size rating. These details are currently under investigation.
ROCKY 3-D DEM code does define all system forces between rock and machine reaction
surfaces and has been validated with real plant data.
CAHM will have individual cast tiles attached to the Anvil shell and to the Hammer ring
protrusions or other wearing surfaces. The attachment methods are not a part of this presentation. We do
offer the ability to individually remove sections while leaving the Hammer and Anvil rings in place. The
removal is envisioned to be supported by hydraulic assemblies that are able to change all surfaces in less
than an 8-hour shift, including end-plate shields.
11
HPGR vs. CAHM
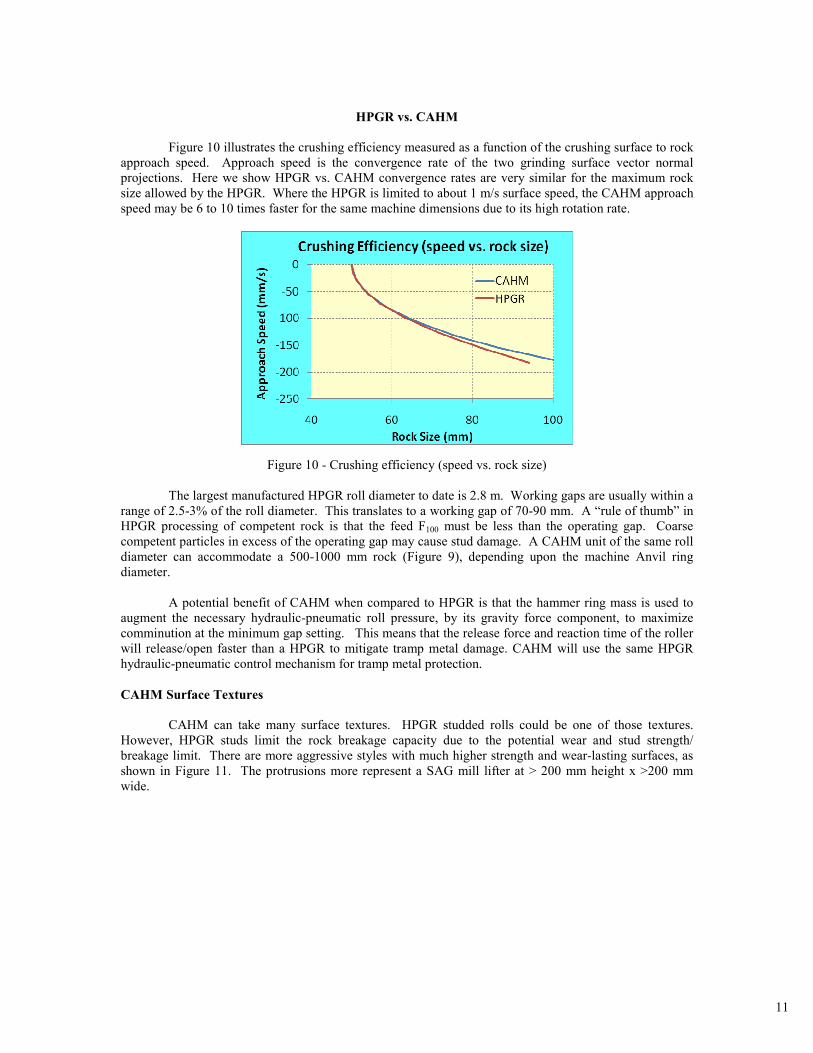
Figure 10 illustrates the crushing efficiency measured as a function of the crushing surface to rock
approach speed. Approach speed is the convergence rate of the two grinding surface vector normal
projections. Here we show HPGR vs. CAHM convergence rates are very similar for the maximum rock
size allowed by the HPGR. Where the HPGR is limited to about 1 m/s surface speed, the CAHM approach
speed may be 6 to 10 times faster for the same machine dimensions due to its high rotation rate.
Figure 10 - Crushing efficiency (speed vs. rock size)
The largest manufactured HPGR roll diameter to date is 2.8 m. Working gaps are usually within a
range of 2.5-3% of the roll diameter. This translates to a working gap of 70-90 mm. A “rule of thumb” in
HPGR processing of competent rock is that the feed F100 must be less than the operating gap. Coarse
competent particles in excess of the operating gap may cause stud damage. A CAHM unit of the same roll
diameter can accommodate a 500-1000 mm rock (Figure 9), depending upon the machine Anvil ring
diameter.
A potential benefit of CAHM when compared to HPGR is that the hammer ring mass is used to
augment the necessary hydraulic-pneumatic roll pressure, by its gravity force component, to maximize
comminution at the minimum gap setting. This means that the release force and reaction time of the roller
will release/open faster than a HPGR to mitigate tramp metal damage. CAHM will use the same HPGR
hydraulic-pneumatic control mechanism for tramp metal protection.
CAHM Surface Textures
CAHM can take many surface textures. HPGR studded rolls could be one of those textures.
However, HPGR studs limit the rock breakage capacity due to the potential wear and stud strength/
breakage limit. There are more aggressive styles with much higher strength and wear-lasting surfaces, as
shown in Figure 11. The protrusions more represent a SAG mill lifter at > 200 mm height x >200 mm
wide.

12
Figure 11 - Left image: Two-pocket slice of CAHM DEM simulation with coarse feed (noted in Figure 17
below), counter-clockwise rotation. Right image: Expanded view of cut plane through center of Anvil
pocket; shows Hammer ring teeth engaging Anvil ring pocket.
Figure 12 (left) - Heavy-pinned textured surface; pin size 200-300 mm diameter x height. Hammer pins
force the ore through the Anvil ring ports.
Figure 13 (right) - Heavy-blade textured surface; blade size 200-400 mm height x width. Hammer blades
force the ore through the Anvil ring ports between blades.
Pre-Screened Undersize Discharge
Anvil Liner “Pocket”
Hammer Liner “Tooth-Protrusion”
Anvil Rock Exit Port
Anvil-Hammer Full Tooth Pocket
Engagement
Anvil Pressure Equalizing Ports

13
Figure 14 (left) - Fine-grinding with tapered rings and tungsten carbide blade partitions produce HPGR-
like deep particle bed comminution zones for fine grinding. Ore removal by plows (not shown).
Figure 15 (right) - Fine-grinding HPGR textured surfaces; pin size 20 mm diameter x height. Ore is
removed via special plows (not shown) similar to the Horomill.
By the time the Hammers and Anvils conjugate, the product is unstressed and is unconfined as the
two surfaces converge, in synchronous, into the comminution state. CAHM has a continuous comminution
cycle that captures rocks in the Anvil pockets prior to the application of the compression forces (Figures
11-14). This action minimizes abrasive motion between rock and CAHM liner surfaces. Given the CAHM
surfaces are far more robust, the liner life is expected to be many times longer than the typical HPGR. A
wear model similar to that presented in 2001 (Qiu, X., Potapov, A., Song, M., & Nordell, L.), will provide
the magnitude of differences. Compare HPGR 20 mm pins (Figure 15) to CAHM 200 mm posts (Figures
11-14) which have 100 times the structural and wear size.
CAHM can significantly improve the present rock-HPGR edge seal. Rock is delivered behind a
special seal that will not allow rock transport into the seal edge space.
ROCKY DEM Simulation of CAHM and HPGR
Figure 16 shows that the ROCKY DEM program accurately follows comminution fine grind
action in the HPGR simulation down to about 35 mm from the original 100 mm feed size.
Figure 16 - Illustration of HPGR fine feed comminution results (experiment)
compared with ROCKY DEM breakage simulation

14
How does CAHM perform against an HPGR with known performance indices? A known coarse
feed is simulated in the HPGR and into the CAHM. Figure 17 illustrates the products generated by each
machine. We note the CAHM will not produce the high degree of caking breakage that is experienced in
the HPGR. This is due to the CAHM’s Anvil shell discharge ports, pockets, and pressure-equalizing ports
between pockets within its casting configuration.
Figure 17 - Left image: HPGR DEM rock breakage simulation with coarse feed. Compare with CAHM
(Figure 11). Right image: Graph comparing DEM simulation size reduction of CAHM vs. HPGR
The comminution efficiency for the CAHM, at the above product breakage curves, consumes
about 50% of the power required of the HPGR. (HPGR = 0.48 kW-hr/t | CAHM = 0.23 kW-hr/t.)
In addition, HPGR field measurements, for fine feed stock and product illustrated in Figure 18,
results in a work index of 0.77 kW-hr/t. CAHM (New Mill) digests the same feed stock and produces a
work index of 0.38 kW-hr/t per the DEM simulation. Again, this shows a 50% power benefit for slightly
coarser product size. This, in part, is due to the pressure-relieving ports, which can be sized to control the
product size, void ratio and degree of caking.
Figure 18 - Graph comparing DEM simulation size reduction of CAHM vs. HPGR for fine feed

15
SUBJECTIVE ADVANTAGES
Presently, the advantages of this new technology are unverified. We offer a view of what the
future might be, given the potential of CAHM.
Gyratory Crusher vs. CAHM Performance
A gyratory crusher crushes large rocks at a high rate consuming 0.2 to 0.5 kWh/t. During
crushing, rocks rotate and slide on the mantle and concave surfaces until the rock’s geometry and crusher
nip angle agree on a stable self-locking position where very large forces are applied to the rock resulting in
fracture. Approximately 30% substantial energy is consumed in maintaining the mechanical power load.
Surface wear is generated by metal gouging during this comminution process.
CAHM, as a rule, does not allow rock sliding during comminution, except within the Anvil ring
pocket. Once captured within the pocket, a significant portion of undersized rock is passed through the
port with little or no further comminution until a packed bed is established within the pocket. The hammer
ring then compresses the packed bed until its geometry fully engages the Anvil pocket.
CAHM Circuit Configuration
As a primary crushing circuit, CAHM must have an Anvil diameter equal to or larger than 8 m for
1000 mm size rock. A 5.5 m diameter Hammer ring will allow feeding on this larger rock size.
Comminution capacity will set the machine width. Due to rock size, the Hammer ring would need to be
about 1200 mm diameter. The size reduction will vary with mill usage and shell port sizing. If the product
is going to be used for heap leaching, the port size can be fitter to produce a 30 mm rock. Care must be
taken with the smallest port to allow reasonable wear and increase in product size. A 20:1 reduction still
allows a reasonable void ratio that will avoid heavy caking of comminuted rock. It will allow a good
portion of undersized rock to be flushed and avoid comminution, if this is desired. The maximum
discharge rock size will be close to 50 mm. This sets the second stage to either feed a HPGR or another
CAHM.
A second stage CAHM would likely be configured per Figure 14. This machine will form a
particle bed and comminute like a HPGR. Trials are in planning to measure its efficiency vs. a HPGR. If
the machine can reduce the rock product to 5 mm, this would be a good feed size for a vertical ball mill.
CONCLUSION
SAG mill performance can be improved beyond today’s practice. This paper highlights insight
into the main mechanisms. The improvements are directly applicable to AG mills. SAG mills must also
factor the cost of ball grinding media optimized against performance as the role of ball density plays on the
PBM breakage and selection functions. We claim overall performance can be improved by another 20% or
more by modifying the mill lifer shape, pitch, and attachment capabilities. Special consideration must be
noted on the improvements to fine grinding with the fluted lifter geometry (Figure 3). Wear performance
has not been carried out. This is a necessary next step.
CAHM utilizes knowledge from the past experiences of stamp mills and HPGRs with the
potential to change the landscape of crushing and grinding vs. common practice over the past 50 years.
Large scale applications are likely to be cost effective if compared to current primary and secondary
crushing applications.
Two international mill vendors are currently negotiating in CAHM’s development. The
technology invention is minimal. Most of the functions and mechanics are well known. We anticipate the
prototype trial will have a throughput of 700 to1000 t/h.
16
REFERENCES
Conveyor Dynamics, Inc. (2000). Conveyor belt transfer chute modeling and other applications
using the discrete element method in the materials handling industry. SME 2000.
Fuerstenau, D.W., Kapur, P.C., Schönert, K., & Marktscheffel, M. (1990). Comparison of energy
consumption in the breakage of single particles in rigidly mounted roll mill with ball mill grinding.
International Journal of Mineral Processing, 28, 109-125.
Gupta, A., & Yan, D.S. (2006.) Mineral processing design and operations: An introduction.
Amsterdam, The Netherlands: Elsevier B.V.
Hart, S., Nordell, L., & Faulkner, C. (2006). Development of a SAG mill shell liner design at
Cadia using DEM modeling. SAG Conference 2006. Vancouver, B.C.
Herbst J., & Nordell L. (2001). Optimization of the design of SAG mill internals using high
fidelity simulation. SAG Conference 2001.Vancouver, B.C.
Nordell L., Potapov A., & Herbst J. (2001). Comminution simulation using discrete element
method (DEM) approach: From single particle breakage to full-scale SAG mill operation. SAG Conference
2001.Vancouver, B.C.
Nordell, L.K. (2009). US patent No. 7,497,395 B2. Washington State: U.S. Patent and Trademark
Office.
Nordell, L.K. (2011). Provisional Application for US patent Matter No. P218052PV; SN
61/452,996. Washington State: U.S. Patent and Trademark Office.
Qiu, X., Potapov, A., Song, M., & Nordell, L. (2001). Prediction of wear of mill lifters using
discrete element method. SAG Conference 2001.Vancouver, B.C.
ROCKY (Version 1.0.0) [Computer software]. Bellingham, WA: Comminution Technology, JV.
Schönert, K. (1996). The influence of particle bed configurations and confinements on particle
breakage. International Journal of Mineral Processing, 44-45, 1-16.
Song, M., Qiu, X., Potapov, A., & Nordell, L. (2001). Millstat: A software package for statistical
analysis of mill databases. SAG Conference 2001.Vancouver, B.C.