Embed Size (px)
Citation preview

Nova Ligação por FSW de Materiais Poliméricos
Temperature Measurement and Parameter Optimization of Polyethylene Friction Stir Welding Butt Joints
José Francisco Cardoso Miranda
Master’s Dissertation
Supervisor: Prof. Dr. Pedro Miguel Guimarães Pires Moreira
Co-supervisor: Eng. Shayan Eslami
Integrated Masters in Mechanical Engineering
Faculty of Engineering of the University of Porto
March 2017


i
To my family and friends

ii

Temperature Measurement and Parameter Optimization of PE FSW Butt Joints
iii
Resumo
Preocupações de carácter económico e ambiental têm conduzido a uma procura e
desenvolvimento incessante para a aplicação de novos materiais e tecnologias, que permitam
reduzir o peso de componentes utilizados na indústria dos transportes.
Devido à sua baixa densidade, baixo custo, elevada resistência específica e elevada
resistência à corrosão, a utilização de polímeros nesta indústria aumentou substancialmente ao
longo dos últimos anos, com repercussão na procura por novas tecnologias de processamento
e especialmente de novos métodos de ligação. Técnicas de ligação que visam eliminar ou
reduzir os principais defeitos associados com os métodos convencionais, a concentração de
tensões e o peso acrescido das ligações aparafusadas, ou o tempo excessivo de processamento
das ligações adesivas, são factores que motivam a procura por novas técnicas de ligação.
A Soldadura por Fricção Linear é um processo de ligação, que embora tenha sido
originalmente desenvolvido para soldar ligas reactivas como o alumínio e o magnésio,
começou recentemente a ser estudado, desenvolvido e modificado para que pudesse ser
aplicado para unir polímeros. O processo referido apresenta múltiplas vantagens em relação
aos métodos convencionais, das quais se destacam a não adição de componentes nem material
durante o processo, uma distribuição de tensões uniforme e a possibilidade de utilizar
diferentes configurações de junta.
O trabalho experimental realizado foi focado na optimização dos parâmetros de soldadura
(diâmetro da ferramenta, velocidade de rotação, velocidade de translação e força axial) com o
objectivo de optimizar os parâmetros de soldadura com o intuito de aumentar a resistência da
soldadura. As soldaduras foram realizadas em placas de polietileno com 3 mm de espessura,
na configuração topo-a-topo. Posteriormente, estas placas foram seccionadas em provetes e
estes testados à tracção de modo a aferir a resistência da soldadura.
Uma vez que a temperatura é um factor crucial em qualquer método de ligação por
soldadura, recorreu-se a termopares, colocados em várias posições no cordão de soldadura, de
maneira a obter uma melhor compreensão da influência deste factor no processo e a influência
das variáveis na geração de calor.
Os resultados foram analisados com recurso aos métodos estatísticos de variância
(ANOVA) e Taguchi Design of Experiments (DOE), que permitiram identificar os parâmetros
de soldadura com maior impacto na resistência final das juntas e optimiza-los.
Uma eficiência máxima de junta de 97% foi atingida para uma das combinações de
parâmetros testada. Todos os factores variáveis (parâmetros DOE) tiveram uma importância
estatística significativa nos resultados.
A velocidade de rotação da ferramenta tem a maior contribuição percentual no processo
(40%), seguida da velocidade de translação (21%), diâmetro da ferramenta (12%) e força

Temperature Measurement and Parameter Optimization of PE FSW Butt Joints
iv
axial (6%). O erro residual calculado com a análise de variância tem uma contribuição
percentual de 20%.

Temperature Measurement and Parameter Optimization of PE FSW Butt Joints
v
Abstract
Joining different materials together were always a challenging subject since humans
learned how to use and built tools to do their tasks faster with more accuracy. It all started
with joining different small parts to make a higher and more sophisticated component.
Nowadays, economical and environmental concerns have led to unceasing demand and
development of new materials and joining technologies that will reduce the weight of
components while increase the strength of the final part. Currently, polymers have been
under intense research investigations due to the strength-to-weight ratio of polymeric
materials. However, joining polymers is a challenging subject which needs to be addressed
with a great determination.
Due to low density, low cost, high specific strength and high corrosion resistance of
polymeric materials, the use of plastics in the industry has increased considerably over the
last decades, with repercussions on the demand for new processing technologies and
especially new joining methods. Joining techniques that aim to eliminate or reduce major
defects associated with conventional methods such as, concentration of stresses and
increased weight for the case of mechanical fastening and environmental limitation for
adhesive bonding.
Friction Stir Welding (FSW) has become one of the most reliable joining methods due to
its solid-state philosophy, which originally developed for welding light-weighted metallic
materials. Although originally developed to weld reactive alloys such as aluminum and
magnesium, FSW is a joining method that has recently begun to be studied, developed and
modified to be implemented to weld thermoplastic materials. The aforementioned process
has many advantages over conventional methods, such as no additional components or
materials during the process, applicable for various types of joint configurations and
uniform stress distribution along the weld joint.
The experimental work in this study is focused on the optimization of the values of the
welding parameters (tool diameter, rotational speed, transverse speed and axial force), in
order to increase the strength of the fabricated welds. The welds were manufactured with 3
mm thickness polyethylene sheets in butt-joint configuration. Subsequently they were
sectioned into specimens and tensile tests were performed in order to determine the
optimized welding parameters with highest joint efficiency.
Since temperature is a crucial factor in any welding process, thermocouples were used
and placed in different positions of the weld bead in order to measure the welding

Temperature Measurement and Parameter Optimization of PE FSW Butt Joints
vi
temperature during welding, which provided crucial information for a better understanding
of this process and its variables.
The results were evaluated using the statistical approach of Analysis of
Variance (ANOVA) and Taguchi Design of Experiments (DOE), which allowed to identify
the welding parameters with the greatest impact on the weld strength and to optimize the
process parameters.
A maximum joint efficiency of 97% was achieved. All variables (DOE parameters) had
statistically significant effect on the weld strength with different impact factors. The tool
rotational speed has the highest percentage of contribution for FSW of 3 mm polyethylene
(40%), followed by the transverse speed (21%), tool diameter (12%) and axial force (6%).
The residual error calculated with the analysis of variance has a percentage contribution of
20% due to the uncontrollable factors during welding.

Temperature Measurement and Parameter Optimization of PE FSW Butt Joints
vii
Acknowledgements
Firstly, I would like to express my sincere gratitude to my supervisor Professor Pedro
Moreira for all the support of my Master’s dissertation and related research. I really believe
that the opportunity to work in LOME (INEGI) had a great impact on my education as an
engineer.
I would like to express my gratitude to my co-supervisor Shayan Eslami for all daily
support, patience, motivation, dedication and availability throughout the work developed in
this Master thesis.
Also to Professor Luis Mourão for his time (long hours), help and contribution related to
the temperature measurement and acquisition devices.
I am also grateful to Eng. Nuno Viriato, Dr. Paulo Tavares, Prof. Miguel Figueiredo and
Eng. Jorge Reis for the help and interest demonstrated in this thesis.
To my friends, especially Tiago, Miguel, Inês, Paulo e Bruno, I would like to thank for the
support, help and true friendship throughout this stage of my life.
I must express my very profound gratitude to my parents and my brother for providing me
with unfailing support and continuous encouragement throughout my years of study, through
the process of researching, writing this thesis and life in general. This accomplishment would
not have been possible without them. Thank you.

Temperature Measurement and Parameter Optimization of PE FSW Butt Joints
viii
Temperature Measurement and Parameter Optimization of PE FSW Butt Joints
ix
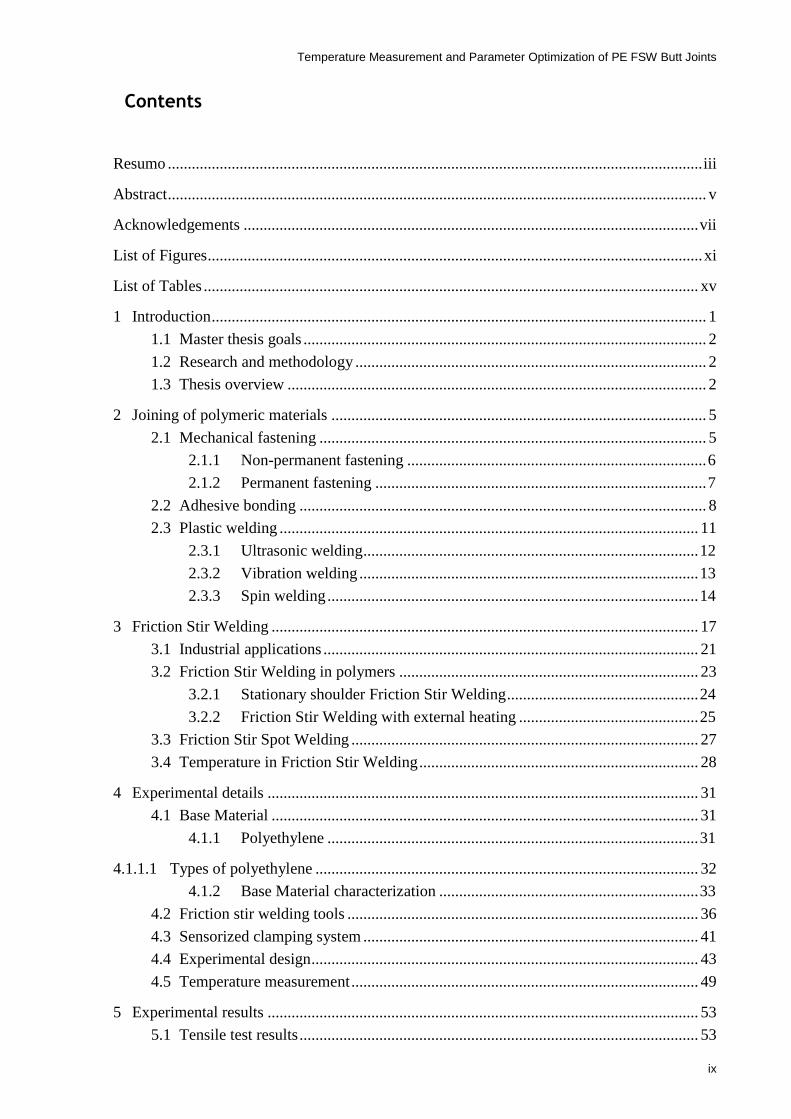
Contents
Resumo ...................................................................................................................................... iii
Abstract ....................................................................................................................................... v
Acknowledgements .................................................................................................................. vii
List of Figures ............................................................................................................................ xi
List of Tables ............................................................................................................................ xv
1 Introduction ............................................................................................................................ 1
1.1 Master thesis goals ..................................................................................................... 2
1.2 Research and methodology ........................................................................................ 2
1.3 Thesis overview ......................................................................................................... 2
2 Joining of polymeric materials .............................................................................................. 5
2.1 Mechanical fastening ................................................................................................. 5
Non-permanent fastening ........................................................................... 6 2.1.1
Permanent fastening ................................................................................... 7 2.1.2
2.2 Adhesive bonding ...................................................................................................... 8
2.3 Plastic welding ......................................................................................................... 11
Ultrasonic welding .................................................................................... 12 2.3.1
Vibration welding ..................................................................................... 13 2.3.2
Spin welding ............................................................................................. 14 2.3.3
3 Friction Stir Welding ........................................................................................................... 17
3.1 Industrial applications .............................................................................................. 21
3.2 Friction Stir Welding in polymers ........................................................................... 23
Stationary shoulder Friction Stir Welding ................................................ 24 3.2.1
Friction Stir Welding with external heating ............................................. 25 3.2.2
3.3 Friction Stir Spot Welding ....................................................................................... 27
3.4 Temperature in Friction Stir Welding ...................................................................... 28
4 Experimental details ............................................................................................................ 31
4.1 Base Material ........................................................................................................... 31
Polyethylene ............................................................................................. 31 4.1.1
4.1.1.1 Types of polyethylene ................................................................................................ 32
Base Material characterization ................................................................. 33 4.1.2
4.2 Friction stir welding tools ........................................................................................ 36
4.3 Sensorized clamping system .................................................................................... 41
4.4 Experimental design ................................................................................................. 43
4.5 Temperature measurement ....................................................................................... 49
5 Experimental results ............................................................................................................ 53
5.1 Tensile test results .................................................................................................... 53
Temperature Measurement and Parameter Optimization of PE FSW Butt Joints
x
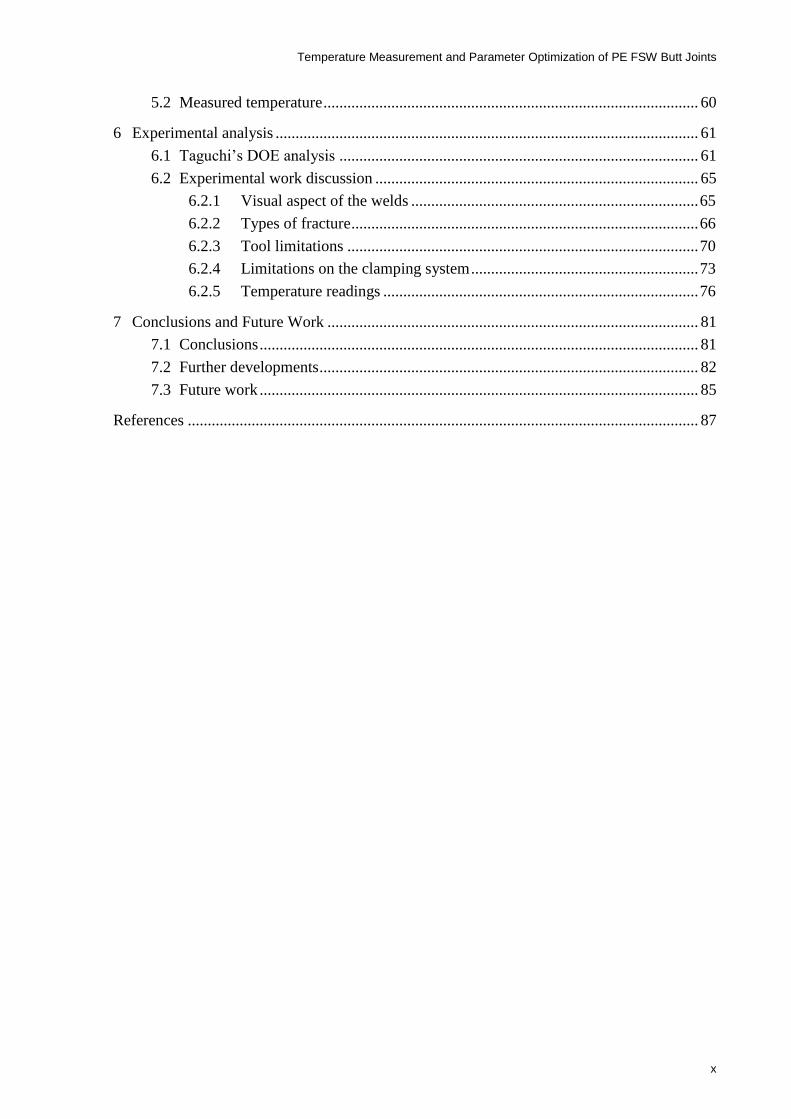
5.2 Measured temperature .............................................................................................. 60
6 Experimental analysis .......................................................................................................... 61
6.1 Taguchi’s DOE analysis .......................................................................................... 61
6.2 Experimental work discussion ................................................................................. 65
Visual aspect of the welds ........................................................................ 65 6.2.1
Types of fracture ....................................................................................... 66 6.2.2
Tool limitations ........................................................................................ 70 6.2.3
Limitations on the clamping system ......................................................... 73 6.2.4
Temperature readings ............................................................................... 76 6.2.5
7 Conclusions and Future Work ............................................................................................. 81
7.1 Conclusions .............................................................................................................. 81
7.2 Further developments ............................................................................................... 82
7.3 Future work .............................................................................................................. 85
References ................................................................................................................................ 87

Temperature Measurement and Parameter Optimization of PE FSW Butt Joints
xi
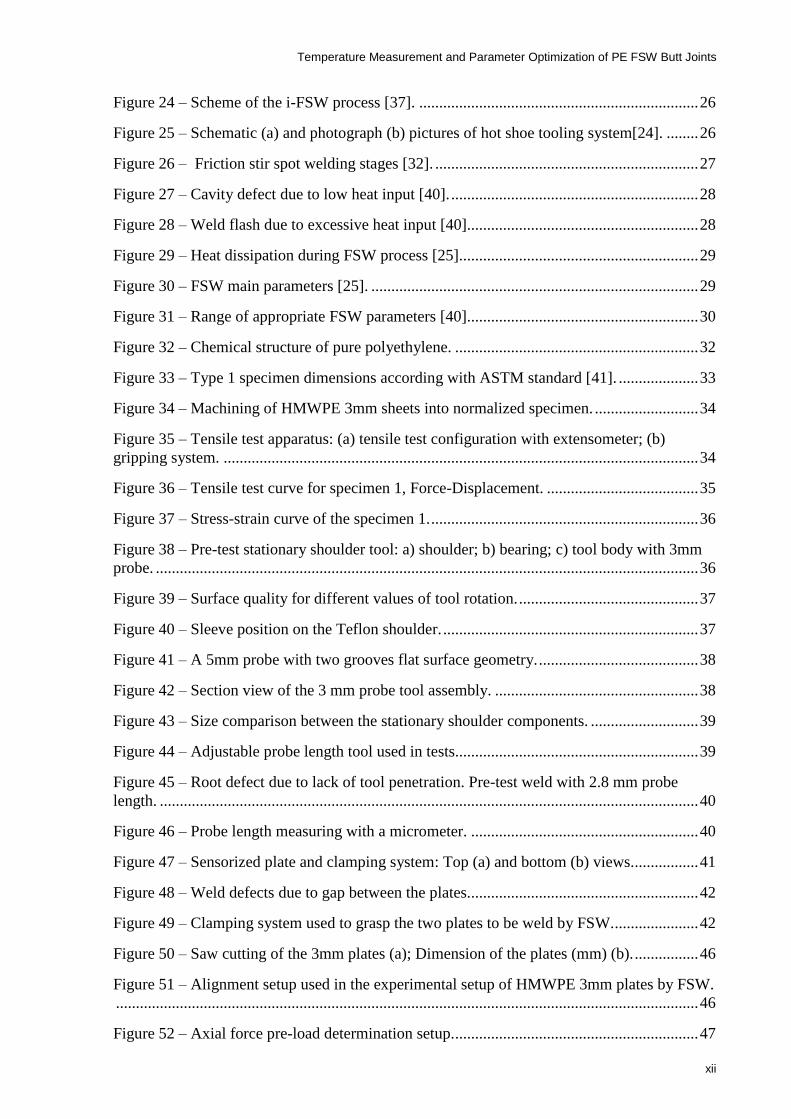
List of Figures
Figure 1 – Example of a non-permanent fastening element to joint two plastic parts. .............. 6
Figure 2 – Cantilever beam snap-fit assembly stages [2]. .......................................................... 8
Figure 3 – Wetting and contact angle comparison between different surface energy [7]. ......... 8
Figure 4 – Difference in stress distribution between adhesive joint and bolted joint [10]. ...... 10
Figure 5 – Joint designs for adhesive bonding [5]. .................................................................. 10
Figure 6 – Classification of welding techniques [14]. .............................................................. 11
Figure 7 – Functional diagram of ultrasonic welding [16]. ...................................................... 12
Figure 8 – Schematic of the linear vibration welding [18]. ...................................................... 13
Figure 9 – Evolution of the weld zone during the course of vibration welding [18]. .............. 13
Figure 10 – Schematic representation of weld penetration in the four stages of vibration
welding [18]. ............................................................................................................................. 14
Figure 11 – Schematic of spin welding of plastics [12]. .......................................................... 15
Figure 12 – Schematic of friction welding [21]. ...................................................................... 17
Figure 13 – Schematic of FSW process [24]. ........................................................................... 18
Figure 14 – Material flow directions in FSW [25]. .................................................................. 18
Figure 15 – Conventional FSW tool (a) shoulder (b) probe. .................................................... 19
Figure 16 – Self-reacting tool schematic [24]. ......................................................................... 20
Figure 17 – Joint configurations for friction stir welding: (a) square butt, (b) edge butt, (c) T
butt joint, (d) lap joint, (e) multiple lap joint, (f) T lap joint, and (g) fillet joint [28]. ............. 20
Figure 18 – FSW licenses sold between years 1995 and 2009 [31]. ........................................ 21
Figure 19 – Skin, stringers and frames joined via friction stir welding in eclipse jet [33]. .... 22
Figure 20 – Honda Accord engine cradle [32]. ........................................................................ 23
Figure 21 – Schematic of FSW steps [29]. ............................................................................... 24
Figure 22 – Stationary tool schematics representation [30]. .................................................... 24
Figure 23 – Schematic of stationary tool and its components [24]. ......................................... 25
Temperature Measurement and Parameter Optimization of PE FSW Butt Joints
xii
Figure 24 – Scheme of the i-FSW process [37]. ...................................................................... 26
Figure 25 – Schematic (a) and photograph (b) pictures of hot shoe tooling system[24]. ........ 26
Figure 26 – Friction stir spot welding stages [32]. .................................................................. 27
Figure 27 – Cavity defect due to low heat input [40]. .............................................................. 28
Figure 28 – Weld flash due to excessive heat input [40].......................................................... 28
Figure 29 – Heat dissipation during FSW process [25]............................................................ 29
Figure 30 – FSW main parameters [25]. .................................................................................. 29
Figure 31 – Range of appropriate FSW parameters [40].......................................................... 30
Figure 32 – Chemical structure of pure polyethylene. ............................................................. 32
Figure 33 – Type 1 specimen dimensions according with ASTM standard [41]. .................... 33
Figure 34 – Machining of HMWPE 3mm sheets into normalized specimen. .......................... 34
Figure 35 – Tensile test apparatus: (a) tensile test configuration with extensometer; (b)
gripping system. ....................................................................................................................... 34
Figure 36 – Tensile test curve for specimen 1, Force-Displacement. ...................................... 35
Figure 37 – Stress-strain curve of the specimen 1. ................................................................... 36
Figure 38 – Pre-test stationary shoulder tool: a) shoulder; b) bearing; c) tool body with 3mm
probe. ........................................................................................................................................ 36
Figure 39 – Surface quality for different values of tool rotation. ............................................. 37
Figure 40 – Sleeve position on the Teflon shoulder. ................................................................ 37
Figure 41 – A 5mm probe with two grooves flat surface geometry. ........................................ 38
Figure 42 – Section view of the 3 mm probe tool assembly. ................................................... 38
Figure 43 – Size comparison between the stationary shoulder components. ........................... 39
Figure 44 – Adjustable probe length tool used in tests............................................................. 39
Figure 45 – Root defect due to lack of tool penetration. Pre-test weld with 2.8 mm probe
length. ....................................................................................................................................... 40
Figure 46 – Probe length measuring with a micrometer. ......................................................... 40
Figure 47 – Sensorized plate and clamping system: Top (a) and bottom (b) views................. 41
Figure 48 – Weld defects due to gap between the plates.......................................................... 42
Figure 49 – Clamping system used to grasp the two plates to be weld by FSW. ..................... 42
Figure 50 – Saw cutting of the 3mm plates (a); Dimension of the plates (mm) (b). ................ 46
Figure 51 – Alignment setup used in the experimental setup of HMWPE 3mm plates by FSW.
.................................................................................................................................................. 46
Figure 52 – Axial force pre-load determination setup. ............................................................. 47

Temperature Measurement and Parameter Optimization of PE FSW Butt Joints
xiii
Figure 53 – Division of the weld into 4 stripes. ....................................................................... 48
Figure 54 – Specimens tested during the experimental work. .................................................. 48
Figure 55 – Thermocouples position underneath the weld bead. ............................................. 50
Figure 56 – Mercury-soldering by capacitive discharge of the thermocouple wires. .............. 50
Figure 57 – Conditioning circuit for thermocouples. ............................................................... 51
Figure 58 – Dual power supply scheme developed for feeding thermocouple conditioning
circuit. ....................................................................................................................................... 51
Figure 59 – Dual power supply and thermocouple conditioning circuit setup. ........................ 52
Figure 60 – Tensile test S(1,1).................................................................................................. 55
Figure 61 – Tensile test S(2,1).................................................................................................. 56
Figure 62 – Tensile test S(3,1).................................................................................................. 56
Figure 63 – Tensile Test S(4,1). ............................................................................................... 57
Figure 64 – Tensile test S(5,1).................................................................................................. 57
Figure 65 – Tensile test S(6,1).................................................................................................. 58
Figure 66 – Tensile test S(7,1).................................................................................................. 58
Figure 67 – Tensile test S(8,1).................................................................................................. 59
Figure 68 – Tensile test S(9,1).................................................................................................. 59
Figure 69 – Main effects plot for mean. ................................................................................... 63
Figure 70 – Main effects plot for SN ratios. ............................................................................. 63
Figure 71 – Gap between the Teflon shoulder and the cooper sleeve. ..................................... 64
Figure 72 – Example of flexural deformation caused by the welding process forces, test
S(9,2). ....................................................................................................................................... 65
Figure 73 – Examples of good surface on top of the weld (a) and bottom (b). ........................ 66
Figure 74 – Brittle fracture zone specimen 4 test S(3,3). ......................................................... 66
Figure 75 – Tensile test of the specimen 4 (brittle fracture) test S(3,3), and base material. .... 67
Figure 76 – Semi-brittle fracture of the specimen 2 of the test S(5,1). .................................... 67
Figure 77 – Tensile test of two specimens with semi-brittle fracture, and base material. ....... 68
Figure 78 – Ductile fracture from the specimen 2 from the confirmation test. ........................ 68
Figure 79 – Tensile test of the specimen 3 (ductile) of the confirmation test and base material.
.................................................................................................................................................. 69
Figure 80 – Deformation on the parent material in specimen 3 of the confirmation test. ........ 69
Figure 81 – Fracture on the retreating side. .............................................................................. 70
Figure 82 – Interface Teflon-copper wear after ten FSW tests. ............................................... 70

Temperature Measurement and Parameter Optimization of PE FSW Butt Joints
xiv
Figure 83 – Temperature Measurements on the copper sleeve. ............................................... 71
Figure 84 – Sleeve temperature readings during confirmation test. ......................................... 71
Figure 85 – Molten plastic that leaked the weld bead through the Teflon shoulder. ............... 72
Figure 86 – Force measurements test S(2,1). ........................................................................... 73
Figure 87 – Force measurements test S(6,1). ........................................................................... 74
Figure 88 – Volumetric defect on the test S(4,3) ..................................................................... 74
Figure 89 – Force measurements in test S(4,1). ....................................................................... 75
Figure 90 – Temperature readings thermocouple 4 test S(1,3). ............................................... 76
Figure 91 – Temperature readings thermocouple 2 test S(7,3). ............................................... 77
Figure 92 – Temperature readings thermocouple 3 test S(7,3). ............................................... 77
Figure 93 – Temperature readings thermocouple 2 test S(6,3). ............................................... 78
Figure 94 – Oxidation coloration of the copper sleeve due to temperature. ............................ 78
Figure 95 – Comparison of the surface quality of the weld between two specimens of the
same test. .................................................................................................................................. 79
Figure 96 – Visual aspect of the weakest weld tested, S(4,3). ................................................. 79
Figure 97 – Differences in surface quality between test S(7,1) and test S(3,3). ...................... 80
Figure 98 – Keyhole at the end of the weld bead. .................................................................... 82
Figure 99 – Top part (a) assembly on the stationary head of the machine (b). ........................ 83
Figure 100 – Down part (a) assembly with the stationary Teflon shoulder (b)........................ 84
Figure 101 – Assembly components of the mechanism. .......................................................... 84
Figure 102 – Mechanism assembly in the work position. ........................................................ 85

Temperature Measurement and Parameter Optimization of PE FSW Butt Joints
xv
List of Tables
Table 1 – Types of plastic joining. ............................................................................................. 5
Table 2 – General properties of the HMWPE provided by the supplier [45]. .......................... 33
Table 3 – Tensile properties of Polyethylene. .......................................................................... 35
Table 4 – Three level design parameter values. ....................................................................... 44
Table 5 – Fixed welding parameter values. .............................................................................. 44
Table 6 – Experimental layout using an L9 orthogonal array. ................................................. 45
Table 7 – Experimental nomenclature of the welds ................................................................. 53
Table 8 – Maximum load results of the tensile tests. ............................................................... 54
Table 9 – Ultimate tensile strength (UTS) results. ................................................................... 54
Table 10 – Mean of the joint efficiency for each set of welding parameter. ............................ 55
Table 11 – Temperature readings during the third welding trial. ............................................. 60
Table 12 – Analysis of variance for weld strength. .................................................................. 62
Table 13 – Contribution percentage of the welding parameters in the output results. ............. 62
Table 14 – Results of the confirmation test. ............................................................................. 64

Temperature Measurement and Parameter Optimization of PE FSW Butt Joints
xvi

Temperature Measurement and Parameter Optimization of PE FSW Butt Joints
1
1 Introduction
Climate change and limited energy resources have transformed the transport industry to
seek for more reliable and green solutions. The imposition of new regulations by
governments in order to reduce fuel consumption and the emission of polluting gases led to
a continuous search and development of solutions capable of increasing the efficiency of
transportations industries.
Reducing the weight of the vehicles used in the transportation industry is an extremely
critical issue to fulfil the most recent regulations. This weight reduction can be achieved by
applying smarter designs for the components, using less dense materials, and for structural
components, the use of materials with a superior specific resistance. These subjects have
been continuously studied by engineers in different research fields in order to improve
strength-to-weight ratio of the final products.
As a consequence, the use of polymers in this industry continues to increase, as well as
growth of the need for better joining techniques compatible with this type of materials. In
comparison to metallic materials, plastics suffer from proper joining technique which is
applicable for different materials, thicknesses and configurations due to their low thermal
conductivity, hardness, melting point and surface energy.
The application of Friction Stir Welding (FSW) to join thermoplastic materials has
recently developed but is seen as a good solution to join this type of material, due to the
advantages that this technology presents compared to the conventional techniques, such as
no additional components or material during the process are needed, and various types of
joint configuration can be applied due to absence of gravitation effects, and uniform stress
distribution along the weld joints.
In the Optics and Experimental Mechanics Laboratory (LOME), with new developed
tool, this process has been successfully applied to weld thermoplastic plates with lap joint
configuration. In this Master thesis, the same tool concept was used, and the butt-joint
configuration of 3mm polyethylene was successfully implemented.
Since temperature is a crucial factor in any welding process, a device was developed
during this study to measure and record the welding temperature in different locations of the
weld bead. The obtained data provided important information about the process temperature
for a better understanding of the frictional heat generation and its variables. Temperature
measurements during this process applied to thermoplastics is also an innovative study
approach, which has explained in experimental procedure chapter.
Temperature Measurement and Parameter Optimization of PE FSW Butt Joints
2
1.1 Master thesis goals
The main objective of this dissertation is to find the optimal set of parameters for
applying FSW in butt-jointed polyethylene with 3 mm thickness. To determine the best
parameters, different combinations were analyzed, with the temperature being measured in
each configuration for a better understanding of heat generated in this process.
1.2 Research and methodology
The methodology defined to achieve the main goals of the Master thesis is described in
this section.
In order to achieve the main objective of the thesis, the following work plan was
performed:
1. A literature review on joining of polymeric materials, with particular emphasis on
FSW;
2. Improving the clamping system for the butt-joint configuration;
3. Developing a temperature acquisition device and its software to measure the
frictional heat generated during welding;
4. Set of pre-tests to determine the range of values for the process parameters (input
factors) and to determine the values of the fixed parameters;
5. Mechanical characterization of the high molecular weight polyethylene material;
6. Determination of the design of experiments orthogonal array;
7. Preparing and welding the plates on accordance with the design of experiments
table;
8. Cutting and testing the dogbone specimens obtained from the welded plates;
9. Analysing the results using two different statistical tools: Taguchi analysis (DOE)
and Analysis of Variance (ANOVA).
1.3 Thesis overview
The structure of the thesis is divided in seven different chapters, with the first one being
the introduction of the thesis, its objectives, and the workflow followed.
The remaining chapters are as follows:
Chapter 2: A literature review on joining of polymeric materials is presented in
this chapter. The review is divided in three categories: mechanical fastening,
adhesive bonding and welding techniques. Multiple joining methods that belong
to these three categories are presented, describing the general concept and
mentioning the advantages and disadvantages for each described method.
Chapter 3: A literature review on friction stir welding is presented, describing
the general concepts of this process, process parameters, applications, variants of

Temperature Measurement and Parameter Optimization of PE FSW Butt Joints
3
the process, the use of the process to join polymeric material and the importance
of the temperature during welding.
Chapter 4: All the experimental details are explained in this chapter. The base
material characterization, the specimen geometry, preliminary tests, tools used,
clamping system, measurement devices, design of experiments and the
manufacture of the welds are explained.
Chapter 5: Presentation of the welds strength and measured temperatures during
the tests.
Chapter 6: Results analysis with the Taguchi’s (DOE) and ANOVA. Results
discussion taking into account observations, temperatures and forces measured
during the welding.
Chapter 7: The conclusions obtained within the experimental work as well
suggestions to improve and continue the research on the subject are presented in
the last chapter.

Temperature Measurement and Parameter Optimization of PE FSW Butt Joints
4

Temperature Measurement and Parameter Optimization of PE FSW Butt Joints
5
2 Joining of polymeric materials
Joining different components together has always been an important concern in order to be
able to combine several pieces into a single object. Nowadays, joining materials is one of the
most attractive engineering subjects, with continuous research for improved joining methods
capable of continuously increase the production rate, joint efficiency, and to produce sound
welds for similar and dissimilar materials. The joining methods are critical especially when
the object consists of several parts or complex geometries to be combined in a single object,
and when disassembly and reassembly is needed, or even when different type of materials are
used in the finished assembly [1].
The joining methods for polymeric materials can be classified into three categories:
mechanical fastening, adhesive bonding and welding, as described in Table 1. Choosing an
appropriate joining method often depends on various parameters, such as joint assembly, used
materials and cost/time production, among others.
2.1 Mechanical fastening
Due to its simplicity, mechanical fastening still remains the most common method of
joining multiple materials for industrial applications. Among other reasons, it has a smaller
Table 1 – Types of plastic joining.

Temperature Measurement and Parameter Optimization of PE FSW Butt Joints
6
learning curve, meaning that less skilled workers are needed on the assembly process when
compared with other joining methods.
This technique originally used for joining metallic materials, it is also well-established for
joining plastics, dissimilar plastics and plastics to other materials. There are two main
categories of industrial fasteners, referred to as permanent and non-permanent joints.
Non-permanent fastening 2.1.1
Designing a fastening element into a part is still the simplest solution to join plastic
components, as shown in Figure 1. Non-permanent fastening allows to disassemble and
reassemble the components multiple times without damaging the components. This method
can join plastics, dissimilar plastics and dissimilar materials, which are crucial for multiple
types of applications.
Screws, rivets, pins and sheet-metal nuts are examples of non-permanent fasteners, since
they can be removed, replaced and reused. These parts, however, can increase the production
cost due to the increased assembly time and might be more difficult to handle and align. The
main advantages of using this type of fasteners are [2], [3]:
Non-permanent fastening is highly useful in applications that may need
repair/maintenance or need access to the interior, for instance hollow components;
Ability to join dissimilar materials, not only to join different plastics but also to join
plastics to other materials;
Being a long-established joining process, it does not require advanced technology.
The usage of fasteners to join polymers has its limitations and disadvantages, which are
[2], [3]:
Stress concentrations;
Figure 1 – Example of a non-permanent fastening element to joint two plastic parts.

Temperature Measurement and Parameter Optimization of PE FSW Butt Joints
7
Increased component weight;
The joint can loosen in service, especially in the presence of vibrations;
Differentials in the coefficients of linear thermal expansion;
Only stronger plastics are recommended for this method, in order to withstand the strain
of the assembly, service load and possible repeated use;
Unpleasant appearance;
Requires a sophisticated design of the joint in order to avoid failure;
Reduces the fatigue life;
Many plastics exhibit notch sensitivity, and screws threads are nothing if not a series of
notches, where very high stress loadings occur. These can lead to an unpredicted failure;
Tiny cracks known as crazing have a tendency to appear as a result of the localized
stresses caused by fasteners. These can lead to the failure of the joint;
Frequently limited to overlap joint configuration.
Permanent fastening 2.1.2
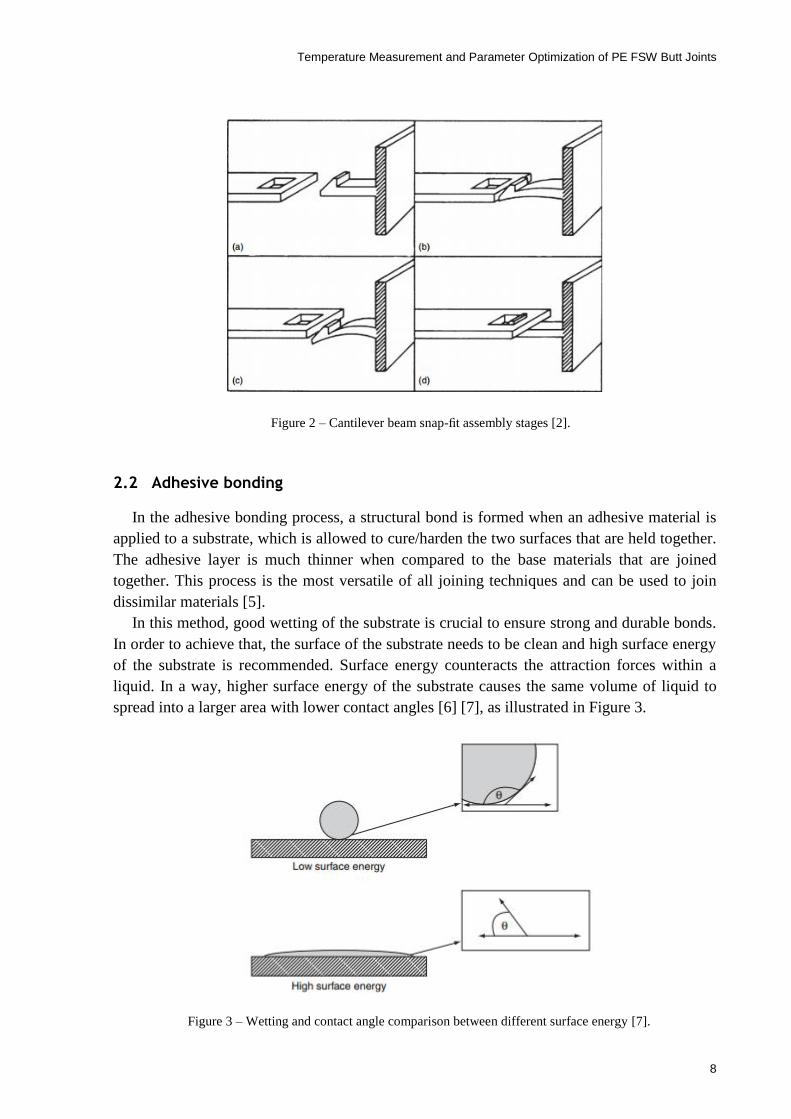
Permanent fasteners, such as the snap-fits seen in Figure 2, are integrated into the parts
through direct molding, offering an interlocking configuration. A snap-fit is an arrangement
of compatible locators, locks and enhancements acting to form a mechanical joint between
parts. The use of permanent fasteners is increasing because of their sturdiness and smaller
potential for working loose, when compared with non-permanent fasteners [4].
As illustrated in Figure 2, in snap fits, the two parts to be joined are aligned (Figure 2a) and
forced against each other (Figure 2b). A protrusion on one part (hook, stud, bead) is briefly
deflected during joining due to the applied force (Figure 2c) to catch in a depression or
undercut molded into the other part (Figure 2d). The force required for joining depends on the
snap-fit. However, it is important to mention that some level of flexibility in the integral
locking feature is required. After the brief joining stress, it becomes resistant to vibrations and
is usually stress free [2].
Permanent fasteners are more robust, economical, and no additional materials or operations
are required. They also allow the joining of dissimilar materials and elevated assembly rates,
which explain the increased use of this technique. As a result of the mentioned benefits, the
use of permanent fasteners is increasing in industry [3].
However, this joining technique works better with ductile materials as they allow sufficient
elastic deformation in the assembly process. The use of ductile materials also improves the
fatigue life of the components, which is one of the main concerns with this joining method.
Temperature Measurement and Parameter Optimization of PE FSW Butt Joints
8
2.2 Adhesive bonding
In the adhesive bonding process, a structural bond is formed when an adhesive material is
applied to a substrate, which is allowed to cure/harden the two surfaces that are held together.
The adhesive layer is much thinner when compared to the base materials that are joined
together. This process is the most versatile of all joining techniques and can be used to join
dissimilar materials [5].
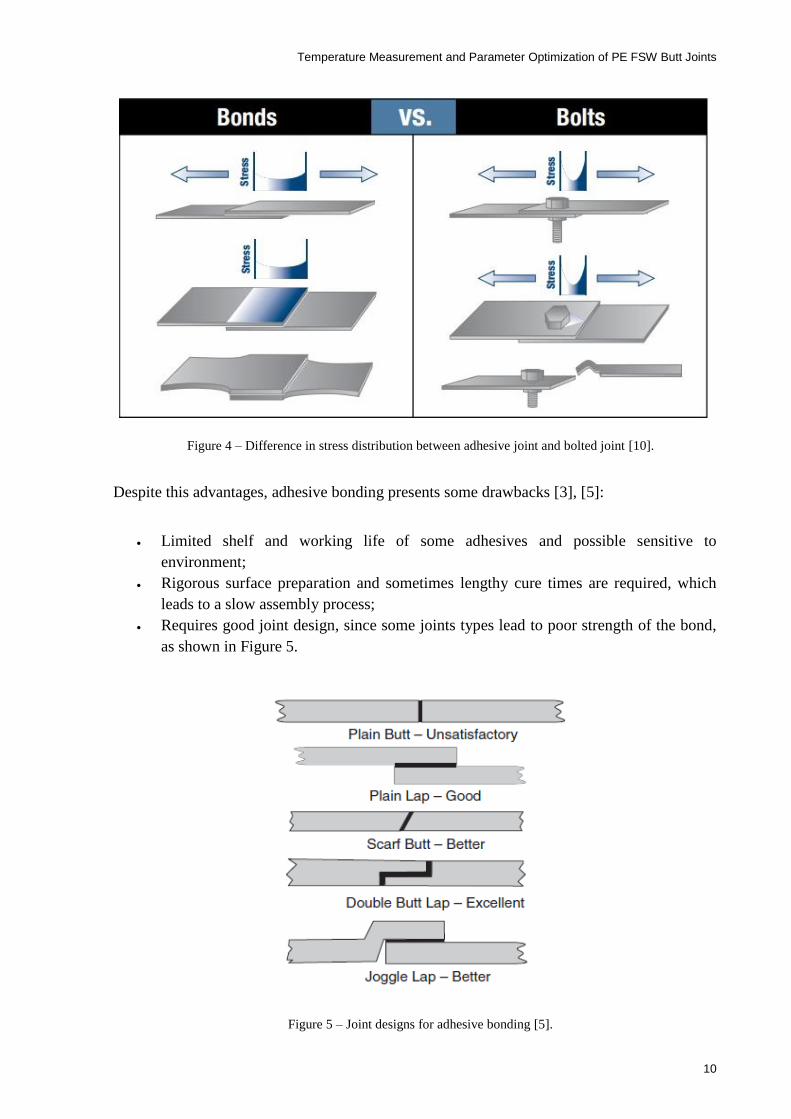
In this method, good wetting of the substrate is crucial to ensure strong and durable bonds.
In order to achieve that, the surface of the substrate needs to be clean and high surface energy
of the substrate is recommended. Surface energy counteracts the attraction forces within a
liquid. In a way, higher surface energy of the substrate causes the same volume of liquid to
spread into a larger area with lower contact angles [6] [7], as illustrated in Figure 3.
Figure 3 – Wetting and contact angle comparison between different surface energy [7].
Figure 2 – Cantilever beam snap-fit assembly stages [2].

Temperature Measurement and Parameter Optimization of PE FSW Butt Joints
9
The surface energy of a solid is directly proportional to the surface tension, which is
defined as “the work required to increase the area of a surface isothermally and reversibly by
a unit amount” [8]. The surface tension value in plastics is low, and surface treatment is
required in order to increase the surface energy to be suitable for adhesive bonding.
While chemical treatments such as anodization or mechanical treatments such as abrasion
are normally used to increase the surface energy of the substrate, in most plastics these
methods are not effective. In such cases, physical method techniques allow better results by
cleaning and chemically modifying the surface, exposing it to highly energetic or other ionic
species. The most common methods are flame treatment, corona discharge and plasma [9].
Flame treatment is used as a surface treatment for some plastics, specially polyethylene
and polypropylene. In this process, the surface of the plastic is rapidly melted and oxygen-
containing groups are incorporated in the surface during the transition, in a short period of
time [7]. The aforementioned technique increases wettability and hence the adhesion, but only
for a short period of time, so the substrates must be bonded immediately.
In the corona discharge process the plastic is positioned above a metal electrode coated
with a dielectric material, which consists of an insulating material that can be polarized by an
electric field. Then plasma is generated as a result of a high voltage applied to the electrode.
This process is mainly used for polyolefins where surface energy is improved by the creation
of adhesion-enhancing carbonyl groups [9] .
The increase of the surface energy of a substrate in the plasma surface treatment is
achieved by covering the surface with ions of gases such as argon, ammonia or nitrogen.
According to the gas selected and the exposure conditions, the surface can be cleaned, etched
or chemically activated. The results typically show up to a two or three-fold increase in
surface wetting. [9]
The main advantages of this joining process are [3], [5]:
It is an efficient, economical and durable procedure for assembling plastics to plastics
or to other type of materials;
It is capable of joining a major percentage of plastics whereas mechanical fastening
and welding can be limited by the materials and joint properties;
Produces a permanent and uniform seal with good visual aspect;
Does not produce any deformation in the materials or substrates;
Allows to join substrates with different geometries, sizes and composition;
Forces are distributed over a larger area and with low stress concentration, especially
when compared with mechanical fastening (Figure 4);
High levels of fatigue tolerance;
Large range of physical and chemical properties available;
Low density;
Process can be automated.
Temperature Measurement and Parameter Optimization of PE FSW Butt Joints
10
Figure 4 – Difference in stress distribution between adhesive joint and bolted joint [10].
Despite this advantages, adhesive bonding presents some drawbacks [3], [5]:
Limited shelf and working life of some adhesives and possible sensitive to
environment;
Rigorous surface preparation and sometimes lengthy cure times are required, which
leads to a slow assembly process;
Requires good joint design, since some joints types lead to poor strength of the bond,
as shown in Figure 5.
Figure 5 – Joint designs for adhesive bonding [5].

Temperature Measurement and Parameter Optimization of PE FSW Butt Joints
11
2.3 Plastic welding
Plastic welding is a process where a molecular bond is created between two compatible
thermoplastics. Welding processes relies on applying heat to the joint in order to melt the
adjacent polymer, forming a weld when the polymer solidifies. Welding is not applicable to
thermosetting plastics since this type of material does not melt when heat is applied [11].
Welding offers superior strength and often significantly reduces production times when
compared with mechanical joining (screws) and chemical bonding (adhesives). The welding
process usually consists of three main steps which are pressing, heating and cooling [12].
In the first step, a vertical force is applied and often maintained through both the heating
and cooling stages. The resulting pressure is used to hold the parts in the proper position and
to improve the melt flow through the weld bead [12].
On the second stage, heat is used to melt and consequently allow intermolecular diffusion
from one part to the other across the faying surface (melt mixing), which is crucial to form a
molecular bond. Therefore, the joint surface on both of the parts must be melted to allow the
plastic molecules to diffuse across the interface and bond with molecules of the other part. For
higher temperatures, a more intense molecular movement is achieved, allowing the weld to be
made in a shorter cycle time. Amorphous polymers must be heated to above their glass
transition temperature, while semi-crystalline polymers must be heated to above their melting
temperature [12].
Cooling is necessary to solidify the newly-formed bond. The implementation of this stage
is crucial, since the cooling rate have a significant effect on the thermoplastic microstructure,
which plays a major role in the weld strength. Slower cooling rate are indicated as an
important factor to achieve sound welds [13].
There are several variations of plastic welding as shown in Figure 6. These are primarily
differentiated by their heating method: internal heating or external heating [14]. On the
internal heating processes mechanical movement or electromagnetic radiation are used to
generate heat. External heating processes rely on convection or conduction of the generated
heat to the base material at the weld bead [15].
Figure 6 – Classification of welding techniques [14].

Temperature Measurement and Parameter Optimization of PE FSW Butt Joints
12
Ultrasonic welding 2.3.1
Ultrasonic welding is a well-established process to join thermoplastic components due to
its several advantages [16]:
Free of foreign substances;
High strength of the bond;
Short cycle time;
Easily automated;
Localized heating (more efficient).
The ultrasonic process works through the transformation of the AC current into mechanical
vibration. The vibrations are then passed from the tool to the joint, at which point they cause
stress and strain in the contact area between the two parts, which induces a localized heat and
in consequence the melting of the thermoplastic [12]. Ultrasonic welding disadvantages are
usually related with the tooling costs (specially designed joints are required) and possibility of
damaging the electrical components due to the generated vibration [17].
A functional diagram of ultrasonic welding is illustrated in Figure 7. With a transducer (1),
electrical vibrations with a frequency of 20-50 kHz are produced, with an ultrasonic generator
(USG) the electrical vibrations are then transformed into longitudinal mechanical vibrations.
These vibrations are delivered to the parent material (4) attached to a base (5) through an
elastic vibration transformer (2) and a working instrument (3) called a waveguide. Reliable
contact of the waveguide with the welded parts is provided by the static pressure (Pst) of the
working end of the waveguide on the parts. Pst also increases the concentration of mechanical
energy in the welding zone. Mechanical vibrations induce a dynamic force, F, so that the
temperature required for welding is created in the welding zone. The combined effect of the
static pressure and the dynamic force leads to a strong welded joint. The optimum values of
the static pressure and dynamic force differ according to with the polymers to be welded [16].
Figure 7 – Functional diagram of ultrasonic welding [16].

Temperature Measurement and Parameter Optimization of PE FSW Butt Joints
13
Vibration welding 2.3.2
Vibration welding is a robust method to physically join thermoplastics without using an
external heating source. It is carried out by rubbing the surfaces to be joined in a sinusoidal
oscillation manner against each other, under pressure, as illustrated in Figure 8. The
movement between the two parts to be joined can be either linear or orbital [18].
The heat generated by friction at the interface of two materials melts the material in the
interface area. Vibration is continued for a sufficient amount of time to allow pressure-driven
flow and intermixing within the film [18]. The molten materials together flow under pressure,
forming a weld after cooling [19].
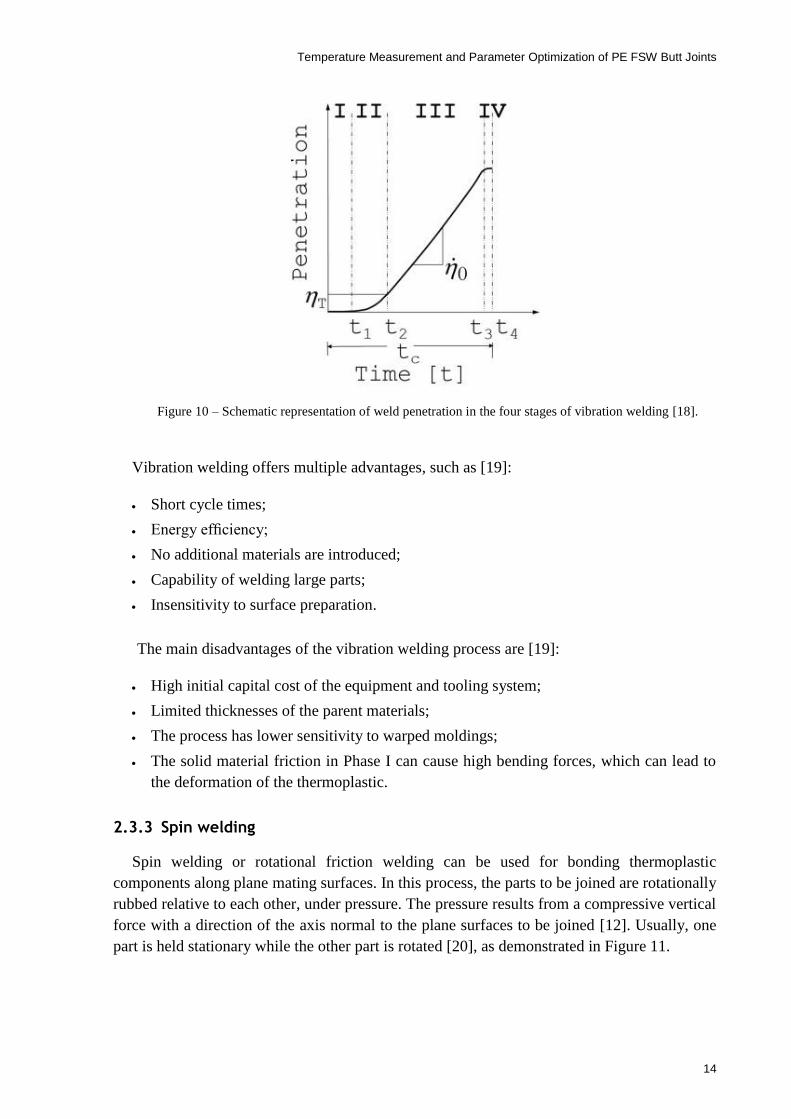
The vibration welding process can be represented in four phases, as demonstrated in Figure
9 and Figure 10:
Phase I – Solid friction;
Phase II – Unsteady evolution of penetration;
Phase III – Steady growth of penetration;
Phase IV – Solidification.
Figure 8 – Schematic of the linear vibration welding [18].
Figure 9 – Evolution of the weld zone during the course of vibration welding [18].
Temperature Measurement and Parameter Optimization of PE FSW Butt Joints
14
Vibration welding offers multiple advantages, such as [19]:
Short cycle times;
Energy efficiency;
No additional materials are introduced;
Capability of welding large parts;
Insensitivity to surface preparation.
The main disadvantages of the vibration welding process are [19]:
High initial capital cost of the equipment and tooling system;
Limited thicknesses of the parent materials;
The process has lower sensitivity to warped moldings;
The solid material friction in Phase I can cause high bending forces, which can lead to
the deformation of the thermoplastic.
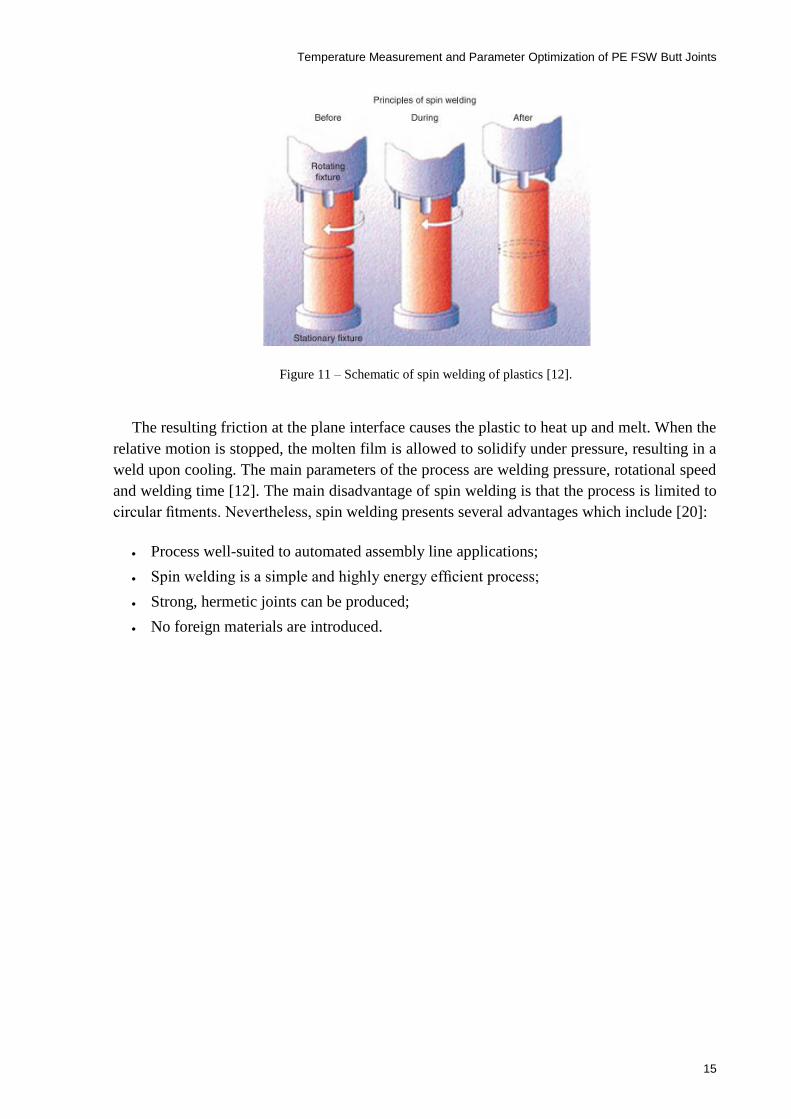
Spin welding 2.3.3
Spin welding or rotational friction welding can be used for bonding thermoplastic
components along plane mating surfaces. In this process, the parts to be joined are rotationally
rubbed relative to each other, under pressure. The pressure results from a compressive vertical
force with a direction of the axis normal to the plane surfaces to be joined [12]. Usually, one
part is held stationary while the other part is rotated [20], as demonstrated in Figure 11.
Figure 10 – Schematic representation of weld penetration in the four stages of vibration welding [18].
Temperature Measurement and Parameter Optimization of PE FSW Butt Joints
15
The resulting friction at the plane interface causes the plastic to heat up and melt. When the
relative motion is stopped, the molten film is allowed to solidify under pressure, resulting in a
weld upon cooling. The main parameters of the process are welding pressure, rotational speed
and welding time [12]. The main disadvantage of spin welding is that the process is limited to
circular fitments. Nevertheless, spin welding presents several advantages which include [20]:
Process well-suited to automated assembly line applications;
Spin welding is a simple and highly energy efficient process;
Strong, hermetic joints can be produced;
No foreign materials are introduced.
Figure 11 – Schematic of spin welding of plastics [12].

Temperature Measurement and Parameter Optimization of PE FSW Butt Joints
16
Temperature Measurement and Parameter Optimization of PE FSW Butt Joints
17
Figure 12 – Schematic of friction welding [21].
3 Friction Stir Welding
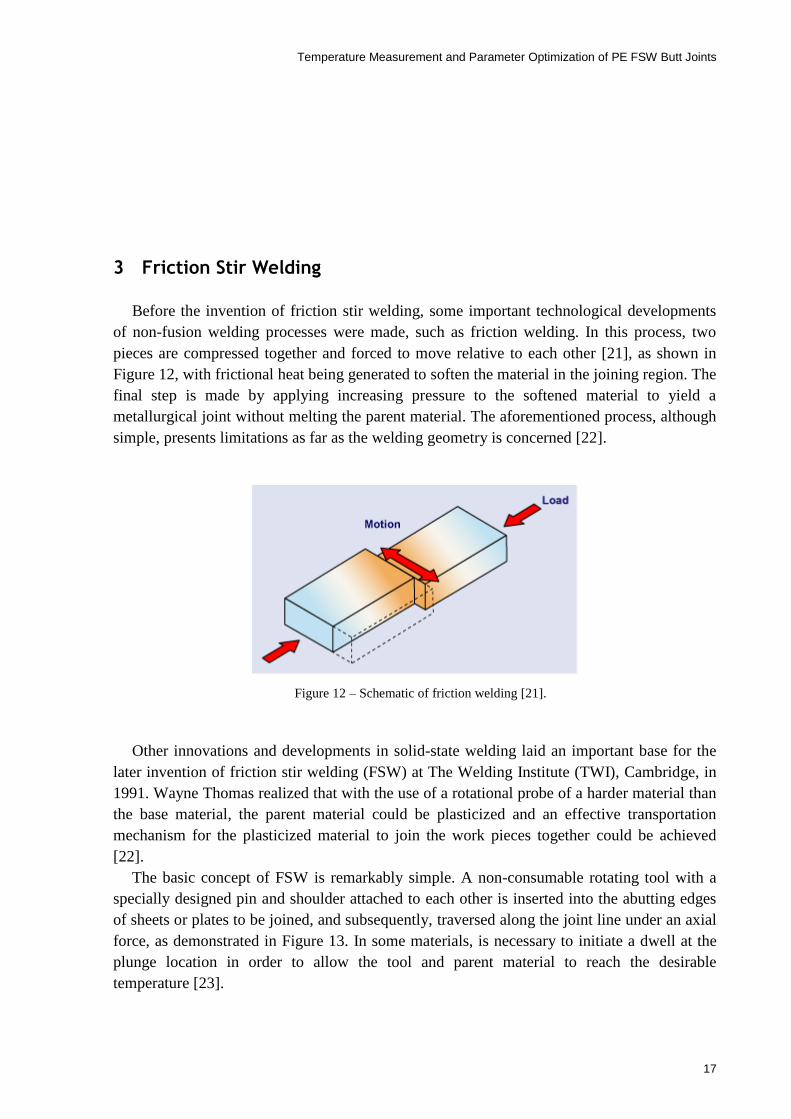
Before the invention of friction stir welding, some important technological developments
of non-fusion welding processes were made, such as friction welding. In this process, two
pieces are compressed together and forced to move relative to each other [21], as shown in
Figure 12, with frictional heat being generated to soften the material in the joining region. The
final step is made by applying increasing pressure to the softened material to yield a
metallurgical joint without melting the parent material. The aforementioned process, although
simple, presents limitations as far as the welding geometry is concerned [22].
Other innovations and developments in solid-state welding laid an important base for the
later invention of friction stir welding (FSW) at The Welding Institute (TWI), Cambridge, in
1991. Wayne Thomas realized that with the use of a rotational probe of a harder material than
the base material, the parent material could be plasticized and an effective transportation
mechanism for the plasticized material to join the work pieces together could be achieved
[22].
The basic concept of FSW is remarkably simple. A non-consumable rotating tool with a
specially designed pin and shoulder attached to each other is inserted into the abutting edges
of sheets or plates to be joined, and subsequently, traversed along the joint line under an axial
force, as demonstrated in Figure 13. In some materials, is necessary to initiate a dwell at the
plunge location in order to allow the tool and parent material to reach the desirable
temperature [23].

Temperature Measurement and Parameter Optimization of PE FSW Butt Joints
18
FSW is a solid-state joining technology that brings several benefits over conventional
welding processes. Due to environmental concerns, the demand for lightweight structures and
the ability to produce defect-free welds in low-density and highly reactive alloys (in molten
state) such as aluminium and magnesium, this process found its path to be an interesting
engineering subject as well as attractive option for industrial applications [24].
The frictional heat generated by the FSW tool in the process raises the temperature of the
base material, consequently deforms the parent materials plastically. Weld dynamics cause the
material to flow in a non-symmetrical way. On one side, the direction of tool rotation has the
opposite direction of the tool linear movement. This side is called retreating side. On the
advancing side, the direction of the tool rotation and tool linear movement is the same, and
here the probe drags the plasticized material to the front of tool against the tool movement, as
demonstrated in Figure 14 [25].
Figure 14 – Material flow directions in FSW [25].
Figure 13 – Schematic of FSW process [24].
Temperature Measurement and Parameter Optimization of PE FSW Butt Joints
19
Rotational speed, transverse speed, axial force, dwell time, probe geometry and tilt angle
are the main welding parameters in this process. Choosing the optimum values of the welding
parameters is crucial in order to achieve defect free welds since they affect the generated heat,
mixing and weld penetration.
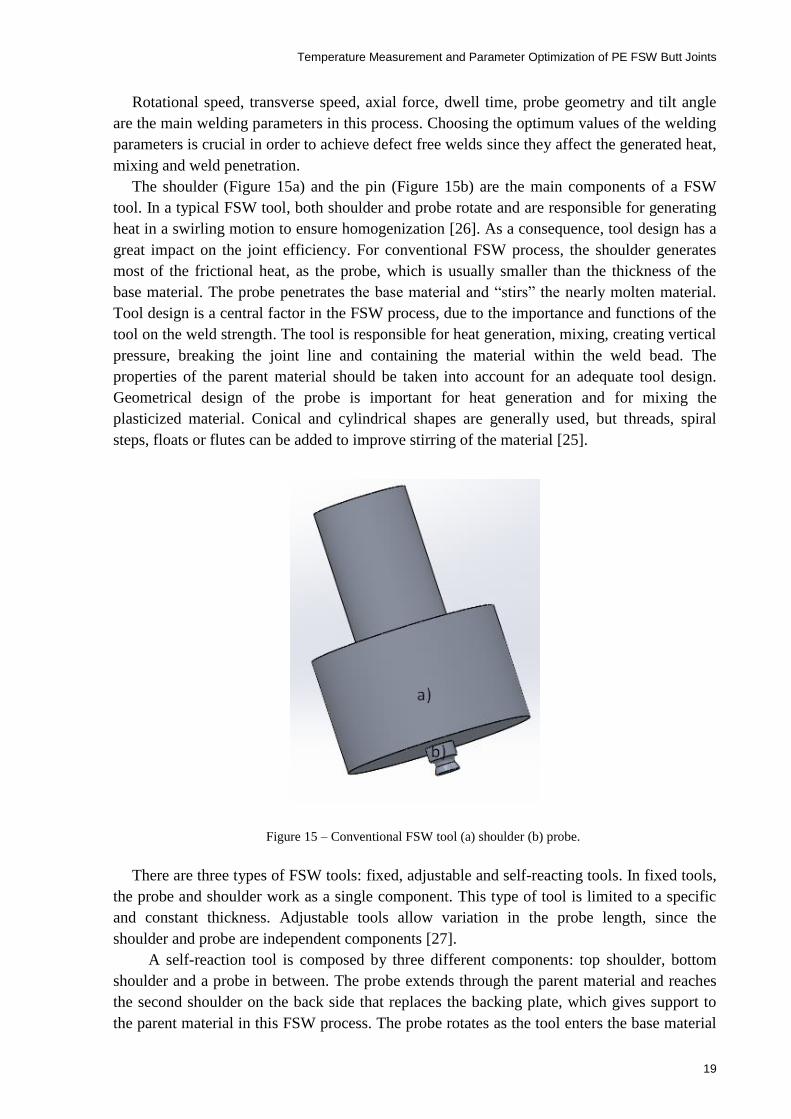
The shoulder (Figure 15a) and the pin (Figure 15b) are the main components of a FSW
tool. In a typical FSW tool, both shoulder and probe rotate and are responsible for generating
heat in a swirling motion to ensure homogenization [26]. As a consequence, tool design has a
great impact on the joint efficiency. For conventional FSW process, the shoulder generates
most of the frictional heat, as the probe, which is usually smaller than the thickness of the
base material. The probe penetrates the base material and “stirs” the nearly molten material.
Tool design is a central factor in the FSW process, due to the importance and functions of the
tool on the weld strength. The tool is responsible for heat generation, mixing, creating vertical
pressure, breaking the joint line and containing the material within the weld bead. The
properties of the parent material should be taken into account for an adequate tool design.
Geometrical design of the probe is important for heat generation and for mixing the
plasticized material. Conical and cylindrical shapes are generally used, but threads, spiral
steps, floats or flutes can be added to improve stirring of the material [25].
There are three types of FSW tools: fixed, adjustable and self-reacting tools. In fixed tools,
the probe and shoulder work as a single component. This type of tool is limited to a specific
and constant thickness. Adjustable tools allow variation in the probe length, since the
shoulder and probe are independent components [27].
A self-reaction tool is composed by three different components: top shoulder, bottom
shoulder and a probe in between. The probe extends through the parent material and reaches
the second shoulder on the back side that replaces the backing plate, which gives support to
the parent material in this FSW process. The probe rotates as the tool enters the base material
Figure 15 – Conventional FSW tool (a) shoulder (b) probe.

Temperature Measurement and Parameter Optimization of PE FSW Butt Joints
20
from the edge or a designated through hole, instead of plunging to the base material as
demonstrated in Figure 16. This type of tool presents some advantages [27]:
Reduced size and complexity of the tool, since the backing plate and the clamps are not
as sophisticated as the conventional one;
A more balanced axial force due to the symmetrical nature of the tool;
Avoidance of the root defects related to partial penetration.
Figure 16 – Self-reacting tool schematic [24].
Up to this point, most of the previous studies are focused on the FSW of aluminum alloys,
due to simple manufacturing process and the wide use of aluminum alloys in many major of
industries. FSW process significantly reduces the defects in comparison with fusion welding
methods due to the lower temperatures reached in the process [28].
This process is used to join other metallic materials such as magnesium and copper [29].
However, for joining materials with higher melting point or superior hardness, such as
titanium and steel, tool wear is significantly higher during the process. Relatively higher
temperature and force acting on the tool during FSW process require an extremely resistant
tool material in order to avoid tool damage during the welding process [28].
FSW is applicable to a variety of joint configurations with typically no need of additional
preparation. The most common configurations used in industrial applications are square butt-
joint and the lap-joint. Other joint types include corner welds, pipe welds, hemispherical
welds, multiple lap welds, double T-joint welds and fillet welds, as shown in Figure 17.
Figure 17 – Joint configurations for friction stir welding: (a) square butt, (b) edge butt, (c) T butt joint, (d) lap
joint, (e) multiple lap joint, (f) T lap joint, and (g) fillet joint [28].
Temperature Measurement and Parameter Optimization of PE FSW Butt Joints
21
FSW process has many advantages, not only in terms of quality of the final product but
also in other areas such as the environmental impact and economical point of view [28], [30]:
Low distortion, which eliminates post-weld operations (straightening and filling);
Good dimensional stability and repeatability;
No loss of alloying elements;
Excellent mechanical properties in the joint area;
Fine recrystallized microstructure;
Replace multiple parts joined by fasteners;
Post FSW formability;
It is applicable to components of a large range of thicknesses;
Traditional welding defects such as hot cracking and porosity are not an issue;
No filler material, toxic fumes or shielding gases are employed or generated;
Allows joining of dissimilar materials;
Improved cosmetic appearance;
Low residual stress;
Energy efficiency.
Some drawbacks of the conventional FSW process are [28]:
Exit hole or keyhole left when the tool is removed;
Heavy-duty clamping necessary to hold the base material in position and large vertical
forces are needed;
Critical dimensions;
Slow transverse speed rate for some materials.
3.1 Industrial applications
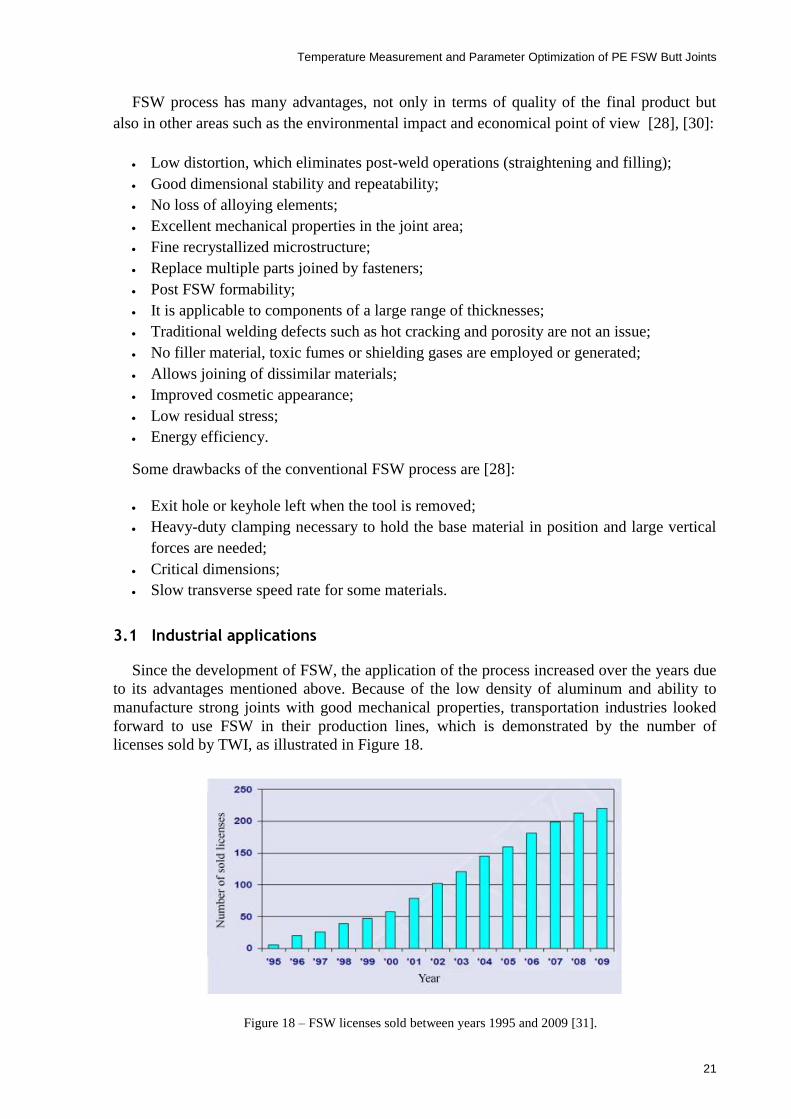
Since the development of FSW, the application of the process increased over the years due
to its advantages mentioned above. Because of the low density of aluminum and ability to
manufacture strong joints with good mechanical properties, transportation industries looked
forward to use FSW in their production lines, which is demonstrated by the number of
licenses sold by TWI, as illustrated in Figure 18.
Figure 18 – FSW licenses sold between years 1995 and 2009 [31].

Temperature Measurement and Parameter Optimization of PE FSW Butt Joints
22
The protection of the process patent and many of its variables constitute a considerable
obstacle to an increased industrial application but it is possible that as the patents expire the
process becomes more widely used [31].
The first commercial application of this welding technique was joining aluminum
extrusions to large panels with minimum distortion for shipbuilding in 1995. The use of FSW
for producing large prefabricated panels allowed a drastic reduction of costs and production
time in comparison with fusion welding [22].
The fact that FSW is able to weld high resistance aluminum alloys, such as 2000 and 7000
series, is one of the main reasons for the growing usage of this technique in aerospace
industry, with its first implementation in 1998, when NASA developed the process for use on
the space shuttle external tank [32].
FSW has been used in the assembly of fuselage elements in several airplanes such as the
Eclipse 500 jet, by Eclispe Aerospace (as seen in Figure 19), where 263 friction stir welds, in
a total of 136 meters in length, replaced more than 7000 conventional fasteners [32]. Friction
stir welding enabled a drastic reduction in aircraft assembly time and replaced more than 60
percent of the rivets on major assemblies [33].
.
FSW is also becoming widely implemented in the automotive industry. This is an attractive
technology to reduce car weight by integrating low weight alloys, especially aluminum, into
their assemblies. Suspension, wheels, seats, crash boxes or engine cradles are some of the
components in automotive industry using FSW. One example is the engine cradle of the 2013
Honda Accord (as illustrated in Figure 20). This structure is composed of a dissimilar
assembly of aluminum and steel joined with continuous FSW lap welds. The hybrid structure
is 25% lighter when compared with a full steel subframe [32].
Other transport industries, such as railway and maritime, also increased the use of FSW as
a joining technique to weld structures like long extruded panels. However, FSW is spreading
in new areas such as electronics devices. An example is the use of the process to weld the
iMac computer [34].
Figure 19 – Skin, stringers and frames joined via friction stir welding in eclipse jet [33].

Temperature Measurement and Parameter Optimization of PE FSW Butt Joints
23
3.2 Friction Stir Welding in polymers
Although FSW was originally developed for joining aluminum alloys, in recent years, due
to its advantages, the process is currently applied and studied for welding non-metallic
materials such as polymers and composite materials. The process maintains many of its
advantages when applied to polymers.
The investigation found in the literature on the application of FSW to join polymers is
more limited than the ones for metallic materials. The most common plastics studied so far
are polyethylene (PE), high density polyethylene (HDPE), polypropylene (PP), acrylonitrile-
butadiene styrene (ABS) and polyamide Nylon 6. Studies on joining dissimilar but compatible
thermoplastics are also reported in the literature [35].
The welding concept in polymers does not differ from the one performed in metals. A non-
consumable rotating tool with a specially designed pin and shoulder is inserted into the
abutting edges of the sheets or plates to be jointed and subsequently traversed along the joint
line. In the end the tool is removed, leaving a characteristic keyhole [25], as demonstrated in
Figure 21. Alternatively, instead of vertically remove the tool, this can run out until the end of
the base material, producing a tear-out. The end of the weld is generally trimmed in order to
eliminate the keyhole defect from the work piece.
When compared to other joining methods such as mechanical fastening and adhesive
bonding, FSW does not require an overlapping joint configuration. In comparison with
mechanical fastening, FSW has less stress concentration and forces are dispersed through a
larger area.
One of the main conceptual differences, according to some authors, is that when applied to
polymers, FSW process is no longer an absolute solid state process. Due to differences in
molecular weights, shorter polymer chains have a lower melting temperature than longer
polymer chains. This phenomenon can cause some polymer chains to melt, whereas other
chains do not reach the melting temperature [36].
Figure 20 – Honda Accord engine cradle [32].

Temperature Measurement and Parameter Optimization of PE FSW Butt Joints
24
Thermoplastic material has a low thermal conductivity and diffusion is not an efficient
mechanism because of its molecular structure. Keep that in mind, that the low melting
temperature and hardness of polymeric materials constitute the major physical and chemical
differences when comparing to the conventional materials welded by this technique (such as
aluminum and magnesium alloys). These differences lead to changes in terms of tool design
and process parameters choice, in order to obtain an optimum weld temperature and
subsequently a weald bead with good properties. Conventional tools are inadequate to weld
polymeric materials, when it comes to maintain the soften materials inside the weld bead [36].
Stationary shoulder Friction Stir Welding 3.2.1
In order to avoid the main problem with conventional FSW tools, which is the squeezing of
the melted polymer from the weld nugget (flash defect), some researchers developed modified
tools using a stationary shoulder [35]. This material loss is responsible for poor bonding
formation, leading to low tensile strength and poor mechanical properties of the produced
joints. In the tool design concept [30], a ball bearing is used to allow independent rotational
movement between the shoulder and the probe, as shown in Figure 22.
Figure 21 – Schematic of FSW steps [29].
Figure 22 – Stationary tool schematics representation [30].

Temperature Measurement and Parameter Optimization of PE FSW Butt Joints
25
Stationary Shoulder FSW (SSFSW) is a variant of the FSW process, originally developed
at TWI [32]. With this concept, the probe rotates and protrudes through a hole in the static
shoulder that can only have linear movement along the weld bead (it does not have a
rotational movement). The stationary shoulder adds no frictional heat to the surface, so all of
the heat is provided by the probe and the weld is made with an essentially linear heat input
profile. This process was originally developed for high temperature, low conductive base
materials like titanium [32]. Due to its advantages, this tool setup is also used for polymer
FSW. This tool design concept used in this study as it mentions in the experimental procedure
of this dissertation, the tool is illustrated in Figure 23.
By using a stationary shoulder, the applied vertical force is constant during the operation,
and if the tool is correctly designed the shoulder will prevent material loss from the welded
nugget. One of the main challenges of using this type of tool consists of preventing the
injection of the soft material inside the shoulder and bearing, avoiding premature failure of
the tool, especially in long runs [36].
In this variant, the shoulder no longer generates heat, which combined with the low
conductivity of polymeric materials makes it difficult to obtain suitable temperatures during
the welding. This problem can be addressed with the rearrangement of the process parameters
in order to generate more heat per length of weld bead. This can be achieved by increasing the
rotational speed or by decreasing the transverse speed. Other solution is using an external
heating source allowing good results without the need to decrease the welding time [36].
Friction Stir Welding with external heating 3.2.2
Obtaining optimum temperature values during welding by altering the process parameters
only (such as rotational speed and transverse speed), can be very difficult and can decrease
the welding speed drastically. To avoid these problems, some researchers studied the use of a
secondary heat source that assists the primary process heating source (frictional heat).
Figure 23 – Schematic of stationary tool and its components [24].

Temperature Measurement and Parameter Optimization of PE FSW Butt Joints
26
One example of a secondary heat source is i-FSW (induction friction stir welding), where
an induction coil encircles the FSW tool, heating it when an alternating electrical current is
applied to the induction coil. A temperature sensor connects to a temperature controller which
is synchronized with the induction power source, maintaining the desired temperature, as
shown in the scheme of Figure 24 [37].
However, the most common approach to this variant consists of introducing an electrical
resistance heating element on the tool. A stationary shoulder with a heat element is often used
(hot shoe). This tool consists of a static shoulder made in aluminum and coated at the bottom
with polytetrafluoroethylene in order to produce a smooth welding surface, Figure 25. With
the purpose of measure and control the temperature, a thermocouple and a heater were placed
inside the shoe. The extra heat provided can ensure optimal temperature levels even for low
rotational speeds and high transverse speeds. Not only the weld is less prompt to defects but
also the welding time is reduced [24].
Figure 25 – Schematic (a) and photograph (b) pictures of hot shoe tooling system[24].
Figure 24 – Scheme of the i-FSW process [37].

Temperature Measurement and Parameter Optimization of PE FSW Butt Joints
27
Some authors tested the application of the FSW joining technique in previously heated
tools and base materials. The results were similar to those obtained with the hot shoe tooling
system, with improvements in weld quality even for low rotational speeds [35].
3.3 Friction Stir Spot Welding
Friction stir spot welding (FSSW) is a recent application of the FSW process. Similar to
FSW, a rotating tool pin is used to join the material, but the transverse speed of the tool is
eliminated in favor of a series of discrete tool plunges. A rotating cylindrical shouldered tool
with a pin plunges with a specific rate into the overlapping sheets to a predetermined depth
[32].
As shown in Figure 26, the FSSW tool is positioned above the base material (Figure 26a)
and then descents and plunges the base material (Figure 26b). The frictional heat generated
between the material and the rotating tool softens the material and the rotating pin causes
material flow in both the circumferential and axial directions. The forging pressure applied by
the tool shoulder results in the formation of an annular, solid state bond around the pin. The
tool is then retracted and the retraction of the pin leaves a characteristic keyhole ( Figure 26c)
[38].
The FSSW process mimics the Resistance Spot Welding (RSW) process and can be used to
replace it as weel riveting, clinching or any other single point joining processes in many
applications [39].
In order to improve the quality of the resulting spot welds, several variations of the FSSW
process have been developed. Refill FSSW was developed to address the artifact known as the
keyhole. In this process the pin and shoulder can be moved independently along a common
vertical axis such as that the keyhole is eliminated by using the shoulder to push the expelled
weld flash back into the void created as the pin retracts. Stitch FSSW and Swing FSSW were
developed to increase the strength of the weld by creating larger joint interfaces. In the Stitch
FSSW method, the tool traverses a short linear distance. In the Swing FSSW method, the tool
holder is allowed to rotate a small amount about an axis parallel to the weld surface, which
results in arc-shaped weld path. A Rotating Anvil (RAFSSW) method was developed to help
eliminate the keyhole, reduce cycle time, and improve joint strength. In this method the
rotating anvil generates heat and produce stirring on the bottom side of the weld. [32]
Figure 26 – Friction stir spot welding stages [32].

Temperature Measurement and Parameter Optimization of PE FSW Butt Joints
28
3.4 Temperature in Friction Stir Welding
Previous studies have shown that an optimal temperature is the key to minimize defects in
the weld bead. Temperature has a major influence in the weld strength. A full comprehension
of this influence is crucial for the continuous development of this process. This development
can be expressed in terms of new tool designs and optimal choice of the welding parameters
[25].
Temperature distribution and material flow during welding have a major impact on the
formation of defects and affects the microstructure development, which have a direct
influence on the mechanical properties of the fabricated joints.
A welding temperature lower than the optimum value results in the appearance of defects,
such as voids (as shown in Figure 27), due to the lack of heat and insufficient stirring [40]. A
temperature higher than the than desirable can lead to flash formation (as shown in Figure 28)
or alterations in the microstructure that can reduce the joint strength. In both cases, the
inadequate temperature leads to low mechanical properties of the fabricated joint. This means
that temperature should remain within a certain temperature range to obtain defect-free joints
[25].
The heat generated by plastic deformation is related to the base material resistance to
deform, which creates internal forces. This phenomenon promotes not only heat generation
but also allows heat distribution around the welded zone [25].
During welding, the generated heat in the welding zone is dissipated to the tool body,
backing plate, surrounding parent material and the air, as shown in Figure 29. Due to the high
Figure 27 – Cavity defect due to low heat input [40].
Figure 28 – Weld flash due to excessive heat input [40].
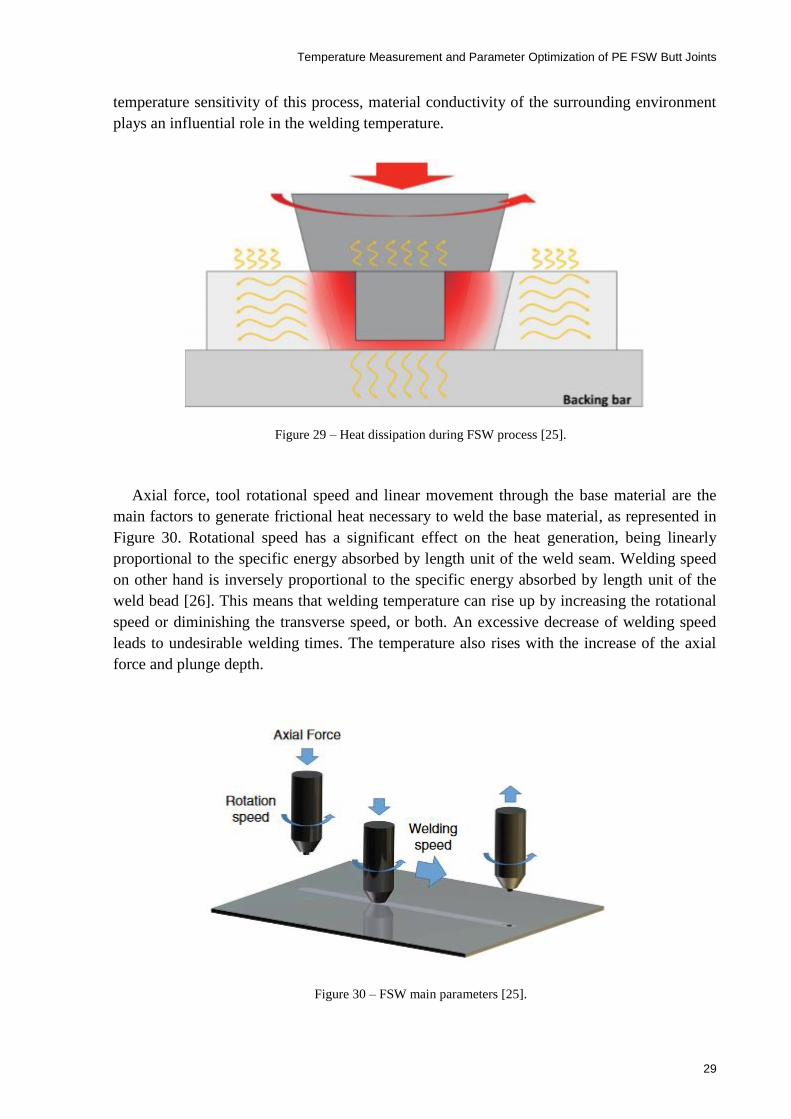
Temperature Measurement and Parameter Optimization of PE FSW Butt Joints
29
temperature sensitivity of this process, material conductivity of the surrounding environment
plays an influential role in the welding temperature.
Axial force, tool rotational speed and linear movement through the base material are the
main factors to generate frictional heat necessary to weld the base material, as represented in
Figure 30. Rotational speed has a significant effect on the heat generation, being linearly
proportional to the specific energy absorbed by length unit of the weld seam. Welding speed
on other hand is inversely proportional to the specific energy absorbed by length unit of the
weld bead [26]. This means that welding temperature can rise up by increasing the rotational
speed or diminishing the transverse speed, or both. An excessive decrease of welding speed
leads to undesirable welding times. The temperature also rises with the increase of the axial
force and plunge depth.
Figure 30 – FSW main parameters [25].
Figure 29 – Heat dissipation during FSW process [25].

Temperature Measurement and Parameter Optimization of PE FSW Butt Joints
30
Rotational speed and transverse speed are the most effective welding parameters in heat
generation, and in order to obtain sound welds, the choice of one parameter must not be
independent of the other. The incorrect combination of these parameters can lead to excess
heat input, insufficient heat generation or abnormal stirring, as illustrated in Figure 31.
Temperature measurement is fundamental to understand and predict the optimal
temperature value which leads to a good weld. The use of standard methods, such as
thermocouples, for acquiring peak temperature at the stirred zone is difficult due to the
passage of the probe with rotational movement, which destroys the thermocouple before the
peak temperature is reached [25]. This problem is even more severe in the case of polymer
welding due to the low thermal conductivity of this type of material, and in order to measure
values closer to the real welding temperature, thermocouples should be placed in the middle
of the joint line. For this reason, standard temperature measurements technologies do not
provide the desired repeatability, accuracy or speed to be used in industrial environments.
Temperature measurement is also fundamental for temperature control. The use of
temperature control allows to optimize the process to obtain defect free welds in process such
as the FSW, were thermal variations occur [25].
Figure 31 – Range of appropriate FSW parameters [40].
Temperature Measurement and Parameter Optimization of PE FSW Butt Joints
31
4 Experimental details
In this chapter, the conducted experimental work is fully described. The used methodology
and experimental setup are presented to give a good insight about how the results were
obtained. This chapter is divided in multiple sections explaining the base material
characterization, welding temperature and axial force measurements, FSW tool design as well
as all the stages regarding the Design of Experiments (DOE) statistical approach.
The first step was to characterize the material by means of tensile test results. For tensile
testing, specimens were cut and tested according to the ASTM D638-2a Standard [41]. One of
the main objectives of this study was to optimise the welding parameters regarding the joints
Ultimate Tensile Strength (UTS). Initially, various tests were conducted in order to define the
cutting method, welding parameters range, clamping system as well as temperature data
acquisition system.
The main FSW trials were conducted for different process parameters, and three different
probe diameters were chosen for this study: 3, 4 and 5mm in diameter. These tests were
repeated three times for averaging purposes, and in one of the repetitions, temperature was
measured using four thermocouples along the weld line. Afterwards, the fabricated joints
were cut and tested. Taguchi statistical approach was applied in order to reduce the number of
tests and to understand which of the welding parameters have the main effect on the weld
quality.
4.1 Base Material
Polyethylene 4.1.1
Polyethylene is a polyolefin and one of the most used plastics in different sectors of
industry. Polyolefin are high molecular weight hydrocarbons. Polyolefins include
polyethylene, polypropylene copolymer, polypropylene and polymenthyl pentene. These are
the only plastics that have a lower specific gravity than water.
In its simplest form, a polyethylene molecule consists of a long backbone of an even
number of covalently linked carbon atoms with a pair of hydrogen atoms attached to each
carbon, Figure 32. Chain ends are terminated by methyl groups. There are different types of
polyethylene, all having the same backbone of covalently linked carbon atoms with pendant
hydrogen atoms. When ethylene is polymerized the result is relatively straight polymer
chains. Variations arise chiefly from branches that modify the nature of the material [42].
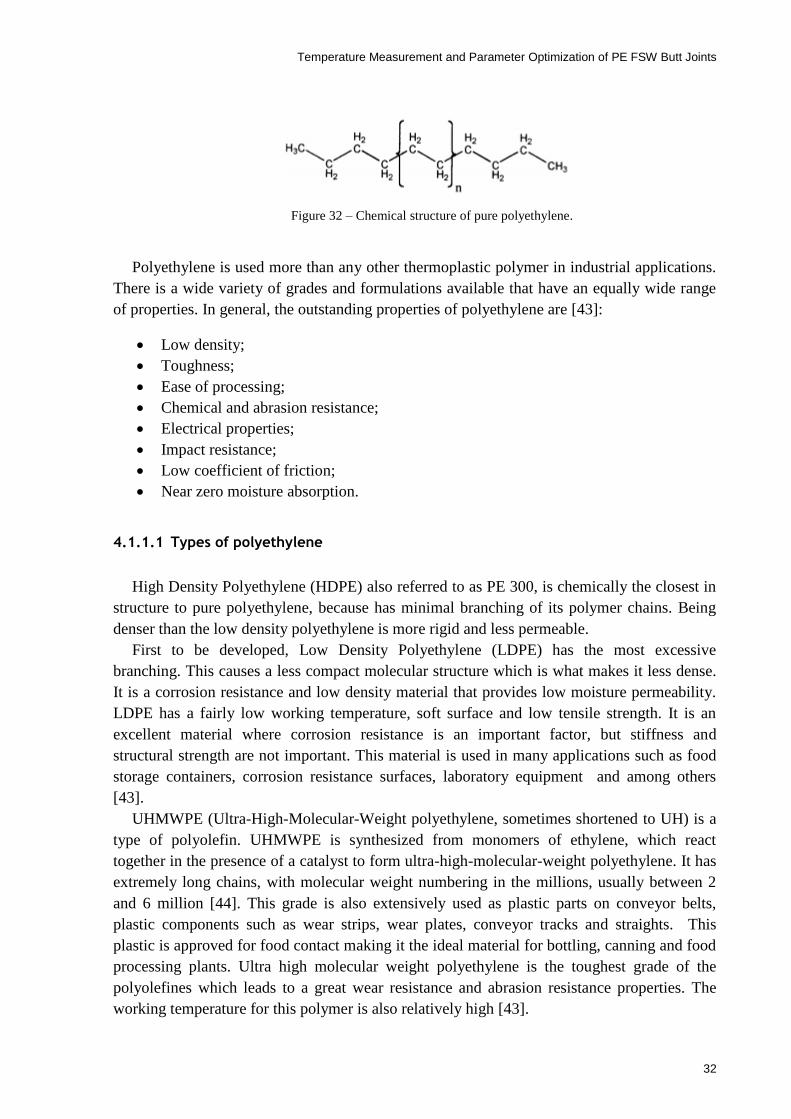
Temperature Measurement and Parameter Optimization of PE FSW Butt Joints
32
Polyethylene is used more than any other thermoplastic polymer in industrial applications.
There is a wide variety of grades and formulations available that have an equally wide range
of properties. In general, the outstanding properties of polyethylene are [43]: Low density;
Toughness;
Ease of processing;
Chemical and abrasion resistance;
Electrical properties;
Impact resistance;
Low coefficient of friction;
Near zero moisture absorption.
4.1.1.1 Types of polyethylene
High Density Polyethylene (HDPE) also referred to as PE 300, is chemically the closest in
structure to pure polyethylene, because has minimal branching of its polymer chains. Being
denser than the low density polyethylene is more rigid and less permeable.
First to be developed, Low Density Polyethylene (LDPE) has the most excessive
branching. This causes a less compact molecular structure which is what makes it less dense.
It is a corrosion resistance and low density material that provides low moisture permeability.
LDPE has a fairly low working temperature, soft surface and low tensile strength. It is an
excellent material where corrosion resistance is an important factor, but stiffness and
structural strength are not important. This material is used in many applications such as food
storage containers, corrosion resistance surfaces, laboratory equipment and among others
[43].
UHMWPE (Ultra-High-Molecular-Weight polyethylene, sometimes shortened to UH) is a
type of polyolefin. UHMWPE is synthesized from monomers of ethylene, which react
together in the presence of a catalyst to form ultra-high-molecular-weight polyethylene. It has
extremely long chains, with molecular weight numbering in the millions, usually between 2
and 6 million [44]. This grade is also extensively used as plastic parts on conveyor belts,
plastic components such as wear strips, wear plates, conveyor tracks and straights. This
plastic is approved for food contact making it the ideal material for bottling, canning and food
processing plants. Ultra high molecular weight polyethylene is the toughest grade of the
polyolefines which leads to a great wear resistance and abrasion resistance properties. The
working temperature for this polymer is also relatively high [43].
Figure 32 – Chemical structure of pure polyethylene.

Temperature Measurement and Parameter Optimization of PE FSW Butt Joints
33
HMWPE is widely used as wear parts and abrasion resistant plastic components in the
conveyor and materials handling industry. HMWPE (PE500) is slightly softer than UHMWPE
[43]. Due to all the industrial applications of this material, HMWPE was chosen to be the
subject of this study with 3mm thickness.
Base Material characterization 4.1.2
The main objective of this section is to characterize the base material mechanical
properties used in this study. High-Molecular-Weight Polyethylene (HMWPE) specimens
were prepared and subjected to tensile tests. Slightly softer than Ultra-High-Molecular-
Weight Polyethylene (UHWPE), HMWPE is widely used in wear parts and abrasion resistant
plastic components. The general properties, provided by the supplier, of the HMWPE (PE-
500) are presented Table 2.
Table 2 – General properties of the HMWPE provided by the supplier [45].
General
properties
Density Young’s
Modulus
Ultimate Tensile
Strength
Deformation
at Rupture
Melting
Temperature
0.96 1.2 GPa 27 MPa >50 % 120-130 ºC
Tensile tests were carried out according to the ASM Standard D638-2a (Test Methods for
Tensile Properties of Thin Plastic Sheeting) [41], in order to characterize the mechanical
resistance of the base material. This test method is designed for the control and specification
of plastic materials [41]. Due to the thickness of the supplied material and the nature of the
polymer (rigid/semi-rigid), type 1 specimen geometry was selected from the ASTM Standard.
The dimensions and shape of the specimen are shown in Figure 33.
Five specimens were produced and tested for the characterization of the base material, as
determined by ASTM Standard for isotropic materials. The specimens were cut by a vertical
saw in a certain dimensions, and then the exact dimensions were machined using a 3-axis
Computer Numerical Control Machine (CNC), Optimum® BF 20LVario. The machining
Figure 33 – Type 1 specimen dimensions according with ASTM standard [41].

Temperature Measurement and Parameter Optimization of PE FSW Butt Joints
34
operations were conducted in multiple polyethylene samples at the same time, which were
strongly clamped to ensure adequate fixation during machining operations, as demonstrated in
Figure 34.
Tensile tests were performed with a speed of 5 mm/min in a MTS®
810 tensile testing
machine. Regarding data aquisiton, a piezoelectric load cell with a maximum of 10kN and a
MTS® clip gage extensometer were used to measure strain, as shown in Figure 35a. The base
material speciemens were mounted and aligned with the dedicated gripping system and tested
until the maximum strain (50%) measured by the MTS® clip gage extensometer, Figure 35b.
Figure 35 – Tensile test apparatus: (a) tensile test configuration with extensometer; (b) gripping system.
a) b)
Figure 34 – Machining of HMWPE 3mm sheets into normalized specimen.

Temperature Measurement and Parameter Optimization of PE FSW Butt Joints
35
For each specimen the maximum loads were recorded and the maximum stress were
calculated. Although the existence of a true elastic limit in plastics (as in many other organic
materials and in many metals) is debatable [41], the Young Modulus of the plastic was
determined by the tangent of the linear region at low forces, which presented in Table 3 and
the tensile test curve of the base material (specimen 1) is demonstrated in Figure 36, and the
engineering stress-strain curve is presented in Figure 37.
Table 3 – Tensile properties of Polyethylene.
Specimen Maximum load
(N)
Maximum Stress
(MPa)
Young´s Modulus
(GPa)
1 920.4 23.6 1.41
2 923.3 23.7 1.37
3 920.4 23.6 1.39
4
5
921.5
922.7
23.6
23.7
1.36
1.40
Mean 921.7 23.6 1.39
Standard
deviation 1.3 0.05 0.02
Figure 36 – Tensile test curve for specimen 1, Force-Displacement.
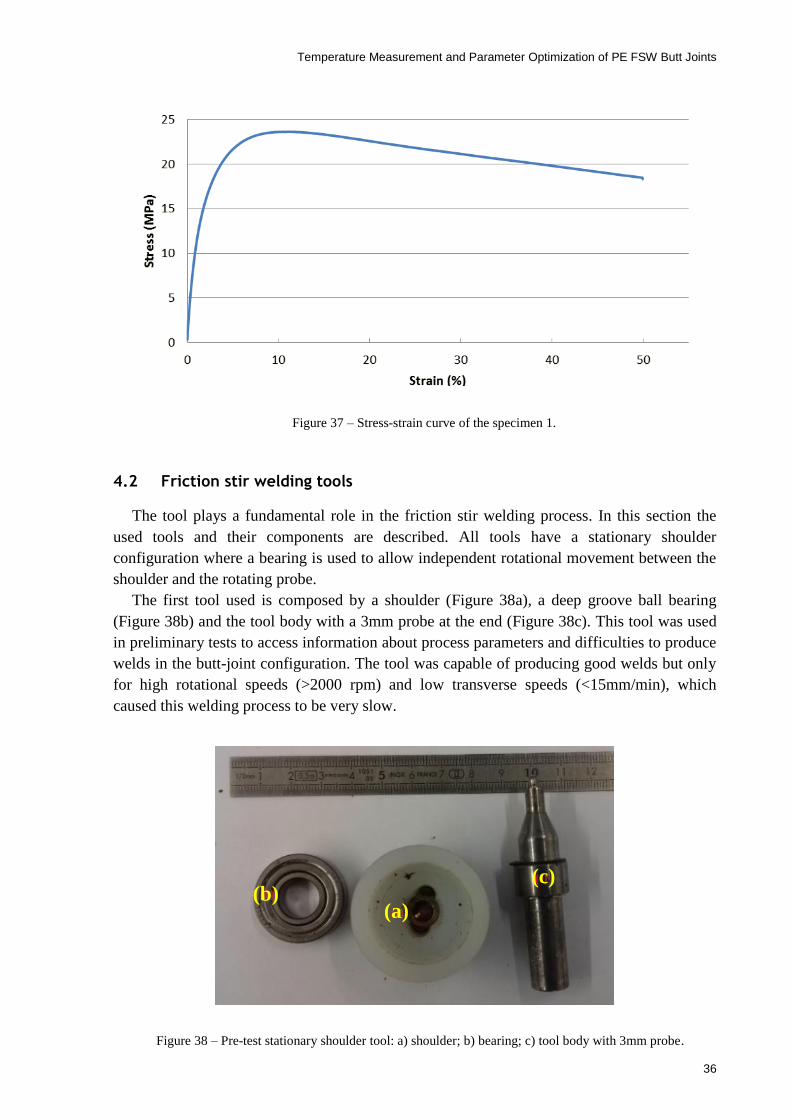
Temperature Measurement and Parameter Optimization of PE FSW Butt Joints
36
4.2 Friction stir welding tools
The tool plays a fundamental role in the friction stir welding process. In this section the
used tools and their components are described. All tools have a stationary shoulder
configuration where a bearing is used to allow independent rotational movement between the
shoulder and the rotating probe.
The first tool used is composed by a shoulder (Figure 38a), a deep groove ball bearing
(Figure 38b) and the tool body with a 3mm probe at the end (Figure 38c). This tool was used
in preliminary tests to access information about process parameters and difficulties to produce
welds in the butt-joint configuration. The tool was capable of producing good welds but only
for high rotational speeds (>2000 rpm) and low transverse speeds (<15mm/min), which
caused this welding process to be very slow.
Figure 38 – Pre-test stationary shoulder tool: a) shoulder; b) bearing; c) tool body with 3mm probe.
Figure 37 – Stress-strain curve of the specimen 1.
(a) (b)
(c)
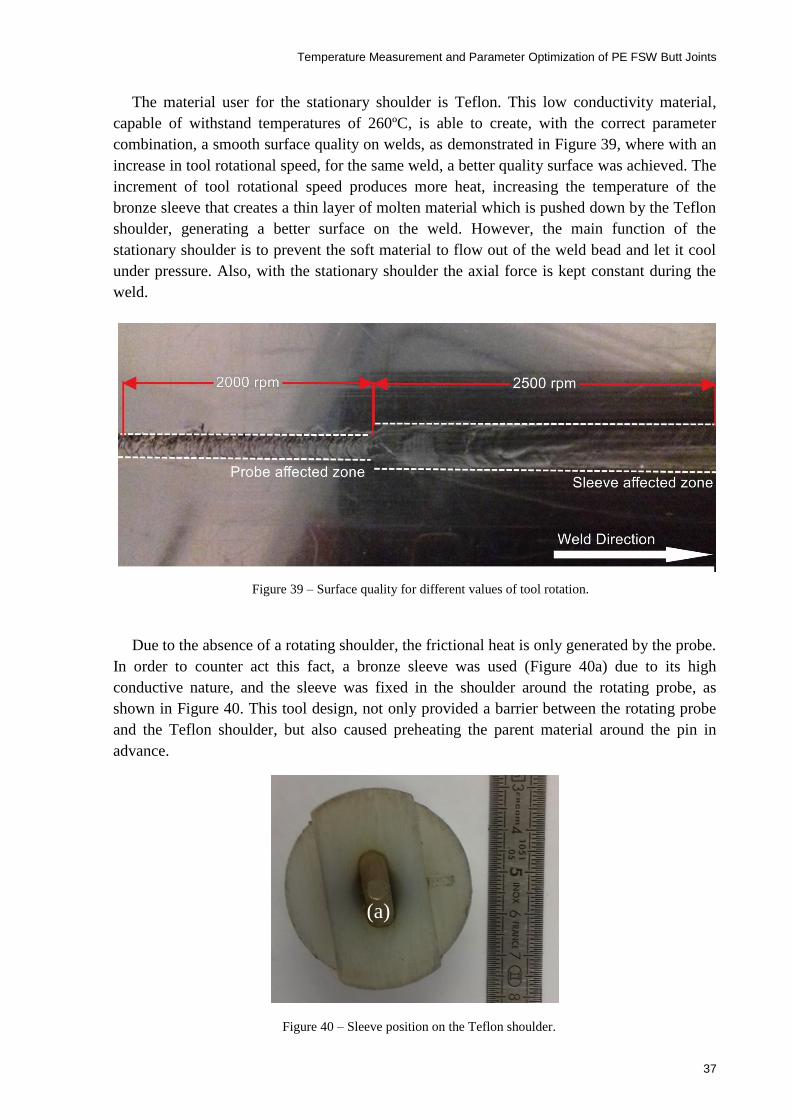
Temperature Measurement and Parameter Optimization of PE FSW Butt Joints
37
The material user for the stationary shoulder is Teflon. This low conductivity material,
capable of withstand temperatures of 260ºC, is able to create, with the correct parameter
combination, a smooth surface quality on welds, as demonstrated in Figure 39, where with an
increase in tool rotational speed, for the same weld, a better quality surface was achieved. The
increment of tool rotational speed produces more heat, increasing the temperature of the
bronze sleeve that creates a thin layer of molten material which is pushed down by the Teflon
shoulder, generating a better surface on the weld. However, the main function of the
stationary shoulder is to prevent the soft material to flow out of the weld bead and let it cool
under pressure. Also, with the stationary shoulder the axial force is kept constant during the
weld.
Due to the absence of a rotating shoulder, the frictional heat is only generated by the probe.
In order to counter act this fact, a bronze sleeve was used (Figure 40a) due to its high
conductive nature, and the sleeve was fixed in the shoulder around the rotating probe, as
shown in Figure 40. This tool design, not only provided a barrier between the rotating probe
and the Teflon shoulder, but also caused preheating the parent material around the pin in
advance.
Figure 39 – Surface quality for different values of tool rotation.
Figure 40 – Sleeve position on the Teflon shoulder.
(a)
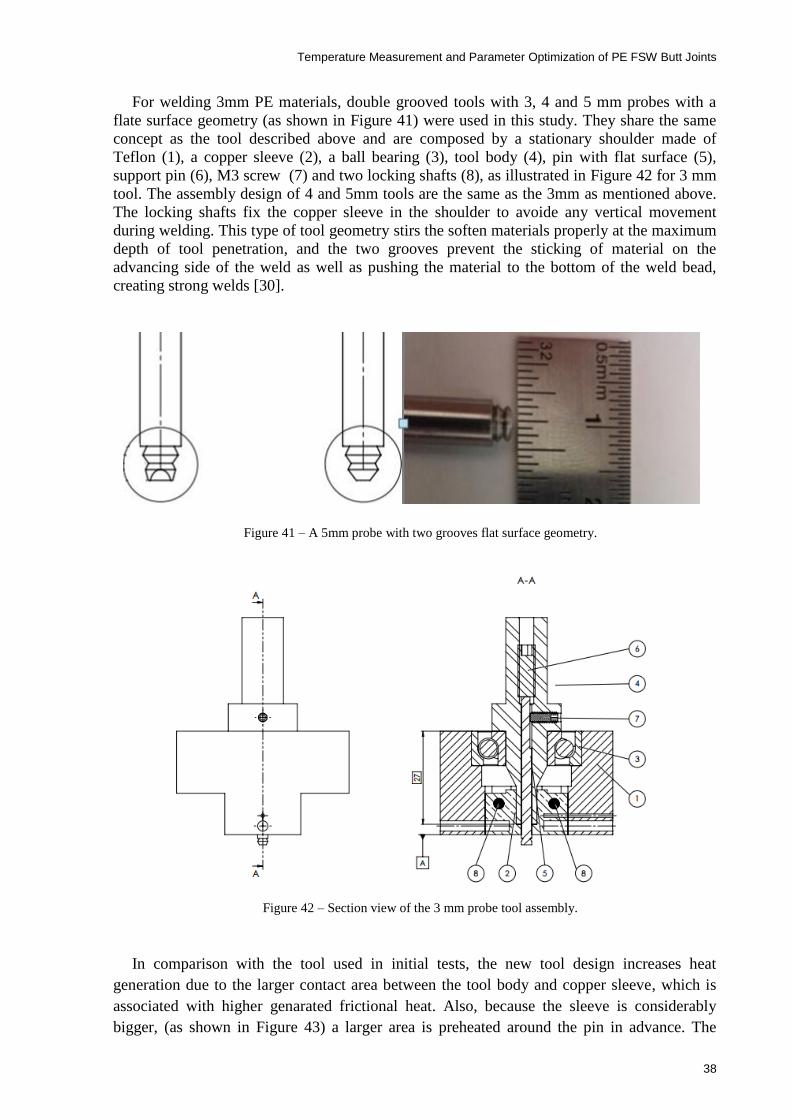
Temperature Measurement and Parameter Optimization of PE FSW Butt Joints
38
For welding 3mm PE materials, double grooved tools with 3, 4 and 5 mm probes with a
flate surface geometry (as shown in Figure 41) were used in this study. They share the same
concept as the tool described above and are composed by a stationary shoulder made of
Teflon (1), a copper sleeve (2), a ball bearing (3), tool body (4), pin with flat surface (5),
support pin (6), M3 screw (7) and two locking shafts (8), as illustrated in Figure 42 for 3 mm
tool. The assembly design of 4 and 5mm tools are the same as the 3mm as mentioned above.
The locking shafts fix the copper sleeve in the shoulder to avoide any vertical movement
during welding. This type of tool geometry stirs the soften materials properly at the maximum
depth of tool penetration, and the two grooves prevent the sticking of material on the
advancing side of the weld as well as pushing the material to the bottom of the weld bead,
creating strong welds [30].
In comparison with the tool used in initial tests, the new tool design increases heat
generation due to the larger contact area between the tool body and copper sleeve, which is
associated with higher genarated frictional heat. Also, because the sleeve is considerably
bigger, (as shown in Figure 43) a larger area is preheated around the pin in advance. The
Figure 41 – A 5mm probe with two grooves flat surface geometry.
Figure 42 – Section view of the 3 mm probe tool assembly.

Temperature Measurement and Parameter Optimization of PE FSW Butt Joints
39
combination of these two aspects allowed the new tool design to perform a faster welding
with stronger weld quality as it will be explained in the next chapter.
In this tool as illustrated in Figure 44, the probe length is ajdustable by moving the set
screw (a) vertically inside the threaded hole, then the probe is locked by pressing the socket
set screw (b) against the flat surface of the probe (c). The adjustable probe length allows the
tool to perform welds in a certain range of sheet thicknesses with optimum tool penetration.
Figure 43 – Size comparison between the stationary shoulder components.
Figure 44 – Adjustable probe length tool used in tests.

Temperature Measurement and Parameter Optimization of PE FSW Butt Joints
40
In order to avoid root defects, defined as the non-welded zone of the weld nugget due to
lack of tool penetration (Figure 45), the probe was adjusted to the maximum length possible.
The maximum length was determined by preliminar test welds where the probe length was
gradually increased until the tool started to damage the backing plate. These pre-tests were
performed with the maximum axial force allowed (1200N) to ensure that the tool does not
damage the backing plate in any of the subsquent tests. The probe length was measured with a
micrometer, as shown in Figure 46.
Figure 45 – Root defect due to lack of tool penetration. Pre-test weld with 2.8 mm probe length.
Figure 46 – Probe length measuring with a micrometer.

Temperature Measurement and Parameter Optimization of PE FSW Butt Joints
41
4.3 Sensorized clamping system
Axial force is one of the main parameters of the friction stir welding process, responsible
for heat generation and forging pressure applied to the weld. Having such great impact on the
weld quality, the monitoring of the axial force during the process is crucial to understand the
importance and the optimum values for this parameter during welding.
A force plate/sensorized clamping system was used in the present work for load acquisition
during the weld. A force plate is designed to measure the forces and moments applied to its
top surface. The sensorized clamping system was available in the laboratory and it is
instrumented with four load cells for each axis that are connected to a data acquisition system.
The load cells used in the plate were from Vetek manufacturer (202WA) having a maximum
capacity of 300kg each. The positions of the load cells and the force plate are shown in Figure
47. The data is acquired and manipulated by a dedicated LabViewTM
code that allows
observation and registration of the loads for each axis during welding.
The sensorized clamping system measures the axial force (Fz), the transverse force (Fx)
caused by the linear movement of the tool, and the side force (Fy) caused by the rotation of
the welding tool. During the welding process, when the tool plunges the two plates and then
moves across the interface between the two sheets an opening force can lead to a gap between
the plates (usually only the weakly clamped sheet moves), causing a volumetric defect. That
opening force could not be measured by the sensorized clamping system due to its
symmetrical nature, and demands an improved clamping system, capable of preventing any
type of movements of the sheets during the welding process. In pre-tests, the existent
clamping system was not capable of counteract the mentioned force, and the gap between the
plastic sheets caused massive weld defects. In some cases, the distance between the plates was
large enough to hinder the bonding process. Figure 48 shows this problem: the lateral
movement of the plate (b) generated massive weld defects.
Figure 47 – Sensorized plate and clamping system: Top (a) and bottom (b) views.

Temperature Measurement and Parameter Optimization of PE FSW Butt Joints
42
In order to avoid this unwanted behavior, the original clamping system (Figure 49a) was
improved with the addition of four clamps (b). The original clamping system is very efficient
in preventing vertical movement of the sheets by compressing them against the backing plate.
The other degree of freedom is prevented by the friction between the clamp bars (c) and the
plastic sheets, which is not effective enough for larger forces or slippery material (most of the
polymers). The newly-designed clamps provided a better resistance to the lateral movements
by being forced against the lateral face of the sheets and fixed to the back plate, as shown in
Figure 49. However, even with the improvements made on the clamping system, for certain
values of welding parameters (high plunge speeds, high axial force and low rotational speed)
lateral movement occurred, especially during the plunging of the tool with high speed. In
order to avoid this problem a low plunging speed was used in tests (20 mm/min).
Weld Direction
Figure 48 – Weld defects due to gap between the plates.
Figure 49 – Clamping system used to grasp the two plates to be weld by FSW.

Temperature Measurement and Parameter Optimization of PE FSW Butt Joints
43
4.4 Experimental design
In order to investigate the influence of FSW welding parameters, researchers usually
follow the conventional experimental procedures, varying one parameter at a time while
keeping the other parameters constant (full factorial design). This conventional parametric
design of the experimental approach is time consuming and requires excessive resources. In
order to solve this problem, there are different methods of achieving the desired output
variables by developing new models. The Taguchi method is one of the techniques that could
be applied to optimize the welding parameters [46].
Taguchi is a statistical method developed by Taguchi and Konishi. The original objective
of the method was to improve the quality of goods manufactured, but later its application
expanded to many other fields, to optimize parameters and improve the quality of the final
products [47].
The Taguchi method reduces the number of trials in an experimental design, through the
use of an orthogonal array to study the entire parameter space, and still capable of making a
good evaluation of the optimum values for the parameters in analysis.
That is a great advantage, especially in complex experimental procedures, with several
input factors, each with different levels that need to be evaluated. The study of all possibilities
could be time consuming and very expensive. For instance, an experiment with 4 inputs with
3 levels would take 81 trials to test all the possibilities.
A loss function is used to measure the performance characteristics that are deviating from
the desired target value. The value of the loss function is transformed into signal-to-noise
(S/N) ratio and then, according to the objectives, there are several categories to analyze this
ratio. From these categories, the most common are nominal-the-best, larger-the-better and
smaller-the-better.
The Taguchi method can be resumed on the following steps [47]:
1. Identify the main function and its side effects;
2. Identify the noise factors, testing condition and quality characteristics;
3. Identify the objective function to be optimized;
4. Identify the control factors and their levels;
5. Select a suitable Orthogonal Array and construct the Matrix;
6. Conduct the matrix experiment;
7. Examine the data and then predict the optimum control factor levels and its
performance;
8. Conduct the verification experiment.

Temperature Measurement and Parameter Optimization of PE FSW Butt Joints
44
In this study, 3 mm-tick plates of High Molecular Weigth Polyethylene were used in butt-
joint configuration. The plates were welded using a 3-axis milling machine using position
control welding method. A three-level design with four parameters: tool diameter, rotational
speed, transverse speed and axial force were analysed, as shown in Table 4. The interval of
values tested for each parameter was defined in preliminary tests. Fixed welding parameter
were also defined in preliminary tests and presented in Table 5.
Table 4 – Three level design parameter values.
Welding
Parameters Units Level 1 Level 2 Level 3
Tool diameter mm 3 4 5
Rotational
speed rpm 1500 2000 2500
Transverse
speed mm/min 30 50 70
Axial Force N 800 950 1100
Table 5 – Fixed welding parameter values.
Welding Parameters Units Fixed Values
Plunge speed mm/min 20
Dwell time sec 5
Probe length mm 2.95
Trial experiments were carried out according to the principles of the design of experiments
and repeated three times in to determine the effect of the main process parameters. An L9
orthogonal array with four parameter with three level design was applied. Since the L9
orthogonal array has four columns, each welding parameter is assigned to a column. The
experimental layout for the four welding parameters using the L9 orthogonal array is shown
in Table 6. On the third repetition temperature was measured underneath the weld bead as
explained before. In this study, which aims at the optimization of the joints ultimate tensile
strength (UTS), the function proposed by Taguchi for signal-to-noise (S/N) ratio calculation
was taken according to “larger the better”:

Temperature Measurement and Parameter Optimization of PE FSW Butt Joints
45
(
∑
)
(4.1)
where n represents the number of the tests and yi is the experimental value of the quality
characteristics. The response of the S/N ratio for each level of the welding parameters was
acquired using MINITAB statistical software. The combination of optimized parameters
given by the statistical analysis was subsequently tested.
Table 6 – Experimental layout using an L9 orthogonal array.
Specimen
number
Friction stir welding process parameters
Tool diameter
(mm)
Rotational speed
(rpm)
Transverse
speed (mm/min)
Axial force
(N)
S1 3 1500 30 800
S2 3 2000 50 950
S3 3 2500 70 1100
S4 4 1500 50 1100
S5 4 2000 70 800
S6 4 2500 30 950
S7 5 1500 70 950
S8 5 2000 30 1100
S9 5 2500 50 800
A total of 27 welds were performed in this experimental procedure (9 tests × 3 repetitions).
The 54 sheets of PE were cut using vertical electric saw (Figure 50a) from 500×500×3 mm3
plates to the dimensions shown in Figure 50b. In order to provide a perfect interface area
between the two plates, the contacting faces were machined and straighten using a milling
machine.

Temperature Measurement and Parameter Optimization of PE FSW Butt Joints
46
The assembly of the butt-joint configuration is one of the most important stages for a good
welding condition. The two plates must be strongly clamped to avoid any type of movements
during welding and the consequent defects associated. Also, the interfacial line of the two
sheets has to be perfectly aligned with the line described by the tool linear movement. As
demonstrated in Figure 51, to ensure this alignment, two guiding pins (a) were inserted on the
backing plate and a metallic T-beam profile (b) (constant width) was laterally pressed against
them. Then the machined face of one of the plate to be welded (c) was pressed laterally
against the T-beam and clamped. Finally, the other plate was placed and clamped in the
correct position and the tool moved to the middle of the interfaced line.
Figure 51 – Alignment setup used in the experimental setup of HMWPE 3mm plates by FSW.
Figure 50 – Saw cutting of the 3mm plates (a); Dimension of the plates (mm) (b).

Temperature Measurement and Parameter Optimization of PE FSW Butt Joints
47
The rotational speed and transverse speed are directly defined to the CNC machine with G
codes. However, the force setup requires a few steps using the sensorized clamping system as
a position control system. As illustrated in Figure 52, first the tool and shoulder are moved
vertically down (a), compressing two 3-millimeter-thick metal bars (b) positioned on top of
the clamped plates (c). Then the movement is stopped when the measured force equals to the
force required in the test, and the position is recorded by the Mach3 software. The recorded
position corresponds to the welding position with a positive 3 mm vertical offset. Then the
tool is raised 2 mm above the plates, and the metal bars removed. On the last stage of the
force setup, the tool is moved laterally to the plunge location, being 5 milimiters positioned
above the pretended position during welding at the end of this stage. Without the metalic bars
the probe would damage the polyethylene sheets before welding.
The welding begins when the tool, animated with the pretended rotational speed, descents
5 milimiters offset from the maximum plunge location with a fixed vertical velocity of 20
mm/min. A constant dwell time of 5 seconds is made at the plunge location to heat up the tool
and plasticize the parent material. After the dwell time, the tool is linearly moved 150
milimiters along the weld line of the two plates, welding plates together under the axial force.
At the final position, the tool is withdrawn. The weld was allowed to cool down for 10
minutes before the clamping system was removed to minimize the bending of the welded
plates. Also the tool components were cooled down after each welding try out.
Four stripes with a width of 25 mm were cut with power saw from the original plates, as
demonstrated in Figure 53. The stripes were machined into the specimen type 1 dimensions
mentioned in section 4.1, and tensile tests were performed with the same conditions applied to
the base material. The three best results from each weld were selected and used in the
statistical study. In total, 108 specimens were tested (Figure 54).
Figure 52 – Axial force pre-load determination setup.

Temperature Measurement and Parameter Optimization of PE FSW Butt Joints
48
Figure 53 – Division of the weld into 4 stripes.
Figure 54 – Specimens tested during the experimental work.

Temperature Measurement and Parameter Optimization of PE FSW Butt Joints
49
4.5 Temperature measurement
Welding temperature is a fundamental aspect in most of the welding processes. Friction stir
welding is no exception and one of the main objectives of the presented work is to measure
the welding temperature for different combinations of process parameters and analyze how it
correlates with joint efficiency.
Polymeric materials have low thermal conductivity which makes it more challenging to
measure the temperature during welding. Consequently, conventional temperature sensors
such as thermocouples and thermistors should be placed as close as possible, or even inside
the weld bead, to measure the direct temperature. Thermographic camera, infrared device and
remote temperature sensors cannot be used in this work because the weld bead is covered by
the stationary shoulder, backing plate and clamping system.
A thermocouple is a temperature sensor composed of two dissimilar metal wires, joined at
one end. According to the temperature of the junction, a differential voltage can be measured
in the open circuit at the other end of the wires. The differential voltage measured is a
function of the temperature and the materials that make up the wires. Knowing the correlation
it is possible to relate the temperature to the differential voltage [48]. In this study, low gage
diameter type K (chromel-alumel) thermocouples were chosen as temperature sensors due to
the rapid response required, the possibility of measuring the temperature at various points of
the weld, simplicity and low cost. This type of thermocouples have a working range from -
200ºC to 1100ºC and a sensitivity of 40,44µV/ºC.
In preliminary tests, four thermocouples were placed between the two plates to be welded,
in four different positions. Even though some results were unreliable, it was still possible to
notice a temperature gradient across the depth of the sheets.
Due to the difficulty in guaranteeing the positioning of the thermocouples at the same
depth in the weld as well as the possible temperature gradient, the measurements could
eventually lead to an incorrect correlation between temperature and weld strength.
In order to avoid the mentioned problem, thermocouples were positioned underneath the
weld bead in four different positions equally displaced (as seen in Figure 55) allowing the
investigation of the required heat generation to produce a strong joint in the full depth of the
sheets, which is crucial to the weld resistance. With this positioning, thermocouple readings
were more reliable and stable. Also, the number of thermocouples destroyed by passing of the
tool decreased significantly. Thermocouples were built and rebuilt by mercury-soldering
using a capacitive-discharge technique to ensure uniformity, Figure 56.
In the present work AD 595’s IC’s from Analog Devices® are used as complete
instrumentation amplifiers for K type thermocouple with cold junction compensation and a
gain of 247,3 (10mV/ºC divided by 40,44 μ V/ºC) for measuring and amplifying the
thermocouple electromotive force [49].

Temperature Measurement and Parameter Optimization of PE FSW Butt Joints
50
A circuit was developed to measure the temperature and thermocouples were connected to
four conditioning circuits containing the AD 595’s. The circuit makes the interface between
the thermocouples and a USB-6008 from National Instruments, which allows the connection
to a PC for recording the measured data. The conditioning circuit was available in the
laboratory (Figure 57) but a dual power supply was needed in order to measure negative and
positive temperature.
Figure 56 – Mercury-soldering by capacitive discharge of the thermocouple wires.
Power supply
Mercury
Figure 55 – Thermocouples position underneath the weld bead.
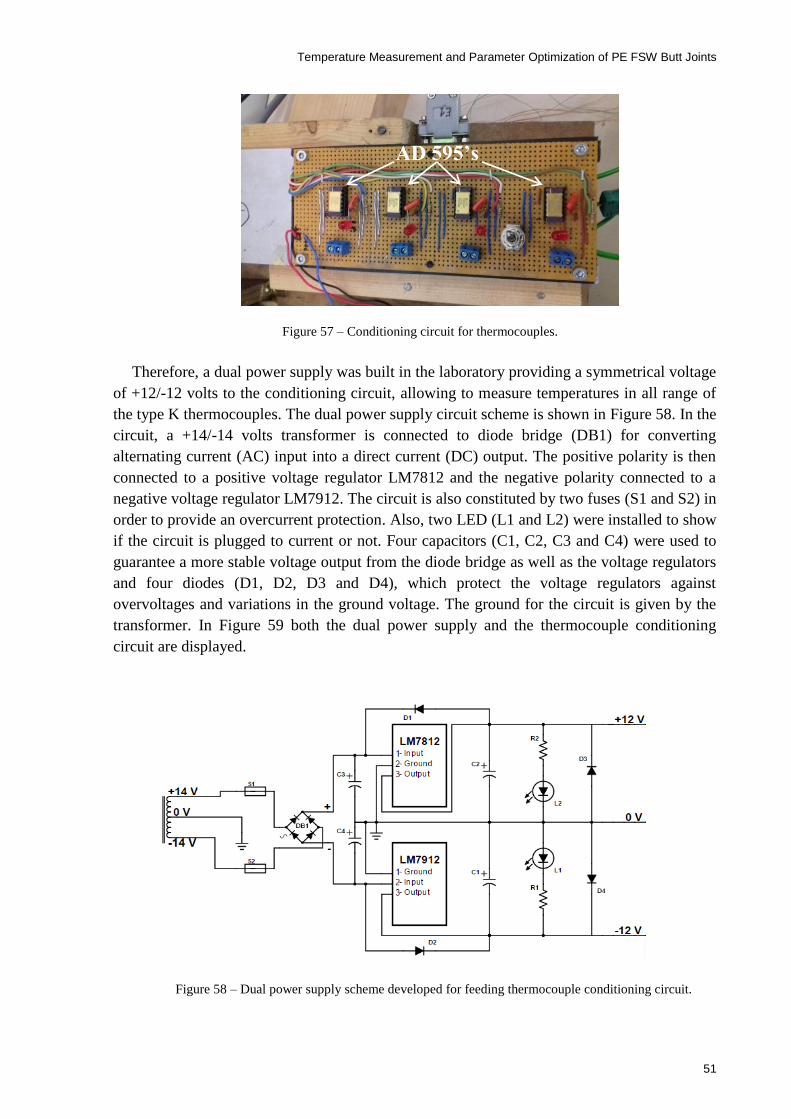
Temperature Measurement and Parameter Optimization of PE FSW Butt Joints
51
Therefore, a dual power supply was built in the laboratory providing a symmetrical voltage
of +12/-12 volts to the conditioning circuit, allowing to measure temperatures in all range of
the type K thermocouples. The dual power supply circuit scheme is shown in Figure 58. In the
circuit, a +14/-14 volts transformer is connected to diode bridge (DB1) for converting
alternating current (AC) input into a direct current (DC) output. The positive polarity is then
connected to a positive voltage regulator LM7812 and the negative polarity connected to a
negative voltage regulator LM7912. The circuit is also constituted by two fuses (S1 and S2) in
order to provide an overcurrent protection. Also, two LED (L1 and L2) were installed to show
if the circuit is plugged to current or not. Four capacitors (C1, C2, C3 and C4) were used to
guarantee a more stable voltage output from the diode bridge as well as the voltage regulators
and four diodes (D1, D2, D3 and D4), which protect the voltage regulators against
overvoltages and variations in the ground voltage. The ground for the circuit is given by the
transformer. In Figure 59 both the dual power supply and the thermocouple conditioning
circuit are displayed.
Figure 58 – Dual power supply scheme developed for feeding thermocouple conditioning circuit.
Figure 57 – Conditioning circuit for thermocouples.
AD 595’s
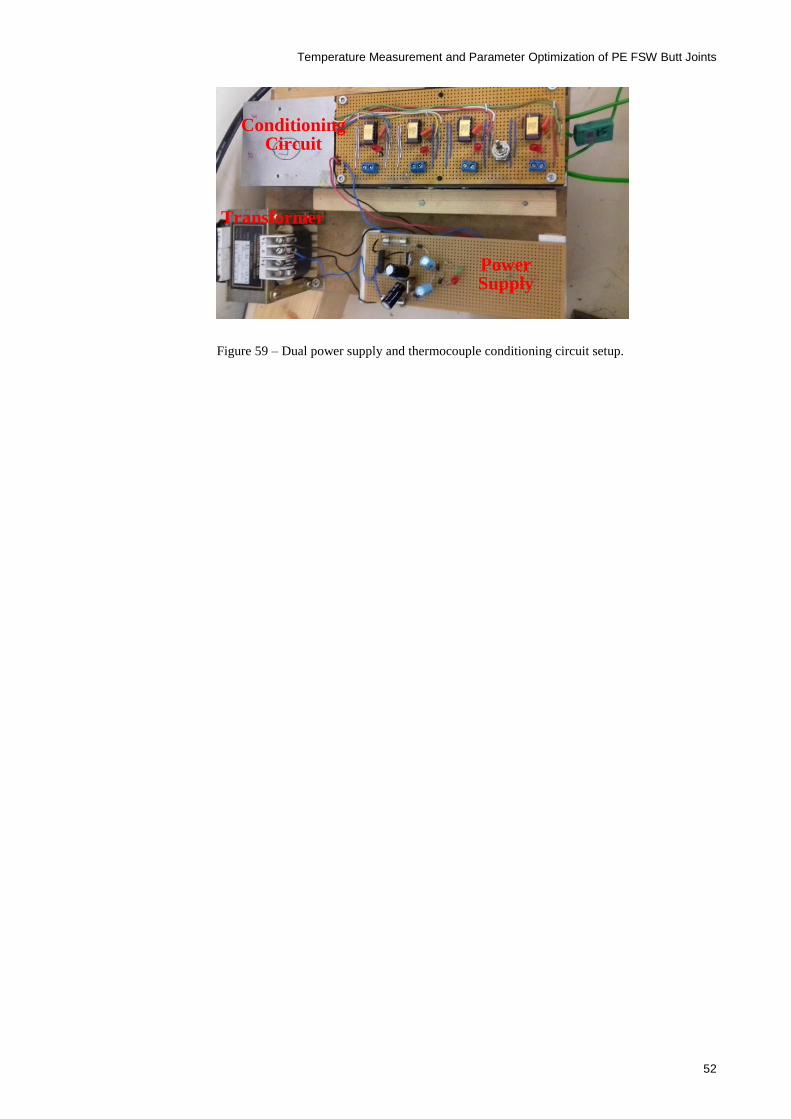
Temperature Measurement and Parameter Optimization of PE FSW Butt Joints
52
Figure 59 – Dual power supply and thermocouple conditioning circuit setup.
Transformer
Power Supply
Conditioning Circuit
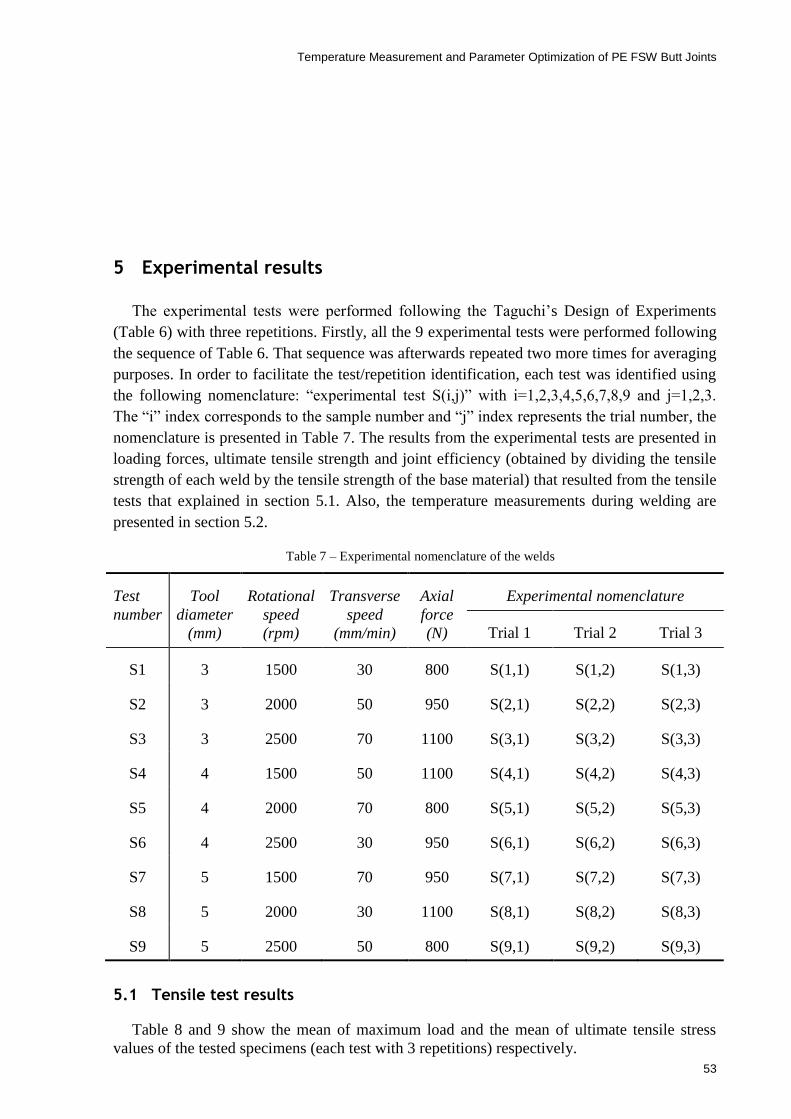
Temperature Measurement and Parameter Optimization of PE FSW Butt Joints
53
5 Experimental results
The experimental tests were performed following the Taguchi’s Design of Experiments
(Table 6) with three repetitions. Firstly, all the 9 experimental tests were performed following
the sequence of Table 6. That sequence was afterwards repeated two more times for averaging
purposes. In order to facilitate the test/repetition identification, each test was identified using
the following nomenclature: “experimental test S(i,j)” with i=1,2,3,4,5,6,7,8,9 and j=1,2,3.
The “i” index corresponds to the sample number and “j” index represents the trial number, the
nomenclature is presented in Table 7. The results from the experimental tests are presented in
loading forces, ultimate tensile strength and joint efficiency (obtained by dividing the tensile
strength of each weld by the tensile strength of the base material) that resulted from the tensile
tests that explained in section 5.1. Also, the temperature measurements during welding are
presented in section 5.2.
Table 7 – Experimental nomenclature of the welds
Test
number
Tool
diameter
(mm)
Rotational
speed
(rpm)
Transverse
speed
(mm/min)
Axial
force
(N)
Experimental nomenclature
Trial 1 Trial 2 Trial 3
S1 3 1500 30 800 S(1,1) S(1,2) S(1,3)
S2 3 2000 50 950 S(2,1) S(2,2) S(2,3)
S3 3 2500 70 1100 S(3,1) S(3,2) S(3,3)
S4 4 1500 50 1100 S(4,1) S(4,2) S(4,3)
S5 4 2000 70 800 S(5,1) S(5,2) S(5,3)
S6 4 2500 30 950 S(6,1) S(6,2) S(6,3)
S7 5 1500 70 950 S(7,1) S(7,2) S(7,3)
S8 5 2000 30 1100 S(8,1) S(8,2) S(8,3)
S9 5 2500 50 800 S(9,1) S(9,2) S(9,3)
5.1 Tensile test results
Table 8 and 9 show the mean of maximum load and the mean of ultimate tensile stress
values of the tested specimens (each test with 3 repetitions) respectively.

Temperature Measurement and Parameter Optimization of PE FSW Butt Joints
54
Table 8 – Maximum load results of the tensile tests.
Test
number
Tool
diameter
(mm)
Rotational
speed
(rpm)
Transverse
speed
(mm/min)
Axial
force
(N)
Mean of the maximum load (N)
Trial 1 Trial 2 Trial 3
S1 3 1500 30 800 516.9 292.1 278.8
S2 3 2000 50 950 566.8 870.0 816.3
S3 3 2500 70 1100 836.9 873.8 892.8
S4 4 1500 50 1100 555.3 492.8 234.8
S5 4 2000 70 800 881.8 862.6 857.1
S6 4 2500 30 950 834.1 798.7 816.2
S7 5 1500 70 950 872.7 868.1 860.0
S8 5 2000 30 1100 709.1 783.1 793.4
S9 5 2500 50 800 891.3 896.6 832.7
Table 9 – Ultimate tensile strength (UTS) results.
Test
number
Tool
diameter
(mm)
Rotational
speed
(rpm)
Transverse
speed
(mm/min)
Axial
force
(N)
Mean of the UTS (MPa)
Trial 1 Trial 2 Trial 3
S1 3 1500 30 800 13.3 7.5 7.2
S2 3 2000 50 950 14.5 22.3 21.0
S3 3 2500 70 1100 21.5 22.4 22.9
S4 4 1500 50 1100 14.2 12.6 6.1
S5 4 2000 70 800 22.6 22.2 22.0
S6 4 2500 30 950 21.4 20.5 20.9
S7 5 1500 70 950 22.4 22.3 22.1
S8 5 2000 30 1100 18.2 20.1 20.3
S9 5 2500 50 800 22.9 23.0 21.4
Table 10 shows the joint efficiency, which is a dimensionless numerical quantity to
classify the quality of the weld. It is obtained by dividing the tensile strength of each weld by
the tensile strength of the base material.
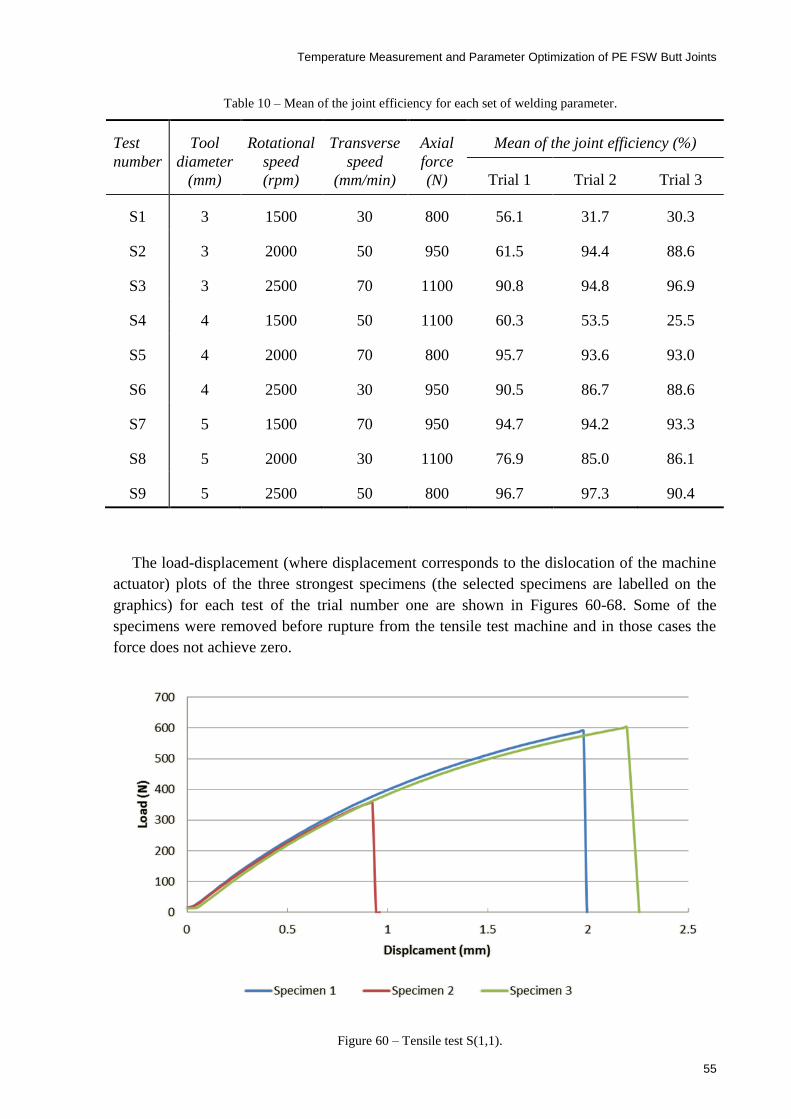
Temperature Measurement and Parameter Optimization of PE FSW Butt Joints
55
Table 10 – Mean of the joint efficiency for each set of welding parameter.
Test
number
Tool
diameter
(mm)
Rotational
speed
(rpm)
Transverse
speed
(mm/min)
Axial
force
(N)
Mean of the joint efficiency (%)
Trial 1 Trial 2 Trial 3
S1 3 1500 30 800 56.1 31.7 30.3
S2 3 2000 50 950 61.5 94.4 88.6
S3 3 2500 70 1100 90.8 94.8 96.9
S4 4 1500 50 1100 60.3 53.5 25.5
S5 4 2000 70 800 95.7 93.6 93.0
S6 4 2500 30 950 90.5 86.7 88.6
S7 5 1500 70 950 94.7 94.2 93.3
S8 5 2000 30 1100 76.9 85.0 86.1
S9 5 2500 50 800 96.7 97.3 90.4
The load-displacement (where displacement corresponds to the dislocation of the machine
actuator) plots of the three strongest specimens (the selected specimens are labelled on the
graphics) for each test of the trial number one are shown in Figures 60-68. Some of the
specimens were removed before rupture from the tensile test machine and in those cases the
force does not achieve zero.
Figure 60 – Tensile test S(1,1).
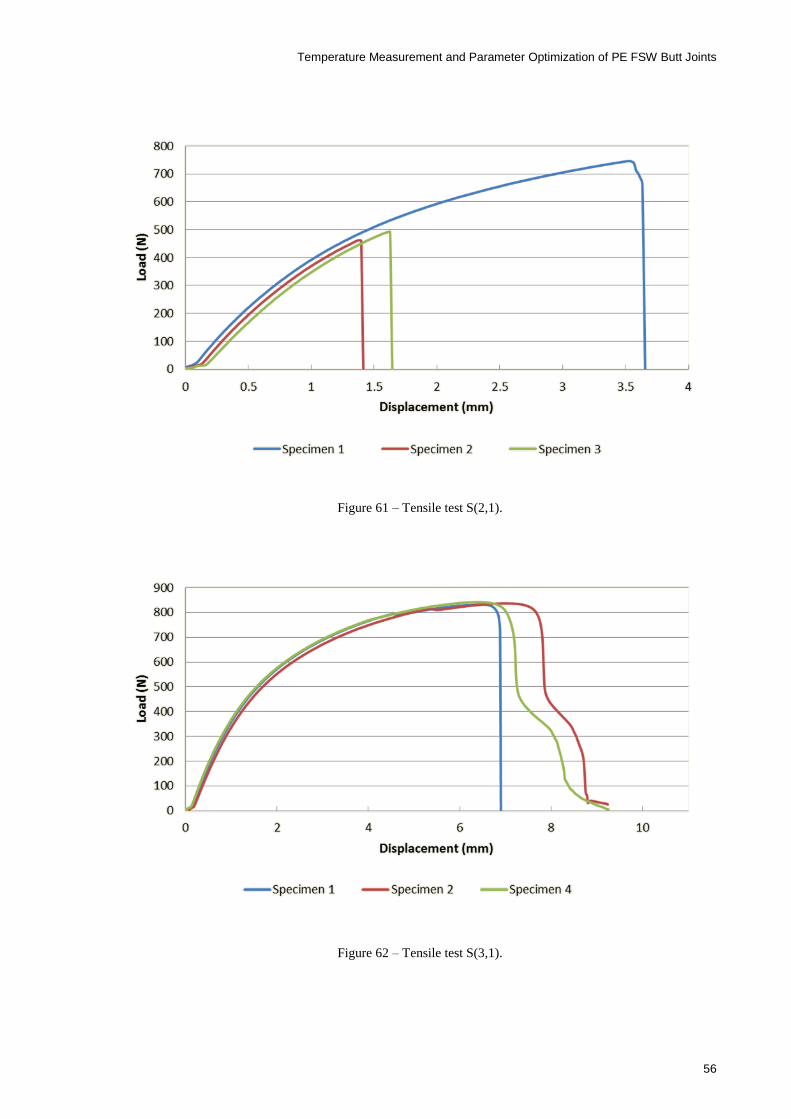
Temperature Measurement and Parameter Optimization of PE FSW Butt Joints
56
Figure 62 – Tensile test S(3,1).
Figure 61 – Tensile test S(2,1).

Temperature Measurement and Parameter Optimization of PE FSW Butt Joints
57
Figure 64 – Tensile test S(5,1).
Figure 63 – Tensile Test S(4,1).

Temperature Measurement and Parameter Optimization of PE FSW Butt Joints
58
Figure 65 – Tensile test S(6,1).
Figure 66 – Tensile test S(7,1).

Temperature Measurement and Parameter Optimization of PE FSW Butt Joints
59
Figure 67 – Tensile test S(8,1).
Figure 68 – Tensile test S(9,1).

Temperature Measurement and Parameter Optimization of PE FSW Butt Joints
60
5.2 Measured temperature
This section provides the measured temperatures of the third repetition of the Taguchi
table, using four thermocouples (T1 to T4) for each weld. The thermocouples position at the
bottom of the weld is illustrated in Figure 55 in section 4.2. Some of the thermocouple
readings did not work properly and their values in the Table 11 are marked with "–". On the
acquired temperature data, it is possible to notice that in some welds, a peek of temperature
recorded with 2 or 3 times bigger than normal temperature. This behaviour can correspond to
the temperature of the welding tool, measured in the instant that the tool passes above the
thermocouple. The temperature of the tool can be much higher than the temperature of the
weld nugget, due to the friction between the tool and the copper sleeve. For this study, the
temperature which serves as the reference for welding is the one measured at the bottom of
the weld, as shown in Figure 55.
In some welds, where temperatures reached above 250 ºC, it was not possible to precisely
distinguish whether the measured temperature is relative to the welding tool or the
temperature at bottom of the weld nugget. In some cases, the failure of some thermocouples,
due to the passing of the tool, made it difficult to analyse the temperature data acquired,
introducing noise on the acquired measurements. The thermocouple failure occurred mainly
on the samples with the highest axial force, where the tool consequently has more penetration
and travels closer to the thermocouples.
Table 11 – Temperature readings during the third welding trial.
Test
number
Tool
diameter
(mm)
Rotational
speed
(rpm)
Transverse
speed
(mm/min)
Axial
force
(N)
Measured temperature (ºC)
T1 T2 T3 T4
S1 3 1500 30 800 90 90 – 160
S2 3 2000 50 950 140 – – 160
S3 3 2500 70 1100 90 – 150 160
S4 4 1500 50 1100 – 110 115 115
S5 4 2000 70 800 – 105 120 120
S6 4 2500 30 950 170 250 >250 >250
S7 5 1500 70 950 145 165 165 150
S8 5 2000 30 1100 >250 >250 >250 >250
S9 5 2500 50 800 250 – – >250

Temperature Measurement and Parameter Optimization of PE FSW Butt Joints
61
6 Experimental analysis
The analysis of variance (ANOVA) and mean analysis of the experimental results are
conducted in the first section of the presented chapter, where the influence of each parameter
is studied and the theoretical optimum parameter combination is obtained and tested.
On the second section, the influence of the FSW process parameters is further discussed
regarding not only their effect on the weld strength, but also on the temperature, surface
quality of the weld, fracture type of the specimen, limitations of the tool and limitations of
clamping system. This discussion is based on visual inspection, recorded temperature, forces
measurements and tensile strength of each set of parameters.
6.1 Taguchi’s DOE analysis
The analysis of the results obtained from Taguchi’s Design of Experiments is very
important to understand the effect of the input welding parameters (factors) into the output
results (dependent variables). The analysis of variance (ANOVA) permitted identifying the
welding parameters (tool diameter, rotational speed, transverse speed and axial force) that
have the most influence on the weld strength. The ANOVA was applied considering a level of
significance of 5% (confidence level of 95%).
Some of the most relevant information to extract from ANOVA is each input parameter
contribution on the output of the process. Therefore, after performing the ANOVA, the
percentage contribution of each parameter was calculated using the Equation (6.1) and data
from Table 12. The percentage contributions are presented in Table 13.
( ( )
)
(6.1)
where,
x is the input parameter/interaction of parameters;
Px is the contribution percentage of each factor on the weld strength;
dfx are the degrees of freedom associated to factor x.

Temperature Measurement and Parameter Optimization of PE FSW Butt Joints
62
Table 12 – Analysis of variance for weld strength.
Source Degrees of
freedom
Sum of
squares
Mean
square F-value P-value
Tool diameter
(mm) 2 147030 73515 8.52 0.002
Rotational speed
(rpm) 2 455001 227500 26.37 0.000
Transverse speed
(mm/min) 2 250563 125281 14.52 0.000
Axial force (N) 2 84606 42303 4.90 0.020
Residual error 18 155306 8628 – –
Total 26 1092506 – – –
Table 13 – Contribution percentage of the welding parameters in the output results.
Sources of variation Contribution percentage % in
weld strength
Tool diameter (mm) 11.9
Rotational speed (rpm) 40.1
Transverse speed (mm/min) 21.4
Axial force (N) 6.2
Residual error 20.4
Statistical analysis of the weld strength indicates that the most effective welding
parameters are rotational speed and transverse speed. However, all the chosen welding
parameters have statistically significant effect on the weld strength (95% confidence interval;
P-value<0.05). The F-value is obtained by dividing the mean square of each parameter by the
mean square of the residual error. For the confidence interval and degrees of freedom used, a
parameter has a statistically significant effect on the output if the F-value is greater than 3.55,
which happens in all parameters.
The residual error has a contribution of 20.4%, which is related with uncontrollable factors
such as small uncertainties in the applied axial force, small misalignments between the
interface of the two plates, effects of the thermocouples on the weld quality and the trajectory
of the tool and lateral movement of the sheets during welding.
The analysis of the mean effect (Figure 69) and S/N ratio (Figure 70), show that the
strength of the weld increases for higher rotational speeds, higher transverse speeds and

Temperature Measurement and Parameter Optimization of PE FSW Butt Joints
63
bigger tool dimensions. However, for the axial force there is an inflection on graph as it
illustrated in Figure 69, being the middle value the one that ensures a better result. Those
graphics indicate the process parameters combinations that can theoretically produce strongest
welds without considering the parameters interactions.
Figure 70 – Main effects plot for SN ratios.
Figure 69 – Main effects plot for mean.
Load (N)

Temperature Measurement and Parameter Optimization of PE FSW Butt Joints
64
The combination of parameters recommended by the Taguchi’s analysis was tested
(confirmation test), with the use of the 5 mm tool, animated with a rotational speed of 2500
rpm, with a transverse speed of 70 mm/min and compressing the plates with axial force of
950 N. The results of tensile test and temperature are demonstrated in Table 14.
Table 14 – Results of the confirmation test.
Confirmation
test
Specimen1 Specimen2 Specimen3 Specimen4 T1 ºC T2 ºC T3 ºC
862.6 N 862.3 N 859.1 N 857.6 N 150 230 >250
The optimization given by the Taguchi’s analysis did not conduct to the strongest weld
(mean joint efficiency 4% lower than the test S(9,2) that reached 97%), although this results
might have been affected by the shoulder wear and deformation as it is shown in Figure 71,
where a gap between the Teflon and the cooper sleeve is noticeable, consequence of the
numerous tests performed under high temperatures, which deformed the shoulder around the
hot sleeve. This opened space allows the base material to raise and eject from the weld bead
as well as creating not the best weld quality surface as observed at the beginning, affecting the
weld quality. This problem is further addressed in section 6.2.3. Even though, with shoulder
deformation, the obtained results were strong and the joint was able to deform plastically, in a
more compatible way with the base material.
Figure 71 – Gap between the Teflon shoulder and the cooper sleeve.
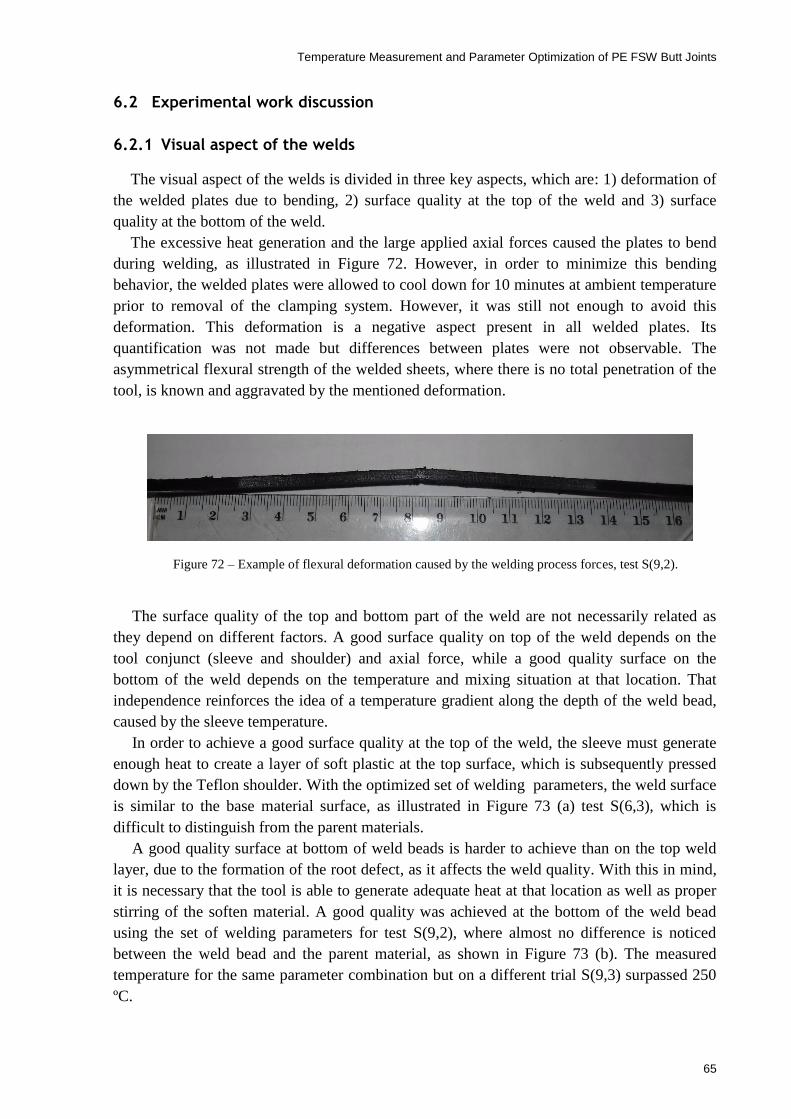
Temperature Measurement and Parameter Optimization of PE FSW Butt Joints
65
6.2 Experimental work discussion
Visual aspect of the welds 6.2.1
The visual aspect of the welds is divided in three key aspects, which are: 1) deformation of
the welded plates due to bending, 2) surface quality at the top of the weld and 3) surface
quality at the bottom of the weld.
The excessive heat generation and the large applied axial forces caused the plates to bend
during welding, as illustrated in Figure 72. However, in order to minimize this bending
behavior, the welded plates were allowed to cool down for 10 minutes at ambient temperature
prior to removal of the clamping system. However, it was still not enough to avoid this
deformation. This deformation is a negative aspect present in all welded plates. Its
quantification was not made but differences between plates were not observable. The
asymmetrical flexural strength of the welded sheets, where there is no total penetration of the
tool, is known and aggravated by the mentioned deformation.
The surface quality of the top and bottom part of the weld are not necessarily related as
they depend on different factors. A good surface quality on top of the weld depends on the
tool conjunct (sleeve and shoulder) and axial force, while a good quality surface on the
bottom of the weld depends on the temperature and mixing situation at that location. That
independence reinforces the idea of a temperature gradient along the depth of the weld bead,
caused by the sleeve temperature.
In order to achieve a good surface quality at the top of the weld, the sleeve must generate
enough heat to create a layer of soft plastic at the top surface, which is subsequently pressed
down by the Teflon shoulder. With the optimized set of welding parameters, the weld surface
is similar to the base material surface, as illustrated in Figure 73 (a) test S(6,3), which is
difficult to distinguish from the parent materials.
A good quality surface at bottom of weld beads is harder to achieve than on the top weld
layer, due to the formation of the root defect, as it affects the weld quality. With this in mind,
it is necessary that the tool is able to generate adequate heat at that location as well as proper
stirring of the soften material. A good quality was achieved at the bottom of the weld bead
using the set of welding parameters for test S(9,2), where almost no difference is noticed
between the weld bead and the parent material, as shown in Figure 73 (b). The measured
temperature for the same parameter combination but on a different trial S(9,3) surpassed 250
ºC.
Figure 72 – Example of flexural deformation caused by the welding process forces, test S(9,2).

Temperature Measurement and Parameter Optimization of PE FSW Butt Joints
66
Types of fracture 6.2.2
Although the joint efficiency was high for some set of parameters (over 95% of the base
material tensile strength), the welded zone could not be compared to the base material
capacity to deform plastically. In fact, there is a massive reduction of this capacity for most of
the tests, which is a major drawback, certainly indicates that further studies focused on the
fatigue life and impact resistance of the joints are needed.
Three types of fracture were observed and characterized as brittle, semi-brittle and ductile.
On the first case, there is a sudden break of the specimen when the maximum load is achieved
and no plasticity is observed on the fracture zone (Figure 74). This type of fracture is
independent on the joint strength. As an example, the specimen with higher load tested S(3,3)
exhibited this behavior, as illustrated in Figure 75, where it is compared to the base material.
Figure 73 – Examples of good surface on top of the weld (a) and bottom (b).
Figure 74 – Brittle fracture zone specimen 4 test S(3,3).

Temperature Measurement and Parameter Optimization of PE FSW Butt Joints
67
For the semi-brittle type of fracture (Figure 76), there is also a sudden break of the
specimens on the weld nugget, but a small layer (caused by the passing of the hot sleeve that
creates a film of molten plastic, named in this work as sleeve layer) of material continues to
deform plastically. This layer exhibits similar behavior to the base material characteristics.
The thickness of this “sleeve layer” varies from weld to weld, and sometimes within the weld
itself. That difference in thickness can be seen on the tensile test of the specimens, as shown
in Figure 77, where the tensile test of two specimens with this type fo fracture are presented.
It is possible to state that the specimen 4 from the test S(5,1) has a thicker layer than the
specimen 3 from the test S(6,1), since the force necessary to deform that layer was higher
(around 100N). This variance in thickness is further discussed in section 6.2.3.
Figure 76 – Semi-brittle fracture of the specimen 2 of the test S(5,1).
Figure 75 – Tensile test of the specimen 4 (brittle fracture) test S(3,3), and base material.

Temperature Measurement and Parameter Optimization of PE FSW Butt Joints
68
For the last type of fracture (ductile, Figure 78), the weld is able to deform plastically, not
as much as the base material but with good compatibility nevertheless. This type of fracture
was the least common ones and it is related to the welds where higher temperatures were
achieved at the bottom of the weld bead. The higher temperatures prevent the formation of the
root defects, which may be responsible for the abrupt failure of the majority of specimens.
The best example for this type of failure was obtained in the confirmation test with optimized
welding parameters suggested by Taguchi DOE, where temperatures surpass 250ºC at the
bottom of the weld. The tensile test of this specimen is shown in Figure 79, where the tensile
tests of the base material and the specimen with higher load (98% joint efficiency) were added
for the sake of comparison. Due to the lack of time, the fatigue life of the specimens was not
investigated, although it is expected that these specimens will have a better fatigue life and
impact resistance than the specimens with fragile fracture. In fact, all the specimens from the
confirmation test presented this behavior, in particular the specimen 3, on which it is possible
to observe deformation on the parent material adjacent to the advancing side of the weld,
which indicates a good diffusion of heat and stirring, as illustrated in Figure 80.
Fracture of the weald bead
Start of plastic deformation of
the sleeve layer
Figure 78 – Ductile fracture from the specimen 2 from the confirmation test.
Figure 77 – Tensile test of two specimens with semi-brittle fracture, and base material.

Temperature Measurement and Parameter Optimization of PE FSW Butt Joints
69
Most of the specimens in the present work failed in the retreating side of the weld, as
demonstrated in Figure 81. That can be explained due to the low thermal conductivity of
polymeric materials. And as previously proved, the advancing side of the welds are hotter
than retreating sides in FSW processes, and low thermal conductivity of polymers magnifies
this issue. This insufficient heat generation at the retreating side of the weld, which causes
improper joining between the retreating side of the weld in compared to the advancing side,
caused the specimens to fail from retreating sides [50].
Figure 80 – Deformation on the parent material in specimen 3 of the confirmation test.
Figure 79 – Tensile test of the specimen 3 (ductile) of the confirmation test and base material.

Temperature Measurement and Parameter Optimization of PE FSW Butt Joints
70
Tool limitations 6.2.3
The new developed tools used to perform all the welds of the experimental design
suffered gradual degradation from weld to weld due to the excessive amount of heat
generation by the copper sleeve, as shown in Figure 82. This degradation was further
aggravated in the tool with the bigger diameter (5mm) due to the higher temperatures
achieved, with damage on the Teflon material in its interface with the copper sleeve.
Deformation occurred at this location, which conducted to an interface Teflon-copper no
longer tight, allowing molten polyethylene escaping from the weld bead to the interior of the
shoulder, as well as affecting the surface quality of the welds. This problem not only reduced
the strength of the welds but strongly affected other parts of the process, such as the thickness
of the sleeve layer. The results of the confirmation test and even changing the impact of the
transverse speed on the overall process could be explained by degradation of the Teflon
stationary shoulder.
To fully understand what was causing this damage during the confirmation test, a
thermocouple was placed inside the copper sleeve, as illustrated in Figure 83. The
confirmation test was ideal to perform this measurement, where the optimized welding
parameters were used, to evaluate the temperature. Having the larger tool animated at the
Figure 82 – Interface Teflon-copper wear after ten FSW tests.
Figure 81 – Fracture on the retreating side.

Temperature Measurement and Parameter Optimization of PE FSW Butt Joints
71
highest rotational speed (2500 rpm), certainly led to one of the highest achieved temperatures
inside the copper sleeve during all the tests performed. The sleeve temperature is mostly
affected by tool rotation and tool dimension where larger contact area between the tool body
and copper sleeve generates more friction.
The values of temperature measured (Figure 84) during the confirmation test inside the
sleeve were situated between 350ºC-400ºC, way above the Teflon maximum working
temperature (260ºC) and above its melting temperature (327ºC). In fact, the temperature was
so high that even more degradation could be expected on the Teflon shoulder. Moreover,
differences in the thermal expansion between the two materials may be another cause of
damage on the static shoulder. In order to avoid this degradation, the Teflon should be
replaced for a material capable of withstand those temperatures.
Figure 84 – Sleeve temperature readings during confirmation test.
Figure 83 – Temperature Measurements on the copper sleeve.

Temperature Measurement and Parameter Optimization of PE FSW Butt Joints
72
The shoulder was damaged during the confirmation test, and consequently large amounts of
molten polyethylene escaped from the weld bead to the inside of the shoulder. This
volumetric loss of material has reduced the resistance of the weld, making it impossible to
reach the theoretical maximum strength predicted by the Taguchi’s analysis. The amount of
lost material that entered into the shoulder during welding of the confirmation test is shown in
Figure 85.
The amount of material flowing into the shoulder is related to several factors:
The first one is due to the generated heat at the top of the weld, which depends on tool
rotational speed, tool diameter and transverse speed).
Secondly, the material needs to be in a liquid state to enter the shoulder. Also the
viscosity of the liquidized plastic decreases for higher temperatures, which facilitates
the entry of polyethylene to the interior of the Teflon copper interface. The axial force
has also an impact on the flow of material.
Finally, the axial force has an impact on the flow of material due to pushing out the
materials at high axial forces. When the molten plastic is strongly compressed, it tends
to move towards inside of the shoulder, escaping from the stressed zone.
Transverse speed has a double effect on the volumetric loss in the weld bead. It not only
affects the volume of plastic per unit of time that enters the shoulder, but also affects the
welding time. This means that for slower transverse speeds there is more time for the soft
material to enter the shoulder, accounting for a bigger overall loss of material from the weld.
This fact reinforces the analysis of both the ANOVA and Taguchi’s analysis, that the
transverse speed has a major impact on the weld strength and higher transverse speeds are
recommended for obtaining stronger welds using the new tool concept.
The entrance of material into the shoulder makes it harder to relate the process parameters
with the thickness of the sleeve layer. In this case, the thickness of sleeve layer is dependent
not only on the heat generated but also on the amount of material that leaves the weld bead.
Figure 85 – Molten plastic that leaked the weld bead through the Teflon shoulder.

Temperature Measurement and Parameter Optimization of PE FSW Butt Joints
73
Limitations on the clamping system 6.2.4
The clamping system was appropriate for the vast majority of parameter combinations used
in this study. However, in some cases it did not prevent lateral movement of plates for some
of the welding parameters, which conducted to a low weld resistance for some of the obtained
results. Different amount of lateral displacements on the plates were observed, which in some
cases did not influence weld strength, although in some other cases affected the weld quality
greatly. That was one of the reasons why every set of welding parameters was repeated three
times, minimizing the uncontrolled factors during the process. In order to understand the
relation between lateral displacement of the plates and the process parameters used, it is
important to analyze the forces recorded during welding. In Figure 86, the measured forces
during test S(2,1) are shown: axial force (Fz), transverse force (Fx), caused by the linear
movement of the tool, and the side force (Fy) caused by the rotation of the tool.
In the first stage of the process, the tool plunges into the polyethylene sheets, and due to
the compression of the plastics by the probe followed by the shoulder, a peak in axial force is
recorded, and is the highest axial force value of the test. That force is mainly dependent on the
presented axial force but also on the tool diameter as observed during experimental tests,
which is related to the larger area of the probe inserting the plates. This behavior is shown in
Figure 87, where the test S(6,1) is presented. Even though the pre-load force applied to the
plates were the same (950N), a higher plunge force value recorded (Fz) than in S(2,1)
specimen.
Along the process elapse, the axial force decreases due to the thermal softening (heat) and
flow (rotation) of the material from below the probe during the dwell time. The start of the
linear movement can be seen in the Figure 86, with the increase of Fx force.
Figure 86 – Force measurements test S(2,1).
Welding
Plunging and dwell time

Temperature Measurement and Parameter Optimization of PE FSW Butt Joints
74
The axial force slowly decreases and tends to stabilize during welding, due to a stable heat
temperature. For tests with higher temperature inputs, the plastic tends to liquidizes faster,
which resulted in a decrease of the axial force. That can also be seen in Figure 87, where the
test S(6,1) with the same predetermined axial force, but with higher heat input conducts to
lower axial forces. Higher heat input tests also tend to have smaller values of force in X
direction, also shown in Figure 87.
In the remaining weld length the axial force increases slightly until the end of the weld.
This behavior is visible in most of the recorded force measurements and it can be related to
the back plate elastic deformation during welding, which is higher at the middle of the back
plate (highest distance from the supports).
On tests S (2,1) and S (6,1) the plates did not have any lateral movements, therefore, there
were no abrupt variations on the recorded axial force, so there are no abrupt variations in axial
force. In tests S (4,1), S (4,2) and S (4,3) the clamping system was unable to prevent lateral
movements of the plates. The open space between the two plates was responsible for the
appearance of serious defects as shown in Figure 88 that had repercussions on the resistance
of the weld.
Figure 88 – Volumetric defect on the test S(4,3)
Figure 87 – Force measurements test S(6,1).

Temperature Measurement and Parameter Optimization of PE FSW Butt Joints
75
Figure 89 exhibits the force measuring during the test S(4,1), and it is possible to identify
two zones where lateral displacement occurred. First during plunging, the opening of a space
causes a decrease on the axial force due to the material that was counter acting the vertical
movement of the tool, which moved away from that welding zone. And secondly, in the linear
movement of the tool, which moved the two plastic plates, with another consequent decrease
on the axial force.
Lateral displacement of the plates was particularly severe for the parameter combination
S(4,j), which were the tests with highest axial force and lowest rotational speed (highest force
and highest torque). High axial forces may be related to lateral movement at the interface of
the plates. Also, high rotational speed can help to prevent the lateral movement of the plates
by softening (generated heat) and removing (rotational movement) the material that is being
compressed by the flat surface of the probe.
Previously, it was observed that a greater axial force has an impact on the injection of
molten plastics into the shoulder. These two facts combined are the reasons for the worst
results in Taguchi’s analysis of highest axial force (1100 N). The optimal force given by this
statistical analysis is the middle force (950 N), the one that combines a better ratio between
the desirable higher tool penetration and avoiding the problems described above.
The major impact of the tool rotation can be observed in the sum of all these details,
besides having the highest impact in heat generation and mixing, it also has impact on the
lateral movement of the tools and influences the entrance of material into the shoulder.
Using position controlled welding method, analyzing the axial force curves made it
possible to analyze the effect of applied force even for position control welding. Predictably,
it was concluded that it is not granted that the pre-determined axial force is equal to the one
that presses the plastic during welding, which can be considered a source of error in the
Figure 89 – Force measurements in test S(4,1).

Temperature Measurement and Parameter Optimization of PE FSW Butt Joints
76
analysis of variance. The only parameter that was granted to be constant by the preset axial
force is the plunge depth. However, studying the recorded forces gave a good insight
regarding formation of the defects during welding.
Temperature readings 6.2.5
Measuring the weld bead temperature is fundamental for a better understanding of the
welding process. Despite some noise in the acquired data as explained in the previous chapter,
a correlation between the temperature and resistance of the weld can be applicable. Some
interesting temperature measurements were acquired and relations between that temperature
and other properties of the weld were observed. The majority of temperature measurements
were stable and reliable, as an example the temperature reading of the thermocouple 4 of the
test S(1,3) showed in Figure 90.
In some readings, it is possible to clearly distinguish two different temperatures measured
during welding. One of those corresponds to the base material welding temperature while the
other corresponds, to the tool temperature when it passes above the thermocouples. This
phenomenon was noticed in combination of parameters that caused a big difference between
the temperatures of the base material and welding tool. On the temperature measurements of
test S(7,3), that was easily to observe as the welding temperature of was low, due to the
welding parameters (combination of the lowest rotational speed with highest transverse
speed), while the temperature of the tool is higher due to frictional heat between the tool and
sleeve. Also, the low heat conductivity of the polymers and also the reduced heat transfer for
this configuration (high transverse speed) contributes to this difference in temperature. The
temperature readings of thermocouple 2 (Figure 91) and thermocouple 3 (Figure 92) of the
test S(7,3) illustrate that difference, where similar values of tool temperature were measured
(300ºC - 350 ºC).
Figure 90 – Temperature readings thermocouple 4 test S(1,3).
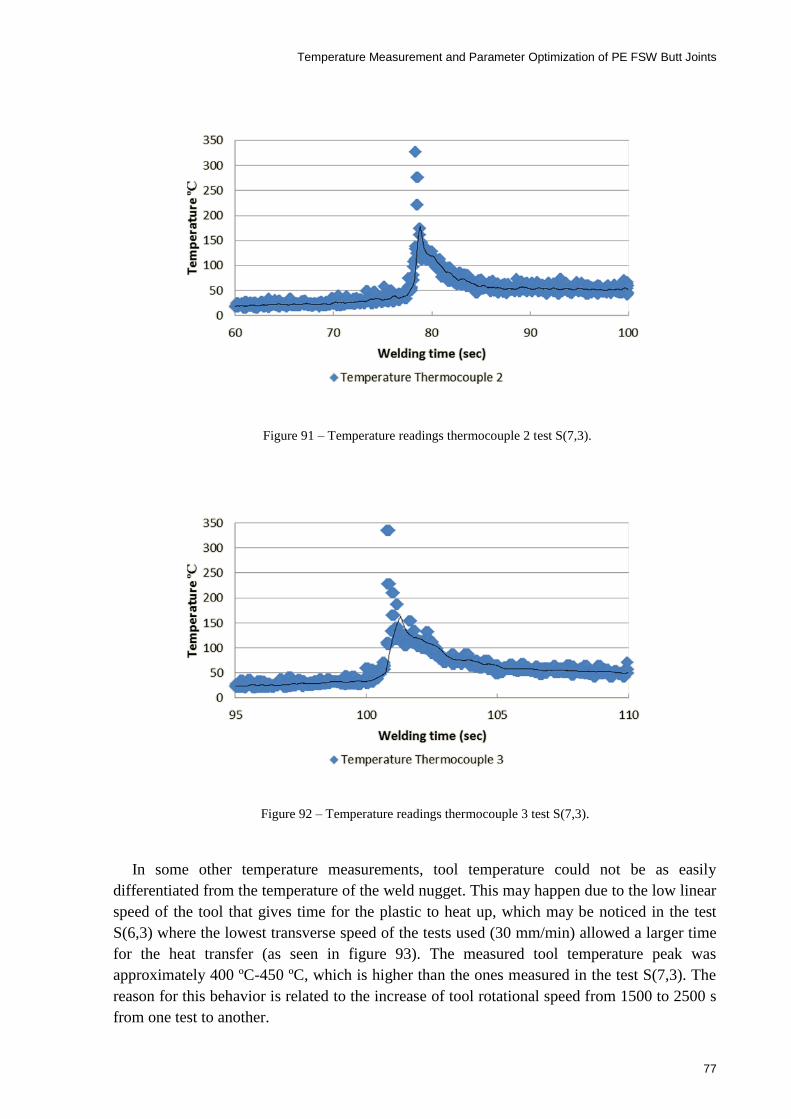
Temperature Measurement and Parameter Optimization of PE FSW Butt Joints
77
In some other temperature measurements, tool temperature could not be as easily
differentiated from the temperature of the weld nugget. This may happen due to the low linear
speed of the tool that gives time for the plastic to heat up, which may be noticed in the test
S(6,3) where the lowest transverse speed of the tests used (30 mm/min) allowed a larger time
for the heat transfer (as seen in figure 93). The measured tool temperature peak was
approximately 400 ºC-450 ºC, which is higher than the ones measured in the test S(7,3). The
reason for this behavior is related to the increase of tool rotational speed from 1500 to 2500 s
from one test to another.
Figure 91 – Temperature readings thermocouple 2 test S(7,3).
Figure 92 – Temperature readings thermocouple 3 test S(7,3).

Temperature Measurement and Parameter Optimization of PE FSW Butt Joints
78
Even though the measured temperature on the tool seemed too high, it was confirmed to be
accurate by the temperature measurements made on the copper sleeve during the confirmation
test. Also, it was possible to detect a change in the color (purplish color) of copper sleeve due
to the excessive heat generated by the sleeve, which cause the copper to oxidize, as shown in
Figure 94.
The measured temperature values for the tests conducted with the 3 mm tool were similar,
which makes sense due to the similar heat input given by the parameters of the tests
(identical value in rotations per unit length of weld bead). However, it is expected that using
bigger dwell time for this tool can heat up the sleeve and reach the desired temperature. In
some of the tests the temperature almost duplicates from the measurement in the first
Figure 94 – Oxidation coloration of the copper sleeve due to temperature.
Figure 93 – Temperature readings thermocouple 2 test S(6,3).

Temperature Measurement and Parameter Optimization of PE FSW Butt Joints
79
thermocouple to the last one, causing a significant impact on the weld appearance from the
first specimen to the last one (in terms of resistance no significant impact was recorded).
Figure 95 shows that difference in surface quality of the weld in the bottom view. The first
specimen (Figure 95a) of the test S(3,3) had the poorest weld quality than the last specimen
of the same test (Figure 95b). The values of tensile strength for 3 mm tool were more
inconsistent than the 4 and 5 mm tools, not only poor repeatability was detected, but also
different weld strength among different specimens of the same weld along the weald bead
were recorded. The small diameter of the probe makes the resistance of the weld seam more
vulnerable by other factors, such as defects in the plates interface, misalignments between the
interface of the two plates and the trajectory of the tool, and lateral movement of the sheets
during welding.
In the welds fabricated using the 4 mm diameter probe, the differences among temperature
values were much more noticeable. In test S(6,3), with combination of the highest rotational
speed (2500 rpm) with lowest transverse speed (30 mm/min), resulted the maximum
temperature measured using this tool. The minimum temperature for this tool was measured
in test S(4,3), the one where lateral movement of the plates occurred, which aggravated even
more on the weld strength and appearance (Figure 96).
Figure 95 – Comparison of the surface quality of the weld between two specimens of the same test.
Figure 96 – Visual aspect of the weakest weld tested, S(4,3).

Temperature Measurement and Parameter Optimization of PE FSW Butt Joints
80
Using 5 mm diameter tool diameter, the tool was capable of generating excessive amounts
of frictional heat, even for the combination of the lowest rotational speed with highest
transverse speed. This tool conducted to have good repeatability with consistent results. The
capability of generating heat is much higher using 5 mm probe, and consequently, higher
temperatures during the welds were achieved, being the recommended probe diameter by the
Taguchi’s statistical analysis. The ANOVA indicated that the tool parameter is the third
effective parameter on this process and it is statistically significant. That importance is due to
the fact that this tool generates more frictional heart as well as proper stirring. A larger tool
will deform and stir a larger volume of material per tool rotational movement. In this study,
with using the new tool design concept without external heating, where heat is generated by
friction between the tool and copper sleeve, the importance of this parameter has increased.
The difference in heat generation between the 3 mm and 5 mm tool is so pronounced that the
sleeve on the test S(7,1) (5 mm tool with lowest rotational speed) was capable of producing a
good surface from the beginning of the weld, whereas the sleeve in the test S(3,1) (3 mm tool
with the highest rotational speed) needed more time to heat up and produce a good surface.
The beginning of the two welds mentioned above is displayed in Figure 97.
Figure 97 – Differences in surface quality between test S(7,1) and test S(3,3).
Temperature Measurement and Parameter Optimization of PE FSW Butt Joints
81
7 Conclusions and Future Work
7.1 Conclusions
This chapter summarizes the main conclusions drawn from the experimental work
carried out and from the statistical analyzes performed on the weld strength results. The
effect of friction stir welding parameters on the weld strength was evaluated with the
support of Taguchi Design of Experiments and ANOVA methods. The force and
temperature measurements also gave a good insight regarding the effect of the welding
parameters on the heat generation. The following conclusions can be drawn:
The L9 Taguchi orthogonal design of experiments of friction stir welding was
successfully applied.
The maximum joint efficiency of over 97% was achieved compared with the base
material without external heating source.
All parameters used as input factors have statistically significance on the weld
strength.
Tool rotation has the higher percentage contribution (40%) followed by the
transverse speed (21%), tool diameter (12%) and axial force (6%).
Tool rotation is responsible for a great percentage of the heat generation and mixing
of the soft material under the axial force, making it the principal parameter of the
experimental study. Higher rotational speed is desirable to achieve better results.
The FSW tool has a significant effect on the weld strength and appearance.
Using this tool, higher strength of the welds are associated with higher transverse
speeds. Although higher transverse speeds diminish the time of the heat transfer, it
also diminishes the time for the base material to enter the shoulder.
Larger probe diameter generates more frictional heat and lead to very strong joints.
The 5 mm tool produced the strongest and more consistent welds.
The predetermined axial force served only as position system for the tool. The
softening of the material and in some cases the lateral movement of the plates
diminished the measured force.
Higher axial forces increase the tool penetration but also increase the amount of
material that enters the Teflon shoulder. The mean axial force (950 N) increased the
weld strength by offering a better ratio between tool penetration and material flash
from the weld bead.
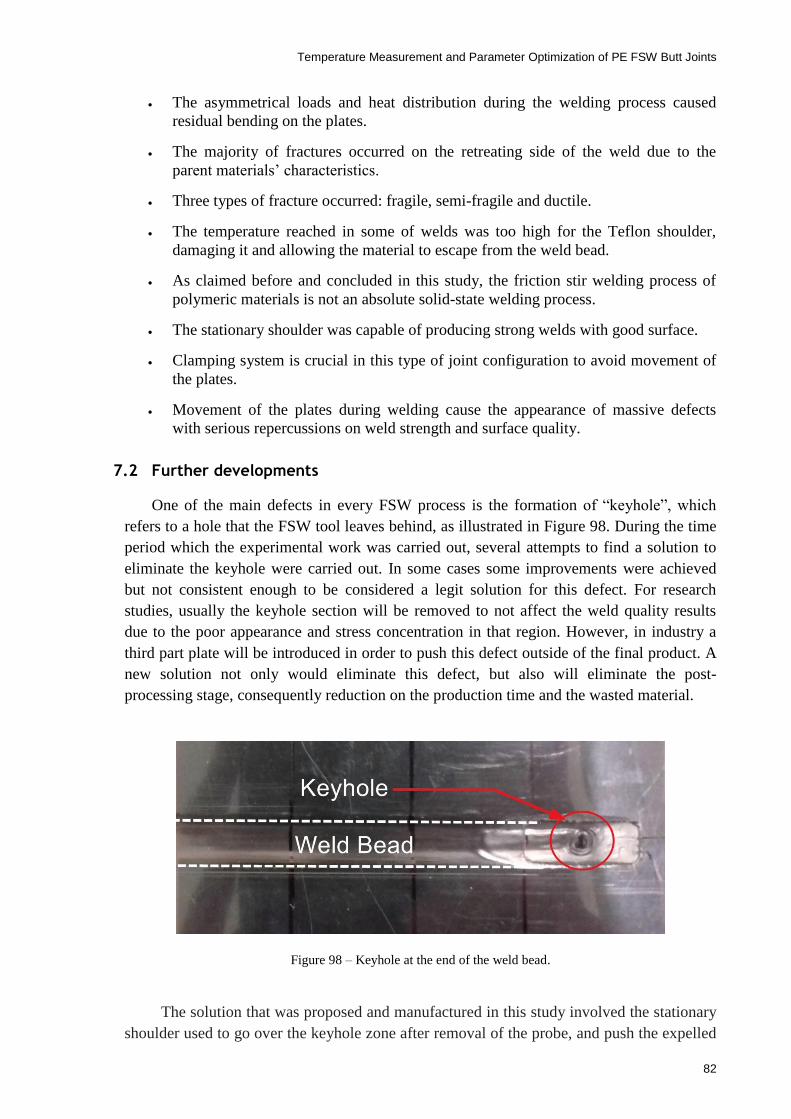
Temperature Measurement and Parameter Optimization of PE FSW Butt Joints
82
The asymmetrical loads and heat distribution during the welding process caused
residual bending on the plates.
The majority of fractures occurred on the retreating side of the weld due to the
parent materials’ characteristics.
Three types of fracture occurred: fragile, semi-fragile and ductile.
The temperature reached in some of welds was too high for the Teflon shoulder,
damaging it and allowing the material to escape from the weld bead.
As claimed before and concluded in this study, the friction stir welding process of
polymeric materials is not an absolute solid-state welding process.
The stationary shoulder was capable of producing strong welds with good surface.
Clamping system is crucial in this type of joint configuration to avoid movement of
the plates.
Movement of the plates during welding cause the appearance of massive defects
with serious repercussions on weld strength and surface quality.
7.2 Further developments
One of the main defects in every FSW process is the formation of “keyhole”, which
refers to a hole that the FSW tool leaves behind, as illustrated in Figure 98. During the time
period which the experimental work was carried out, several attempts to find a solution to
eliminate the keyhole were carried out. In some cases some improvements were achieved
but not consistent enough to be considered a legit solution for this defect. For research
studies, usually the keyhole section will be removed to not affect the weld quality results
due to the poor appearance and stress concentration in that region. However, in industry a
third part plate will be introduced in order to push this defect outside of the final product. A
new solution not only would eliminate this defect, but also will eliminate the post-
processing stage, consequently reduction on the production time and the wasted material.
Figure 98 – Keyhole at the end of the weld bead.
The solution that was proposed and manufactured in this study involved the stationary
shoulder used to go over the keyhole zone after removal of the probe, and push the expelled
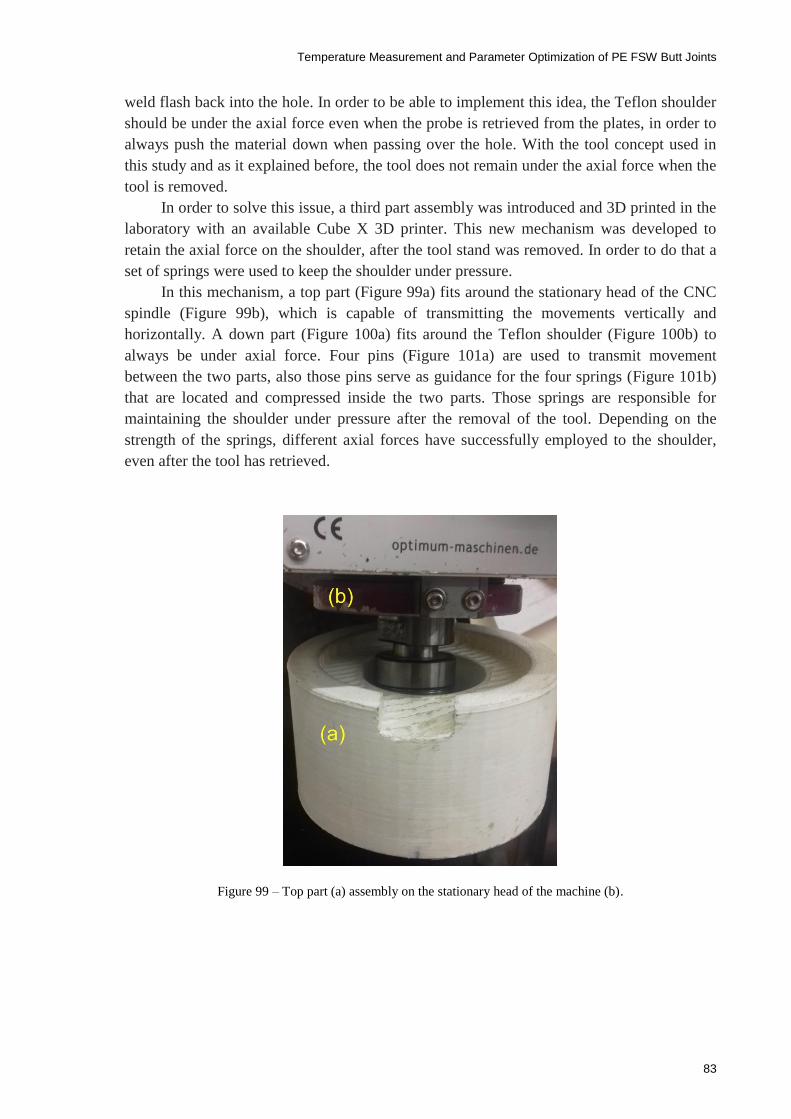
Temperature Measurement and Parameter Optimization of PE FSW Butt Joints
83
weld flash back into the hole. In order to be able to implement this idea, the Teflon shoulder
should be under the axial force even when the probe is retrieved from the plates, in order to
always push the material down when passing over the hole. With the tool concept used in
this study and as it explained before, the tool does not remain under the axial force when the
tool is removed.
In order to solve this issue, a third part assembly was introduced and 3D printed in the
laboratory with an available Cube X 3D printer. This new mechanism was developed to
retain the axial force on the shoulder, after the tool stand was removed. In order to do that a
set of springs were used to keep the shoulder under pressure.
In this mechanism, a top part (Figure 99a) fits around the stationary head of the CNC
spindle (Figure 99b), which is capable of transmitting the movements vertically and
horizontally. A down part (Figure 100a) fits around the Teflon shoulder (Figure 100b) to
always be under axial force. Four pins (Figure 101a) are used to transmit movement
between the two parts, also those pins serve as guidance for the four springs (Figure 101b)
that are located and compressed inside the two parts. Those springs are responsible for
maintaining the shoulder under pressure after the removal of the tool. Depending on the
strength of the springs, different axial forces have successfully employed to the shoulder,
even after the tool has retrieved.
Figure 99 – Top part (a) assembly on the stationary head of the machine (b).

Temperature Measurement and Parameter Optimization of PE FSW Butt Joints
84
Figure 100 – Down part (a) assembly with the stationary Teflon shoulder (b).
Figure 101 – Assembly components of the mechanism.
During the process, as the tool descents and plunges into the base materials, the
springs get compressed and stay like this during the welding process. At the end, when the
tool was lifted up just enough for the pin to no longer be inside the plastic (minimum 3 mm
as the plate’s thickness). Then the tool is moved laterally with all the components and the
shoulder passes over that keyhole zone under pressure, trying to fill the hole with the soft
materials.
Although the springs were capable of maintaining a force over 600 N on the shoulder,
the solution did not work properly all the times. The ejected material was not enough to fill
that space as some of the materials got lost due to deformation of the shoulder during
welding. Even though this method didn’t propose any systematic solution for eliminating

Temperature Measurement and Parameter Optimization of PE FSW Butt Joints
85
the keyhole defect, this tool concept worked perfectly in order to make the static shoulder
under the axial force all the time. In Figure 102 is shown the mechanism assembly in the
work position on the machine. Furthermore, further tests, designs and improvements are
needed to achieve the presented objective.
Figure 102 – Mechanism assembly in the work position.
7.3 Future work
In order to fully understand the relation between temperatures and weld resistance as
well temperature with welding parameters, more tests and studies are needed. Temperature
measurements with other type of sensors can also be interesting.
In future work it is necessary to fabricate the shoulder with another material that is able
to withstand the temperatures measured during welding. That material should have similar
properties (conductivity and good surface quality) to the Teflon but have higher melting
point. The only type of materials that fit into the demands is ceramic materials. The ceramic
shoulder certainly has a higher service temperature and no deformation will occur at the
shoulder sleeve interface, reducing the entrance of melted material to the interior of the
shoulder. That could lead to stronger welds and to improved shoulder life.

Temperature Measurement and Parameter Optimization of PE FSW Butt Joints
86
Other tool concept to develop is a tool with two shoulders. That configuration applies a
symmetrical vertical force to the plates preventing the residual bending of the welded plates.
Also this type of tool configuration does not have defects related with lack of tool
penetration.
The types of fracture indicate that the specimens may have a significantly difference in
fatigue life and impact resistance. The study of these parameters would be very interesting
to study if the welded plates, would be appropriate in applications where fatigue resistance
or impact resistance are needed.
Performing a Non-Destructive Test (NDT), such as ultrasonic or thermography camera
to the welded plates will give good information about the formation of the produced defects
during welding.

Temperature Measurement and Parameter Optimization of PE FSW Butt Joints
87
References
[1] M. J. Troughton, Ed., “Introduction A2 - by, Edited,” in Handbook of Plastics Joining (Second Edition), Boston: William Andrew Publishing, 2009, pp. xxi–xxii.
[2] M. J. Troughton, Ed., “Chapter 18 - Mechanical Fastening A2 - by, Edited,” in Handbook of Plastics Joining (Second Edition), Boston: William Andrew Publishing, 2009, pp. 175–201.
[3] J. Rotheiser, Joining of Plastics: Handbook for Designers and Engineers. Hanser Publishers, 2004.
[4] P. R. Bonenberger, “Snap-Fits and the Attachment LevelTM
Construct,” in The First Snap-fit Handbook (Second Edition), Hanser, 2005, pp. 1–13.
[5] M. J. Troughton, Ed., “Chapter 17 - Adhesive Bonding A2 - by, Edited,” in Handbook of Plastics Joining (Second Edition), Boston: William Andrew Publishing, 2009, pp. 145–173.
[6] S. Ebnesajjad, “2 - Introduction to Surface Preparation and Adhesion,” in Handbook of Adhesives and Surface Preparation, Oxford: William Andrew Publishing, 2011, pp. 15–18.
[7] B. Goss and iSmithers, Practical Guide to Adhesive Bonding of Small Engineering Plastic and Rubber Parts. ISmithers, 2010.
[8] S. Ebnesajjad, “3 - Surface Tension and Its Measurement,” in Handbook of Adhesives and Surface Preparation, Oxford: William Andrew Publishing, 2011, pp. 21–30.
[9] “Surface Treatment,” 2009. [Online]. Available: http://www.adhesives.org/docs/default-document-library/surfaceprep_adhesives-org.pdf?sfvrsn=0.
[10] “Design Guide for Bonding Metals,” 2011. [Online]. Available: http://na.henkel-adhesives.com/us/content_data/LT3771_Metal_Bonding_Guide_v5_LR404796.pdf.
[11] A. L. Buxton, “Welding technologies for polymers and composites,” 2002. [Online]. Available: http://www.twi-global.com/technical-knowledge/published-papers/welding-technologies-for-polymers-and-composites/.
[12] M. Barmouz, P. Shahi, and P. Asadi, “14 - Friction stir welding/processing of polymeric materials,” in Advances in Friction-Stir Welding and Processing, Woodhead Publishing, 2014, pp. 601–670.
[13] F. Simões and D. M. Rodrigues, “Material flow and thermo-mechanical conditions during Friction Stir Welding of polymers: Literature review, experimental results and empirical analysis,” Mater. Des., vol. 59, pp. 344–351, 2014.
[14] D. Grewell and A. Benatar, “Welding of Plastics: Fundamentals and New Developments,” Int. Polym. Process., vol. 22, no. 1, pp. 43–60, 2007.

Temperature Measurement and Parameter Optimization of PE FSW Butt Joints
88
[15] D. H. Phillips, Welding Engineering: An Introduction. Wiley, 2015.
[16] Z. Zhang, X. Wang, Y. Luo, Z. Zhang, and L. Wang, “Study on Heating Process of Ultrasonic Welding for Thermoplastics,” J. Thermoplast. Compos. Mater., vol. 23, no. 5, pp. 647–664, 2010.
[17] M. J. Troughton, Ed., “Chapter 2 - Ultrasonic Welding A2 - by, Edited,” in Handbook of Plastics Joining (Second Edition), Boston: William Andrew Publishing, 2009, pp. 15–35.
[18] P. Foss and H. B. Patham, “Thermoplastic vibration welding: Review of process phenomenology and processing–structure–property interrelationships,” Polym. Eng. Sci., vol. 51, pp. 1–22, 2011.
[19] M. J. Troughton, Ed., “Chapter 3 - Vibration Welding A2 - by, Edited,” in Handbook of Plastics Joining (Second Edition), Boston: William Andrew Publishing, 2009, pp. 37–47.
[20] M. J. Troughton, Ed., “Chapter 4 - Spin Welding A2 - by, Edited,” in Handbook of Plastics Joining (Second Edition), Boston: William Andrew Publishing, 2009, pp. 49–55.
[21] Stephan Kallee, “Development of low cost linear friction welding machines,” 2000. [Online]. Available: http://www.twi-global.com/news-events/case-studies/development-of-low-cost-linear-friction-welding-machines-020/.
[22] K. J. Colligan, D. Lohwasser, and Z. Chen, “1 - Introduction,” in Friction Stir Welding, Woodhead Publishing, 2010, pp. 15–41.
[23] R. S. Mishra and Z. Y. Ma, “Friction stir welding and processing,” Mater. Sci. Eng. R Reports, vol. 50, no. 1–2, pp. 1–78, 2005.
[24] S. Eslami, P. J. Tavares, and P. M. G. P. Moreira, “Friction stir welding tooling for polymers: review and prospects,” Int. J. Adv. Manuf. Technol., pp. 1–14, 2016.
[25] A. Magalhães, “Thermo-electric temperature measurements in friction stir welding - Towards feedback control of temperature,” University West, 2016.
[26] Z. Kiss and T. Czigány, “Applicability of friction stir welding in polymeric materials,” Period. Polytech. Mech. Eng., vol. 51, pp. 15–18, 2007.
[27] V. Infante and C. Vidal, “5 - Tool and welding design,” in Advances in Friction-Stir Welding and Processing, Woodhead Publishing, 2014, pp. 199–240.
[28] M. K. Besharati Givi and P. Asadi, “1 - General introduction,” in Advances in Friction-Stir Welding and Processing, Woodhead Publishing, 2014, pp. 1–19.
[29] P. L. Threadgill, A. J. Leonard, H. R. Shercliff, and P. J. Withers, “Friction stir welding of aluminium alloys,” 2009. [Online]. Available: http://www.twi-global.com/technical-knowledge/published-papers/friction-stir-welding-of-aluminium-alloys/.
[30] S. Eslami, T. Ramos, P. J. Tavares, and P. M. G. P. Moreira, “Shoulder design developments for FSW lap joints of dissimilar polymers,” J. Manuf. Process., vol. 20, Part 1, pp. 15–23, 2015.
[31] K. Krasnowski, C. Hamilton, and S. Dymek, “Influence of the tool shape and weld configuration on microstructure and mechanical properties of the Al 6082 alloy FSW joints,” Arch. Civ. Mech. Eng., vol. 15, no. 1, pp. 133–141, 2015.
[32] B. T. Gibson et al., “Friction stir welding: Process, automation, and control,” J. Manuf. Process., vol. 16, no. 1, pp. 56–73, 2014.
[33] “Fuji Heavy Industries To Build Wings for Eclipse 500 and License Use of Friction Stir Welding,” 2003. [Online]. Available: http://www.aero-

Temperature Measurement and Parameter Optimization of PE FSW Butt Joints
89
news.net/index.cfm?do=main.textpost&id=4340c8cf-6f8a-4e57-8ca8-c59321c59b6d.
[34] A. C. B. C. BONNINGTON, “The Tech Behind Apple’s Impossibly Thin New iMacs,” 2012. [Online]. Available: https://www.wired.com/2012/10/imac-tech/.
[35] F. Simões and D. M. Rodrigues, “Material flow and thermo-mechanical conditions during Friction Stir Welding of polymers: Literature review, experimental results and empirical analysis,” Mater. Des., vol. 59, pp. 344–351, 2014.
[36] S. Eslami, T. Ramos, P. J. Tavares, and P. M. G. P. Moreira, “Effect of Friction Stir Welding Parameters with Newly Developed Tool for Lap Joint of Dissimilar Polymers,” Procedia Eng., vol. 114, pp. 199–207, 2015.
[37] B. Vijendra and A. Sharma, “Induction heated tool assisted friction-stir welding (i-FSW): A novel hybrid process for joining of thermoplastics,” J. Manuf. Process., vol. 20, Part 1, pp. 234–244, 2015.
[38] A. ARICI and S. MERT, “Friction Stir Spot Welding of Polypropylene,” J. Reinf. Plast. Compos., vol. 27, 2008.
[39] A. Paoletti, F. Lambiase, and A. Di Ilio, “Optimization of Friction Stir Welding of Thermoplastics,” Procedia CIRP, vol. 33, pp. 562–567, 2015.
[40] P. PODRŽAJ, B. JERMAN, and D. KLOBČAR, “WELDING DEFECTS AT FRICTION STIR WELDING,” METALURGIJA, vol. 54, pp. 387–389, 2014.
[41] “ASTM D638-02a, Standard Test Method for Tensile Properties of Plastics.” ASTM International, West Conshohocken, 2012.
[42] A. Peacock, Handbook of Polyethylene: Structures: Properties, and Applications. Taylor & Francis, 2000.
[43] “Polyethylene: HDPE, HMWPE & UHMWPE,” Bay Plastics Ltd. [Online]. Available: http://www.bayplastics.co.uk/polyethylene.htm.
[44] “Ultra-high-molecular-weight polyethylene (UHMWPE),” PlasticsEurope. [Online]. Available: http://www.plasticseurope.org/what-is-plastic/types-of-plastics-11148/engineering-plastics/uhmwpe.aspx.
[45] “Technical Data Sheet Polystone D natural,” Röchling Group. [Online]. Available: https://www.roechling.com/industrial/materials/thermoplastics/detail/Polystone-D-natural-39/.
[46] Y. Bozkurt, “The optimization of friction stir welding process parameters to achieve maximum tensile strength in polyethylene sheets,” Mater. Des., vol. 35, pp. 440–445, 2012.
[47] S. Athreya and Y.D.Venkatesh, “Application Of Taguchi Method For Optimization Of Process Parameters In Improving The Surface Roughness Of Lathe Facing Operation,” Int. Ref. J. Eng. Sci., vol. 1, no. 3, pp. 13–19, 2012.
[48] “Basics and types of thermocouples.” [Online]. Available: http://www.thermocoupleinfo.com/.
[49] “Analog Devices, Monolithic Thermocouple Amplifiers with Cold Junction Compensation.” [Online]. Available: https://www.sparkfun.com/datasheets/IC/AD595.pdf.
[50] S. Eslami, M. Figueiredo, P. M. G. P. Moreira, and P. J. Tavares, “Parameter optimisation of friction stir welded dissimilar polymers joints,” Int. J. Adv. Manuf. Technol., pp. 1–12, 2017.