Embed Size (px)
Citation preview

8/8/2019 Notes on Control Systems 02
http://slidepdf.com/reader/full/notes-on-control-systems-02 1/11
Block Diagram Algebra
A complex system is represented by the interconnection of the blocks for individual elements.
Evaluation of complex system requires simplification of block diagrams by block diagram
rearrangement. Some of the important rules are given in figure below.
7. Combining Blocks in Parallel
8. Moving summing point : ≡
15

8/8/2019 Notes on Control Systems 02
http://slidepdf.com/reader/full/notes-on-control-systems-02 2/11
Example: Simplify the block diagram shown in Figure below.
16

8/8/2019 Notes on Control Systems 02
http://slidepdf.com/reader/full/notes-on-control-systems-02 3/11
Example: Obtain the transfer function C/R of the block diagram shown in Figure below.
[Ans]
Example: Derive the transfer function of the system shown below.
(a) (b)
[Answer]
Example: Derive the transfer function of the system shown below.
17

8/8/2019 Notes on Control Systems 02
http://slidepdf.com/reader/full/notes-on-control-systems-02 4/11
Example: Find the transfer function of the following system.
{Answer}
Example: Find the output of the system shown below.
For Input R 1:
……………………………………………. (1)
18

8/8/2019 Notes on Control Systems 02
http://slidepdf.com/reader/full/notes-on-control-systems-02 5/11
For input R 2:
……………………………………………. (2)
{Answer}
Signal Flow Graph
SFG is a diagram that represents a set of simultaneous linear algebraic equations which describea system. Let us consider an equation, Y aX = . It may be represented graphically as,
X a Y
where ‘a’ is called transmittance or transmission function.
Definitions in SFG
Node – A system variable, the value of which equals the sum of all incoming signals at the node.
Branch – A directed line segment joining two nodes.
Input/ Output node – node having only one outgoing/ incoming branch.
Path – A traversal of connected branches in the direction of branch arrows.
Forward path – A path from input to output node.
Loop – A closed path that originates and terminates on the same node.
Self-loop – A loop containing one branch.
Non-touching loops – Loops which do not have a common node.
Gain – Transmittance of a branch.
19

8/8/2019 Notes on Control Systems 02
http://slidepdf.com/reader/full/notes-on-control-systems-02 6/11
8/8/2019 Notes on Control Systems 02
http://slidepdf.com/reader/full/notes-on-control-systems-02 7/11
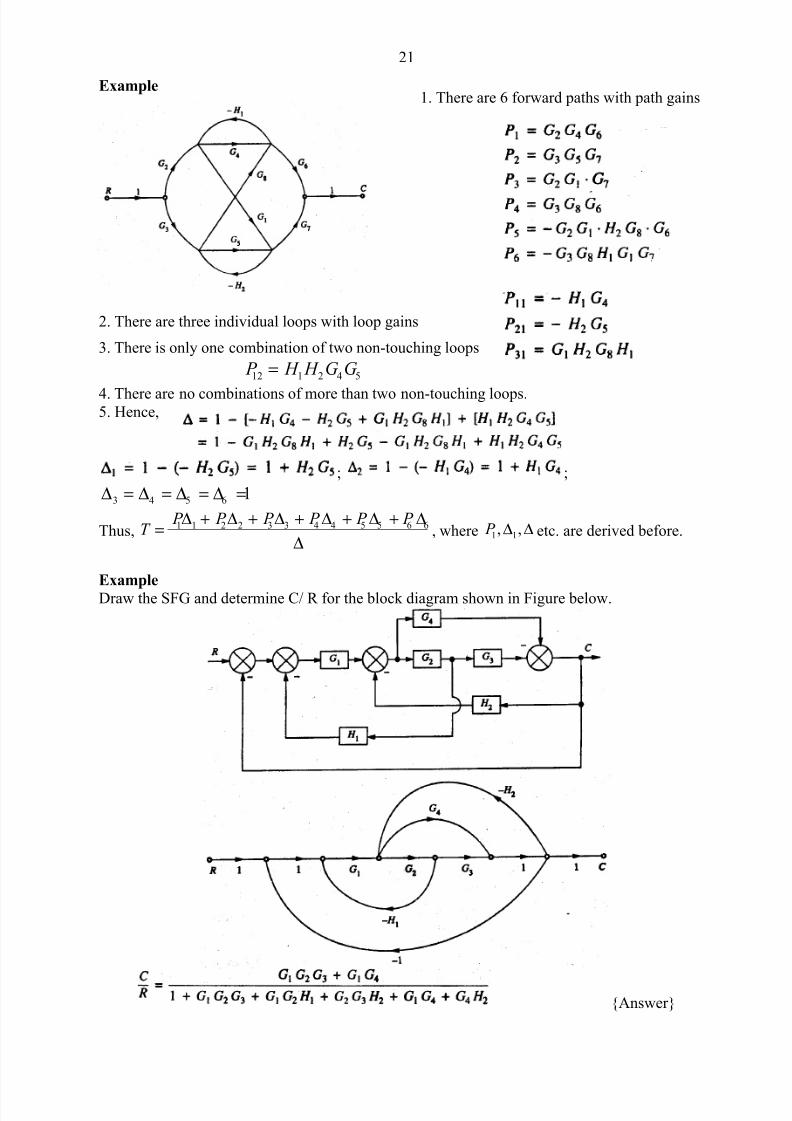
Example
2. There are three individual loops with loop gains
3. There is only one combination of two non-touching loops
12 1 2 4 5 P H H G G=
4. There are no combinations of more than two non-touching loops.5. Hence,
; ;
3 4 5 6 1∆ = ∆ = ∆ = ∆ =
Thus, 1 1 2 2 3 3 4 4 5 5 6 6 P P P P P P
T ∆ + ∆ + ∆ + ∆ + ∆ + ∆
=∆
, where 1 1, , P ∆ ∆ etc. are derived before.
Example
Draw the SFG and determine C/ R for the block diagram shown in Figure below.
{Answer}
21
1. There are 6 forward paths with path gains

8/8/2019 Notes on Control Systems 02
http://slidepdf.com/reader/full/notes-on-control-systems-02 8/11
Example
For the system represented by the following equations, find the transfer function X(s)/U(s) by
SFG technique.
1 3
1 1 1 2 2
2 2 1 1
x x u
x x x u
x x u
α
β α
β α
= +
= − + +
= − +
&
&
1 3
2
1 2
1 1
2 1
2 1
1
X X U
X X u s s
X X u s s
α
α
β β
β α
= +
= ++ +
= − +
2
1 2 3 1 2
2
1 2
[ ]( )
( )
s s s X s
U s s s
α α α β β
β β
+ + ⋅ + +=
+ +
{Answer}
Example
Using Mason’s gain formulae find C/R of the SFG shown in Figure below.
Feedback Characteristics of Control Systems
Consider the block diagram of the open-loop and the closed-loop system shown below.
22
We need to Laplace transform the given sets of equations
in order to represent differentiated variables.

8/8/2019 Notes on Control Systems 02
http://slidepdf.com/reader/full/notes-on-control-systems-02 9/11
For open-loop system, ( ) ( ) ( )C s G s R s=
For closed-loop system, ( ) ( ) ( ) ( )[ ( ) ( ) ( )]aC s G s E s G s R s H s C s= = −
Hence, we have,( )
( ) ( )1 ( ) ( )
G sC s R s
G s H s=
+and,
1( ) ( )
1 ( ) ( )a
E s R sG s H s
=+
It is seen from the above equations that in order to reduce error, the loop-gain ( ) ( )G s H s should
be made large over the range of frequencies of interest, i.e., ( ) ( ) 1G s H s ? .
1. Reduction of parameter variations by use of feedback
One of the important properties of negative feedback systems is the reduction in the sensitivity
to the variation in the parameters of the forward path. In the design of control systems, it is
important that the transfer function of the closed-loop system be relatively insensitive to smallchanges in the values of the parameters of the components in the forward path of the system.
Let µ be a parameter of G(s). Then the sensitivity of G(s) with respect to the parameter µ is
defined as,
Fractional change in ( ) /
Fractional change in /
G G s G G GS
G µ
µ
µ µ µ µ
∆ ∆= = = ⋅
∆ ∆.
Now,( ) ( )
( )( ) 1 ( ) ( )
C s G sT s
R s G s H s= =
+;
1(1 )T GT G G T GH
S S GH
T G T G
µ µ
µ µ
µ µ
∆ ∆ ∆ += ⋅ = ⋅ ⋅ = ⋅ + ⋅
∆ ∆ ∆
GH −2
(1 )GH + 1 ( ) ( )
GS
G s H s
µ =
+
Thus feedback has reduced sensitivity in the variation in µ by the factor 1
1 GH +.
Again,(1 )T H T H H T H GH
S S T H T H G
µ µ
µ µ
µ µ
∆ ∆ ∆ += ⋅ = ⋅ ⋅ = ⋅
∆ ∆ ∆
.G G−⋅
2(1 ) 1
H H GH S S
GH GH µ µ = − ⋅ ≅ −
+ +.
It is seen that, the magnitude of two sensitivities are nearly equal for the variation of parameter
in the feedback path. Thus, feedback does not reduce the sensitivity to variation in the parameter
in feedback path.
Therefore, we can conclude that, G(s) in a closed-loop system may be less rigidly specified. On
the other hand, we must be careful in accuracy of H(s) in the feedback loop.
2. Control over system dynamics by use of feedback
Let us consider the simple feedback system shown below.
The impulse response for the non-feedback system would be, 1/( ) ( ) ( )
t t c t Ke u t Ke u t τ µ −−= = .
The closed-loop transfer function of the above system is, ( )K
T s s K µ
=+ +
.
The impulse response of the closed-loop system is, 2/( )( ) ( ) (t K t c t Ke u t Ke u t τ µ −− += = .
The location of the pole and the dynamic response of the non-feedback and feedback system are
shown in Figure below.
23
The open-loop transfer function is, ( )K
G s s µ
=+
.

8/8/2019 Notes on Control Systems 02
http://slidepdf.com/reader/full/notes-on-control-systems-02 10/11
It is seen that the time-constant of open-loop system is 11/τ µ = and that of closed-loop system
is 21/ ( ) K τ µ = + . As the time-constant of closed-loop system is less, its dynamic response is
faster than the same of the open-loop system.
3. Control of the effect of disturbance signal by use of feedback
A. Disturbance in the forward path
2
1 2
( ) ( )( ) 1 ( ) ( ) ( )
d
d
C s G sT s G s G s H s
−=+
1
1( ) ( )G s H s
−≅ ; or,1
( )( )( ) ( )
d d
T sC sG s H s
−=
If 1( )G s is made very large, the effect of disturbance on the output will be very small.
B. Disturbance in the feedback path
1 2 2
1 2 1 2 1
( ) ( ) ( ) ( ) 1
( ) 1 ( ) ( ) ( ) ( ) ( )
nC s G s G s H s
N s G s G s H s H s H s
− −= ≅
+
Therefore, the effect of noise on output is,1
1( ) ( )
( )nC s N s
H s
−≅ ⋅ .
Thus, for the optimum performance of the system, the measurement sensor should be designed
such that 1( ) H s is maximum. This is equivalent to maximizing the SNR of the sensor.
4. Regenerative Feedback
The regenerative feedback is sometimes used for increasing the loop gain of the feedback
system. Figure in the following shows a feedback system where regenerative feedback occurs in
the inner loop.
24

8/8/2019 Notes on Control Systems 02
http://slidepdf.com/reader/full/notes-on-control-systems-02 11/11
The open-loop gain is,( )
( )1 ( )
o
a
G sG s
G s=
−.
The system response is obtained as,( ) ( ) /1 ( ) ( ) ( )
( )1 ( ) ( ) /1 ( ) 1 ( ) ( ) ( )
a
a a a
R s G s G s R s G sC s
G s G s G s G s G s H s
⋅ − ⋅= =
+ − − +
When, ( ) 1aG s ; ,
( )( )
( )
R sC s
H s≅ . Due to high loop gain provided by the inner regenerative
feedback loop, the closed-loop transfer function becomes insensitive to G(s).
Example
A position control system is shown below. Assume, K=10, 2α = , 1β = . Evaluate: , ,T T T
K S S S α β .
For ( ) 2cos 0.5r t t = and a 5% change in K , evaluate the steady-state response and the change in
steady-state response.
Therefore,
2
2
2
2
( ) 2
1 ( ) ( ) ( ) 2 10
( ) 2
1 ( ) ( ) ( ) 2 10
( ) ( ) 10
1 ( ) ( ) ( ) 2 10
GT K
K
GT
H
T
S s s s sS
G s H s s s K s s
S s s sS
G s H s s s s K s s
S G s H s K S
G s H s s s K s s
α α
β
β
α
α
α α
α α
α
+ += = =
+ + + + +
− + −= = ⋅ =
+ + + + + +
− ⋅ − −= = =
+ + + + +
Now, 2 2
10( )
2 10
K T s
s s K s sα β = =
+ + + +; At 0.5 s j= ,
0.102( 0.5) 1.02 jT j e−
=
Thus, ( ) 2.04 cos(0.5 0.102) ssc t t = −
Again,2
2
20.05
2 10
T T
K K
K T T K s sS S
T K T K s s
∆ ∆ ∆ += ⋅ ⇒ = ⋅ = ⋅
∆ + +
2
2 2 2 2
2 10 0.5 ( 2)( ) 0.05
2 10 2 10 ( 2 10)
s s s sT s
s s s s s s
+ +⇒ ∆ = × × =
+ + + + + +;
4.672( 0.5) 0.005 jT j e−
⇒ ∆ =
Thus, ( ) ( 0.5) 2cos 0.5 0.01cos(0.5 4.672) ssc t T j t t ∆ = ∆ × = − {Answer}
25
Here, ( )( )
K G s
s s α =
+, and ( ) H s β =
1( ) 1
( )
G
K
K dGS s s
G dK s sα
α = ⋅ = + ⋅ =
+;
2
2
G dGS G d s s
α α α
α α − −= ⋅ = =+ +
; 1 H dH S H d
β β
β = ⋅ =


![Eee IV Control Systems [10es43] Notes](https://img.dokumen.tips/doc/110x75/55cf9c1d550346d033a8a65c/eee-iv-control-systems-10es43-notes.jpg)


