Embed Size (px)
Citation preview

Virtual Institute Teaching Material onStructural Transformation and Industrial Policy
New York and Geneva, 2016

Note
The views expressed in this volume are those of the authors and do not necessarily reflect those of the United Nations.
The designations employed and the presentation of the material do not imply the expression of any opinion on the part of the United Nations concerning the legal status of any country, territory, city or area, or of its authorities, or concerning the delimitation of its frontiers or boundaries.
Material in this publication may be freely quoted or reprinted, but acknowledgement of the UNCTAD Virtual Institute is requested, together with a reference to the document number. A copy of the publication containing the quotation or reprint should be sent to the UNCTAD Virtual Institute, Division on Globalization and Development Strategies, Palais des Nations, 1211 Geneva 10, Switzerland.
This publication has been edited externally.
The UNCTAD Virtual Institute (http://vi.unctad.org) is a capacity-building and networking programme that aims to strengthen teaching and research of international trade and development issues at academic institutions in developing countries and countries with economies in transition, and to foster links between research and policymaking. For further information, please contact [email protected].
UNCTAD/GDS/2016/1
Copyright © United Nations, 2016All rights reserved
ii

Acknowledgements
The teaching material on structural transformation and industrial policy was developed by the UNCTAD Virtual Institute, under the overall guidance of Vlasta Macku. The text was researched and written by Francesca Guadagno from the Virtual Institute, with supervision by Piergiuseppe Fortunato of UNCTAD’s Division on Globalization and Development Strategies. Contributions were also provided by Milford Bateman of Saint Mary’s University (Canada), Codrina Rada of the University of Utah (United States) and Kasper Vrolijk of the School of Oriental and African Studies, University of London (United Kingdom). The material benefitted from comments by Richard Kozul-Wright, Director of UNCTAD’s Division on Globalization and Development Strategies. The text was English-edited by David Einhorn, and the design and layout were created by Hadrien Gliozzo.
The financial contribution of the Government of Finland is gratefully acknowledged.
iii
Table of contents
Note.................................................................................................................................................iiAcknowledgements........................................................................................................................iiiTable of contents............................................................................................................................ivList of figures..................................................................................................................................viList of tables..................................................................................................................................viiList of boxes..................................................................................................................................viiList of abbreviations.......................................................................................................................ixIntroduction......................................................................................................................................1Module 1: The structural transformation process: trends, theory, and empirical findings..............2
1 Introduction..............................................................................................................................22 Conceptual framework and trends of structural transformation...............................................3
2.1 Definitions and key concepts.............................................................................................42.2 Measures of structural transformation.............................................................................122.3 Global trends in structural transformation.......................................................................142.4 Structural transformation and economic growth.............................................................22
3 Review of the literature..........................................................................................................263.1 Structural transformation in development theories.........................................................263.2 Empirical literature on structural transformation............................................................393.3 Premature deindustrialization and the (possible) role of services as the new engine of economic growth...................................................................................................................52
4 Structural transformation and development...........................................................................574.1 Structural transformation, employment and poverty.......................................................584.2 Structural transformation and human development.........................................................61
5 Conclusions............................................................................................................................686 Exercises and questions for discussion...................................................................................70Annex: An illustration of how to decompose labour productivity growth and discuss empirical results.........................................................................................................................................73References..................................................................................................................................82
Module 2: Industrial policy: a theoretical and practical framework to analyse and apply industrial policy.............................................................................................................................................98
1 Introduction............................................................................................................................982 What is industrial policy?.......................................................................................................99
2.1 Defining industrial policy................................................................................................992.2 Industrial policy instruments.........................................................................................1022.3 Implementing industrial policy......................................................................................105
3 Why adopt an industrial policy?...........................................................................................1103.1 A historical perspective.................................................................................................1103.2 Arguments in favour of industrial policy......................................................................1203.3 Arguments against industrial policy..............................................................................126
4 Some cases of industrial policies..........................................................................................1294.1 The state as regulator and enabler.................................................................................1294.2 The state as financier.....................................................................................................1304.3 The state as producer and consumer..............................................................................139
iv

4.4 The state as innovator....................................................................................................1435 Current challenges to industrialization and industrial policy in developing countries.........152
5.1 Challenges from internal conditions..............................................................................1525.2 Challenges from external conditions.............................................................................157
6 Conclusions..........................................................................................................................165Exercises and questions for discussion........................................................................................166Annex: Industrial policy at the local level...................................................................................169References....................................................................................................................................174
v
List of figures
Figure 1: Relative labour productivity by sector, 1991–2010.........................................................5Figure 2: Relationship between inter-sectoral productivity gaps and average labour productivity, 2005.................................................................................................................................................6Figure 3: Share of employment and labour productivity by industry, 14 emerging economies, 2005.................................................................................................................................................8Figure 4: Industrial concentration and income per capita.............................................................10Figure 5: Sectoral shares of employment and value added – selected developed countries, 1800–2000...............................................................................................................................................15Figure 6: Sectoral shares of employment – selected developed and developing countries, 1980–2000...............................................................................................................................................17Figure 7: Sectoral shares of nominal value added – selected developed and developing countries, 1980–2000.....................................................................................................................................19Figure 8: Manufacturing shares of value added in GDP, 1962–2012 (per cent)...........................20Figure 9: Structural changes in the composition of employment in agriculture and annual growth rates of GDP per capita, 1991–2012 (per cent and percentage points).........................................23Figure 10: Structural changes in the composition of employment in industry and annual growth rates of GDP per capita, 1991–2012 (per cent and percentage points).........................................24Figure 11: Structural changes in the composition of employment in services and annual growth rates of GDP per capita, 1991–2012 (per cent and percentage points).........................................25Figure 12: Economic growth and changes in the share of manufacturing value added in GDP, 1991–2012 (per cent and percentage points).................................................................................26Figure 13: Convergence in manufacturing labour productivity, sub-Saharan Africa...................42Figure 14: Decomposition of labour productivity growth by country group, 1990–2005 (percentage points).........................................................................................................................44Figure 15: Relationship between EXPY and per capita incomes in 1992.....................................48Figure 16: The changing relationship between manufacturing employment and income.............53Figure 17: The relationship between the peak of the manufacturing employment share in the past and GDP per capita in 2005-2010.................................................................................................55Figure 18: Relationship between manufacturing employment and poverty..................................61Figure 19: Decomposition of aggregate labour productivity growth by country groups (percentage points).........................................................................................................................63Figure 20: Structural transformation and progress in poverty reduction, 1991–2012...................64Figure 21: Structural transformation and progress in primary education enrolment, 1991–2012.65Figure 22: Structural transformation and achievement of Millennium Development Goal targets, 1991–2012.....................................................................................................................................66Figure 23: Poverty and growth nexus, dynamic and lagging economies, 1991–2012 .................67Figure 24: Education and growth nexus, dynamic and lagging economies, 1991–2012 .............68Figure A1: Average annual growth rates of real value added per capita, 1991–2012 (per cent). .74Figure A2: Decomposition of aggregate labour productivity growth by country groups, 1991–2012 (percentage points and per cent)...........................................................................................77Figure A3: Decomposition of aggregate labour productivity growth in least developed countries, 1991–2012 (percentage points and per cent).................................................................................77Figure 25: A visual representation of industrial policy categories..............................................102Figure 26: Development bank lending as a share of GDP, 1960–1990 (per cent)......................134
vi
Figure 27: Development bank lending as a share of GDP, 2012 (per cent) ...............................136Figure 28: Average maturities of BNDES loans compared to maturities of major banks in Brazil, 2012 (per cent).............................................................................................................................137
List of tables
Table 1: Value-added shares of agriculture, industry, manufacturing, and services, 1950–2005 (per cent)........................................................................................................................................21Table 2: Impact of global value chains on structural transformation in developing economies.. .35Table 3: Decomposing value in global value chains: the case of German cars, 1995 and 2008 (per cent)...............................................................................................................................................50Table 4: Profit margins of main firms contributing to the production of an Ipod, 2005 (per cent).......................................................................................................................................................51Table A1: Sectoral composition of employment, 1991–2012 (per cent and percentage points)...75Table A2: Sectoral composition of output, 1991–2012 (per cent and percentage points)............76Table A3: Sectoral contributions to aggregate labour productivity growth, 1991–2011 (percentage points and per cent)....................................................................................................81Table A4: Correlation analysis of aggregate labour productivity growth and its components.....81Table 5: Industrial policies in low-income economies................................................................104Table 6: Industrial policies in middle-income economies...........................................................105Table 7: Key operational principles of industrial policy.............................................................107Table 8: A summary of the historical debate on industrial policy...............................................120Table 16.1: Differences between STI policies.............................................................................144Table 9: Implications of global value chains for industrial policies............................................159
List of boxes
Box 1: Measures of productivity and the meaning of productivity in the services sector...............8Box 2: The concept of comparative advantage..............................................................................11Box 3: Sectoral composition of employment and output..............................................................13Box 4: Types and examples of production linkages......................................................................38Box 5: Shift-share decomposition method....................................................................................45Box 6: Structural transformation and demographic and labour market changes...........................57Box A1: The Divisia index decomposition of labour productivity and employment growth 78Box 7: The World Bank report on East Asian economic growth and public policies.................113Box 8: The role of Japan’s Ministry of International Trade and Industry...................................115Box 9: Measures of state capacity...............................................................................................128Box 10: The key role of BNDES in realizing Brazil’s industrial policy objectives....................132Box 11: The role of the China Development Bank in China’s “going out” strategy..................135Box 12: The “missing middle” phenomenon...............................................................................138Box 13: Airbus as an example of the positive role of state-owned enterprises in industrial policy.....................................................................................................................................................141Box 14: The role of state-owned enterprises in local development: The case of Medellin.........142Box 15: The use of offset clauses in defence public procurement: The case of India................143Box 16: Defining science, technology, and innovation policy....................................................144
vii

Box 17: Government-supported research institutes: The experience of the Industrial Technology Research Institute in Taiwan Province of China.........................................................................146Box 18: Types of foreign direct investment................................................................................147Box 19: Transnational-corporation-dependent industrialization strategies: The cases of the Philippines, Indonesia, and Costa Rica........................................................................................150Box 20: Examples of science, technology, and innovation policies in low-income economies. 151Box 21: Trade and investment agreements: Definitions of terms...............................................163
viii

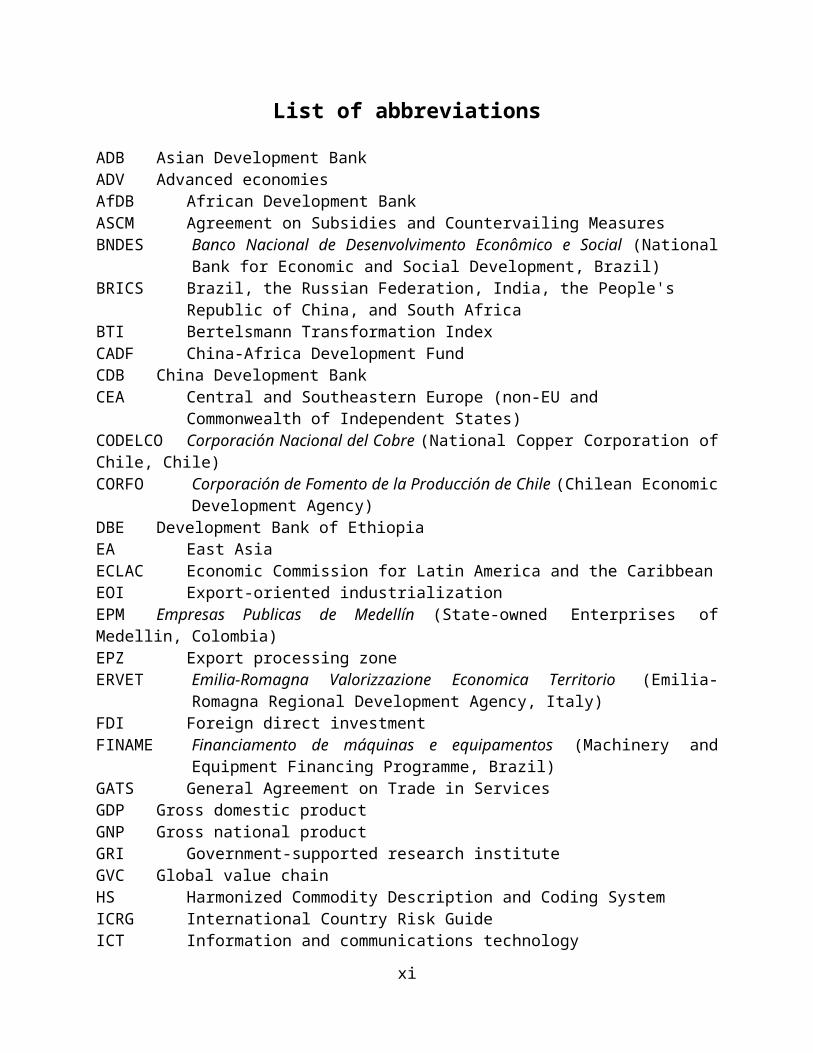
List of abbreviations
ADB Asian Development BankADV Advanced economiesAfDB African Development BankASCM Agreement on Subsidies and Countervailing MeasuresBNDES Banco Nacional de Desenvolvimento Econômico e Social (National Bank for
Economic and Social Development, Brazil)BRICS Brazil, the Russian Federation, India, the People's Republic of China, and South
AfricaBTI Bertelsmann Transformation Index CADF China-Africa Development FundCDB China Development BankCEA Central and Southeastern Europe (non-EU and Commonwealth of Independent
States)CODELCO Corporación Nacional del Cobre (National Copper Corporation of Chile, Chile)CORFO Corporación de Fomento de la Producción de Chile (Chilean Economic
Development Agency)DBE Development Bank of EthiopiaEA East AsiaECLAC Economic Commission for Latin America and the CaribbeanEOI Export-oriented industrializationEPM Empresas Publicas de Medellín (State-owned Enterprises of Medellin, Colombia)EPZ Export processing zoneERVET Emilia-Romagna Valorizzazione Economica Territorio (Emilia-Romagna
Regional Development Agency, Italy)FDI Foreign direct investmentFINAME Financiamento de máquinas e equipamentos (Machinery and Equipment
Financing Programme, Brazil)GATS General Agreement on Trade in ServicesGDP Gross domestic productGNP Gross national productGRI Government-supported research instituteGVC Global value chainHS Harmonized Commodity Description and Coding SystemICRG International Country Risk GuideICT Information and communications technologyIDC South African Industrial Development CorporationILO International Labour OrganizationISI Import-substitution industrializationISIC International Standard Industrial ClassificationITRI Industrial Technology Research Institute (Taiwan Province of China)KDB Korea Development BankKfW Kreditanstalt für Wiederaufbau (Reconstruction Loan Corporation, Germany)LAC Latin America and the CaribbeanLDCs Least developed countries
ix
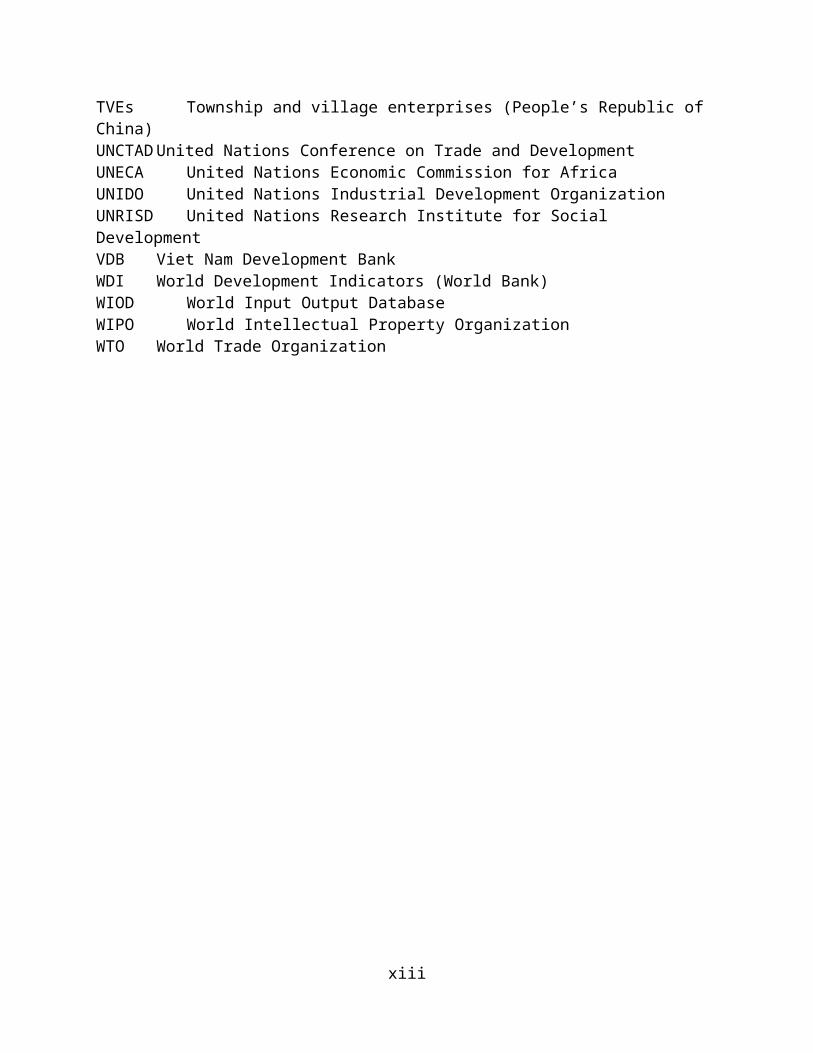
MDGs Millennium Development GoalsME Middle EastMENA Middle East and North AfricaMFB Hungarian Development BankMITI Japanese Ministry of International Trade and IndustryNA North AfricaNIEs Newly industrialized economiesODCs Other developing countriesOECD Organisation for Economic Co-operation and DevelopmentPPP Purchasing power parityR&D Research and developmentSA South AsiaSEA Southeast Asia and the PacificSEZ Special economic zoneSIDBI Small Industries Development Bank of IndiaSITRA Finnish National Fund for Research and DevelopmentSME Small and medium-sized enterpriseSOE State-owned enterpriseSSA Sub-Saharan AfricaSTI Science, technology and innovationTEKES Finnish Funding Agency for Technology and InnovationTFP Total factor productivityTiVA Trade in Value Added Database TNC Transnational corporationTRIMS Agreement on Trade-related Investment MeasuresTRIPS Agreement on Trade-related Aspects of Intellectual Property RightsTSKB Industrial Development Bank of TurkeyTVEs Township and village enterprises (People’s Republic of China)UNCTAD United Nations Conference on Trade and DevelopmentUNECA United Nations Economic Commission for AfricaUNIDO United Nations Industrial Development OrganizationUNRISD United Nations Research Institute for Social DevelopmentVDB Viet Nam Development BankWDI World Development Indicators (World Bank)WIOD World Input Output DatabaseWIPO World Intellectual Property OrganizationWTO World Trade Organization
x
Introduction
“[I]t is impossible to attain high rates of growth of per capita or per worker product without commensurate substantial shifts in the shares of various sectors” – Kutznets (1979: 130).
The shift in the share of output of various sectors, which according to Simon Kutznets lies behind economic growth, is what is known as structural transformation. Productivity enhancements in agriculture allow for the progressive release of labour and capital towards more productive industries such as manufacturing and modern services. This in turn spurs productivity and income growth. The shift of factors of production from low- to high-productivity industries is particularly beneficial for developing countries, where productivity differentials across industries run deeper.
Throughout the history of economic thought, structural transformation, especially towards manufacturing, has been regarded as the main engine of economic growth and development. This view is substantiated by massive empirical evidence. Ever since the Industrial Revolution, rapid economic growth has been associated with manufacturing growth. The industrialization of the European countries, the United States and Japan was followed by two waves of catch-up, both based on manufacturing growth: the first benefited the peripheral European economies, and the second the East Asian economies. In all these economies, the process of structural transformation has been accompanied by considerable advancements in social and human development, with decreasing fertility rates, increasing life expectancy, and reductions in poverty and inequality. Today, the People's Republic of China, Malaysia, Thailand, and Viet Nam seem to be located at different points along a similar path.
In virtually all of today’s industrial economies, structural transformation has been supported by some form of industrial policy. Market forces left alone cannot always drive the process of structural transformation and sustain economic growth; rather, they risk favouring specialization in low-productivity and low-value-added economic activities, thus calling for government intervention. The East Asian economies represent the textbook examples of the crucial role that industrial policy can play in structural transformation. Their developmental states proved to be a critical agent for structural transformation, building institutions and implementing policies capable of channeling resources towards strategic areas and imposing discipline on the private sector.
However, recent accounts also document the importance of industrial policy in other regions of the world. In the United States, for example, industrial policies generated many business opportunities by funding or carrying out the research that led to the emergence of the Internet. Similarly, many European economies used industrial policies extensively, creating completely new industries and firms, such as Airbus or Nokia. Cases of successful industrial policies can also be found in the developing world, albeit often on smaller scales (e.g. Embraer in Brazil, or the pharmaceutical and aerospace industries in India).
Today there is growing pressure to reduce unemployment and stimulate economic growth in the industrialized world and to create more and better employment in developing countries. These needs have revived interest in industrial policy, putting structural transformation at the core of
1

the policy agendas of many developing and developed economies and making it the focus of one of the United Nations’ Sustainable Development Goals (Goal 9: Transforming economies, tackling vulnerability and building resilience call for an integrated approach to industry, innovation and infrastructure).
This teaching material explores the linkages between structural transformation and economic growth and the role of industrial policy in spurring them. It is directed towards students, lecturers, and researchers of economics or social studies, as well as a generalist audience of stakeholders interested in the topic. The overall objective is to offer readers both a baseline theoretical framework and the empirical tools needed to analyse structural transformation and industrial policy.
The material is divided into two modules. Module 1 (“The structural transformation process: trends, theory, and empirical findings”) defines a conceptual framework for the analysis of structural transformation based on both its historical and recent patterns. It then examines the evolution of development thinking and summarizes the empirical literature on structural transformation. It concludes by analysing the role of structural transformation in social and human development, particularly the relationship between structural transformation and human development as reflected in the Millennium Development Goals (MDGs). Module 2 (“Industrial policy: a theoretical and practical framework to analyse and apply industrial policy”) discusses how governments can support the process of structural transformation. After introducing the definitions and concepts related to industrial policy and its design and implementation, the module discusses the role of industrial policy in structural transformation, reviewing the arguments in favour and against industrial policy. It provides country and sectoral examples of successful implementation of industrial policies, and discusses the challenges to structural transformation and industrial policy faced by developing countries today.
Module 1: The structural transformation process: trends, theory, and empirical findings
1 Introduction
The quest for economic development is among the primary objectives of nations. Improving people’s well-being and socio-economic conditions is therefore one of the crucial challenges facing policymakers and social scientists today. Every year, aid is disbursed, investments are undertaken, policies are designed, and elaborate plans are devised to achieve this goal, or at least to get closer to it. What does it take to achieve development? What distinguishes high-achieving economies from economies struggling to converge towards high-income levels?
During their economic take-off, the economies that today are considered advanced were all able to diversify away from agriculture, natural resources, and the production of traditional manufactured goods (e.g. food and beverages, garments, and textiles). Thanks to productivity enhancements in agriculture, labour and capital progressively shifted into manufacturing and services, resulting in increases in overall productivity and incomes. By contrast, countries that today are considered less advanced have failed to achieve a similar transformation of their productive structures and have remained trapped at low and middle levels of income. For
2
example, agriculture still plays a central role in sub-Saharan Africa, accounting for 63 per cent of the labour force, and thus is at the core of that region’s development challenge today. The gradual process of reallocation of labour and other productive resources across economic activities accompanies the process of modern economic growth and has been defined as structural transformation.
Sustained economic growth is therefore inextricably linked to productivity growth within sectors and to structural transformation. Economic growth, however, can only be sustainable – and therefore lead to socio-economic development – if these two mechanisms work simultaneously. Labour productivity growth in one sector frees labour, which can then move to other more productive sectors. This transformation in turn contributes to overall productivity growth. Considerable theoretical and empirical literature studies and tries to explain these phenomena.
This module aims to present the mechanics of the process of structural transformation and provide readers with the theoretical and empirical instruments to understand them. It first defines a conceptual framework for the analysis of structural transformation, based on the stylized facts that emerge from both historical and recent patterns of structural transformation. It then examines the evolution of development thinking with regard to structural transformation and offers an overview of some of its main schools of thought. The review of the theoretical literature is complemented by a review of the empirical literature on the critical components of structural transformation and on its impact on the overall process of economic growth and development. The last part of the module focuses on the role of structural transformation in social and human development. It discusses the empirical literature on the relationship between structural transformation, employment, poverty, and inequality. It also provides an original analysis on the relationship between structural transformation and human development, as reflected in the Millennium Development Goals (MDGs). The module concludes with exercises and discussion questions for students.
At the end of the module, students should be able to:
Explain how patterns of structural transformation in developing countries and regions have evolved over time;
Describe and compare main theories on the role of structural transformation in socio-economic development;
Describe main indicators of structural transformation and use different empirical methods to calculate them;
Identify main sources of labour productivity and employment growth; and Analyse the relationship between structural transformation and socio-economic
development.
2 Conceptual framework and trends of structural transformation
This section aims at developing a conceptual framework to analyse the pervasive processes of structural transformation that have accompanied modern economic growth. To this end, it defines structural transformation and discusses how it happens, what it entails, how to measure it, and what structural transformation trends countries have followed.
3
2.1 Definitions and key concepts
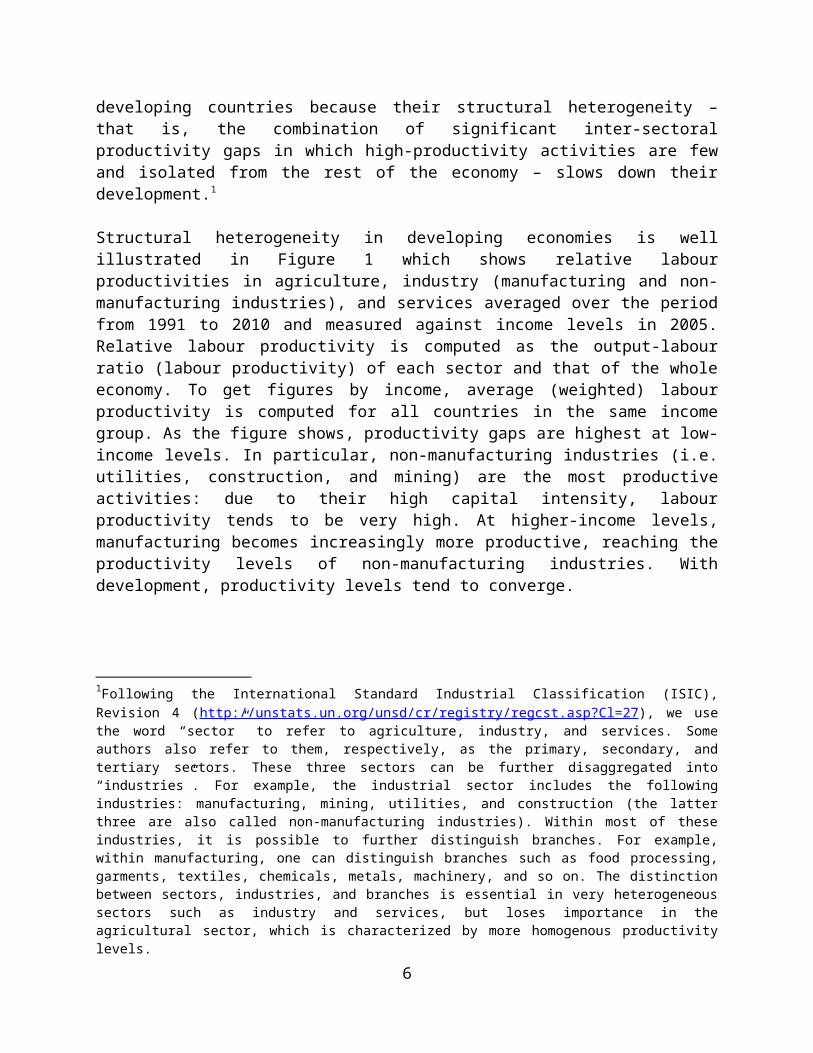
Also denoted as structural change, structural transformation refers to the movement of labour and other productive resources from low-productivity to high-productivity economic activities. Structural transformation can be particularly beneficial for developing countries because their structural heterogeneity – that is, the combination of significant inter-sectoral productivity gaps in which high-productivity activities are few and isolated from the rest of the economy – slows down their development.1
Structural heterogeneity in developing economies is well illustrated in Figure 1 which shows relative labour productivities in agriculture, industry (manufacturing and non-manufacturing industries), and services averaged over the period from 1991 to 2010 and measured against income levels in 2005. Relative labour productivity is computed as the output-labour ratio (labour productivity) of each sector and that of the whole economy. To get figures by income, average (weighted) labour productivity is computed for all countries in the same income group. As the figure shows, productivity gaps are highest at low-income levels. In particular, non-manufacturing industries (i.e. utilities, construction, and mining) are the most productive activities: due to their high capital intensity, labour productivity tends to be very high. At higher-income levels, manufacturing becomes increasingly more productive, reaching the productivity levels of non-manufacturing industries. With development, productivity levels tend to converge.
1Following the International Standard Industrial Classification (ISIC), Revision 4 (http://unstats.un.org/unsd/cr/registry/regcst.asp?Cl=27), we use the word “sector” to refer to agriculture, industry, and services. Some authors also refer to them, respectively, as the primary, secondary, and tertiary sectors. These three sectors can be further disaggregated into “industries”. For example, the industrial sector includes the following industries: manufacturing, mining, utilities, and construction (the latter three are also called non-manufacturing industries). Within most of these industries, it is possible to further distinguish branches. For example, within manufacturing, one can distinguish branches such as food processing, garments, textiles, chemicals, metals, machinery, and so on. The distinction between sectors, industries, and branches is essential in very heterogeneous sectors such as industry and services, but loses importance in the agricultural sector, which is characterized by more homogenous productivity levels.
4

Figure 1: Relative labour productivity by sector, 1991–2010
Source: UNIDO (2013: 26).Note: Pooled data for 108 countries, excluding natural-resource-rich countries. PPP: purchasing power parity.
Economic activities also differ in terms of the strength of their linkages with the rest of the economy. In developing economies, the weak linkages between high- and low-productivity activities that make up the bulk of the economy reduce the chances of structural transformation and technological change. The existence of a negative relationship between differences in inter-sectoral productivity and average labour productivity has recently been demonstrated by McMillan and Rodrik (2011). Their evidence, reported in , suggests that a decline in structural heterogeneity is usually associated with a rise in average productivity.
5

Figure 2: Relationship between inter-sectoral productivity gaps and average labour productivity, 2005
Source: McMillan and Rodrik (2011: 57). Note: The productivity gap, which is the variable on the vertical axis, is measured by the coefficient of variation of the log of labour productivity across nine activities: agriculture; mining; manufacturing; utilities; construction; wholesale and retail trade; transport and communication; finance, insurance, real estate; and business services; and community, social, personal, and government services. Labour productivity is computed as the ratio between industries’ value-added and employment levels. The coefficient of variation measures how much variability is observed in the data. It is calculated as the ratio of the standard deviation (a basic measure of the extent to which the distribution of labour productivity is spread across the nine activities mentioned above) to unweighted average labour productivity. Average labour productivity, which is the variable on the horizontal axis, is economy-wide labour productivity. Average labour productivity is calculated as the ratio of the value (in 2000 PPP US dollars) of all final goods and services produced in 2005, and economy-wide employment (the number of persons engaged in the production of aggregate output).
Structural transformation can generate both static and dynamic gains. The static gain is the rise in economy-wide labour productivity as workers are employed in more productive sectors. Dynamic gains, which follow over time, are due to skill upgrading and positive externalities that result from workers having access to better technologies and accumulating capabilities. Productive structural transformation can be defined as the structural transformation process that simultaneously generates productivity growth within sectors and shifts of labour from lower- to higher-productivity sectors, thereby creating more, better-remunerated, more formal, and higher-productivity jobs.
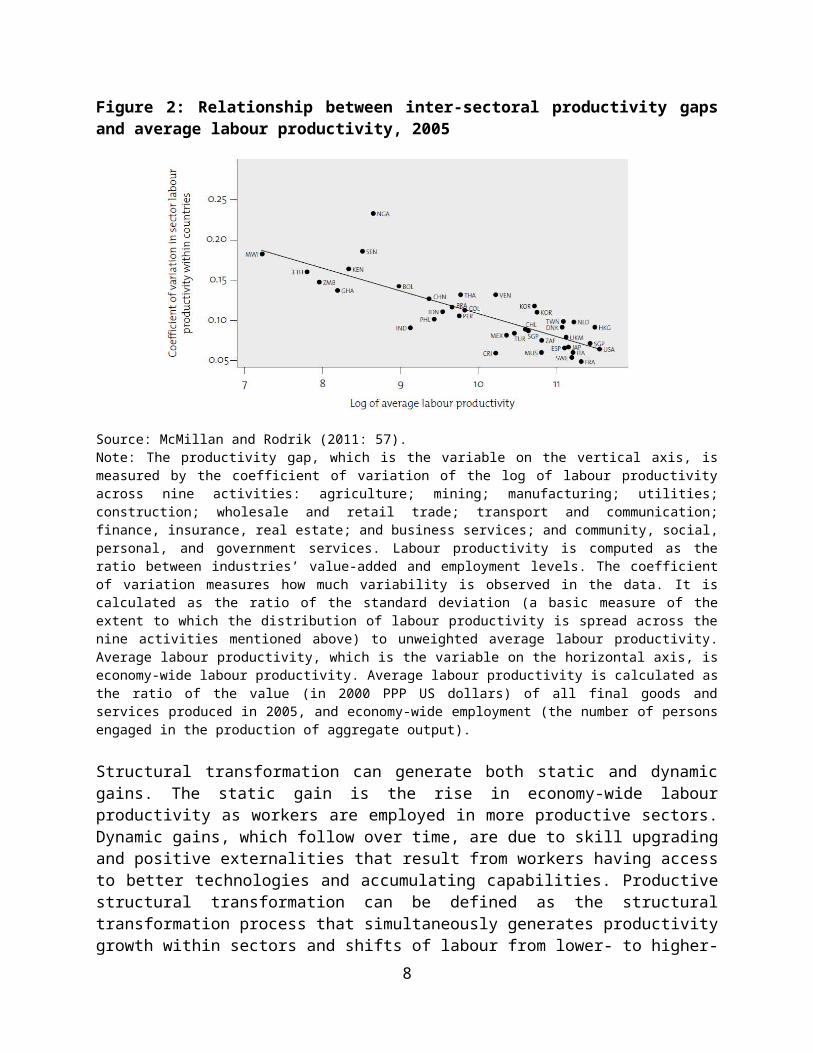
Economic activities also differ with respect to the capacity to absorb workers. Figure 3 depicts the shares of employment in agriculture, non-manufacturing industries, manufacturing, and tradable, non-tradable, and non-market services against relative labour productivity for 14 emerging economies.2 Several conclusions can be drawn from this figure. First, the industries with the highest labour productivity, namely tradable services and non-manufacturing industries,
2 The definitions of tradable, non-tradable, and non-market services follow the ISIC (Revision 3). Tradable services refer to transport, storage and communications, financial intermediation, and real estate activities. Non-tradable services include wholesale and retail trade, hotels and restaurants, and other community, social and personal services. Non-market services are public administration and defense, education, health, and social work.
6

employ the smallest shares of the workforce (see Box 1 for a discussion of productivity measures with special reference to the services sector). Tradable services are becoming very important due to their tradable element and their use of modern technologies such as information and communications technology (ICT), but they are skill-intensive. Specializing in these services might therefore generate high-quality employment (with high salaries and learning opportunities), but many developing economies lack the high-skilled labour needed for these services. Moreover, because only a tiny fraction of the workforce can be employed in tradable services, structural transformation towards tradable services might not generate enough employment opportunities for the vast majority of the population. This explains why, even if successful, the ICT service industry in India has not become a driver of economic growth for the (very large) Indian population (Ray, 2015). For their part, non-manufacturing industries enjoy rapid productivity growth, but tend to be isolated from the rest of the economy. Moreover, they can generate unsustainable economic growth patterns due to the volatile international prices of commodities and the economic, social, and political inequalities that they tend to produce.3
Non-tradable services and agriculture are the main sources of jobs in these emerging economies. Their low labour productivity, however, is reflected in low wages and limited opportunities for learning and accumulation of skills. Workers in these industries should be put in a position to move out of those jobs in order to stimulate the virtuous processes of structural change described in this module. In addition, non-tradable services are characterized by high informality rates and high job vulnerability. Hence, structural transformation towards these services might fail to generate quality employment and widespread prosperity (Szirmai et al., 2013).
In terms of productivity and employment, manufacturing is situated between tradable and non-tradable services, as it is less productive but employs more workers than tradable services and is more productive but employs fewer workers than non-tradable services. Structural transformation towards manufacturing has been referred to as industrialization.
3 In spite of this, some observers believe that structural transformation in favour of extractive and other resource-based industries can still lead to sustained economic growth and development (see Section 3.1.3.5).
7
Figure 3: Share of employment and labour productivity by industry, 14 emerging economies, 2005
Source: UNIDO (2013: 27).Note: Emerging economies included are Brazil, Bulgaria, People's Republic of China, Cyprus, India, Indonesia, Latvia, Lithuania, Malta, Mexico, Romania, Russian Federation, Taiwan Province of China, and Turkey.
Box 1: Measures of productivity and the meaning of productivity in the services sector
Broadly defined, productivity is a ratio of a measure of output to a measure of input. Researchers use the concept of productivity to measure technical efficiency, benchmark production processes, and trace technical change. There are several productivity measures among which researchers can choose, based on the objectives of their research and often on the availability of data. Productivity measures can be single factor measures, relating a measure of output to one measure of input (e.g. labour productivity) or multifactor measures, relating a measure of output to multiple measures of input (e.g. total factor productivity – TFP). Labour productivity is the most frequently used productivity statistic. It is computed as the ratio between value added and total number of hours worked. It measures how productively labour can generate output. Given how it is measured, changes in labour productivity also reflect changes in capital: if an industry is characterized by high labour productivity, this might be due to low labour intensity and high capital intensity, which corresponds to high value added with limited use of labour (e.g. mining). TFP represents the amount of output not accounted for by changes in quantity of labour and capital. Formally, it can be defined as the difference between the growth of output and the growth of inputs (the latter weighted by their factor shares).
TFP is a more comprehensive indicator of productivity than labour productivity because it accounts for a larger number of inputs. However, it is entirely based on two very specific assumptions that characterize the standard neoclassical theoretical framework: (a) a production function with constant returns to scale, and (b) perfect competition, so that each factor of production is paid its marginal product (see Section 3.1.1). Together they imply that growth can be decomposed into a part contributed by factor accumulation and a part contributed by increased productivity (TFP). The contribution of a factor to growth is its rate of growth weighted by the share of the gross domestic product (GDP) accruing to that factor. TFP is measured as the residual between the observed growth and the fraction explained by factor accumulation. Given their specificity, these assumptions have been subject to several criticisms. In the real world, in fact, firms and industries often employ different production technologies, and markets are very often not in perfect competition (for more details on the critiques of the TFP concept, see Felipe and McCombie, 2003).
As a concept, productivity was conceived for industrial production. Therefore, for a number of reasons, it
8
seems ill-suited to measure productivity in the services sector. First, as Baumol (1967) notes, services suffer from a “cost disease”: due to their nature, productivity enhancements in services are less likely than in manufacturing (see Section 3.1.2). For example, Baumol and Bowen (1966) look at the performing arts industry, noting that services such as orchestras experience little or no labour-saving technological change of the sort occurring in manufacturing, because a symphony that is meant to be performed by 30 musicians and to last half an hour will always require 15 person-hours of human labour in order to be properly performed. This consideration is also valid in other contexts, such as education or medical services, where productivity growth cannot be achieved just by having nurses or teachers doing their jobs more quickly. Second, services are characterized by intangibility (meaning that their final product is not a material) and by interactivity (meaning that services require interaction between producers and users). Therefore, identifying the output of a service is not straightforward, and even once a given output is identified, it is difficult to assess whether two services are the same because services are not as homogenous as standardized industrial goods. For all these reasons, accurately measuring productivity in services is less straightforward than in manufacturing.
Nevertheless, given the stronger role of services in economies, increasing attention is being devoted to how national accounts can adequately measure value added in services such as the growing financial sector or to the implications of having wages as part of value added, especially when they constitute most of the value added of a service (for example in the case of consultancy services).
Source: Authors.
It should also be noted that structural transformation is a continuous process. Each level of economic development is a point along the continuum from a low-income agrarian economy, where most of the output and labour are concentrated in agriculture, to a high-income economy, where the lion’s share of production and labour accrues to manufacturing and services. The structure of the economy continuously changes as technological change leads it to upgrade to more and more sophisticated goods and production methods. This involves both a progressive diversification of the production base and an upgrade of the goods produced within each industry. Different industrial structures require different institutions and infrastructure that should therefore evolve accordingly. As we will see in Module 2 of this teaching material, this is not an automatic process, and institutional discordance can be a major obstacle to structural transformation, particularly in middle-income economies (Schneider, 2015).
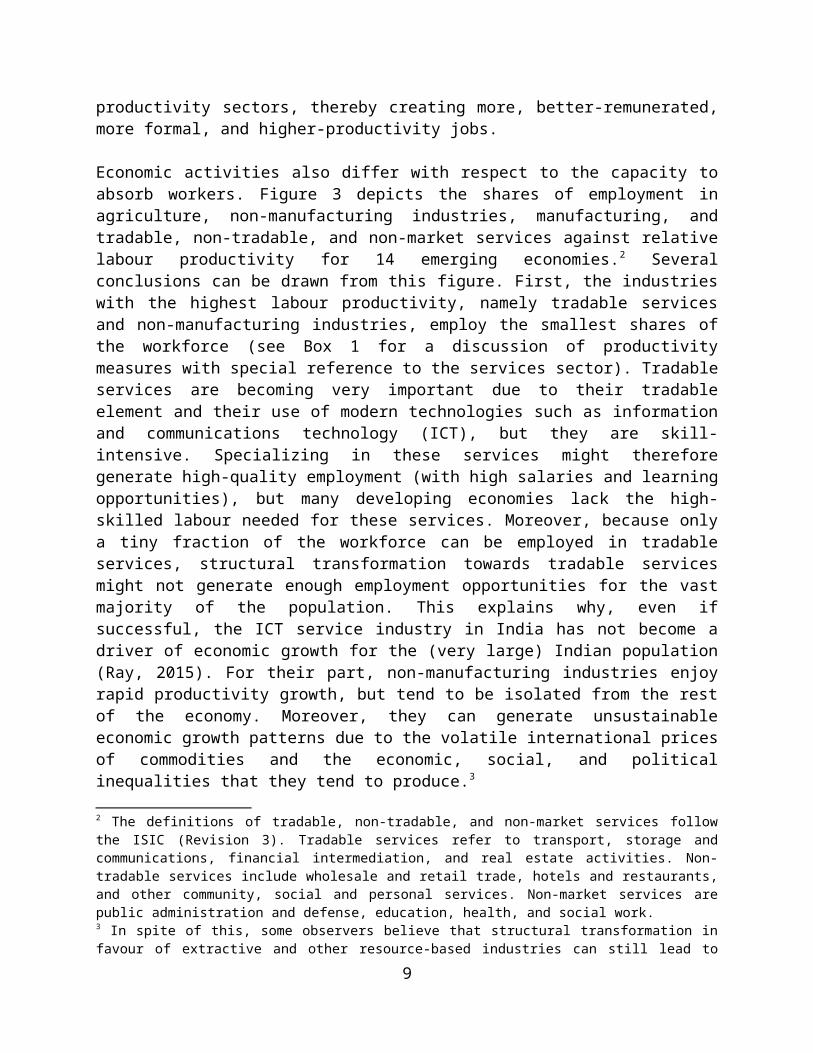
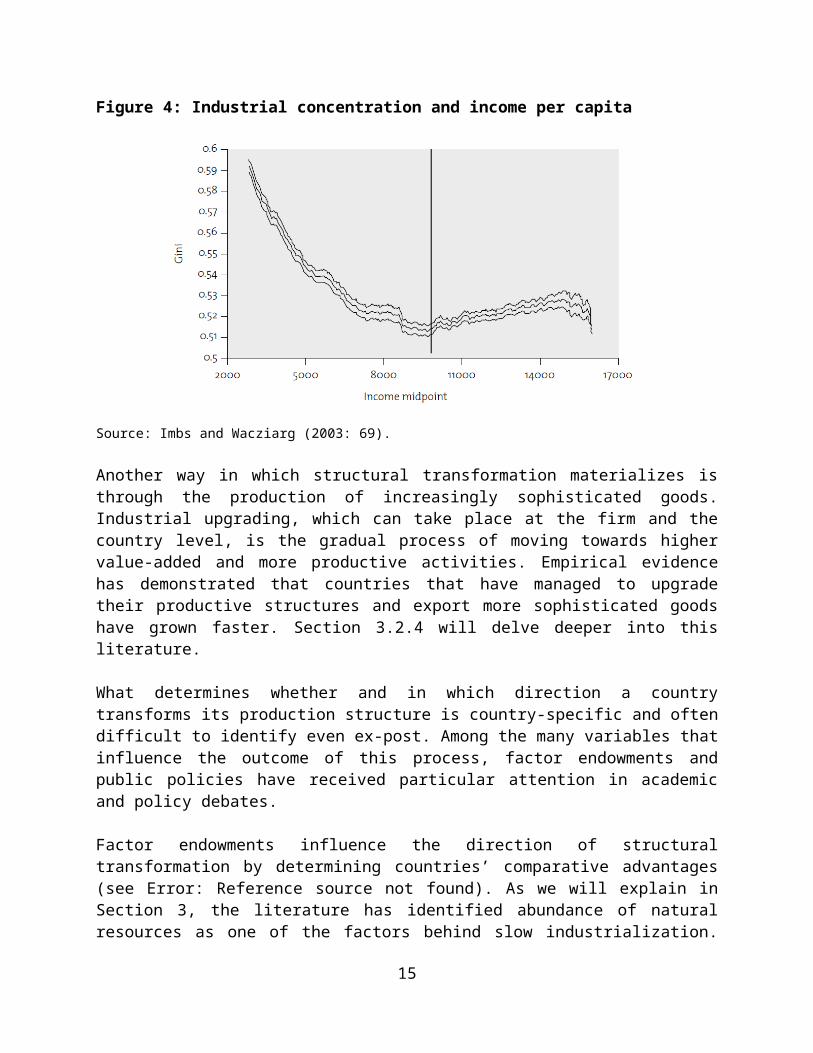
Diversification is key to economic development. This challenges the well-known principle of specialization that is the basis of trade theory. Mature industrialized economies typically produce a vast spectrum of goods and services; developing countries, on the other hand, are engaged only in a limited number of economic activities. The critical importance of diversification, or horizontal evolution of production, has been recently underscored by the seminal findings of Imbs and Wacziarg (2003). Examining sectoral concentration in a large cross-section of countries, they document an important empirical regularity: As poor countries get richer, sectoral production and employment become less concentrated, i.e. more diversified. Such diversification process goes on until relatively late in the process of development. Figure 4 displays the fitted curves and the 95 per cent confidence bands graphically, showing that employment concentration (measured by the Gini index) decreases as income per capita rises up to middle-income levels.
9
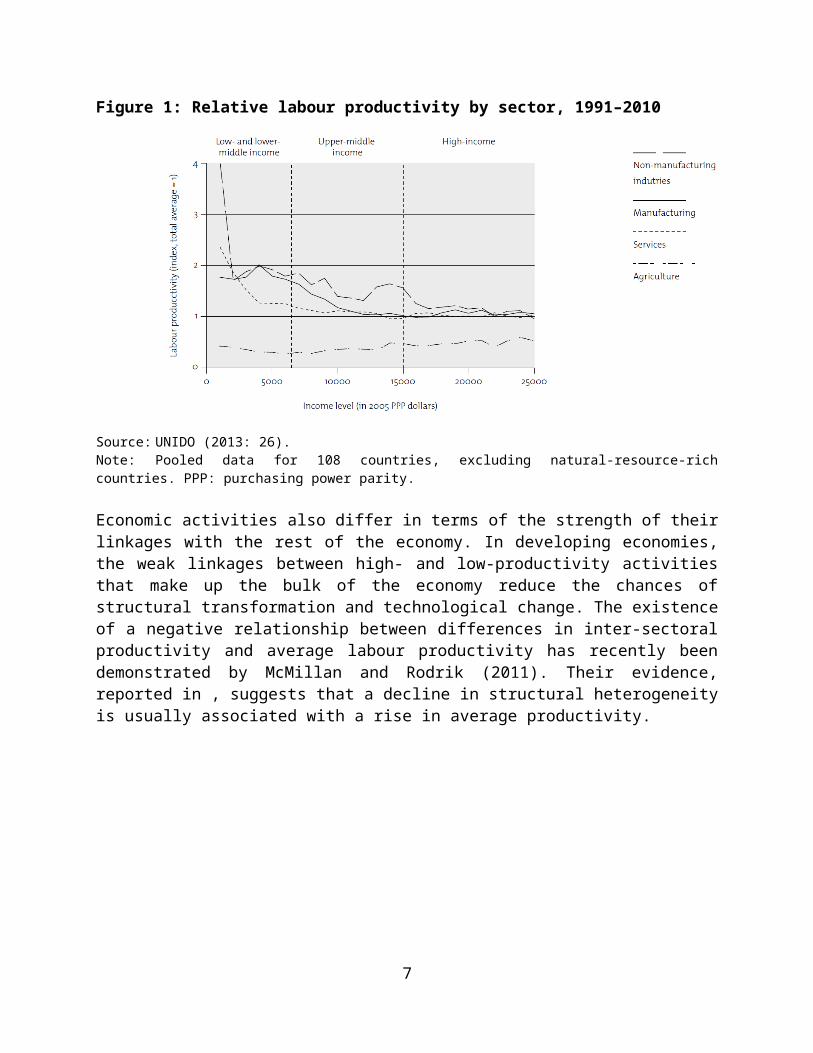
Figure 4: Industrial concentration and income per capita
Source: Imbs and Wacziarg (2003: 69).
Another way in which structural transformation materializes is through the production of increasingly sophisticated goods. Industrial upgrading, which can take place at the firm and the country level, is the gradual process of moving towards higher value-added and more productive activities. Empirical evidence has demonstrated that countries that have managed to upgrade their productive structures and export more sophisticated goods have grown faster. Section 3.2.4 will delve deeper into this literature.
What determines whether and in which direction a country transforms its production structure is country-specific and often difficult to identify even ex-post. Among the many variables that influence the outcome of this process, factor endowments and public policies have received particular attention in academic and policy debates.
Factor endowments influence the direction of structural transformation by determining countries’ comparative advantages (see Error: Reference source not found). As we will explain in Section 3, the literature has identified abundance of natural resources as one of the factors behind slow industrialization. Recent empirical evidence, however, demonstrates that after controlling for GDP per capita there is only a weak association between export sophistication and some key measures of countries’ endowments, such as human capital or institutional quality (Rodrik, 2006).4 While the evolution of a country’s productive structure does not entirely rely on its endowments, neither is it entirely random or the product of political decisions. Most of today’s developing economies are unlikely to engage in the production of highly sophisticated products
4 Institutional quality is usually measured using a variable called the “rule of law”. The most commonly used source of data on respect for the rule of law is the International Country Risk Guide (ICRG), which provides quantitative assessments by unidentified experts of the strength of the tradition of law and order in various countries. The ICRG dataset can be purchased from http://www.prsgroup.com/about-us/our-two-methodologies/icrg. Alternatively, a comprehensive dataset collecting various indicators of institutions is available at http://qog.pol.gu.se/data/datadownloads/qogbasicdata.
10
like airplanes, given their skill and capital endowments, the size and sophistication of their enterprises, and their wider institutional structures.
Structural transformation involves large-scale changes, as new and leading sectors emerge as drivers of employment creation and technological upgrading. It also involves constant improvement of tangible and intangible infrastructure that should fit the needs of the emerging industries. Such a constantly evolving scenario requires inherent coordination, with large externalities to firms’ transaction costs and returns to capital investment. In this context, the market alone cannot be expected to allocate resources efficiently. As a matter of fact, successful economies of the past have always made use of some forms of industrial policy to push the limits of their static comparative advantage and diversify into new and more sophisticated activities. This topic is the focus of Module 2 of this teaching material.
Box 2: The concept of comparative advantage
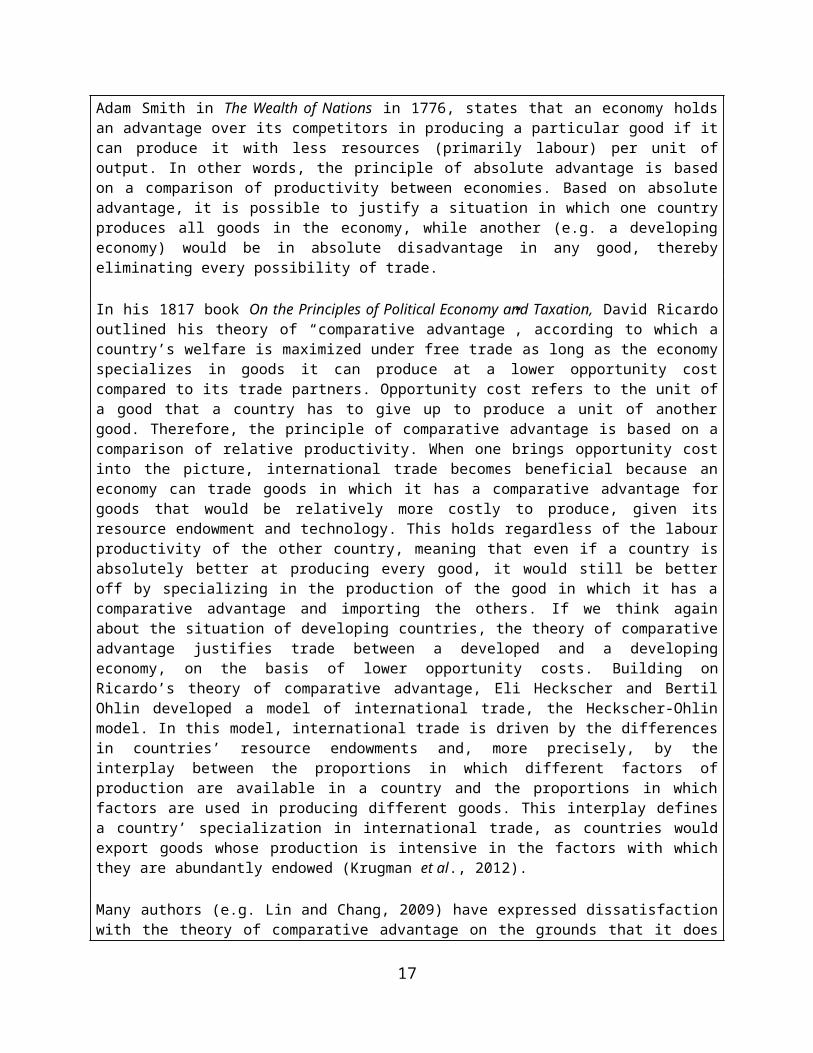
Is international trade beneficial to all economies, or only to some? Ever since Adam Smith, economists have debated this question. The point of entry in this debate has been the source of advantage on global markets. The principle of “absolute advantage”, introduced by Adam Smith in The Wealth of Nations in 1776, states that an economy holds an advantage over its competitors in producing a particular good if it can produce it with less resources (primarily labour) per unit of output. In other words, the principle of absolute advantage is based on a comparison of productivity between economies. Based on absolute advantage, it is possible to justify a situation in which one country produces all goods in the economy, while another (e.g. a developing economy) would be in absolute disadvantage in any good, thereby eliminating every possibility of trade.
In his 1817 book On the Principles of Political Economy and Taxation, David Ricardo outlined his theory of “comparative advantage”, according to which a country’s welfare is maximized under free trade as long as the economy specializes in goods it can produce at a lower opportunity cost compared to its trade partners. Opportunity cost refers to the unit of a good that a country has to give up to produce a unit of another good. Therefore, the principle of comparative advantage is based on a comparison of relative productivity. When one brings opportunity cost into the picture, international trade becomes beneficial because an economy can trade goods in which it has a comparative advantage for goods that would be relatively more costly to produce, given its resource endowment and technology. This holds regardless of the labour productivity of the other country, meaning that even if a country is absolutely better at producing every good, it would still be better off by specializing in the production of the good in which it has a comparative advantage and importing the others. If we think again about the situation of developing countries, the theory of comparative advantage justifies trade between a developed and a developing economy, on the basis of lower opportunity costs. Building on Ricardo’s theory of comparative advantage, Eli Heckscher and Bertil Ohlin developed a model of international trade, the Heckscher-Ohlin model. In this model, international trade is driven by the differences in countries’ resource endowments and, more precisely, by the interplay between the proportions in which different factors of production are available in a country and the proportions in which factors are used in producing different goods. This interplay defines a country’ specialization in international trade, as countries would export goods whose production is intensive in the factors with which they are abundantly endowed (Krugman et al., 2012).
Many authors (e.g. Lin and Chang, 2009) have expressed dissatisfaction with the theory of comparative advantage on the grounds that it does not capture important dynamics (such as those related to the process of structural transformation) that are crucial to understanding the process of development. Moreover, a number of authors have argued that a country’s comparative advantage is not static (or given), but that it
11
evolves over time, i.e. is endogenous (Amsden, 1989; Grossman and Helpman, 1991; Krugman, 1987; Redding, 1999). This has resulted in the concept of “dynamic comparative advantage”. Although there is no agreed-upon definition, dynamic comparative advantage refers to advantages that an economy can potentially achieve (and, arguably, should seek) in the long run. Dynamic comparative advantage might arise from learning by doing, adoption of technologies, or, more generally, technological change. Based on dynamic comparative advantage, if an economy produces a good for which it does not have a static comparative advantage, with time it might eventually gain a dynamic comparative advantage because domestic firms would be able to reduce production costs and become more competitive on global markets, thanks to technological change. This concept has critical policy implications. By opening to international trade, developing economies might be led to shift their resources from industries with a potential dynamic comparative advantage back to industries with a static comparative advantage (e.g. due to stronger international competition). If these economies are to produce goods in which they are not yet internationally competitive, they would need industrial policy to help the economy achieve and exploit dynamic comparative advantages (see Module 2 of this teaching material).
Somewhat related to this concept is the concept of “latent comparative advantage” introduced by Justin Lin in various publications (Lin and Monga, 2010; Lin, 2011). This refers to the comparative advantage that an economy has in a certain good, but fails to realize due to high transaction costs related to logistics, transportations, infrastructure, institutional obstacles, and, in general, difficulty in doing business. To identify latent comparative advantage, Lin and Monga (2010) propose to look at the goods produced for 20 years in growing economies with similar endowments and a per capita income that is 100 per cent higher than in the economy that is being analysed. Among these goods, one may give priority to those with existing domestic production. Government should support structural transformation by identifying and removing the constraints limiting competitiveness in these industries. If there are no firms producing these goods in the economy, a range of interventions, such as attracting foreign direct investment and cluster development, can help trigger structural transformation.
Source: Authors.
2.2 Measures of structural transformation
The two most evident (and used) measures of structural transformation are employment shares and value-added shares of sectors in total employment and total value added (where the degree of data disaggregation depends on the research question and data availability). Employment shares are calculated using the number of workers or hours worked by sector. Value-added shares are commonly expressed in current prices (“nominal shares”), but they may also be expressed in constant prices (“real shares”). Export shares by sector as percentages of GDP can also be used to measure structural transformation.5 Error: Reference source not found offers additional information on how these measures are computed. The details presented therein are of particular importance because, when doing quantitative work, one needs to be well aware of the distinctions between the different measures of structural transformation.
5 This measure might be misleading. Due to the emergence of global value chains (see Section 3.1.3.4), an increase in exports might be associated with an increase in imports, because in each stage of production firms import intermediary goods that they re-export after accomplishing their task. GDP is the sum of consumption, investment, government spending, and export minus imports, so higher imports, a consequence of global value chains and not directed towards domestic consumption, decrease the value of GDP and inflate the share of exports in GDP.
12
Box 3: Sectoral composition of employment and output
The structure of an economy consists of many components and is therefore described by many variables. To get an initial idea of the structural characteristics of a particular economy, researchers begin by examining the distribution of employment and output, or value added, across sectors. To this end, they compute the share of employment and value added for each sector of the economy. The level of disaggregation (i.e. the number of sectors included in the analysis) depends on the research question being asked as well as on the availability of data.
Assume that the researcher is interested in a level of disaggregation that divides the economy into n sectors. Total employment and output can then be calculated by summing up the number of workers in each sector. Similarly, total nominal value added is calculated by summing up the nominal value added
created in each sector. Formally we write total employment, L, and total value added, X, as: L=∑i=1
n
Li
and X=∑i=1
n
X i where Li stands for employment or number of workers in sector i, and X i stands for
nominal value added in sector i. The distribution of employment and value added by sector is obtained by dividing these expressions by total employment and output, respectively:
¿∑i=1
n Li
L=
L1
L+
L2
L+…+
Li
L=∑
i=1
n
λ i (3.1)
¿∑i=1
n X i
X=
X1
X+
X2
X+…+
X i
X=∑
i=1
n
θi (3.2)
where λ i and θi are the shares of sector i in total employment and value added. Note that the sum of the shares must add up to unity. This is what we expect, of course, since total employment, for example, is nothing else than the sum of its components.
The data needed to calculate the distribution of output and employment by sector and other structural indicators can be found at:
The United Nations National Accounts website (http://unstats.un.org/unsd/snaama/Introduction.asp) which offers access to comprehensive datasets on GDP, also disaggregated by economic activities; and
The International Labour Organization (ILO)'s Key Indicators of Labour Market website (http://www.ilo.org/global/statistics-and-databases/WCMS_424979/lang--en/index.htm) which provides access to a comprehensive database on indicators such as employment by sector of the economy, labour productivity, and employment-to-population ratio, among others. Additionally, the supporting dataset of the Global Employment Trends (http://www.ilo.org/global/research/global-reports/global-employment-trends/2014/WCMS_234879/lang--en/index.htm) also provides data on employment by sector and gender.
Source: Authors.
Employment and value-added shares also have limitations as singular measures. Employment shares may not adequately reflect changes in “true” labour input, for example because there
13

might be differences in hours worked or in human capital per worker across sectors that vary with the level of development. Value-added shares do not distinguish between changes in quantities and prices. Finally, note that the sectoral composition of employment and output, and economy-wide and sectoral labour productivity, are closely interconnected. Labour productivity in a sector with a share of employment larger than its share of total output is below the average labour productivity in the economy and vice versa.
2.3 Global trends in structural transformation
This section presents some stylized facts on structural transformation. Ideally, since structural transformation is a continuous process, we should examine changes for individual countries over long periods of time, making use of long-time data series. However, the scarcity of data restricts the set of countries that can be studied over the long term to those that are currently fully developed. This, in turn, leaves open an essential question: why should we expect economies that are currently less advanced to present the same regularities that developed economies displayed at a lower level of development a century or two ago? Limiting attention to long-time data series has the additional disadvantage that these data typically are not of the same quality as the standard datasets for recent years. In this teaching material, we will therefore document the regularities of structural transformation employing both historical data for developed economies and more recent data that cover a much larger group of countries.
2.3.1 Historical evidence for today’s advanced economies
The pattern of economic development in the current advanced economies has been characterized by a shift away from agriculture towards manufacturing and services. Both labour and capital have constantly moved from agriculture into more dynamic activities. In the process, informal self-occupation declined in favour of formal wage employment. In order to illustrate this pattern of transformation we use data on sectoral employment and value-added shares over the 19th and 20th centuries for ten developed economies constructed by Herrendorf et al. (2013). These time series are reported in Figure 5. The vertical axes represent the share of employment (left panel) and the share of value added in current prices (right panel) in agriculture, manufacturing, and services. On the horizontal axes, there is the log of GDP per capita in 1990 international dollars, as reported in Maddison (2010).6
6 In the Maddison database, international dollars are computed using the Geary–Khamis method. This is a method to convert values in international PPP values. The international dollar is a hypothetical unit of currency that has the same purchasing parity power of the US dollar in the United States in 1990.
14
Figure 5: Sectoral shares of employment and value added – selected developed countries, 1800–2000
Source: Herrendorf et al. (2013: 10).
Over the last two centuries, economic growth has been associated with declining employment and nominal value-added shares of agriculture offset by the rise of services. Employment and valued-added shares of manufacturing followed a hump shape, that is, they increased at lower levels of GDP per capita, reached a peak at medium levels of GDP per capita, and decreased thereafter. Figure 5 reveals two additional empirical regularities. First, at low income levels, the
15

employment share of agriculture remains considerably above the value-added share of the sector. This means that poor countries tend to display an employment structure biased towards agriculture despite its low productivity. Second, both employment and nominal value-added shares of the services sector remain significantly far from zero all along the development process. There is, however, an acceleration in the rate of increase of the value-added share of services at a GDP per capita of approximately $8,100. Interestingly, the value-added share for manufacturing peaks at around the same income level, suggesting that the services sector progressively replaces manufacturing as the main engine of growth at middle-income levels.
2.3.2 Recent evidence for developed and developing economies
As mentioned earlier, using historical data limits the analysis to industrialized economies. We therefore need to verify whether the structural transformation regularities described above can be extended to developing countries. Herrendorf et al. (2013) use the World Bank’s World Development Indicators (WDI) for employment by sector, and the national accounts of the United Nations Statistics Division for value added by sector. The coverage of these two datasets is large: they both include most of today’s developed and developing economies. Figure 6 plots the sectoral employment shares from the WDI against the log of income per capita. The plots confirm the regularities discussed above: first, agricultural employment shares decrease with income, while employment in services monotonically increases; and second, manufacturing shares of employment follow an inverse U-shaped pattern.7 The decline in agricultural employment has many implications for an economy, two of which are relevant to this discussion. First, as labour moves from low-productivity agriculture to higher-productivity activities, average productivity in the economy increases. Second, the higher incomes that are a by-product of this structural transformation create additional demand for both manufactured goods and services. This demand provides scope for the expansion of manufacturing and services.
Figure 6 also confirms that the employment share of manufacturing increases until it reaches a certain threshold of about 30 per cent of total employment. From there it flattens out and then begins to decrease. While this is consistent with the pattern described previously, the downward sloping part is less pronounced in Figure 6 than in Figure 5. The relatively lower peak of 30 per cent, compared to the previous 40 per cent for industrialized countries (see Figure 5), indicates a shift in recent patterns of industrialization for both developed and developing countries towards lower peaks of manufacturing employment in total employment. This observation has led some to question the role of manufacturing as a modern engine of economic growth in developing countries (see Section 3.3). Indeed, Figure 6 also shows the existence of a strong positive relationship between the share of employment in services and per capita income.
7 Rodrik (2009) also finds an inverted-U relation between the share of the manufacturing sector in overall output and employment and income per capita (see Section 3.2.1).
16

Figure 6: Sectoral shares of employment – selected developed and developing countries, 1980–2000
Source: Herrendorf et al. (2013: 18).
shows value-added shares in agriculture, manufacturing, and services against GDP per capita. It confirms the same patterns documented above and adds a few interesting insights. First, the hump shape for manufacturing emerges more clearly when value added is used as a measure of
17
structural transformation. Second, the line representing the trend of the services share becomes steeper and the share of manufacturing value added peaks at the same time, when the log of GDP per capita reaches a threshold value around 9, i.e. at a GDP per capita of approximately $8,100. Beyond this level of income per capita, the relative contribution of manufacturing to output and employment becomes smaller and services turn out to be increasingly important. This matches the historical experience of industrialized countries shown in Figure 5.
18
Figure 7: Sectoral shares of nominal value added – selected developed and developing countries, 1980–2000
Source: Herrendorf et al. (2013: 19).
2.3.3 Trends of deindustrialization and premature deindustrialization
Following what we have explained so far, we would expect countries to deindustrialize (i.e. to see their shares of manufacturing in employment and value added decrease) after they reach a certain level of income per capita. This section provides further empirical evidence on the
19
deindustrialization trends described in Section 2.3. Figure 8 shows the evolution of the share of manufacturing value added in GDP from 1962 to 2012 as the world average, the average for advanced countries, and the average for developing countries. Data show that as a whole, the world deindustrialized over these five decades. This was driven not only by the advanced nations but by developing countries that also deindustrialized, especially since the 1990s.
Figure 8: Manufacturing shares of value added in GDP, 1962–2012 (per cent)
Source: Lavopa and Szirmai (2015: 13).
presents data on value-added shares of agriculture, industry, manufacturing (which is also included in industry), and services in GDP for 29 developing economies. From there, we can take a few illustrative examples to characterize the industrialization trends in the last six decades. In 1950, Argentina, Brazil, and other Latin American economies, together with some African countries such as South Africa and Morocco, were among the most industrialized economies in the developing world. Their shares of manufacturing in GDP were higher than in economies such as the Republic of Korea. By 1980, most of these economies had further expanded their manufacturing industries, and were joined by other economies such as the United Republic of Tanzania and Zambia. By 2005, however, the situation had changed dramatically: most of these economies that had become more industrialized between 1950 and 1980 had gone back to the industrialization levels of the 1950s. In other words, these economies had deindustrialized. The services sector benefited from this process, with its share in value added growing from 45 to 67 per cent in South Africa, and from 45 to 64 per cent in Brazil. These trends do not only apply to all the 29 selected economies. At the bottom of , we report averages for Africa, Asia, Latin America, developing economies, and 16 advanced economies. These averages show that while in Asian countries shares of manufacturing in value added consistently increased over recent decades, Latin American and African countries embarked on a deindustrialization process similar to those experienced by advanced economies.8
8 For the African case, see also UNCTAD (2011a).
20

Table 1: Value-added shares of agriculture, industry, manufacturing, and services, 1950–2005 (per cent)
Source: Szirmai (2012: 409).Note: Figures are in current prices. Advanced economies include Australia, Austria, Belgium, Canada, Denmark, Finland, France, Germany, Italy, Japan, the Netherlands, Norway, Sweden, Switzerland, the United Kingdom, and the United States.
21
To conclude, while deindustrialization historically happened after countries had fully developed, today economies deindustrialize at lower income levels. Various studies (Felipe et al., 2014; Palma, 2005; Rodrik, 2016; UNCTAD, 2003a) show that in recent decades the shares of manufacturing employment and value added peaked and began to decrease at lower levels of GDP per capita than in the past. In the literature, this phenomenon has been referred to as “premature deindustrialization”, an expression originally coined by UNCTAD (2003a). Section 3.3 will delve deeper into the literature on premature deindustrialization in relation to the rise of services as a new, or additional, engine of economic growth.
2.4 Structural transformation and economic growth
As labour shifts from lower- to higher-productivity sectors, value added increases (static gains) and rapid technological change further boosts economic growth (dynamic gains). This explains why structural transformation is associated with faster economic growth. This section explores the relationship between GDP growth and changes in employment shares of agriculture, industry, and services. Figures 9–11 present scatter plots of annual growth rates of value added per capita against changes in employment in agriculture, industry, and services, respectively.
First, larger reductions in agricultural employment are associated with faster economic growth. In East, South, and Southeast Asia, reductions of agricultural employment ranging between 14 and 26 percentage points were associated with rates of output growth of around 6 per cent. By contrast, sub-Saharan and Northern African countries reduced their agricultural employment by less than five percentage points and their incomes grew at rates between 3.6 and 4.4 per cent.
Second, growing shares of industrial employment are associated with faster economic growth. Confirming the empirical evidence presented in Section 2.3.3, employment in industry increased the most in Asian countries, ranging between 8.5 and 6.3 percentage points. Economies in Latin America and Northern and sub-Saharan Africa, on the other hand, experienced little structural transformation towards industry. Advanced economies and former Soviet Union countries deindustrialized, with modest rates of GDP growth. This possibly reflects the tendency of high-income economies to deindustrialize (see Section 2.3.1) and country-specific as well as global issues, ranging from the global financial crisis to the rise of modern knowledge services.
Finally, as shown in Figure 11, there does not seem to be a strong relationship between changes in service employment and GDP growth. This result might be related to the heterogeneous nature of the services sector, composed of low-productivity services (non-tradable services) and high-productivity services (tradable services), as depicted in Figure 3. Structural change in favour of low-productivity rather than high-productivity services – as has occurred in many developing economies since the 1990s – is likely to be weakly associated with economic growth.
22
Figure 9: Structural changes in the composition of employment in agriculture and annual growth rates of GDP per capita, 1991–2012 (per cent and percentage points)
Sources: Authors' elaboration based on the International Labour Organization’s Global Employment Trends dataset (see Box 3) and World Bank’s World Development Indicators.Note: ADV: Advanced economies; CEA: Central and Southeastern Europe (non-EU) and Commonwealth of Independent States; EA: East Asia; SEA: Southeast Asia and the Pacific; SA: South Asia; LAC: Latin America and the Caribbean; ME: Middle East; NA: North Africa; SSA: sub-Saharan Africa.
23

Figure 10: Structural changes in the composition of employment in industry and annual growth rates of GDP per capita, 1991–2012 (per cent and percentage points)
Source: Authors' elaboration based on the International Labour Organization’s Global Employment Trends data (see Box 3) and World Bank’s World Development Indicators.Note: ADV: Advanced economies; CEA: Central and Southeastern Europe (non-EU) and Commonwealth of Independent States; EA: East Asia; SEA: Southeast Asia and the Pacific; SA: South Asia; LAC: Latin America and the Caribbean; ME: Middle East; NA: North Africa; SSA: sub-Saharan Africa.
24

Figure 11: Structural changes in the composition of employment in services and annual growth rates of GDP per capita, 1991–2012 (per cent and percentage points)
Source: Authors' elaboration based on the International Labour Organization’s Global Employment Trends data (see Box 3) and World Bank’s World Development Indicators.Note: ADV: Advanced economies; CEA: Central and Southeastern Europe (non-EU) and Commonwealth of Independent States; EA: East Asia; SEA: Southeast Asia and the Pacific; SA: South Asia; LAC: Latin America and the Caribbean; ME: Middle East; NA: North Africa; SSA: sub-Saharan Africa.
Because industry includes manufacturing, mining, utilities, and construction, which are very different in terms of their labour productivity and capacity to absorb labour (see Figure 3), we analyse more disaggregated data in order to look at the relationship between economic growth and manufacturing. Data on manufacturing shares in employment, however, are less widely available than data on manufacturing value-added shares; we therefore use shares of manufacturing value added in GDP. depicts the correlation between GDP per capita growth and growth of the share of manufacturing in value added. The figure clearly shows that increasing shares of manufacturing value added in GDP are associated with faster rates of GDP per capita growth, with South Asia and Southeast Asia leading in terms of manufacturing value-added growth. Surprisingly, the correlation between the share of manufacturing in GDP and economic growth is lower than the correlation between the share of employment in industry and economic growth (0.59 versus 0.95). The literature has found that manufacturing employment is a much better predictor of economic growth than manufacturing output (Felipe et al., 2014; Rodrik, 2016). This is because it is through employment creation that manufacturing can spur economic growth (see Sections 3.3 and 4.1 for a discussion). Following this insight, we could expect a higher correlation between manufacturing employment and economic growth than the one observed between manufacturing output and economic growth.
25
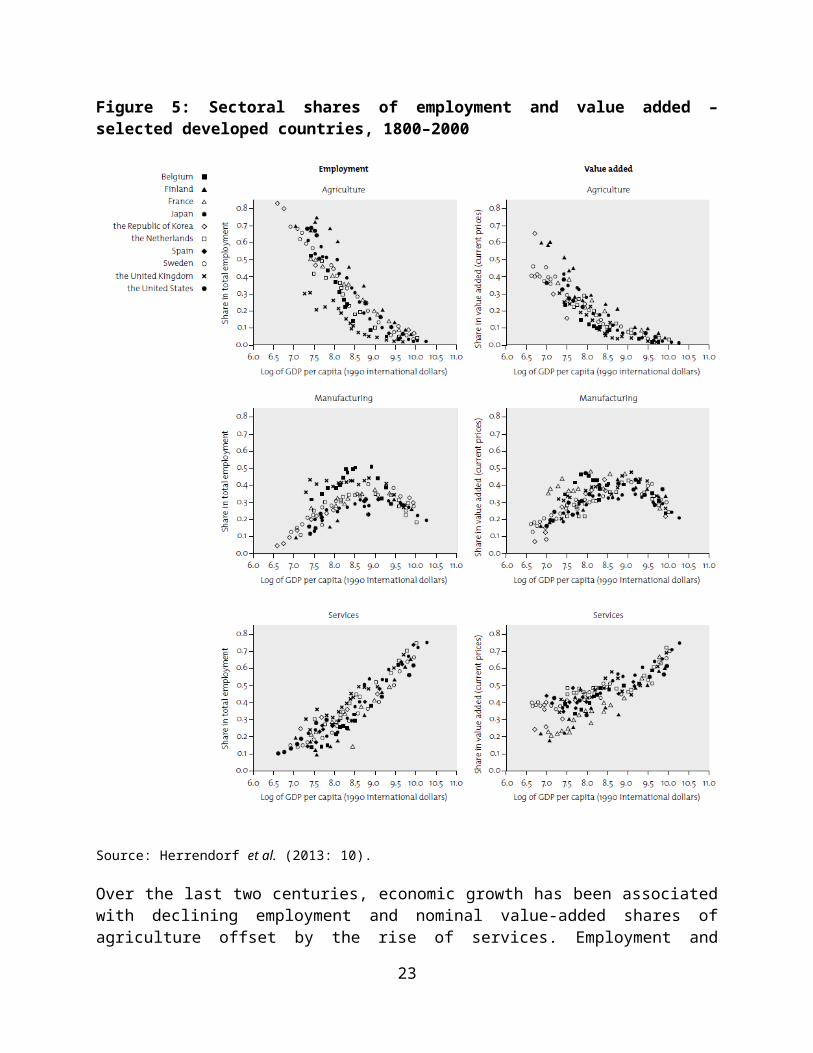
Figure 12: Economic growth and changes in the share of manufacturing value added in GDP, 1991–2012 (per cent and percentage points)
Source: Authors' elaboration based on World Bank’s World Development Indicators.Note: ADV: Advanced economies; CEA: Central and Southeastern Europe (non-EU) and Commonwealth of Independent States; EA: East Asia; SEA: Southeast Asia and the Pacific; SA: South Asia; LAC: Latin America and the Caribbean; MENA: Middle East and North Africa; SSA: sub-Saharan Africa.
3 Review of the literature
The characteristics of manufacturing discussed in the previous section explain why, ever since the Industrial Revolution, rapid economic growth has been associated with growth of manufacturing. After the United Kingdom, Germany and other European countries, the United States, and Japan caught up by industrializing. Since the Second World War, there have been two waves of catch-up, both based on manufacturing growth: in the peripheral European countries (namely, Austria, Finland, Greece, Ireland, Portugal, and Spain) during the 1950s and 1960s; and in East Asia during the 1970s and 1980s. Today, the People’s Republic of China, Malaysia, Thailand, and Viet Nam seem to be on a similar path.9 These phenomena, and more specifically the structural transformation process that is behind them, have attracted the attention of many scholars from early development economists until today. This section reviews the theoretical and empirical literature on structural transformation.
3.1 Structural transformation in development theories
Sustained economic growth underpinned by continuous technological progress is a phenomenon linked to the Industrial Revolution. Most economists in the classical tradition, from Adam Smith up to the early 20th century, believed that laissez-faire economics should be pursued to achieve
9 For a discussion of the differences between the first- and second-tier East Asian newly industrialized economies, see UNCTAD (1996), Studwell (2014), and Section 4.4.2 of Module 2 of this teaching material.
26
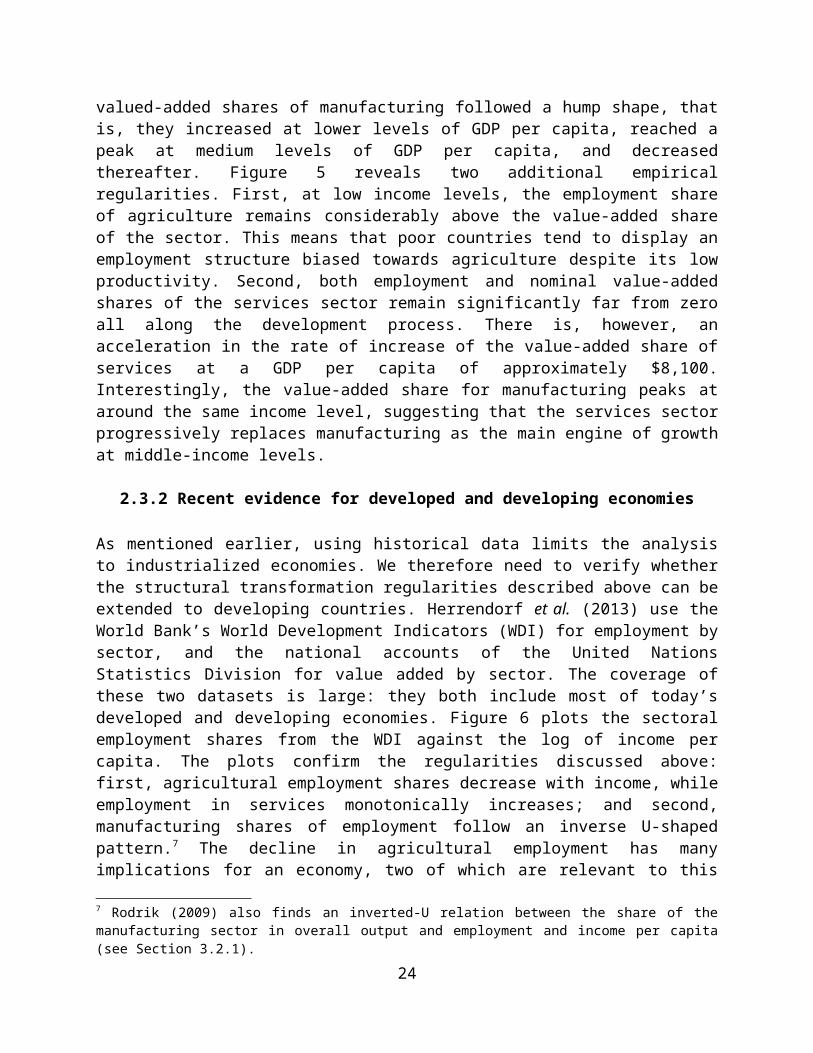
sustained economic growth. Markets would be able to allocate resources efficiently and maximize an economy’s growth potential. In this framework, the price system would determine what is produced and how, and structural transformation would take place automatically as the economy expands and markets reallocate factors of production to more productive sectors that offer better returns. This approach represented the dominant intellectual framework in the 18th and 19th centuries. Among other things, however, it did not take into account the key role of technological change and industrial upgrading in sustaining economic growth. It is precisely the continuous process of technological change that distinguishes modern (fast) economic growth from pre-modern (slow) dynamics.
More recent approaches to the study of economic development recognize this important shortcoming and propose different theoretical perspectives to deal with it. They proceed on two related but separate tracks: growth theories mostly related to the neoclassical tradition, and development theories related to the structuralist tradition. A third track, known as “new structuralist economics”, emerged in the last decade and aimed at reconciling the two schools of thought (see Section 3.1.3.1).
3.1.1 The neoclassical growth models
Some of the key elements of the first track can be found in the work of classical economists (Ramsey, 1928; Schumpeter, 1934), but systematic modelling only started in the second half of the 20th century, when the first growth models based on aggregate production functions were developed. Building on the seminal work of Harrod (1939) and Domar (1946), Robert Solow’s influential one-sector growth model gave rise to the first wave of growth analysis in the neoclassical tradition (Solow, 1956).
These models rest on a number of critical assumptions:
Production technologies are represented by aggregate production functions (see Box 1). Because production functions are aggregate, the implicit assumption of these models is that all firms and industries use the same technology.
Production exhibits constant returns to scale, i.e. economies of scale are considered negligible.
Markets are assumed to be perfectly competitive. Technological change is assumed to be “neutral”, meaning that technological change
improves the productivity of labour and capital equally.
Because of its minimalist structure, the Solow-type, one-sector model necessarily abstracts from several features of the process of economic growth. One of these is the process of structural transformation. Another is that technological progress is kept exogenous and outside of the model. The more recent endogenous growth models propose extensions of the one-sector framework that are consistent with the stylized facts of structural transformation and try to understand why technological diffusion takes place in some countries but not in others, and how it generates changes in the shares of output and employment. In these models, the technological process is treated as a lottery in which the prize is a successful innovation. More tickets of the lottery can be acquired by investing more in research and development (R&D). Technology is
27
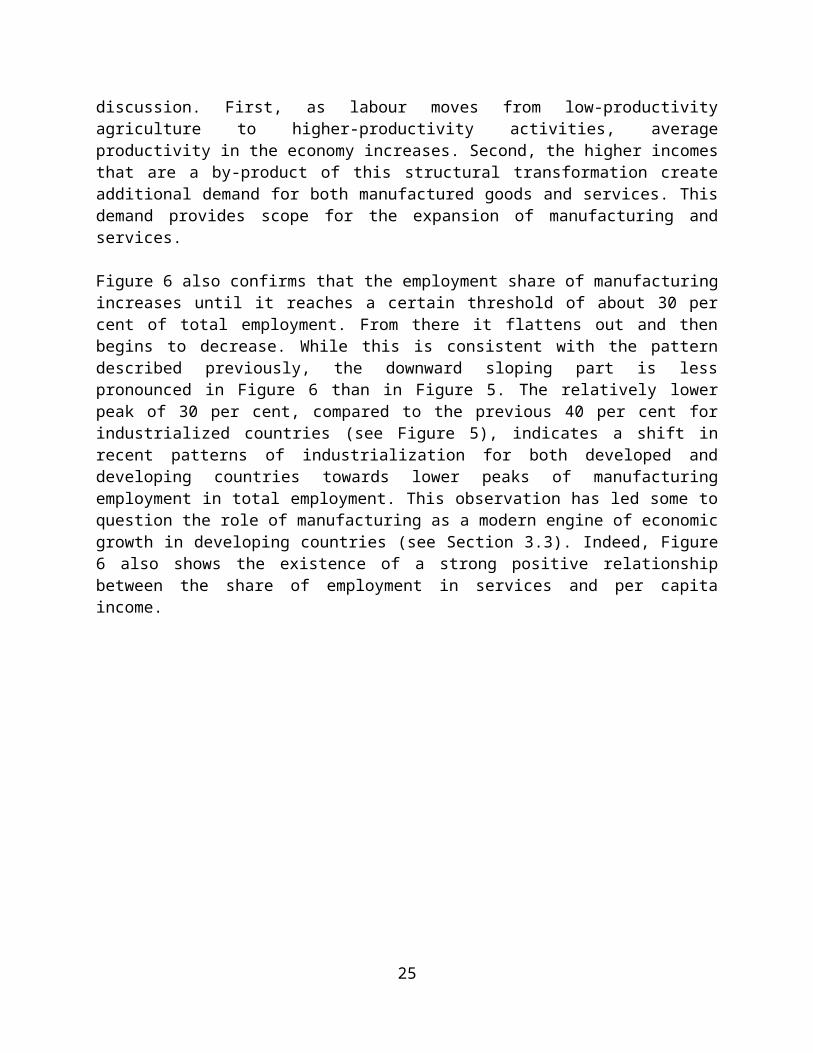
considered a public good, which creates opportunities for technological spillovers and ultimately leads to increasing returns to scale at the aggregate level (Acemoglu et al. 2001; Aghion and Howitt, 1992; Glaeser and Shleifer, 2002; Jones, 1998; Romer, 1987, 1990). Despite the advances that these models introduce in terms of considering the complex processes of technological change, some scholars have criticized them for not being realistic enough and not properly reflecting the complexity of the issues at stake (Dosi, 1982; Freeman and Louça, 2001; Malerba et al., 1999; Nelson and Winter, 1982; Silverberg, 2001; Silverberg and Verspagen, 1994; see also Section 3.1.3.3 in this module).
With regard to development theories that focused directly on the specific economic challenges facing poorer and more vulnerable economies, structuralist economics was the first school of thought to propose a detailed analytical investigation of the relationship between changes in the production structure and economic growth. The next section delves deeper into this strand of the literature.
3.1.2 The structuralist approach
The contribution of the structuralist school to development economics started in the 1940s and 1950s. It builds on the idea that the virtuous circle of economic development depends on structural transformation. As Kutznets (1979: 130) wrote: “It is impossible to attain high rates of growth of per capita or per worker product without commensurate substantial shifts in the shares of various sectors.” The seminal work of Rosenstein-Rodan (1943) paved the way to a rich strand of research from Chang (1949) to Nurkse (1953), Lewis (1954), Myrdal (1957), and Hirschman (1958) that came to be known as the structuralist approach to economic development. This approach is based on the following key assumptions:
Economic growth is a path-dependent process: The knowledge accumulated during the production process gives rise to dynamic economies of scale and externalities that lead to further economic growth and development. In this sense, initial production experiences have cumulative effects on the economy, as firms learn how to produce better quality goods or how to produce goods at lower average costs.10
Developing economies are characterized by structural heterogeneity: This means that in these economies, modern economic activities that are highly productive and use state-of-the-art technologies coexist with traditional economic activities with low productivity and high informality. Models of dual economies illustrated this situation, with the best examples being those of Lewis (1954) and Ranis and Fei (1961). In these models, it is the reallocation of labour from traditional to modern activities that drives economic growth.11
10 Emerging economies in East Asia are telling examples in this regard. Their success originates in a set of economic policies (see Module 2 of this teaching material) that in the long run have allowed firms to accumulate experience in producing manufactures and engage in a circular process of learning and rising competitiveness. The opposite dynamics can also occur. According to Easterly (2001), adverse shocks that affect economic activity in the short run, such as the debt crises of 1980s in Africa and Latin America, can have long-term negative effects on the growth of an economy.11 For a review of these models, see Temple (2005) and Ranis (2012).
28

Modern economic activities are generally urban manufacturing activities: A long tradition in the literature has seen manufacturing as an engine of economic growth. In his seminal works, Nicholas Kaldor (1957, 1966) identifies some empirical regularities, later known as Kaldor’s laws, about economic development and structural transformation:
The faster the growth rate of manufacturing output, the faster the growth rate of GDP; The faster the growth rate of manufacturing output, the faster the growth rate of labour
productivity in manufacturing; and The faster the growth rate of manufacturing output, the faster the growth rate of
aggregate labour productivity.
What is so special about manufacturing? The literature has provided several (complementary) answers to this question.
First, manufacturing generates static and dynamic increasing returns to scale. Large production scales reduce firms’ costs, specialization allows for a finer division of labour, and with accumulated production firms learn to produce more efficiently (Kaldor, 1966; Verdoorn, 1949). The role of increasing returns was formalized in the Verdoorn law that postulates that growth of output is positively related with productivity growth (Verdoorn, 1949). This relies on the interaction between economies of scale at the firm level and the size of the market: only a large enough market would allow higher productivity to compensate for higher wages and therefore generate the conditions for modern methods of production to replace traditional ones (Rosenstein-Rodan, 1943). The market dimension itself, however, depends on the extent to which these modern techniques are adopted (Young, 1928). The process of development will therefore be sustainable if modernization starts on a large scale from the outset. The market dimension is important in the structuralist literature, which maintained that production growth cannot be sustained without buoyant aggregate demand. When demand is insufficient, existing resources will be underutilized, which will hinder structural transformation. Strong growth of demand therefore becomes a necessary condition for overall economic growth (Kaldor, 1957, 1966; Taylor, 1991).
Second, manufacturing provides opportunities for capital accumulation. Manufacturing is more capital-intensive than agriculture and services (Chenery et al., 1986; Hoffman, 1958). Szirmai (2012) collects data on capital intensity in agriculture and manufacturing from 1970 to 2000. He shows that in developing countries, capital intensity in manufacturing is much higher than in agriculture, making the process of structural transformation towards manufacturing particularly beneficial.
Third, manufacturing is the locus of technological progress. Due to its higher capital intensity, manufacturing is where technological progress takes place in an economy (Chenery et al., 1986; Cornwall, 1977). Production in manufacturing requires modern capital technologies: due to rapid rates of capital accumulation, new generations of capital goods are constantly employed. These capital goods embody the latest state-of-the-art technologies, a characteristic that is the origin of the term “embodied technological change”. Moreover, due to the dynamic returns to scale generated in manufacturing, workers accumulate knowledge with production. This has been referred to as “disembodied technological progress” (Szirmai, 2012). Today, it can be argued that
29
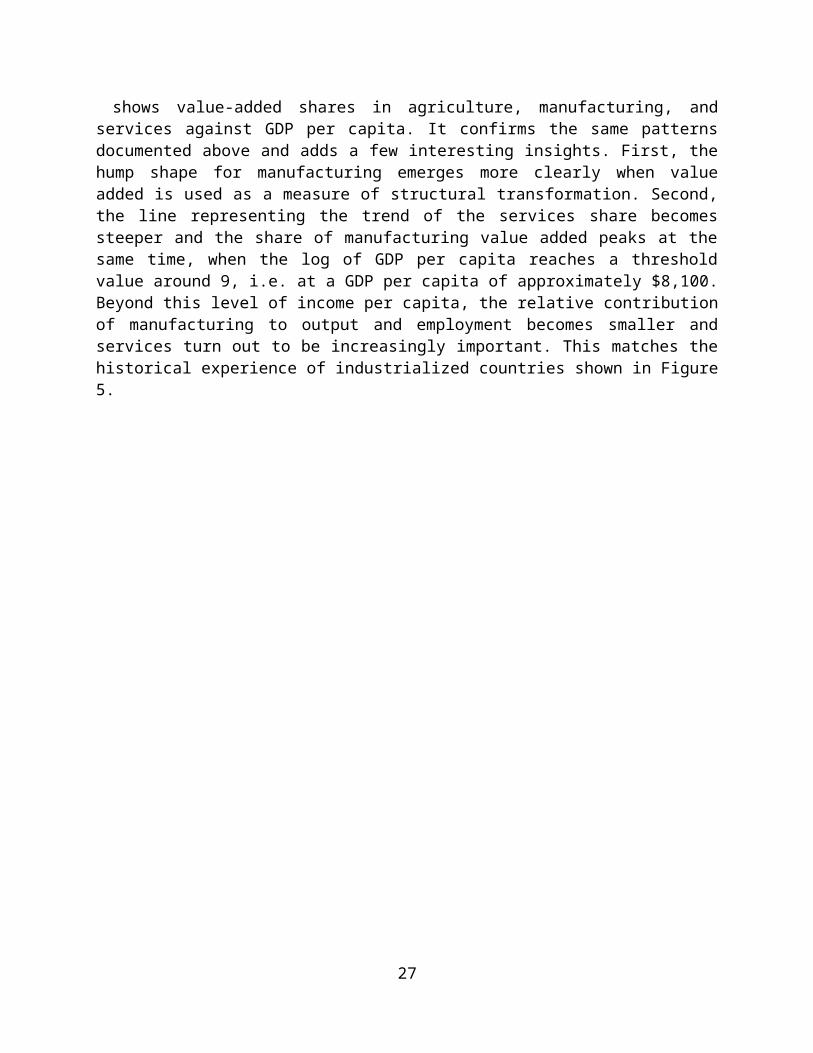
learning and innovation also occur in the services sector, as well as in some branches of modern agriculture that have become more capital-intensive and knowledge-based (see, for example, the application of biotechnology and bioengineering in agriculture or the application of ICT in services). Lavopa and Szirmai (2012) collect data on R&D expenditures in 2008 by 36 advanced economies, distinguishing between the major sectors in the economy (agriculture, manufacturing, mining, construction and utilities, and services). The data show that manufacturing was the most R&D-intensive industry in these economies, spending up to 6.5 percentage points more of its value added on R&D than services or agriculture.
Fourth, manufacturing has stronger linkages to the rest of the economy. Manufactured goods are not only sold to final consumers but also widely used in the other sectors, creating complementarities, or linkages, between various industries (Cornwall, 1977; Hirschman, 1958; Nurkse, 1953; Rosenstein-Rodan, 1943). Hirschman (1958) identifies two types of linkages: backward linkages, which occur when an industry needs inputs that can be sourced within the economy (e.g. production of cars might induce investment in the production of steel); and forward linkages, which occur when investment in an industry induces investment in downstream industries that use the output of the upstream industry (using the previous example, production of steel can stimulate the emergence of an automobile industry). Thanks to these linkages, knowledge and technological advances that occur in manufacturing can spill over to other sectors, benefiting the whole economy. This however depends on the strength and importance of the linkages. For example, an industry might be very connected to another, constituting a strong linkage, but this other industry might add little value to the economy. The notions and indicators of forward and backward linkages have been used to identify key sectors in the economy and to inspire industrial policy.
Fifth, manufacturing has both price and income elasticity advantages.12 According to Engel’s law (Engel, 1857), the lower the per capita income of a country, the larger the proportion of income spent on agricultural products. As income increases, demand shifts from agricultural to manufactured goods, stimulating manufacturing production. In addition, the price and income elasticity of demand is relatively higher in manufacturing than in other sectors, giving manufacturing an additional advantage. Higher demand for manufactured goods also creates demand for the intermediate inputs and capital goods necessary to produce consumer goods, thus further spurring output in manufacturing. If a country successfully industrializes, the higher demand for manufactured goods can be satisfied domestically. However, if an economy does not industrialize, it will need to import manufactured goods. Given the high price and income elasticity of manufacturing, imports of manufactured goods can lead to shortages of foreign exchange and balance of payment problems (Chenery et al., 1986; see also the insights about Latin American structuralism presented later in this section).
What about the services sector? It was clear dating back to Kaldor (1968) that the services sector is composed of two types of services: traditional services and services related to industrial activities. The latter complement manufacturing activities and are therefore expected to grow as a result of the expansion of these activities. It was also noted that the development process is
12 Price and income elasticities of demand measure, respectively, the variation of the quantity of demand for a good (or a service) as its price changes (price elasticity), or as the average income in the society changes (income elasticity).
30

generally accompanied by a shift of labour towards services, where there are lower productivity gains than in industry. This was referred to as cost disease or the structural burden hypothesis (Baumol, 1967, Baumol et al., 1985; see also Box 1).
Observing these empirical regularities and taking stock of this literature, Cornwall (1977) described the role of manufacturing in economic growth through a simple model. The Cornwall model, also known as the engine of growth hypothesis model, assumes that the growth rate of manufacturing and that of the overall economy are mutually reinforcing. This is expressed through the following equations:
Q̇m=g0+g1Q̇+g2 q+g3q r+g4 (I /Q)m (1)
Q̇=e0+e1 Q̇m. (2)
The first equation explains the growth rate of output in manufacturing (Q̇m ¿ and the second the growth rate of output in the economy (Q̇). Economic growth (i.e. the growth rate of output in the economy) depends on the growth rate of output in the manufacturing industry (Q̇m ¿, hence e1 measures the power of manufacturing as an engine of economic growth. The growth rate of manufacturing output, in turn, depends on the growth rate of total output in the economy (Q̇) and income levels (q). A measure of backwardness, income relative to the most developed economy (qr ¿ , is also introduced to account for convergence. In order to account for countries’ efforts to import or develop technologies, the original Cornwall model also included investments (I /Q)m . This model became the basis for a prolific empirical literature that tested the hypothesis that manufacturing is the engine of economic growth in an economy (see Section 3.2.1).
Within the structuralist tradition, it is important to distinguish the Latin American structuralist school, whose genesis can be found in the work of Raúl Prebisch (1950). Prebisch suggested that by specializing in commodities and resource-intensive industries where many of them have a comparative advantage, developing countries could lose their chances of industrializing. This direction of structural transformation would in fact make their terms of trade decline, thereby exacerbating the balance-of-payments constraint on economic growth. 13 Such dependence would also lead their exchange rates to cyclically appreciate due to commodity prices booms. This situation would create debt crises and erode industrial competitiveness, ultimately destroying domestic manufacturing industries.
While these theories were inspired by the structural change dynamics of Latin American countries, the issues related to the abundance of natural resources are relevant for countries in other regions as well (see Section 3.1.3.5). Even if many developing countries would tend to specialize in resource-intensive industries because that is where their comparative advantage lies, comparative advantage is also partly the result of policy decisions and strategies, as discussed in Box 2. For example, Brazil experienced significant growth‐promoting structural change throughout the 1970s, diversifying away from natural resources. As defended in the structuralist and Latin American structuralist literature, exchange rate, industrial, and trade policies play an
13 The same argument was put forth by Singer (1950).
31

important role in promoting productive structural transformation. These policies are the subject of Module 2 of this teaching material.
Today, due to the increased participation of developing countries in manufactured exports, the debate over the terms of trade has shifted from the comparison between developed and developing countries’ terms of trade to the comparison between prices of manufacturing exports from developing countries and prices of manufacturing exports from developed countries. In particular, the debate focuses on the types of manufacturing goods produced by developed and developing countries. The types of goods depend on countries’ capabilities, labour market institutions, and the presence or absence of surplus labour. In this debate, it is noted that the types of manufacturing goods exported today by developing economies share some of the disadvantages of the commodities that were the object of the Prebisch hypothesis (UNCTAD, 2002, 2005). Empirical research showed that since the mid-1970s, there has been a downward trend in the terms of trade of manufactures produced by developing countries compared to those produced by developed economies (Maizels, 2000; Minford et al., 1997; Rowthorn, 1997; Sarkar and Singer, 1991; Zheng and Zhao, 2002). More precisely, developing economies that specialized in low-tech, low-skill-intensive manufactures faced declining terms of trade, while those that managed to upgrade their exports into high-tech, high-skill-intensive manufactures could improve their terms of trade. This result implies that an export-oriented diversification strategy towards manufacturing does not necessarily solve the terms-of-trade issue noted by Prebisch, which in turn emphasizes the increasing role of upgrading and technological change.
3.1.3 The revival of the debate on structural transformation since the mid-2000s
The interest in structural transformation progressively diminished in the 1980s and 1990s, mainly due to the prevalence in both academic and policy circles of views and prescriptions related to the Washington Consensus (see Module 2 of this teaching material for a more detailed treatment of this issue). However, since the early 2000s, the topic has come back into the spotlight, thanks to the mixed results of the policies inspired by the Washington Consensus in terms of economic and social performance (Priewe, 2015). Five new strands of literature contributed most to the revival of this debate: (a) the new structural economics literature; (b) the new Latin American structuralism; (c) Schumpeterian, or evolutionary, economics; (d) the global value chain literature; and (e) the literature on resource-based industrialization.
3.1.3.1 New structural economics literature
Ideas rooted in both neoclassical and structuralist traditions have been revived by the new structural economics. Along the lines of the structuralist perspective, this strand of literature recognizes the importance of changes in the productive structure for economic development. More in line with the tradition of neoclassical trade models, it also postulates that these structural changes should rely on firms specializing in industries consistent with comparative advantages determined by factor endowments (Lin, 2011; Lin and Treichel, 2014).14 According to this approach, firms would move up the industrial ladder and become progressively more competitive in more capital- and skill-intensive products. This in turn would lead to an upgrade of the overall
14 More specifically, new structuralists often employ a dynamic version of the principle of comparative advantage defined as latent comparative advantage (see Box 2).
32

economy’s factor endowment and industrial structure (Ju et al., 2009). This comparative-advantage approach can however be excessively slow in countries with serious poverty problems. According to the critics of the new structural economics literature, conforming too much to the current factor endowments may not actually lead to structural change and industrial upgrading, but rather actually limit a country’s development potential (Lin and Chang, 2009). These critics, mostly from the structuralist tradition, argue that structural transformation can be achieved by acquiring new types of capacity, i.e. by undertaking new productive activities in strategic industries even before the “right” factor endowments are in place.
3.1.3.2 The new Latin American structuralism
Latin American structuralism has also seen a revival in recent decades, with two strands emerging.15 One focuses on a key development variable in the Latin American structuralist literature, the exchange rate (Bresser-Pereira, 2012; Ocampo, 2014; Ocampo et al., 2009). The other combines the structuralist and Schumpeterian approaches and focuses on the role of structural transformation and technological progress. It shows how productive heterogeneity and the direction of structural transformation that prevailed in recent decades hampered technological change and development. More specifically, according to this strand of literature, Latin American economies are characterized by strong heterogeneity; resource-based industries are highly productive and technologically advanced, whereas manufacturing industries are less productive and advanced. Structural transformation favouring resource-based industries at the expense of manufacturing industries halted industrialization and slowed technological change, learning, and accumulation of capabilities. This could have made manufacturing firms more competitive, thereby spurring shared economic growth and lifting people out of poverty (Cimoli, 2005; Katz, 2000). These strands do not contradict each other, as shown, for example, in the work of Ocampo (2005) and Astorga et al. (2014).
3.1.3.3 Schumpeterian, or evolutionary, economics
Another strand of literature that contributed to the analysis of structural change is the Schumpeterian or evolutionary economics school. Authors in this tradition include Nelson and Winter (1982) and Dosi et al. (2000) (see also Lall, 1992). These authors focus on the role of innovation and analyse how capabilities affect learning and development. The evolutionary approach to structural change relies on the idea that the scope for technological change varies substantially across industries, and that the speed of technological progress thus crucially depends on the dynamics of structural transformation in an economy (Dosi et al., 1990). In contrast to the new structural economics, the evolutionary school of thought argues that comparative advantages are not endowed but rather created. Production and endowment structures (and hence a country’s comparative advantage) are shaped by learning and innovation. In the same vein as old structuralists, evolutionary economists emphasize that successful economies that have relied on government interventions have managed to move production structures towards more dynamic activities, characterized by economies of scale, steep learning curves, rapid technological progress, high productivity growth, and high wages (Salazar-Xirinachs et al., 2014).
15 For a review of the old and new Latin American structuralism, see Bielschowsky (2009).
33
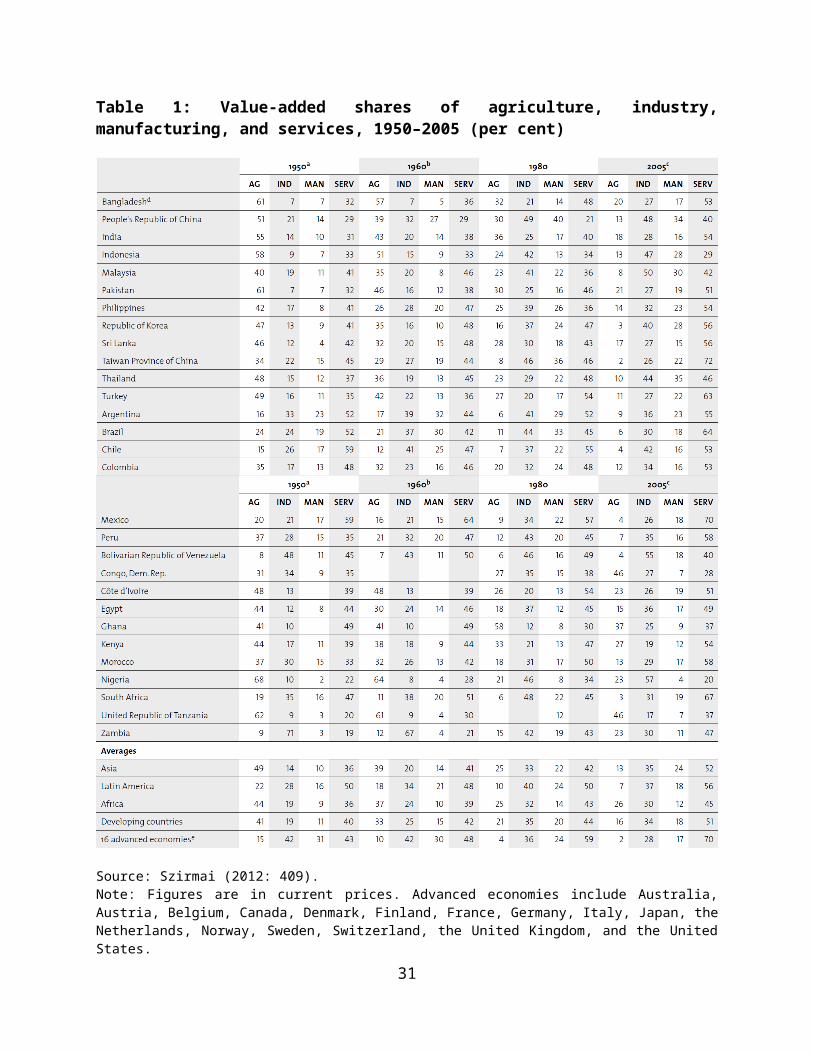
3.1.3.4 The value-chain literature
The debate on structural transformation has also been revived by the observation that production today is globally fragmented, giving rise to global value chains (GVCs). The concept of value chains describes the full range of activities that firms and workers perform to bring a product from its conception to final use (Gereffi and Fernandez-Stark, 2011). The GVC of a final product can be defined as “the value added of all activities that are directly and indirectly needed to produce it” (Timmer et al., 2014a: 100). The emergence of GVCs means that production is increasingly taking place within global production networks and consequently is fragmented across countries, rather than occurring in a single country or a single firm as was previously the case.16
Countries increasingly participate in international trade by specializing in one or a few tasks of a value chain, rather than specializing in producing one good. This means that instead of mastering a whole production process, countries need to master one or a few stages of production of a certain product to be part of global trade (Baldwin, 2012). While some countries specialize in the design and prototype of the product, others produce inputs and components, while yet others specialize in assembling the final product. These activities are not all alike: for example, design is more skill- and R&D-intensive, while assembling is more labour-intensive. Because prices of various types of labour and capital vary, tasks in which countries specialize define the share of value that countries add, and consequently the income and employment generated through those tasks. Hence, whether a country supplies critical high-tech components or is responsible for assembly makes a huge difference for structural transformation and development (Milberg et al., 2014; UNCTAD, 1996, 1999, 2002, 2006a, 2006b, 2013a, 2015a).
Given the pervasiveness of global value chains, it is worthwhile to look at structural transformation and development in light of this new phenomenon and reflect on the implications such production fragmentation has for the process of transformation and development. Table 2 highlights the implications of GVCs for five impact areas relevant for developing countries: (a) local value capture; (b) upgrading and building long-term productive capabilities; (c) technology dissemination and skill-building; (d) social and environmental impact; and (e) job creation, income generation, and quality of employment (see Module 2 of this teaching material for the policy implications of this discussion).
16 For a recent review of the GVC literature, see Gereffi (2015).
34
Table 2: Impact of GVCs on structural transformation in developing economies
Source: Adapted from UNCTAD (2013a: 149).
35
As shown in Table 2, GVCs are typically led by transnational corporations and established through equity holdings (foreign direct investment) and non-equity modes.17 Through non-equity modes, transnational corporations can require firms in developing countries to adopt new procedures and new managerial and production processes, working standards, and so on. In addition, transnational corporations might provide firms with concrete specifications related to the design and quality of the product or service to be delivered, contributing to the learning process of the local firm. The use of non-equity modes has increased rapidly over the last decade or so due to their relatively lower capital requirements, reduced risks, and greater flexibility. As we saw in Table 2, the development implications of non-equity modes vary according to the industry, the specific activity performed, the contractual arrangements, and the conditions and policies in the developing country (UNCTAD, 2011b).
Empirical research has also shown that there are only a handful of major lead firms in GVCs and that they are mainly concentrated in the developed world, and with few exceptions in the People's Republic of China (Gereffi, 2014; Starrs, 2014). This concentration of power in the hands of a few leading firms influences how these networks are managed, with clear developmental implications for developing countries. Concentration of power might lead these firms to somehow limit the upgrading opportunities available to firms in the host developing countries. As a consequence, firms in developing countries might be locked into low-value-added activities and face pressures to keep labour costs low. As a matter of fact, structural transformation within GVCs is achieved through upgrading, which can only be achieved through accumulation of productive and technological capabilities (UNCTAD, 2006a, 2006c, 2014a; see also Section 5.2.1 of Module 2 of this teaching material).
Firms can upgrade their standing in GVCs through four main channels (Humphrey, 2004; Humphrey and Schmitz, 2002; UNCTAD, 2013a):
Product upgrading. Firms move into more sophisticated product lines characterized by higher value added.
Process upgrading. Firms can introduce new technologies or organizational innovations to produce more efficiently.
Functional upgrading. Firms can move into more sophisticated (and skill-intensive) tasks in the chain (e.g. from assembly and production of standardized inputs to production of high-tech components and design).
Chain upgrading. Firms use the capabilities acquired in a chain to enter another chain.
The potential for different forms of upgrading differs across countries. According to Milberg et al. (2014), low-income and smaller countries usually seek to increase the domestic value added of their exports by functional upgrading. Middle-income countries, on the other hand, aim to avoid the middle-income trap through product and process upgrading, trying to establish their brands.
17 Non-equity modes are a form of outsourcing through a contractual relationship in which transnational corporations coordinate and control activities in the respective country, without owning a stake in the firm to which activities are outsourced. Examples of non-equity modes are contract manufacturing, service outsourcing, franchising, and licensing.
36
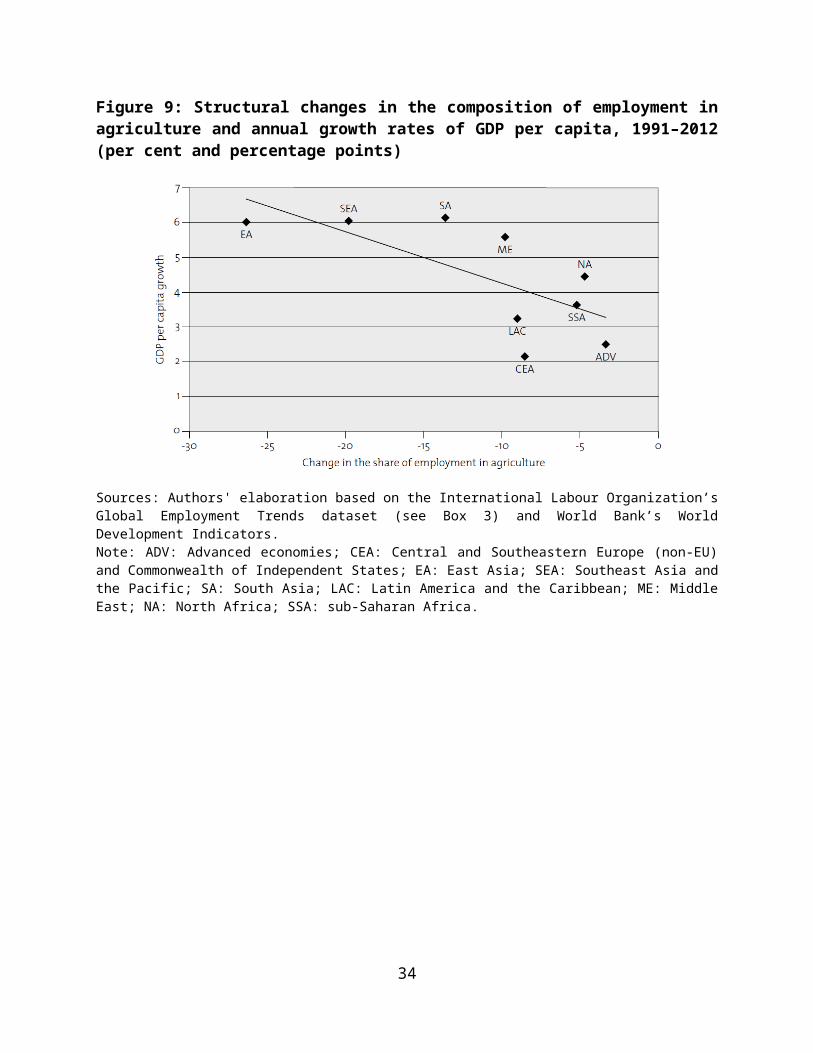
Some authors such as Banga (2013) have pointed out that global value chains emerged from regional value chains, with a case in point being the role of Japanese firms moving production and assembly of their branded products to other Asian countries. Regional value chains can be a vehicle for firms to become competitive in the global market, as they can enable them to accumulate capabilities and boost their competitiveness. This issue is particularly relevant for the least developed and most-marginal economies like many sub-Saharan African countries (Banga et al., 2015).
3.1.3.5 The literature on resource-based industrialization
It has long been argued that resource-rich economies suffer from a resource curse, known as Dutch disease, that penalizes the manufacturing industry and ultimately leads to unsatisfactory outcomes for industrial development and long-run economic growth (Auty, 1993; Collier, 2007; Frankel, 2012; Sachs and Werner, 1995; van der Ploeg, 2011).18 As the Dutch disease argument goes, the discovery of natural resources, as well as commodity price booms, may cause the manufacturing industry to shrink because:
Incentives to reallocate productive resources such as capital and labour to primary sectors lead to a rise in the production of commodities and divert resources away from manufacturing; and
An inflow of revenue leads to an exchange rate appreciation, making other economic activities, including manufacturing, less competitive.
Commodities are known to experience large swings in prices and long-run deterioration in their terms of trade (Prebisch, 1950; Singer, 1950; for more recent evidence, see Erten and Ocampo, 2012; Ocampo and Parra, 2003; and UNCTAD, 1993, 2003a, 2008, 2013b, 2015b). Resource-rich developing countries that rely excessively on commodities suffer the most from commodity price swings.19 In these contexts, commodity price volatility has important consequences for government revenues and macroeconomic stability, creating uncertainty and pressures on inflation, current account balances, and fiscal accounts (UNCTAD, 2008).20 Moreover, commodity production tends to remain an enclave activity, i.e. it tends to be isolated from the rest of the economy, reinforcing the structural heterogeneity described in Section 2.1 (see also Hirschman, 1958; and Humphreys et al., 2007). These stylized facts have traditionally called into question the capacity of resource-based development strategies to provide sustained support for development (Auty, 1990; Gelb, 1988; Venables, 2016).
From 2002 until recently, the world experienced a commodity price boom, driven by the relatively strong and stable performance of the global economy and fast economic growth and industrialization in a number of large developing economies, primarily the People's Republic of
18 The term “Dutch disease” comes from the 1960s economic crisis in the Netherlands that followed the discovery of gas reserves in the North Sea.19 This is especially the case in African economies where industrialization has been weak and inconsistent (UNECA, 2013).20 Especially in African countries, taxes levied on export revenues represent a significant share of government revenues (UNCTAD, 2003b). Due to the recent commodity price boom, total collected tax revenue in Africa increased by 12.8 per cent from 2000 to 2012, with the category “other taxes” (largely composed of natural-resource-related tax revenues) representing 46 per cent of total tax revenues (AfDB et al., 2014).
37

China, that guaranteed stable demand (Kaplinsky and Farooki, 2011; see also UNCTAD, 2005). Growing attention to the challenges of climate change and shrinking oil reserves also contributed to this price boom (UNCTAD, 2008). Finally, increased financial speculation, driven by an upsurge in investment in commodities futures and options, amplified this upward trend (Tang and Zhu, 2015; UNCTAD, 2008, 2009, 2011c, 2013b, 2015b; Zhang and Balding, 2015).21 Several developing countries have recently discovered reserves of minerals and fuel, and others have allocated significant resources to commodity production in order to take advantage of favourable terms of trade.
In light of these developments, it is no surprise that the debate about commodity-based development and industrialization strategies has been re-opened. Some authors have argued in favour of resource-based industrialization (AfDB et al., 2013; Andersen et al., 2015; Kaplinsky and Farooki, 2012; Perez, 2008; UNECA, 2013; Wright and Czelusta, 2004, 2007). According to these authors, natural resources can form the basis for an industrial development strategy and lead to industrialization. In this strand of literature, it is noted that resource-based manufacturing activities are becoming increasingly dynamic and R&D-intensive, as shown in the cases of salmon farming in Chile (UNCTAD, 2006d) or production of mining equipment in South Africa (Kaplan, 2012). This literature has argued that, contrary to what is commonly believed, strong production linkages exist between commodity industries and the rest of the economy, reducing the enclave nature of commodity production and making commodities a potential engine of industrialization. Box 4 describes the nature of production linkages in the context of commodities.
Box 4: Types and examples of production linkages
Following Hirschman’s theory of linkages, Kaplinsky (2011) discusses three types of production linkages that are relevant in the context of commodities – backward, forward, and horizontal – as described below:
Backward linkages capture the flow of intermediate goods or inputs from supplying industries to the commodity industry. Backward linkages are strong when the growth of the commodity industry leads to strong growth of the industries that supply the commodity industry. For example, backward linkages can arise from logging to logging equipment and from logging equipment to engineering.
Forward linkages capture the effect of the commodity industry on industries that process commodities. Forward linkages are strong when the growth of the commodity industry leads to strong growth of industries that process commodities. An example of forward linkages is found between timber industries and sawmilling and furniture production.
Horizontal linkages refer to the process in which an industry creates backward and forward linkages (as a supplier of inputs or a user of outputs of the commodity industry), develops capabilities because of that, and subsequently uses such capabilities in other industries. For example, horizontal linkages can arise from the adaptation of logging equipment to cane growing, i.e. the use of equipment for similar tasks in different production processes.
21 On financial aspects of the recent commodity price boom, see UNCTAD (2008, box 2.1), UNCTAD (2009, Chapter 2), UNCTAD (2011c, Chapter 5), and UNCTAD (2015b, Chapter 1 and its annex).
38

Source: Kaplinsky (2011).
Apart from production linkages, commodities generate two additional types of linkages: fiscal linkages and consumption linkages. With respect to the former, governments can channel revenues from natural resources into other industries or into broader development programmes, thus exploiting the fiscal linkages of commodities. In this regard, UNCTAD (2008) cautions that whether these fiscal linkages can be realized largely depends on the distribution of commodity export earnings between domestic and foreign stakeholders. Countries where state-owned enterprises are in charge of the extraction and production of natural resources can appropriate most or all of the gains from favourable terms of trade. Otherwise, well-designed taxation and royalty systems can help improve the distribution of rents between domestic actors and foreign investors (see also Section 5.1.2 of Module 2 of this teaching material). Consumption linkages can also spur industrialization, as higher incomes earned in the commodity industry can spur demand in other sectors (Andersen et al., 2015; Kaplinsky, 2011; Kaplinsky and Farooki, 2012).
In spite of this optimistic view of the possibilities for industrialization opened up by the recent commodity price boom, it has also been noted that it is misleading to think of developing countries only as commodity exporters, as they also import commodities. The actual effect of commodity price booms on the terms of trade depends on trade structures and price trends of the commodities imported and exported. The evolution of prices also affects the distribution of income within countries, as the social and economic groups that benefit from higher prices of exported commodities are not necessarily the same as those bearing the costs of higher import prices (UNCTAD, 2005, 2008). Moreover, developing countries that have benefited the most from the recent commodity price boom have often become net capital exporters, and capital has generally moved towards richer economies. Empirical research shows that these current account reversals are associated with terms-of-trade shocks and characteristics of the exchange rate regimes. In particular, countries that experience a current account reversal also experience a positive shock in their terms of trade, and countries with a fixed exchange rate are more likely to improve their current accounts than countries with a floating exchange rate (UNCTAD, 2008).
3.2 Empirical literature on structural transformation
The descriptive analysis presented in Section 2.4 offered some insights on the relationship between changes in productive structures and economic growth. The simple existence of a strong correlation between these two processes, however, does not prove that structural change fosters economic growth. Several econometric studies examined the impact of economic structures and structural change on economic or productivity growth. We can identify four strands of literature in this field of research: (a) studies on manufacturing as an engine of economic growth; (b) studies that disentangle the role of structural change in labour productivity growth; (c) studies that look at structural change within manufacturing; and (d) studies on industrial upgrading.
3.2.1 Is manufacturing the engine of economic growth?
According to structuralist economists, there is something special about manufacturing that makes it the engine of economic growth in the economy. Early econometric studies tested this idea and confirmed its validity (Cornwall, 1977; Cripps and Tarling, 1973; Kaldor, 1967). More recently,
39

using a large sample of countries between 1960 and 2004, Rodrik (2009) shows that the shares of industry in GDP and employment are associated with higher economic growth, with the results holding when the sample is split between advanced and developing economies. Other studies in this strand of literature focus on world regions or states in federal countries and confirmed that manufacturing is the engine of growth in the economy – i.e. that higher rates of growth of manufacturing output are associated with faster economic growth (see Felipe, 1998, for Southeast Asia, and Tregenna, 2007, for South Africa). Even for countries like India, where the share of services in GDP and employment is on the increase and where many observers talk of services as the engine of economic growth, Kathuria and Raj (2009) show that manufacturing is the engine of growth in Indian states. These results are supported by other studies showing that, even though the Indian experience suggests that specialization in services with high value added and based on skilled labour can spur economic growth, manufacturing remains extremely important (Chandrasekhar, 2007; Kathuria and Raj, 2009; Ray, 2015).
Fagerberg and Verspagen (2002) and Szirmai and Verspagen (2015) propose a Schumpeterian view on this topic by investigating the role of technological change in manufacturing growth. Fagerberg and Verspagen (2002) use data for 29 (mostly advanced) economies for the period 1966–1995.22 In their econometric model, they include variables typical of empirical studies related to the evolutionary economics school (e.g. number of patents) and structural variables, namely the shares in GDP of value added by manufacturing and services. They find that manufacturing had a much more pronounced role before 1973 than after that year, while higher shares of value added in GDP from services were positively associated with GDP growth in all time periods. While interesting, this finding might be a byproduct of the specific sample of economies used for the analysis: as Section 2.3 showed, as economies develop, their manufacturing industries shrink in favour of the services sector.
Szirmai and Verspagen (2015) test the engine of growth hypothesis using data for a large sample of developed and developing countries for the period from 1950 to 2005. The authors find that manufacturing is an engine of economic growth, while services do not have the same impact. The authors also analyse the role of the accumulation of capabilities in industrialization and economic growth by adding to the estimations of the Cornwall model interaction effects between an indicator of accumulation of capabilities (average years of schooling for the population above 15 years of age) and the share of manufacturing in GDP. They find a positive and significant relationship between this interaction term and economic growth, indicating that economic growth is positively associated with manufacturing growth, especially in countries with a more educated workforce. This result is particularly revealing: modern industrialization requires more skills in industrializing countries. Due to this, industrialization today is a more difficult route to economic growth than in the past, as investment in human capital becomes paramount.
According to some authors, manufacturing is even more powerful than accounted for by early development economics. Rodrik (2013a) shows that over time productivity levels in manufacturing tend to converge to the technological frontier (intended here as the most productive manufacturing activities). More precisely, manufacturing exhibits unconditional
22 Apart from European countries, the economies examined included the United States, Australia, Canada, New Zealand, Japan, Hong Kong (China), Malaysia, Philippines, Singapore, Republic of Korea, Taiwan Province of China, Thailand, and Turkey.
40
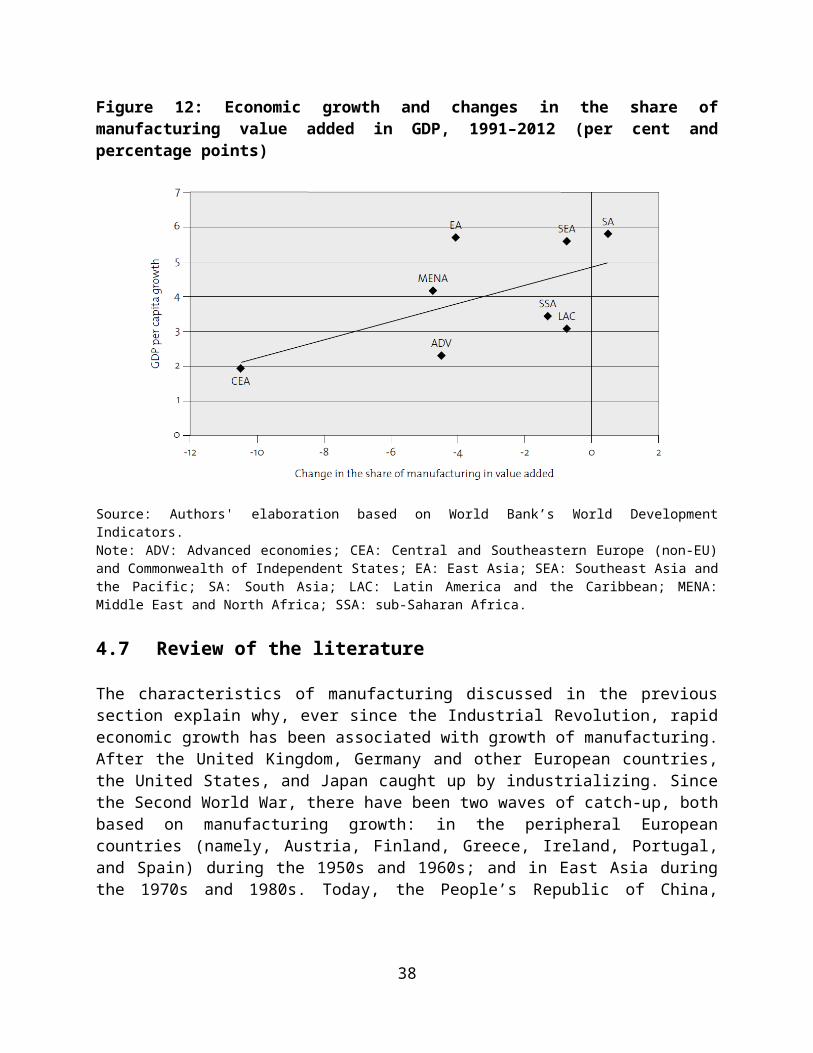
convergence, meaning that convergence in manufacturing productivity does not depend on other variables, such as the quality of policies or institutions, or geography and infrastructure. This essentially happens because activities with initially lower productivity levels enjoy faster labour productivity growth. Using disaggregated data from the United Nations Industrial Development Organization (UNIDO) covering formal activities, Rodrik (2013a) shows that productivity levels in manufacturing activities converge at a rate of 2 to 3 per cent per year. Figure 13 shows this dynamic at work for 21 sub-Saharan economies by presenting estimated partial correlations between initial levels of labour productivity (on the horizontal axis) and their growth rates over the subsequent decade (on the vertical axis). Each observation represents a manufacturing branch for the last ten years for which data are available.23 Period and industry dummies (and interaction terms between the two) are included as control variables. Even when they are not included the negative relationship holds, confirming the unconditional convergence of manufacturing productivity. This is valid for sub-Saharan African economies, but holds as well for other world regions.
23 Data are disaggregated at two-digit levels of the ISIC Revision 3 (e.g. food and beverages, chemicals and chemical products, motor vehicles, etc.).
41
Figure 13: Convergence in manufacturing labour productivity, sub-Saharan Africa
Source: Rodrik (2013b: 13).
Finally, recent empirical evidence has demonstrated that not only is structural transformation towards manufacturing positively associated with economic growth, but that this economic growth is also more sustained over time. Foster-McGregor et al. (2015) econometrically investigate this relationship using a panel dataset comprised of 108 countries between 1960 and 2010. Results confirm that a larger manufacturing industry, measured by the share of manufacturing value added in GDP, is significantly associated with longer periods of economic growth. Hence, a strong manufacturing industry is key both to trigger and to sustain economic growth.
3.2.2 Quantifying the effect of structural change on labour productivity
Labour productivity can be fostered in three different ways. Within each sector, productivity can grow through capital accumulation, technological change, exploitation of economies of scale, or learning (the within, or direct, productivity effect). During processes of structural transformation, labour moves across sectors: movements from low- to high-productivity sectors increase aggregate labour productivity by making the higher-productivity sector larger (the structural change, or reallocation, effect). Finally, changes in productivity can occur as a result of changes in relative output prices between different sectors (the terms-of trade-effect). Because the latter is relatively marginal, we will focus on direct and structural productivity changes. Following this, aggregate labour productivity can be decomposed into:
42

∆ Y t=∑i=n
θ i ,t−k ∆ y i , t+∑i=n
y i ,t ∆ θi ,t (3)
where Y t and y i ,t refer to economy-wide and sectoral labour productivity and θi , t captures the share of employment in sector i at time t. Δ denotes changes in productivity (∆ y i , t) or employment shares (∆ θ i ,t) between times t-k and t. The first component of labour productivity is the sum of productivity growth within each sector weighted by the employment share of each sector at the beginning of the time period. This is the within-component of labour productivity growth. Intuitively, this component captures the idea that the larger the sector with higher-than-average productivity growth in the economy, the larger the aggregate labour productivity growth of that economy. As discussed in Section 2.1, production structures in developing economies are highly heterogeneous, meaning that the economy is composed of a few high-productivity activities and many low-productivity activities. This element captures this heterogeneity by taking into account differences in sectoral productivity and differences in sizes of sectors. The second part of the formula, on the other hand, captures the impact of labour movements across sectors along the time period. Hence, this is the structural change, or reallocation, component of labour productivity growth. It accounts for the fact that when labour moves from a lower-productivity sector to a higher-productivity sector, the employment share of the former decreases and the employment share of the latter increases, thus increasing aggregate labour productivity.
Imagine that an economy is composed of two industries: shoes and computers. Labour productivity of the computer industry is higher than labour productivity of the shoe industry, and the shoe industry employs more workers than the computer industry. From time t-k to time t, the shoe industry becomes more productive (e.g. due to learning), and so does the computer industry (e.g. because firms invest in modern technologies). Let us also assume that the labour productivity increase in computers is higher than the labour productivity increase in shoes. If workers remain in their respective industries (i.e. no structural change occurs), the structural change component is zero. So, labour productivity growth is exclusively due to the first component, the within-productivity effect. Because labour productivity has increased in both industries, aggregate labour productivity growth would increase. Still, because the size of the two industries remained unchanged, aggregate labour productivity increases less than it would have had the computer industry been larger. If the economy undergoes a process of structural change, and workers move from shoes to the computer industry, the structural change component is not zero anymore; rather, it is positive.
Using this decomposition formula and similar variations of it like the one presented in Box A1 in the annex of this module, various studies have analysed how structural change contributed to labour productivity growth (de Vries et al., 2015; McMillan and Rodrik, 2011; Timmer and de Vries, 2009; Timmer et al., 2014b). Figure 14 presents averages of within and structural change productivity effects for Latin America and the Caribbean, sub-Saharan Africa, Asia, and high-income countries for the 1990–2005 period. Consistent with the empirical regularities discussed in Section 2.1, structural change made the smallest contribution to overall labour productivity growth in high-income economies. By contrast, structural change played a key role in developing regions, albeit in different ways. In Latin America and Africa, the structural change component was negative, meaning that labour moved from higher- to lower-productivity activities. In Asia,
43

it was positive. These findings contribute to explaining the differences in growth rates between these three regions.24
Figure 14: Decomposition of labour productivity growth by country group, 1990–2005 (percentage points)
Source: McMillan and Rodrik (2011: 66).Note: HI: high-income; LAC: Latin America and the Caribbean.
3.2.3 Looking inside the manufacturing industry
Some authors noted that manufacturing cannot be considered a homogenous category, as manufacturing branches differ considerably. As a consequence, structural transformation cannot be simply intended (and analysed) as the shift of labour from agriculture to manufacturing, because structural change also occurs within manufacturing, i.e. from less productive to more productive manufacturing branches. In particular, structural change within manufacturing can be qualified as a movement from light to heavy manufacturing, where light manufacturing is less capital-intensive than heavy manufacturing (Chenery et al., 1986; Hoffman, 1958). Timmer and Szirmai (2000) called this the structural bonus hypothesis. Timmer and Szirmai (2000), Fagerberg and Verspagen (1999), Fagerberg (2000), and Peneder (2003) apply the shift-share decomposition method to look inside manufacturing and identify the contribution of different branches within manufacturing. Box 5 provides more details on the shift-share decomposition method.
24 This exercise does not account for unemployment, which would worsen the picture for Latin America and the Caribbean and possibly for Africa, given the rise of unemployment in the period under analysis.
44
Box 5: Shift-share decomposition method
The shift-share decomposition method is an example of the accounting-based approach designed to analyse the impact of structural change on productivity growth. As described by Fagerberg (2000: 400), the shift-share decomposition “is a purely descriptive technique that attempts to decompose the change of an aggregate into a structural component, reflecting changes in the composition of the aggregate, and changes within the individual units that make up the aggregate.”
The method is derived as follows. Let P = labour productivity, Q = value added, N = labour input in terms of worker-years, and i = industry (i = 1,…, m). Then, similarly to the Divisia decomposition method described in Box A1 in the annex of this module, we can write labour productivity as:
P= QN
=∑
iQi
∑i
N i
=∑i [ Qi
N i
N i
∑i
N i ]=¿∑i
[P¿¿ i , Si]¿¿
(5.1)
where Pi=Qi
N i is labour productivity in industry i, and Si is the share of industry i in total employment.
After a straightforward algebraic manipulation and using ∆ as a notation for the difference in a variable between two points in time (as in ∆ P=P1−P0), we can write equation (5.1) in the growth-rate form:
∆ PP
=∑i [ Pi 0 ∆ S i
P0+
∆ Pi ∆ S i
P0+
Si 0 ∆ Pi
P0 ] (5.2)
The first term captures the contribution to productivity growth of changes in the reallocation of labour between industries. This is positive if the share of high-productivity industries in total employment increases. The second term is the interaction between changes in productivity in each industry and changes in labour shares. This component is positive if the high-productivity-growth industries increase their shares of employment as well. The third term measures the contribution of productivity growth within industries (weighted by the share of these industries in total employment).
Source: Authors.
Timmer and Szirmai (2000) study four Asian economies (India, Indonesia, Republic of Korea, and Taiwan Province of China) over the period 1963–1993. Their data allow for distinguishing between 13 manufacturing branches. Their dependent variable is total factor productivity (TFP) growth, expressed as a linear function of output growth. The authors modify the standard shift-share decomposition method to account for the Verdoorn law (see Section 3.1.2). The idea behind the paper is that if returns to scale differ across industries, then the contribution of structural change to productivity growth is larger than measured by the standard shift-share analysis. The authors find that the structural change component does not explain TFP growth, contrary to what the literature suggests. Following their modification of the shift-share analysis, the component of structural change is positive when inputs move to higher-productivity
45
branches, branches whose productivity grows faster, or branches with higher Verdoorn elasticity, intended as the elasticity of TFP growth to output growth. This change of the methodology, however, does not change the main results, so the shift-share method does not systematically underestimate the contribution of structural change.
Peneder (2003) examines the contributions to economic growth of services and two categories of the manufacturing industry, namely technology-driven and human-capital-intensive manufacturing. The study examines 28 economies from the Organisation for Economic Co-operation and Development (OECD) over the period 1990–1998. Results show that a rise in the employment share of services has a (lagged) negative effect on GDP growth, confirming the structural bonus hypothesis put forth by Baumol (see Section 3.1.2). By contrast, increases in the shares of technology-driven and human-capital-intensive manufacturing exports have a significant and positive effect on the level and growth rate of GDP. The author attributes these results to producer- and user-related spillovers, positive externalities, and other supply-side factors that enhance productive capacity that is associated with the industrial sector. He also points out that when both the effects of services and manufacturing industries are taken into account, the net effect of structural transformation appears to be weak because the positive and negative effects from changes in the structure of the economy cancel each other out.
Fagerberg and Verspagen (1999) focus on the role of specific manufacturing industries deemed to be particularly strong engines of economic growth.25 Using the UNIDO Industrial Statistics Database, they find that from 1973 to 1990, the electrical machinery industry became one of the most dynamic industries in developed economies, with extraordinarily high labour productivity growth rates. Inspired by this finding, they develop an econometric model to estimate the impact on manufacturing productivity growth of the size of the electrical machinery industry, captured by its employment share.26 They find that the share of employment in electrical machinery is a significant determinant of productivity growth in manufacturing, while the share of employment in other high-growth industries is not a significant determinant. This supports the idea that the electrical machinery industry is special because it can drive productivity growth in manufacturing. This result also illustrates the concept of linkages discussed in Section 3.1.2 – that is, thanks to the wide application of ICT in a large range of economic activities, fostering the electrical machinery industry indirectly induces investments in other industries, and spurs productivity in other industries and at the aggregate level, also fostering innovation through knowledge spillovers and new products. At the same time, today’s new technologies generate different patterns of structural transformation compared to those observed during the first half of the 20th century (e.g. electricity and synthetic materials). As stated by Fagerberg (2000: 409): “New technology, in this case the electronics revolution, has expanded productivity at a very rapid rate, particularly in the electrical machinery industry, but without a similarly large increase in the share of that industry in total employment.” The weak effect on employment may call into question the poverty-reducing impact of this new type of structural change, as well as its role as an engine of economic growth, especially in developing economies with large and growing populations.
25 See also Fagerberg (2000).26 The estimations include the change in the share of the workforce going to other high-growth industries to account for possible similar dynamics in other industries. Initial productivity levels, enrollment in education, and investments are also added in most of the estimated models.
46

3.2.4 Industrial upgrading through export sophistication and within value chains
Structural transformation is a continuous process spurred by industrial upgrading through diversification and sophistication of production and exports. Two strands of literature have recently analysed these processes: the product space literature, and the GVC literature. The product space literature (Hausmann and Kliger, 2007; Hausmann et al., 2007, 2011; Hidalgo et al., 2007) builds on a very structuralist idea: what economies produce and export matters for their economic growth and development. This literature also contains a strong evolutionary element: countries cannot produce a good for which they have no knowledge or expertise. This puts learning, capabilities, and technological change at the centre of structural transformation processes. This literature sees production possibilities as a space in which economies move. More specifically, the product space is an illustration of all goods exported in the world, where the distance between two goods is defined by the probability of producing one of the goods if an economy already produces the other. In this framework, structural transformation entails moving from a good that countries already produce to another one that is close enough to it, where “close enough” is defined according to the knowledge and capabilities needed to produce a certain good. Hence, in the product space, goods are close if the knowledge used to produce them is similar, and goods are far away if producing them requires completely new sets of skills. This ultimately configures a network of goods, a sort of map in which economies move from one point to another, leading to diversification and production of increasingly sophisticated goods.
Hausmann et al. (2007) develop a quantitative index of countries’ export sophistication generally denoted as EXPY.27 Unsurprisingly, the authors show that this measure of export sophistication is highly correlated with per capita income. But what is important from our perspective is that they also show the existence of a positive correlation between the initial level of EXPY and the subsequent rate of economic growth. That is to say, if a country has a sophisticated export basket relative to its level of income, subsequent growth is much higher (see also Fortunato and Razo, 2014). This is illustrated in Figure 15, which presents data on GDP per capita and EXPY in 1992. It is telling that China and India, among the most successful economies in the recent past, had more sophisticated export profiles than their income levels might have suggested.
27 EXPY is calculated in two steps. First, using the six-digit Harmonized Commodity Description and Coding System (HS), which covers more than 5,000 different commodities, the authors compute the weighted average of the incomes of the countries exporting each traded commodity, where the weights are the revealed comparative advantage (see Box 2) of each country in that commodity (normalized so that the weights sum up to 1). This gives the income level of that commodity (the variable generally referred to as PRODY). Next they calculate EXPY as the weighted average of the PRODY for each country, where the weights are the shares of each commodity in that country’s total exports.
47
Figure 15: Relationship between EXPY and per capita incomes in 1992
Source: Rodrik (2007: 24).Note: EXPY denotes a country’s export sophistication.
Various studies applied the methodologies outlined in the product space literature to map product spaces and identify possible paths of productive diversification, especially for developing economies (see Hausmann and Klinger, 2008, for Colombia; Felipe et al., 2013, for China; Jankowska et al., 2012, for Asia and Latin America; and Fortunato et al., 2015, for Ethiopia).
A similarly prolific literature is analyzing the implications of the rise of GVCs for structural transformation by using input-output matrices recently made available by a number of new databases (e.g. the World Input Output Database and the Trade in Value Added Database). 28 These studies have provided empirical evidence on the pervasiveness of GVCs and discussed their implications for firms and governments in developing countries. They generally recognize that despite being global, production is concentrated in a small number of countries, predominantly in East Asia. Lead firms are generally from advanced economies and globalization of production is more pronounced in some industries than others, with clothing and
28 The World Input Output Database (WIOD) collects data for 27 countries that comprise the European Union (excluding Croatia) and 13 other economies (the United States, Japan, Canada, Australia, Republic of Korea, People’s Republic of China, Russian Federation, Brazil, India, Mexico, Turkey, Indonesia, and Taiwan Province of China) from 1995 to 2011. The database is available at http://www.wiod.org/new_site/home.htm. The Trade in Value Added (TiVA) Database is produced by the OECD and the World Trade Organization (WTO). It includes data on 61 economies (OECD economies, EU28, G20, most East and Southeast Asian economies, and some South American countries). Data cover 1995, 2000, 2005, and 2008-2011. The TiVA database is available at http://www.oecd.org/sti/ind/measuringtradeinvalue-addedanoecd-wtojointinitiative.htm.
48

textiles, electronics, and automotive industries being the most fragmented (De Backer and Miroudot, 2013; Timmer et al., 2014a; UNCTAD, 2014a). Another common finding in this literature is that while participation of developing countries in GVCs has increased tremendously over recent decades, developed economies tend to benefit more from insertion in GVCs than developing countries. The latter are sometimes locked into low-value-added activities and face difficulties in upgrading (Milberg et al., 2014; UNCTAD, 2002, 2014a).
In this strand of literature, Banga (2013) uses the World Input Output Database to compare various indicators measuring the participation of countries in GVCs and the distribution of gains from that participation. The author shows that while developing countries are increasingly participating in GVCs, developed countries contribute the most to value addition.29 The paper distinguishes between two mechanisms through which countries can participate in GVCs: through forward linkages, whereby the country provides inputs into exports of other countries, or through backward linkages, whereby the country imports intermediate goods to be used in its own exports. This distinction captures how much countries gain from participation in GVCs, as stronger forward linkages, more so than backward linkages, are a sign of higher domestic value creation. Findings show that the United States, Japan, the United Kingdom, and Italy are the countries with the highest ratio between forward and backward linkages, meaning that their net gains from participation in GVCs are the highest. Moreover, the study demonstrates that even when developing economies manage to enter high-tech industries through GVCs, their participation might not ensure net gains in terms of value added into exports.
Timmer et al. (2014a) use the World Input Output Database to illustrate how value chains have sliced up global production. An example from their paper illustrates this. In the German car manufacturing industry, defined in this framework as the industry that sells cars in Germany’s domestic market, the value-added contribution by firms outside Germany increased from 21 per cent in 1995 to 34 per cent in 2008, pointing to increased fragmentation of production (Table 3). Moreover, the value added by capital and high-skilled labour (no matter the origin) increased, while the value added by low-skilled labour decreased or remained constant. This suggests that in the car industry, countries that specialized in capital-intensive stages of production gained more than countries that specialized in labour-intensive stages of production. Consistent with this trend, empirical research has shown that since the 1980s, a shift has occurred in the functional distribution of income – which shows how income is distributed among the owners of the main factors of production, i.e. labour and capital – that has moved income away from wages and towards profits (UNCTAD, 2010, 2012).
29 In particular, the contribution of OECD economies to global value added is estimated at around 67 per cent, while the contribution of all developing economies is 8 per cent (excluding first-tier and second-tier newly industrialized economies and the BRICS – Brazil, the Russian Federation, India, the People's Republic of China and South Africa).
49

Table 3: Decomposing value in global value chains: the case of German cars, 1995 and 2008 (per cent)
Source: Timmer et al. (2014a:104).
Taking a different unit of analysis and applying a different methodology, Dedrick et al. (2010) use the examples of the Apple Ipod and notebook personal computers to illustrate how profits are distributed between the participants of these two GVCs. The intuition behind this exercise is relatively straightforward: an Ipod and a computer are made of lots of components produced by different firms in different countries. Each of these firms charges a price for its component or activity and in turn pays other firms for the intermediate goods needed to complete its stage of production. Table 4 presents different indicators of profit margins of the main participants in the Ipod global value chain. Without going into the technicalities of the exercise, the table clearly depicts the gap between the profits enjoyed by firms that specialize in product design (or the production of critical components, such as the controller chip or the video chip) and firms that specialize in assembly or production of low-tech standardized components like memory chips.
50

Table 4: Profit margins of main firms contributing to the production of an Ipod, 2005 (per cent)
Source: Dedrick et al. (2010: 92).Note: Bold values evidence the gaps in profit margins between different participants in the Ipod global value chain.
Despite the fact that some activities like assembly do not generate high profits for local firms, they do create employment. Hence, while countries should try to move up the value chain, lower-value-added activities create employment and allow countries to insert themselves into global trade and learn through production and interactions with other GVC participants. Section 5.2.1 of Module 2 of this teaching material will delve deeper into the challenges that GVCs pose to structural transformation and how industrial policies can facilitate industrial upgrading in value chains.
Some authors have related industrial upgrading through export sophistication and value chain upgrading to income traps, and in particular to the middle-income trap. Felipe et al. (2012) analyse the dynamics of 124 countries between 1950 and 2010, classifying economies by income groups and computing how many years they took to graduate to higher-income groups. They find that structural transformation, export sophistication, and diversification help countries avoid the middle-income trap. Lee (2013) propose an evolutionary perspective on middle-income traps, associating them with the development of technological capabilities. According to his analysis, in order to avoid middle-income traps, countries should upgrade and diversify their economies by moving into industries characterized by rapid technological change. Rapid innovation quickly makes existing products obsolete and incumbents less competitive, creating opportunities for new firms to enter the industry.
Combining the structuralist and evolutionary views, Lavopa and Szirmai (2014) develop an index of structural modernization that builds on the idea that in order to successfully develop, countries must undertake processes of structural and technological change simultaneously. For this purpose, the index is composed of a structural change and a technological change
51
component. The structural transformation component of the index is captured by employment shares in the modern sector made up of industry (i.e. mining, manufacturing, utilities, and construction) and tradable services (transport and telecommunications, and financial and professional services). These industries generally present above-average productivity levels and higher potential for productivity growth. The technological change component is measured by the labour productivity of the modern sector, as defined above, compared to that of the United States (considered the world technological frontier). The structural modernization index is computed for 100 countries over the period 1950–2009. The trends followed by this index in recent decades confirm that only the economies that managed both transformations at the same time (e.g. the Republic of Korea, Taiwan Province of China, Hong Kong (China) and Singapore) caught up with the advanced world. By contrast, those that did not embark on sustained processes of structural and technological transformation got caught in low- and middle- income traps.
3.3 Premature deindustrialization and the (possible) role of services as the new engine of economic growth
Some observers have recently suggested that services are taking over the role of manufacturing and becoming the new engine of economic growth. This position draws on several observations. First, as already discussed in Section 2.3, one of the empirical regularities about structural transformation is that as economies develop beyond a certain (relatively high) level of income, they tend to deindustrialize. Studying the relationship between manufacturing employment and income per capita in 70 countries in 1990, Rowthorn (1994) shows the existence of a stable inverted-U relationship between these two variables. This empirical regularity is supported by econometric evidence showing that in the advanced world, manufacturing is not the engine of economic growth that it was some decades ago (see Section 3.2.1).
The phenomenon of deindustrialization, however, is a bit more complex than that. Rowthorn and Wells (1987) distinguish between two types of deindustrialization: positive deindustrialization, which occurs in developed economies as a natural result of sustained economic growth, and negative deindustrialization, which occurs at all income levels. In the case of positive deindustrialization, fast productivity growth in manufacturing allows firms to satisfy demand using less labour (in other words, productivity growth reduces employment) while output expands. Displaced workers find employment in the services sector because, as incomes rise, demand patterns shift towards services, also due to Engel’s law. Therefore, the share of employment in services is expected to rise at the expense of employment in manufacturing (Baumol, 1967; Baumol et al., 1985; see also Section 3.1.2). By being the result of industrial dynamism (i.e. productivity growth), positive deindustrialization is a sign of economic success. Negative deindustrialization, on the other hand, is a product of economic failure. It occurs when a country has a poor economic performance or when its manufacturing industry faces challenges. In these cases, falling manufacturing output, or higher productivity in manufacturing, creates unemployment, thereby depressing incomes (Rowthorn, 1994; Rowthorn and Wells, 1987; UNCTAD, 1995).
In addition, Palma (2005) documents that the relationship between manufacturing employment and income per capita is not a stable one. Rather, a declining level of manufacturing employment
52
is associated with each level of income per capita, suggesting that today developing countries tend to deindustrialize before they reach high enough incomes. Figure 16 depicts the log of income per capita (at constant 1985 prices) on the horizontal axis and the share of manufacturing employment in total employment on the vertical axis. Each curve represents data for a certain year. The figure illustrates the decline in the share of manufacturing employment with each level of per capita income and a dramatic reduction in the level of income per capita from which the downturn in manufacturing employment begins. In particular, the level of income per capita at which the manufacturing employment began to decline dropped from $20,645 in 1980, to $9,805 in 1990 and $8,691 in 1998.
Figure 16: The changing relationship between manufacturing employment and income
Source: Palma (2005: 80). Note: The 1960 curve is built using data for 81 countries. The other curves are built using data for 105 countries.
According to Palma (2005), several factors may explain this phenomenon. They include labour-displacing technological progress that has increased the capital intensity of production at the expense of labour, and the rise of globalization and GVCs that have facilitated the relocation of labour-intensive stages of production to low-wage labour-abundant economies, especially in Asia. As we will see later on in this section, relocation of labour-intensive production activities has predominantly benefited Asian economies, leading to the expansion of manufacturing employment and output (i.e. industrialization). Firms from Latin American and African countries have been less capable of inserting themselves into these GVCs, which has contributed to the trend towards “premature deindustrialization”. Dutch disease – the phenomenon by which the discovery of natural resources makes economies specialize in primary commodities at the
53
expense of manufacturing activities (see also Section 3.1.3.5) – is another determinant of premature deindustrialization. As Palma (2005) argues, some developing countries, especially in Latin America, have experienced policy-driven Dutch disease since the 1980s. Policies that sought to generate a trade surplus in manufacturing have been substituted by policies that promote specialization based on comparative advantages and, hence, in accordance with countries’ resource endowments. This has led to fast premature deindustrialization.
In discussing the possible determinants of premature deindustrialization, Tregenna (2009) analyse the trends of 48 deindustrializing economies, including high-income as well as middle- and low-income economies.30 She shows that in almost all the economies studied, manufacturing has become less labour-intensive, essentially due to rapid labour productivity growth. This would not be a problem if the share of manufacturing in GDP had not decreased. However, this seems not to have been the case: in the majority of the economies analysed, the fall in manufacturing employment was associated with a fall in manufacturing shares in GDP. As Tregenna (2009: 459) argues, this reduced the long-term growth prospects of these economies as they lost out on the “growth-pulling effects of manufacturing”.
Felipe et al. (2014) delve deeper into the detrimental effects of premature deindustrialization. They analyse 52 economies, mostly high- and upper-middle-income ones, but a few lower-middle-income economies as well. They identify a statistically significant relationship between the historical peak of manufacturing employment and subsequent levels of income per capita, meaning that countries that achieved a high share of manufacturing employment in the past enjoy higher incomes today. Figure 17 illustrates this by depicting the historical peak of the manufacturing employment share between 1970 and 2010 on the horizontal axis and the logarithm of average income per capita between 2005 and 2010 on the vertical axis. According to the estimations by Felipe et al. (2014), a one percentage point difference in the peak of manufacturing employment shares is associated with a per capita GDP in 2005–2010 that is 13 percentage points higher. This relationship holds for employment shares, but not for output shares. Hence, as the authors put it, “the industrialization process predicts future prosperity only insofar as it generates manufacturing jobs” (Felipe et al., 2014: 5). The paper further shows that industrialization is a predictor of future wealth: achieving a manufacturing share in employment of 18 to 20 per cent in the period from 1970 to 2010 has been an absolutely necessary condition for becoming a high-income economy. Finally, results confirm that manufacturing employment peaks at increasingly lower levels of per capita income, confirming the above-described trends of premature deindustrialization.
30 Middle-income economies included in the analysis are Poland, Chile, Colombia, Argentina, Latvia, Romania, Uruguay, Jamaica, Suriname, the Russian Federation, St. Lucia, and the Bolivarian Republic of Venezuela. Low-income economies are Pakistan and Mongolia.
54

Figure 17: The relationship between the peak of the manufacturing employment share in the past and GDP per capita in 2005-2010
Source: Felipe et al. (2014: 6).Rodrik (2016) looks further into these processes and uncovers interesting regional dynamics: consistent with the descriptive statistics discussed in Section 2.3.3, Asia is the only developing region that maintained a strong manufacturing industry over recent decades. By contrast, Latin America and sub-Saharan Africa present the most dramatic deindustrialization processes (see also UNCTAD, 2003a). According to Rodrik (2016), these regional trends can be explained by the trends in globalization: jobs in manufacturing have been destroyed mostly in countries without a strong comparative advantage in manufacturing. Labour-displacing technological change, intended as technological change that increases capital intensity and saves unskilled labour, is also among the causes of (premature) deindustrialization. Indeed, Rodrik (2016) shows that the reduction of manufacturing employment predominantly affected low-skilled workers.
In an attempt to explain the changing relation between industrialization and per capita income, some have noted that certain statistics may underestimate the extent to which manufacturing is a source of employment and overestimate instead the importance of services. UNIDO (2013), for example, points out that (a) while informality is considered typical of services, there has recently been a rise in informal jobs in manufacturing; and (b) the distinction between manufacturing and services is becoming blurred as manufacturing firms outsource many of their service activities to firms in the tertiary sector and thus create manufacturing-related services (see also Manyika et
55

al., 2012).31 Manufacturing-related services, and especially business services such as design, research, engineering, branding, advertising, and marketing, are an important source of employment in industrialized countries where they often compensate for the decline in manufacturing jobs. The rise in manufacturing-related services has not been limited to the industrialized countries, however. Increased regional integration and participation in international production has led to significant employment gains in manufacturing-related services (e.g. business services and transport) in fast-growing developing countries and regions, and particularly in East Asia and the Pacific (UNIDO, 2013).
It has also been argued that opportunities can be found in potential linkages between services and high-productivity industrial activities. For example, manufacturing firms are increasingly outsourcing activities such as business services (e.g. renting of machinery and equipment, logistics, warehousing, etc.) and transportation to firms in the tertiary sector. As firms begin to cooperate, they will exchange knowledge and technologies. These exchanges will be particularly beneficial for labour-intensive services firms, as they are expected to adopt the industrial sector’s more advanced technology, and as their workers would learn new ways to conduct business. However, services firms wishing to establish linkages with industry face significant challenges. These challenges stem from the informal nature of many services activities, the firms’ lack of human capital and productive capabilities such as conceptual and procedural knowledge about how to create new products or new ways of doing business, a low level of capital, and a low usage of ICT (Salazar-Xirinachs et al., 2014).
This discussion shows that manufacturing has lost some of its importance in modern economic growth. This has led some authors to argue that the services sector or parts of it have replaced manufacturing as the engine of economic growth (Ghani and O’Connell, 2014), or has become an additional engine (Acevedo et al., 2009; Felipe et al., 2009). Several of these studies are based on the experience of India, where services, especially ICT-enabled ones, grew tremendously over the last two decades (Chakravarty and Mitra, 2009; Dasgupta and Singh, 2005, 2006; Ghani and Kharas, 2010; Joshi, 2011).
A skeptical view is offered by Rodrik (2014). Following his argument, tradable services such as banking, finance, insurance, and other business services enjoy higher productivity levels than many manufacturing activities, thanks in part to their usage of modern technologies like ICT. They also pay higher salaries and provide workers with more learning opportunities. However, tradable services require skilled labour, a scarce resource in developing countries and one that is difficult to attain because workers leaving the agricultural sector are difficult to train and reallocate in the tradable services sector. Training a farmer to use a machine to produce textiles or steel is easier than training him or her to work in a bank, so manufacturing provides a more readily available employment solution for agricultural workers displaced from their farms due to enhancements in agricultural productivity. Nevertheless, in today’s developing countries, existing excess labour, which can further expand when productivity growth in agriculture frees labour (thereby fostering structural transformation), is employed in non-tradable services, and 31 UNIDO (2013) defines manufacturing-related services as services required for producing and delivering manufacturing products. The report identifies business services as most closely linked to manufacturing production, followed by trade, financial intermediation, and inland transportation services. Hotels and restaurants, and air and water transportation show the weakest link to manufacturing, and activities such as real estate, post and telecommunications, and auxiliary transportation show a low linkage.
56
especially in activities such as retail trade, restaurants, or hotels. Non-tradable services are very good at absorbing labour, but their opportunities for productivity enhancements are limited. Moreover, while these services could also benefit from technological progress, they are naturally constrained by the size of the domestic market. In manufacturing, by contrast, even small developing countries can devise export-led industrial strategies that can sustainably spur manufacturing and economic growth. For the reasons explained above, services require productivity growth in the rest of the economy in order to sustain economic growth.
To conclude, as Rodrik (2013a: 171) has stated in another of his studies: “Economic activities that are good at absorbing advanced technologies are not necessarily good at absorbing labor.” This is exactly the trade-off that we observe in the services sector, where services that can absorb technologies (tradable services) are not good at absorbing employment, and services that are good at absorbing employment (non-tradable services) cannot absorb technology in the same fashion. This explains why, according to Rodrik (2014) it is difficult to imagine that a services-led model can deliver rapid growth and good jobs in the way that manufacturing did in the past.
4 Structural transformation and development
This section looks at how the composition of production affects various aspects of social and human development. As Kuznets (1966) noted almost 50 years ago, structural change brings pervasive social transformations such as higher urbanization and secularization, as well as demographic transitions towards low fertility rates. Today, improved life expectancy in both developed and developing countries has created the phenomenon of the aging population (UNCTAD, 2013c). While these are all great achievements and create important opportunities for any developing country, they also pose a great deal of challenges such as those related to rural migration, urban planning, and social spending. Box 6 provides a short review of some of the modern social issues related to the processes of structural transformation discussed in this module. In this section, we will briefly review the existing literature on the role of structural transformation in employment generation and reduction of poverty and inequality. We will then move to the analysis of the relationship between structural transformation and human development, defined in terms of progress towards the Millennium Development Goals.
Box 6: Structural transformation and demographic and labour market changes
Several other changes have occurred in parallel with the process of structural transformation: (a) a rise in the participation of women in the labour force, (b) rural-urban migration, (c) international migration, and (d) declining fertility rates. Each of these processes has in turn had an impact on household incomes as well as on the distribution of income. Over a decade, from 1997 to 2007, the participation of women in paid work in the global economy increased by 18 per cent. Combined with slower capital accumulation, this has meant an increase in the relative abundance of labour, resulting in downward pressure on real wages. Rural-urban migration can have positive and negative effects. It can be a source of remittances to rural areas (which is also true for international migration), thus contributing to rural development and a rise in rural household incomes. On the other hand, it can exacerbate social and economic challenges in cities, especially when the rate of migration exceeds the rate of urban job creation, leading to an increase in the surplus of urban labour and therefore to pressures on urban incomes (Lall et al., 2006; Todaro, 1980; on rural-urban migration trends in least developed countries (LDCs), see UNCTAD, 2013c). By comparison, international migration should have the opposite effect, since it decreases labour supply.
57

Nonetheless, this effect is nullified if international migration involves skilled labour, which can have an adverse effect on the productive capacity of the developing countries from which that skilled labour is emigrating.
Migration has also been accompanied by a steady growth in remittances, especially towards middle-income countries. For example, in Viet Nam in 2005 remittances accounted for US$5.5 billion, while official development assistance and foreign direct investment accounted for US$3 billion each. Remittances can be a source of foreign exchange at the country level and an additional source of income at the household level. They can also increase tax receipts, contributing to the financing of public policies. If the country from which remittances come faces a different business cycle than the one that the receiving country faces, remittances can become a source of counter-cyclical development finance. Despite the general optimism with the increased flow of remittances to developing countries, however, the impact of this flow on the receiving economy depends, among other things, on whether the country manages to avoid remittance dependency.
Source: Authors, based on UNRISD (2010).
4.1 Structural transformation, employment and poverty
Structural transformation has clear implications for employment growth and poverty reduction. Lavopa and Szirmai (2012) distinguish three ways in which economic growth affects employment and poverty: a direct impact, an indirect impact, and an induced impact. A direct impact can result from the creation of new jobs or the reallocation of workers. In the case of new jobs, previously unemployed people are employed, therefore the effect on employment and income is straightforward. In the case of reallocation of workers, provided that workers move from lower- to higher-productivity sectors and that wages reflect productivity levels, economic growth will reduce poverty. The indirect impact of economic growth on employment and poverty depends on the strength of the linkages between the growing sector and the rest of the economy: the stronger the linkages, the larger the impact. Growth in the rest of the economic activities in turn further creates employment, productivity, and income growth, thereby creating multiplying effects. This is the induced impact, as defined by Lavopa and Szirmai (2012).
Moving to the empirical literature on the relationship between structural transformation, employment, and poverty, some studies used the decomposition analysis discussed in Section 3.2.2 to investigate the relationship between structural change and employment generation. These studies are concerned with the social dimension of economic growth and with the idea that economic growth alone is not enough to deliver development because it needs to be accompanied by employment generation. Following these ideas, Pieper (2000) defines the “socially necessary rate of growth” as that which delivers both productivity and employment growth. In particular, growth patterns are defined as socially sustainable if labour productivity growth and employment growth rates are equal or above 3 per cent. The author notes that economies that have followed socially sustainable patterns (Indonesia, the Republic of Korea, Malaysia, and Thailand) have also enjoyed high output growth, led by growth in manufacturing.
The definition of a “socially necessary rate of growth” as proposed by Pieper (2000) uses employment growth as a measure of employment generation and does not take into account the trends of higher participation rates in many developing countries (e.g. due to stronger participation of women in the labour force). As a consequence, if an economy generates jobs at a
58

rate of 3 per cent, but the labour force increases faster than the rate of employment growth, the number of jobs created might not be enough to guarantee social inclusion. This is likely to occur in developing countries where labour forces grow rapidly (also due to demographic trends), requiring constant creation of new job opportunities. Finally, looking at employment trends might not be enough to capture the employment problem of many developing economies where individuals cannot afford the “luxury” of being unemployed, preferring underemployment and low-quality employment (UNCTAD, 2013c). In these cases, underemployment growth would contribute to employment growth, inflating the employment figure without guaranteeing adequate income to workers. It has been noted that the greater participation of developing economies in global manufacturing trade has increased the supply of labour-intensive manufactures, thus lowering market prices and consequently wages (UNCTAD, 2002, 2005, 2010). By lowering the purchasing power of workers, low wages do not allow domestic demand to sustain manufacturing growth, which also limits further employment growth. Even technological change (which can allow for expansion of production) might have negative effects on employment, owing to its labour-saving nature. Due to these dynamics, the link between GDP growth and employment growth is weaker in developing than in developed economies (UNCTAD, 2010).
Kucera and Roncolato (2012) also note the existence of a trade-off between labour productivity growth and employment generation, which would imply that achieving social sustainability as defined by Pieper (2000) is very difficult. The authors compare employment growth with growth of the workforce and show that some developing regions, especially in Asia, experienced “jobless growth”, meaning that economic growth was not accompanied by employment expansion. In line with the idea that labour productivity growth and employment creation are difficult to achieve at the same time, the paper finds that wholesale and retail trade and restaurants and hotels contribute the most to employment growth in developing countries. They are however also those with the lowest contributions to aggregate labour productivity growth. This research confirms what we discussed already in Section 3.3, which is easily summarized by Rodrik’s (2013a) conclusion that economic activities good at absorbing technologies are often poor in absorbing labour, thereby creating a trade-off between productivity enhancements and employment generation.
Using the Divisia index presented in Box A1 in the annex of this module, UNCTAD (2014b) offers a detailed analysis of the structural transformation patterns of least developed countries (LDCs) from 1990 to 2012 (for more details, refer to the annex at the end of this module). UNCTAD (2014b) investigates the contributions of direct productivity and reallocation effects to aggregate labour productivity, also distinguishing their sectoral contributions. One of the crucial findings of this analysis is that in LDCs, the agricultural sector greatly contributes to aggregate productivity growth. Productivity gains in agriculture are especially important for developing countries because of the large numbers of workers employed and because their output (food and food-related items) represents the highest share of the average consumption basket. Rapid productivity growth in agriculture activates structural transformation by freeing labour that becomes redundant in the presence of modern machinery, and allows it to move to activities with higher levels of productivity. This has led some authors to argue that increasing productivity in the agricultural sector by moving from subsistence to commercial agriculture and higher-value-added crops should be a prominent element in economic policymaking (Szirmai et al., 2013; UNCTAD, 2013c, 2015c).
59
Clearly, socially sustainable economic growth is also important for poverty reduction: poverty can only be alleviated if benefits of economic growth are shared among a large portion of the population through employment. Some studies have explicitly investigated the role of different growth patterns for poverty. Cross-country studies find that in poorer economies, growth in agriculture has the most sizable effect on poverty reduction. At higher income levels, the role of agriculture in poverty reduction becomes less pronounced, while secondary sectors gain importance (Christiansen and Demery, 2007; Hasan and Quibria, 2004). Other studies have focused on specific countries. For example, Ravallion and Datt (1996) analyse the role of structural change in poverty in India from 1951 to 1991. The authors split output into three sectors: the primary sector (agriculture and mining), the secondary sector (manufacturing, construction, and utilities), and the tertiary sector (services). They empirically test if poverty reduction is associated with output growth in any of these sectors. They find that poverty reduction, both rural and urban, is associated more with output growth in the primary and tertiary sector than in the secondary sector. Ravallion and Chen (2007) apply this methodology to study the People’s Republic of China from 1980 to 2001. They find that the primary sector reduces poverty the most. In the case of Indonesia from 1984 and 2002, urban services growth had the largest impact on reducing rural poverty, while growth of the industrial sector had only a limited impact on rural and urban poverty reduction (Suryahadi et al., 2009).
Despite this empirical evidence against an important role of the secondary sector in poverty reduction, UNIDO (2015) shows that structural transformation towards manufacturing is positively associated with a number of indicators of social inclusiveness. For example, shows the relationship between the share of employment in manufacturing and the non-poor ratio, computed as one minus the poverty headcount ratio. As the share of manufacturing employment in total employment increases, poverty decreases (the ratio of non-poor increases).32 Lavopa (2015) provides more solid econometric evidence in support of these findings.
32 Note that here we are talking about correlations, without necessarily implying any causality, as it could be argued that poverty reduction is driven and at the same time drives manufacturing expansion.
60

Figure 18: Relationship between manufacturing employment and poverty
Source: UNIDO (2015: 110).
To conclude, structural transformation can benefit the economy beyond its direct effects on economic growth. This is why the objective of economic policies must be to foster productive structural transformation, meaning that the generation of employment in sectors with above-average labour productivity should not come at the expense of their productivity levels.
4.2 Structural transformation and human development
This section presents original empirical work on the relationship between structural transformation and human development. This analysis builds on UNCTAD (2014b) by expanding the initial country coverage and using up-to-date data. The report and this analysis build on the idea that a virtuous process of structural transformation can transform an economy and a society beyond its effects on GDP growth, as higher wages for a larger share of the population allow economies to reduce overall poverty and hunger, and enable families to send their children to school and spend more on their health. Higher wages and rising incomes also allow governments to collect more taxes, which can be used to strengthen institutions, widen social protection measures, and increase expenditure on public services such as education and health. All these measures have evident effects on social and human development.
One way to examine the link between structural transformation and human development is by using the structural transformation component of the Divisia index (see Box A1 in the annex of
61

this module) in relation to progress towards the MDG targets. The analysis is conducted on a sample of 92 countries, including low-, lower-middle, and upper-middle-income countries, from 1991 and 2012. The sample varies by indicator, reflecting data availability and the relevance of a certain development goal for the country.33 The analysis examines whether progress in these areas of human development is correlated with the processes of structural transformation. It focuses on several aspects of human development as captured by progress on the following MDGs: 34
Eradication of extreme poverty and hunger (MDG 1), measured by progress on the proportion of the population living below US$1.25 (2005 PPP) per day;
Achievement of universal primary education (MDG 2), measured by progress on the net enrolment ratio in primary education;
Reduction of child mortality (MDG 4), measured by progress on under-five mortality rates;
Reduction of maternal mortality (MDG 5), measured by progress on maternal mortality ratios;
Environmental sustainability (MDG 7), measured by progress on the proportion of the population with access to a safe drinking water source.
In order to illustrate how decomposition methods work, we now show the results of the decomposition exercise based on the Divisia index decomposition method.35 Figure 19 presents aggregate labour productivity growth decomposed into two of its main components: direct productivity effects and reallocation effects (terms-of-trade effects are not included due to their small values). In line with the results obtained by McMillan and Rodrik (2011) and presented in Section 3.2.2, we find that Asian countries had the highest productivity growth rate. The reallocation component in these countries is also the highest. The other regions experienced positive but modest productivity growth, mainly driven by direct productivity effects rather than reallocation effects.
33 For example, if in 1990 a country had a very high (above 90 per cent) enrolment rate in primary education, the achievement of that MDG has not been considered relevant for that specific country, and so the country has been dropped from that specific analysis. This check has been conducted for all MDG indicators used in this section. 34 These indicators capture only five of the eight MDGs. Moreover, only one indicator per goal is selected. Other indicators could have been picked but the quality of the data was considered better for the indicators that were selected.35 The annex at the end of this module illustrates how students can replicate this sort of analysis.
62
Figure 19: Decomposition of aggregate labour productivity growth by country groups (percentage points)
Source: Authors’ computations based on value-added data from the United Nations National Accounts and on employment data from the International Labour Organization’s Global Employment Trends Dataset (see Box 3).Note: SSA: sub-Saharan Africa; MENA: Middle East and North Africa; LAC: Latin America and the Caribbean; ASIA: all Asian regions; CSEE: Central and Southeastern Europe.
We will now move to the analysis of the link between structural transformation, as measured by the reallocation component of labour productivity growth, and achievement of the MDGs targets. Figure 20 depicts the relationship between the structural transformation and performance on target 1A of MDG 1, i.e. halving the proportion of people whose income is less than US$1.25 a day. It suggests a strong and positive relationship between structural change and poverty reduction, whereby countries that achieved faster transformation (e.g. People’s Republic of China, Bhutan, Cambodia, and Viet Nam) performed better in terms of poverty reduction than those where transformation was slower (e.g. the Democratic Republic of the Congo, Togo, Haiti, and Côte d’Ivoire).
63
Figure 20: Structural transformation and progress in poverty reduction, 1991–2012
Source: Authors' elaboration based on the same data as in Figure 19 for the reallocation effect, and on data from the United Nations website for the Millennium Development Goals indicators (http://mdgs.un.org/unsd/mdg).
A positive albeit less strong relationship is found between structural transformation and achievements in enrolment in primary education as per target 2A of MDG 2. As illustrates, rapidly transforming economies also perform well on this goal, even if progress on schooling seems more difficult to achieve than progress on reducing poverty. Among the best performers are countries such as Cambodia and Lao PDR, but also Ethiopia and Burkina Faso. While in 1997 Cambodia had 83 per cent of its children enrolled in primary education and Lao PDR had 71 per cent, the corresponding figures for Ethiopia were 30 per cent and for Burkina Faso 33 per cent. These numbers indicate how difficult it was for certain developing countries to achieve MDG targets and how structural change can be a powerful driver of improvements in social and human development.
64

Figure 21: Structural transformation and progress in primary education enrolment, 1991–2012
Source: Authors' elaboration based on the same data as in Figure 19 for the reallocation effect, and on data from the United Nations website for the Millennium Development Goals indicators (http://mdgs.un.org/unsd/mdg).
Similar patterns are found for the other MDG targets, suggesting a positive relationship between structural transformation and achievement of those targets. Figure 22 confirms this by showing the reallocation effect component of labour productivity growth on the horizontal axis and the average achievement of MDGs target, computed as the average achievement in the five indicators mentioned above, on the vertical axis.
65
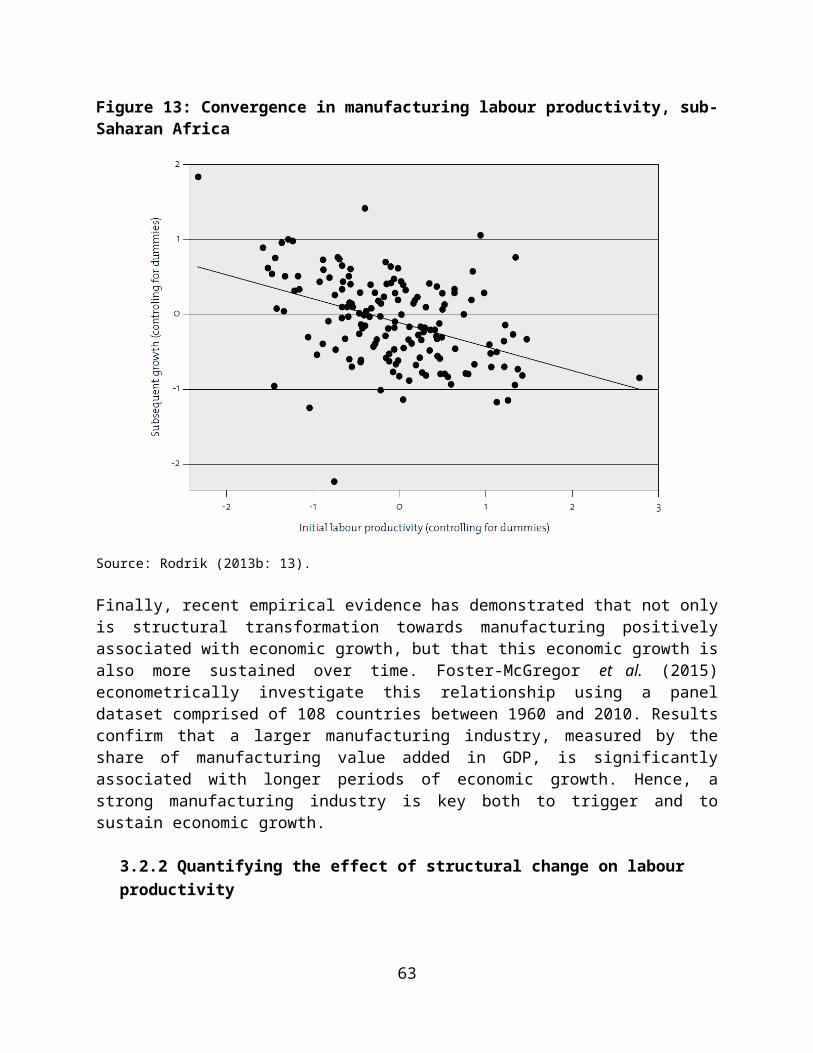
Figure 22: Structural transformation and achievement of Millennium Development Goal targets, 1991–2012
Source: Authors' elaboration based on the same data as in Figure 19 for the reallocation effect, and on data from the United Nations website for the Millennium Development Goals indicators (http://mdgs.un.org/unsd/mdg).
The impact of structural transformation on human development can be further investigated by dividing the sample of countries into dynamic and lagging economies, defined as those with a value of the reallocation component of labour productivity growth above and below the average, respectively, and by comparing the relationship between economic growth and performance on the MDGs in the two groups of countries. With the exception of MDG 4 and 5 (reducing under-five mortality rates and reducing maternal mortality ratios), correlations between economic growth and performance on the MDGs are stronger in dynamic economies than in lagging economies. The largest differences concern poverty reduction (MDG 1) and primary education enrolment (MDG 2). Figure 23 presents the relationship between economic growth and achievement of MDG 1 for dynamic and lagging economies. Countries that benefit from a faster-than-average structural transformation process display a much stronger correlation between GDP growth and poverty reduction than those where transformation has been slower than average. More specifically, the impact of economic growth on poverty reduction has been almost zero in countries where the component of structural transformation in productivity growth has been small. This ultimately means that if countries grow but do not transform their productive structures, their economic growth will not be enough to achieve poverty reduction.
66
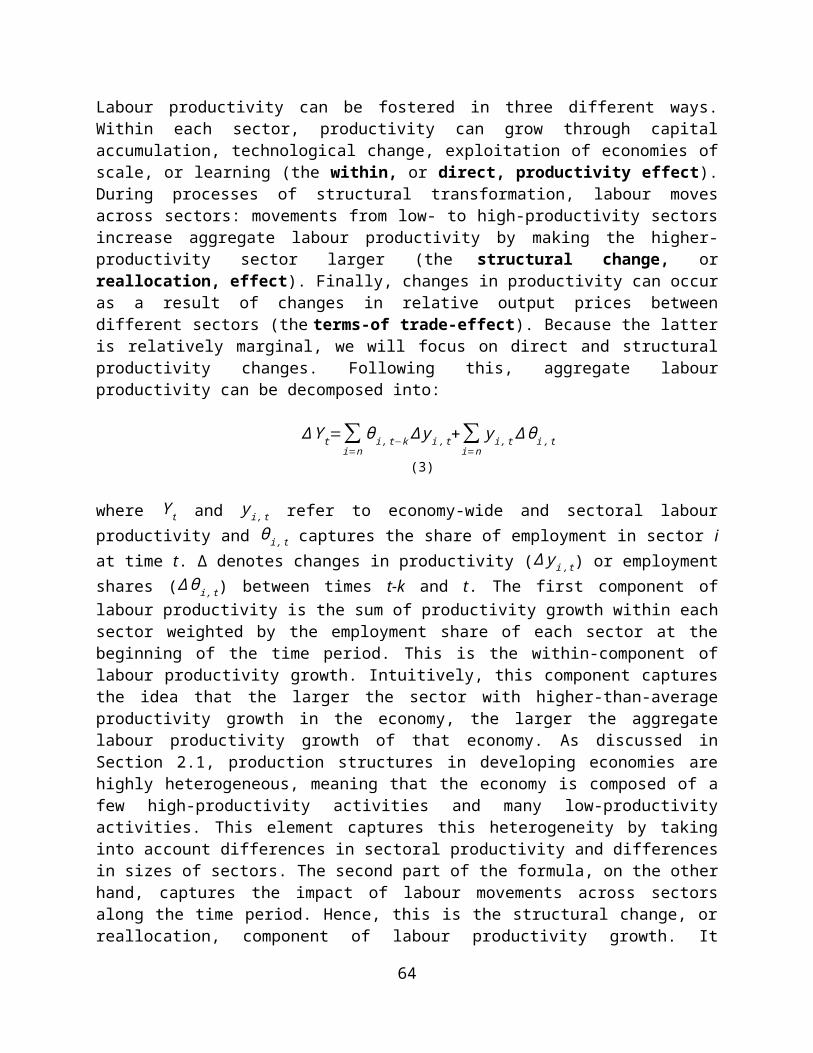
Figure 23: Poverty and growth nexus, dynamic and lagging economies, 1991–2012
Source: Authors' elaboration based on the same data as in Figure 19 for the reallocation effect, and on data from the United Nations website for the Millennium Development Goals indicators (http://mdgs.un.org/unsd/mdg).
Figure 24 shows the differential impact of GDP growth on the achievement of MDG 2, i.e. making primary education universal. While there is a difference between dynamic and lagging economies, this seems to be less strong than in the case of poverty reduction. Nevertheless, in the case of dynamic economies, the association between economic growth and improvements in education is positive. In the case of lagging economies, on the other hand, it is negative. These results indicate that structural transformation can help growing economies by creating conditions for people to access education and benefit from education through better job opportunities. This might happen because in more industrialized economies, productive activities agglomerate in urban areas where governments find it easier to provide basic education, or because through structural transformation more skills become necessary, giving parents and children more incentives to attain basic education.
67
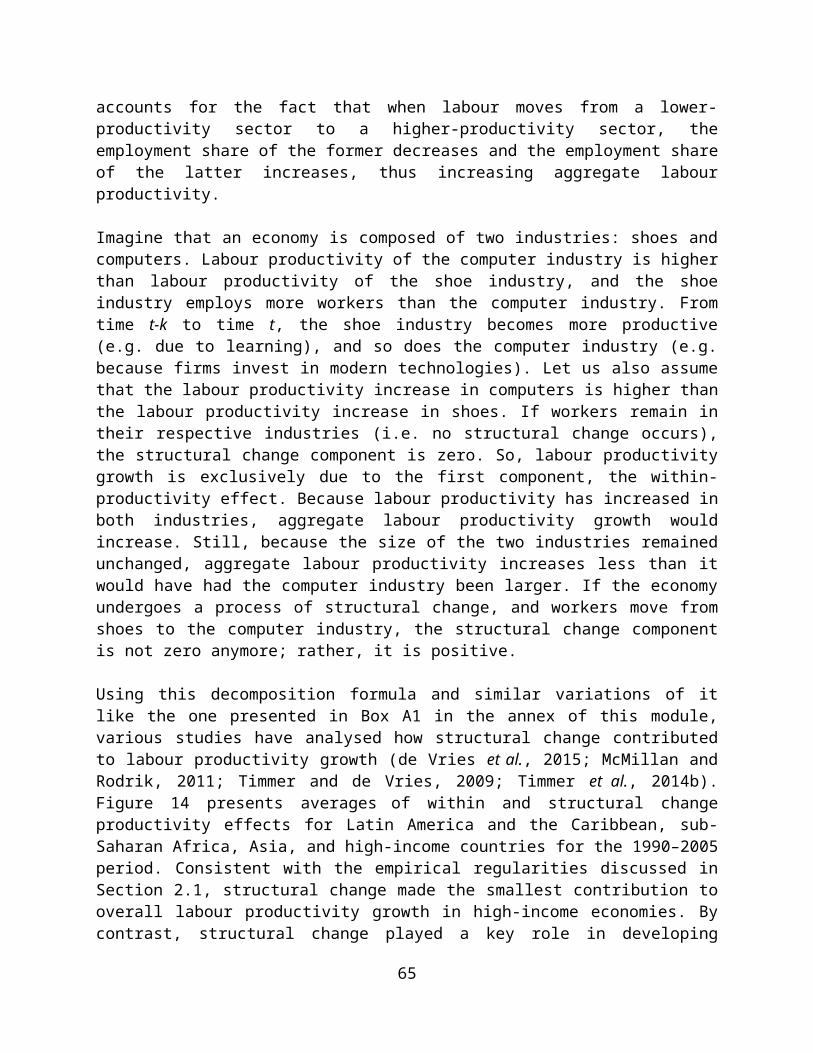
Figure 24: Education and growth nexus, dynamic and lagging economies, 1991–2012
Source: Authors' elaboration based on the same data as in Figure 19 for the reallocation effect, and on data from the United Nations website for the Millennium Development Goals indicators (http://mdgs.un.org/unsd/mdg).
To conclude, this simple analysis suggests that economic growth by itself is not enough to achieve the MDGs and improve human development indicators. Many developing countries have achieved high or modest rates of economic growth in recent decades without making improvements in poverty reduction, inequality, or other social indicators.
Angola and Cambodia are two illustrative examples. Angola’s GDP grew by 3.2 per cent annually in the period from 1991 to 2012 and its labour productivity growth was 0.69 per cent. Based on our decomposition of labour productivity growth, this increase in labour productivity was due to direct productivity effects, while reallocation effects were negative. Angola had a rather low performance in MDG targets: its best result was achieved in primary education enrolment, on which it almost reached the MDG target of 100 per cent. During recent decades, Angola did not manage to diversify away from oil production, which still represents more than 90 per cent of Angolan exports. While oil guaranteed rapid economic growth, economic growth alone could not translate into more and better jobs and prosperity for all. By contrast, in a highly transformative economy such as the Cambodian one, economic and productivity growth have been accompanied by processes of structural change that led to impressive improvements along all the dimensions of human development investigated here. These findings support the idea that economic growth can improve the living conditions of the most vulnerable segment of society if accompanied by fast structural transformation processes.
5 Conclusions
This module has examined the process of structural transformation that accompanies and fosters socio-economic development. We presented the main ideas on which our approach is based and the most widely accepted stylized facts using historical evidence for today’s industrialized economies and more recent data for a larger sample of both developed and developing countries.
68

We also showed that structural transformation is associated with economic growth, especially when directed towards industry and manufacturing.
The module stressed that productive structural transformation relies on both horizontal and vertical evolution, and that both diversification and technological upgrading are therefore essential to sustain economic growth. While undoubtedly affected by endowments, the potential for diversification and upgrade is critically influenced (and shaped) by policy decisions. These decisions are the subject of Module 2 of this teaching material.
The module also reviewed some of the key insights from different strands of the theoretical and empirical literature on structural transformation. The literature review included a discussion on how empirical studies have decomposed labour productivity growth in order to disentangle the effect of structural transformation. Applying this methodology to a large number of countries over the last 25 years, we empirically examined the relationship between structural transformation and human development.
The key messages of this module include:
Sustained economic growth is associated with higher output and employment shares of secondary and tertiary sectors, and especially with an expanding manufacturing industry;
Sustained economic growth requires both efficiency gains and changes in the economic structure;
Manufacturing is the engine of productivity growth, while the services sector is the main source of employment;
Productivity gains in agriculture are necessary to sustain economic growth, structural transformation, and poverty reduction;
Structural transformation processes have pervasive effects on the economy and the society as a whole, affecting economic growth, poverty reduction, and social and human development;
Instead of pursuing economic growth, countries should aim at economic growth with structural and productive transformation, meaning that productivity enhancements within sectors cannot come at the expense of job creation. This maximizes the impact of structural transformation on poverty reduction; and
Economies that experienced faster structural transformation processes could also achieve more progress in attaining the MDGs.
69

6 Exercises and questions for discussion
Exercise No. 1: Structural transformation trends and economic growth
(a) Choose an economy to study and get the following data for this economy: real value added by economic sector and GDP per capita from the UN National Accounts, and employment by economic sector from the ILO’s Key Indicators of Labour Markets (see Box 3). Aggregate the data for this economy into three main sectors: agriculture, industry, and services.
(b) Using the formulas presented in Box 3 and a spreadsheet software such as MS Excel, compute the shares of output and employment for each of the three sectors for the period for which data are available.
(c) Analyse the evolution of the employment and output structure of this particular economy.
(d) Analyse the statistical association between income per capita and measures of economic structure using UNCTAD (2014b) as a guide. To this end, students may construct simple graphs called scatterplots between annual GDP per capita (on the horizontal axis) and annual sectoral shares of employment and output (on the vertical axis). They may also compute correlation coefficients between annual GDP per capita and annual shares of employment or output for each sector. Can students identify any significant associations between GDP per capita and indicators of economic structure? Discuss.
Question 1 for discussion: Theoretical perspectives on structural transformation
This activity is based on Ocampo (2005) and Lin (2011).
(a) After reading these two articles, students should:
Identify three main ideas that characterize each of these perspectives; Discuss how each of these perspectives views and uses the concept of comparative
advantage in its analysis of structural transformation; Discuss the methodological issues researchers face when they try to analyse causal
linkages between economic growth and variables such as productivity growth, physical and human accumulation, institutions, and economic policies;
Discuss the concept of complementarities that appears in Ocampo (2005) and provide examples;
Discuss the types of structural transformation processes identified by Ocampo (2005) based on the interaction between the learning process and complementarities.
(b) Two groups of students (3-4 students each) should debate similarities and differences between old structuralist and more recent perspectives.
Question 2 for discussion: Empirical studies on structural transformation
70
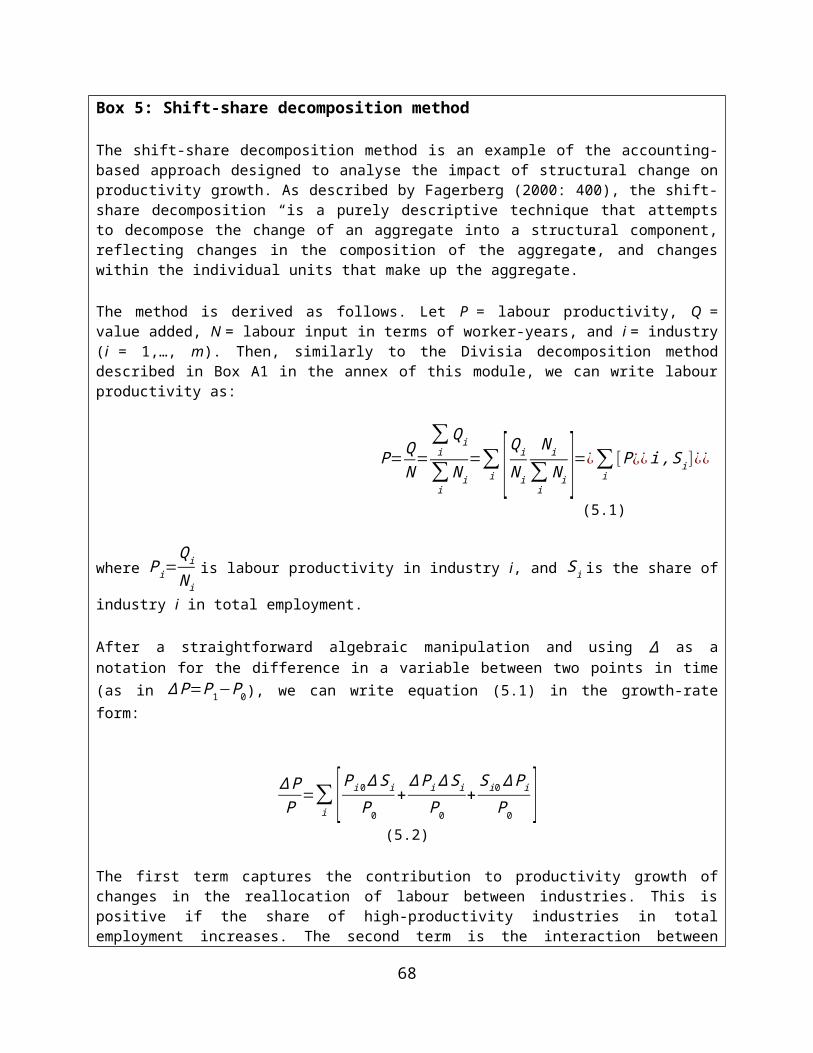
(a) This activity is based on Lavopa and Szirmai (2012), who provide a comprehensive review of the literature on the contributions of manufacturing to economic growth, employment creation, and poverty reduction. Students should read the paper and address the following issues:
Define the three channels through which growth in manufacturing output affects economic growth, employment, and poverty according to the analytical framework proposed by Lavopa and Szirmai (2012). Discuss the main factors and mechanisms of each of these three channels.
The paper reviews several studies that econometrically test Kaldor’s laws. Discuss the main findings of the literature and present in detail the findings of one of the papers reviewed by Lavopa and Szirmai (2012) to the class.
Summarize the findings of the empirical literature on direct, indirect, and induced effects of manufacturing on employment generation. Discuss why employment multipliers (for expansion of manufacturing activities) found by micro-based studies are so much higher than those found by macro-based studies.
Discuss the methodology used in the literature to estimate sectoral poverty elasticity of growth. What are the main findings on the relationship between structural change and poverty reduction?
(b) Several recent papers (Ghani and Kharas, 2010; Ghani and O’Connell, 2014) challenge the view that manufacturing is the main engine of economic growth (see Section 3.3). Two small groups of students should first present the findings of this literature. This would be followed by a debate of its main arguments.
(c) This activity is based on Palma (2005). Students should read the article and answer the following questions:
What are the main sources of deindustrialization and what is the method that the author uses to quantify them?
What are the factors that may cause the Dutch disease in an economy? What does the author mean by "policy-induced Dutch disease"? How has the process of industrialization differed between Southeast Asian economies
such as the Republic of Korea, Singapore, or Taiwan Province of China, and countries in Latin America and the Caribbean such as the Dominican Republic, El Salvador, Honduras, and Mexico?
Exercise No. 2: Structural transformation trends and economic growth
This activity is based on Chapter 4 of UNCTAD (2014b), which presents a methodology that allows researchers to identify the contribution of each economic sector to aggregate productivity growth and to the employment-to-population ratio. Students should read this chapter and continue the case study started in Exercise No. 1:
Discuss the meaning of the following concepts: direct productivity growth effect, reallocation effect, and terms-of-trade effect;
71

Analyse the sectoral contributions of agriculture, industry, and services to aggregate labour productivity growth and to employment generation using the Divisia index decomposition method presented in Box A1 in the annex of this module;
What are the main observations with respect to sectoral contributions to aggregate labour productivity growth?
Which economic sector appears to be the main direct contributor to aggregate labour productivity growth?
Which economic sector appears to be the main contributor to the employment-to-population ratio?
72
Annex: An illustration of how to decompose labour productivity growth and discuss empirical results
This annex is based on Chapter 4 of UNCTAD (2014b) and aims to guide students in using the Divisia decomposition method presented in Box A1 to conduct original research on the role of structural transformation. Towards this end, it identifies and discusses the various steps that students need to follow in order to replicate the analysis in Chapter 4 of UNCTAD (2014b). The chapter focuses on LDCs and analyses their structural transformation, output, and employment growth between 1991 and 2012. The analysis is conducted on a comparative basis dividing countries into three main country groups: the group of LDCs, the group of other developing countries (ODCs), and the group of developed countries. As is the case for any analysis of indicators aggregated across economies, the results here are sometimes biased towards economies with significant shares in overall output and employment. Please note that while the methodology applied here is the same as in Section 4.2, the sample of countries differs. Moreover, while UNCTAD (2014b) conducts the analysis using data for agriculture, industry, and services, students can use more disaggregated data, provided that they are available for the country and period that they intend to study. Following UNCTAD (2014b), LDCs are classified here by their export specialization into:
Exporters and producers of food and agricultural goods: Guinea-Bissau, Malawi, Solomon Islands, and Somalia;
Exporters of fuel: Angola, Chad, Equatorial Guinea, South Sudan, Sudan, and Yemen; Exporters of mineral products: Democratic Republic of the Congo, Eritrea, Guinea, Mali,
Mauritania, Mozambique, and Zambia; Exporters of manufactures: Bangladesh, Bhutan, Cambodia, Haiti, and Lesotho; Exporters of services: Afghanistan, Burundi, Comoros, Djibouti, Ethiopia, The Gambia,
Liberia, Madagascar, Nepal, Rwanda, São Tomé and Principe, Timor-Leste, Tuvalu, Vanuatu, and Uganda;
Exporters of a mixed basket of goods: Benin, Burkina Faso, Central African Republic, Kiribati, Lao People’s Democratic Republic, Myanmar, Niger, Senegal, Sierra Leone, Togo, and United Republic of Tanzania.
The analysis is composed of three steps: (1) analyzing the economic situation of the economies under scrutiny; (2) decomposing labour productivity growth; and (3) analysing sectoral contributions to labour productivity growth.
STEP 1: Analysing the economic situation of the selected countries
In the first step of our empirical analysis, we want to know how the selected economies are performing and what their structural characteristics are, i.e. what is their composition of employment and value added by sector and which sectors benefited from structural transformation. Let us start by looking at the annual growth rates of real value added per capita, which is equivalent to real per capita GDP, by groups of countries at constant 2005 prices in US dollars over the 1991–2012 period (Error: Reference source not found). LDCs grew more slowly than the other developing countries. Consistent with the evidence shown in Section 2.1 and 2.4,
73
among LDCs, diversified exporters and economies that specialize in manufactured goods performed better than mineral and fuel exporters and, as expected, considerably better than agriculture exporters.
Figure A1: Average annual growth rates of real value added per capita, 1991–2012 (per cent)
Source: Authors' elaboration based on UNCTAD (2014b).Note: ODCs: other developing countries; LDCs: least developed countries.
We now turn to the description of structural change dynamics in employment and value added. Changes in employment depend on the rate of employment growth, but also on initial conditions and the rate of population growth. Most developing countries are characterized by large shares of the workforce employed in subsistence agriculture and rapid growth in the working-age population. The former characteristic is reflected in the high shares of employment in agriculture in both LDCs and ODCs (Table A1): in LDCs, 74 per cent of the working population was employed in agriculture in 1991, and while that number declined over time, by 2012 agriculture still employed 65 per cent of the working population. A reduction in agricultural employment was more sizable in the ODCs. These figures are especially striking when compared to developed countries, where only 4 per cent of the workforce is employed in agriculture. Moreover, it is worth noting that country groups whose GDP grew the fastest – namely manufacturing exporters and mixed exporters (see Figure A1) – also recorded the fastest (absolute) changes in employment shares. In particular, manufacturing exporters saw a reduction of the agricultural share in total employment of 16 percentage points. Most of these workers went to services, whose share in total employment grew by 15 percentage points, with the other percentage point that left agriculture going into industry. By contrast, sectoral employment compositions of mineral exporters and agriculture exporters changed the least. Finally, in all country groups, workers moving out of agriculture mostly entered the services sector.
74

Table A1: Sectoral composition of employment, 1991–2012 (per cent and percentage points)
Source: UNCTAD (2014b: 64).Note: Figures are expressed in per cent, except for the columns titled “change”, which are expressed in percentage points. Differences between the figures shown and the last column are due to rounding. ODCs: other developing countries; LDCs: least developed countries.
In contrast to employment, the largest output expansion occurred in industry rather than services (Table A2). This should not be a surprise because the services sector is more labour-intensive but less productive than the industrial sector (see Figure 3). This can explain the discrepancy between structural change dynamics when measured in terms of employment and output. Clearly, the combination of a growing share of services employment and a stable share of services output indicates a modest, or even negative, increase in labour productivity in the services sector.
75
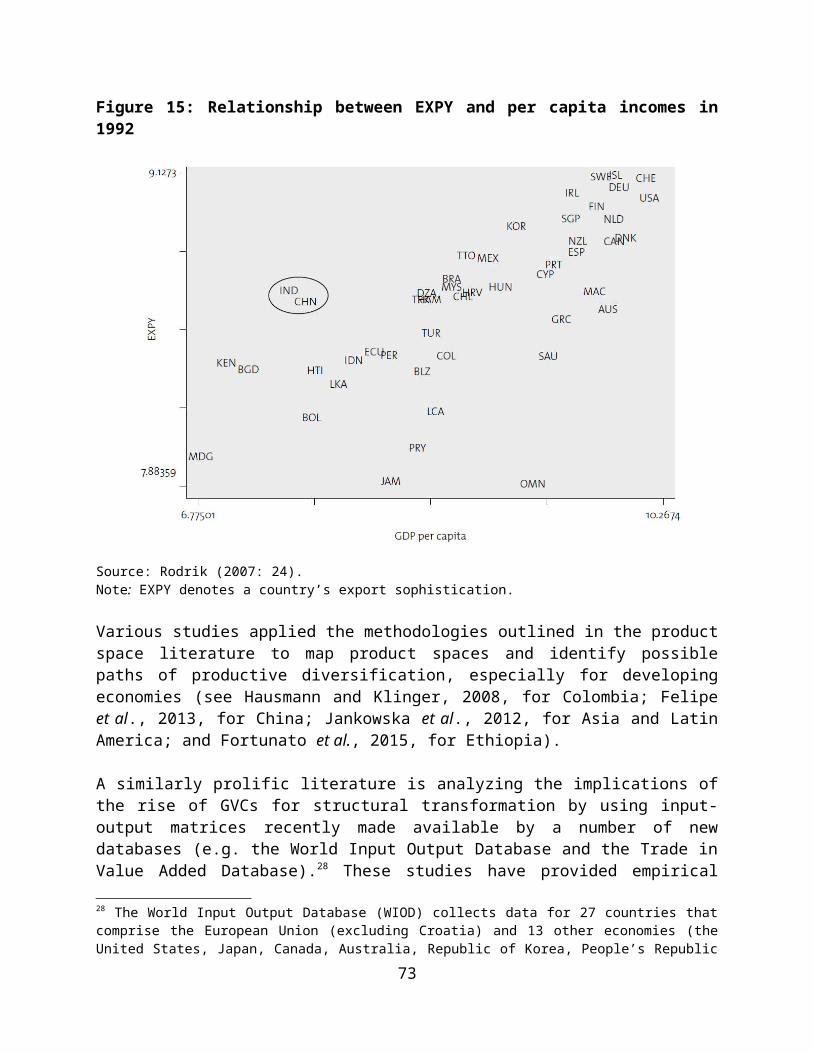
Table A2: Sectoral composition of output, 1991–2012 (per cent and percentage points)
Source: UNCTAD (2014b: 65).Note: Figures are expressed in per cent, except for the columns titled “change”, which are expressed in percentage points. Differences between the figures shown and the last column are due to rounding. ODCs: other developing countries; LDCs: least developed countries.
STEP 2: Decomposing labour productivity growth
We will now try to understand how these structural transformation patterns affected labour productivity growth. In order to do so, we decompose labour productivity growth along its main components applying the Divisia index decomposition method presented in Box A1. Figure A2 reports the results of this exercise. It shows that in all country groups, the reallocation (or structural change) effect is always smaller than the direct productivity (or within) effect. The reallocation effect is the smallest in developed economies, which already underwent their major structural transformation processes. The reallocation effect, however, is smaller in LDCs than in ODCs, pointing to a certain difficulty for LDCs to change their production structures.
76
Figure A2: Decomposition of aggregate labour productivity growth by country groups, 1991–2012 (percentage points and per cent)
Source: Adapted from Chart 27 in UNCTAD (2014b: 73). Note: The direct productivity effect and the reallocation effect are expressed in percentage points, labour productivity growth rate in per cent. ODCs: other developing countries; LDCs: least developed countries.
Figure A3 zooms in on the group of LDCs, following the categorization according to export specializations proposed at the beginning of the annex. Interestingly, exporters of manufactured goods experienced the fastest growth rates of labour productivity, as well as the highest reallocation effects. By contrast, in economies specialized in fuel and extractives, aggregate labour productivity growth was primarily due to direct productivity increases, and in mineral exporting economies, the structural change effect was even negative.
Figure A3: Decomposition of aggregate labour productivity growth in least developed countries, 1991–2012 (percentage points and per cent)
Source: Adapted from Chart 27 in UNCTAD (2014b: 73). Note: The direct productivity effect and the reallocation effect are expressed in percentage points, labour productivity growth rate in per cent.
77
Box A1: The Divisia index decomposition of labour productivity and employment growth
This box presents a method of decomposing aggregate labour productivity and the economy-wide employment-to-population ratio into sectoral contribution effects based on the Divisia index (Sato, 1976). The Divisia index is a “weighted sum of logarithmic growth rates where the weights are the components’ shares in total value” (Ang, 2004: 1133). The first step of the decomposition analysis is to define the aggregate indicator to decompose as a function of factors of interest. We begin with aggregate labour productivity, computed as the ratio of total real value added to total employment. Aggregate labour productivity is a reflection of dynamics within and between sectors.
Let there be n sectors in the economy. Each sector i produces real value added X i(i.e. value of production at constant prices) and employs Li workers. As in Box 3, we define total employment in the economy as
the sum of sectoral employment L=∑i=1
n
Li. Because prices across sectors differ, we cannot calculate total
real value added, X , as the sum of sectoral real value added. Instead, total real value added is computed as the sum of nominal value added in each sector (i.e. at current sectoral prices, Pi) divided by the overall price index P. Hence, aggregate labour productivity can be expressed as follows:
ε= XL
=∑i=1
n
Pi X i
∑i=1
n
P Li
. (A1)
Multiplying equation (A1) by Li / Li allows us to define aggregate labour productivity as the product of three factors:
ε=∑i=1
n
Pi X i
P Li
Li
∑i=1
n
Li
=∑i=1
n
pi εi λi (A2)
where ε=X i
Li stands for sectoral labour productivity, λ i=
Li
L for employment shares and pi=
Pi
P for terms
of trade. Aggregate labour productivity growth can now be decomposed into several contributing factors. Changes in sectoral labour productivity amount to within-productivity effects; changes in the structure of the economy as measured by the labour shares lead to structural change effects; and changes in the terms of trade reflect market structure effects. Assuming that all variables are continuous, differentiating equation (A2) with respect to time, t , and dividing both sides by aggregate labour productivity ε yields:
ln (ε)/dt=∑ θ i [d ln ( p i)/dt +d ln(εi)/dt +d ln(λ i)/dt ]. (A3)
The weight θi is the share of sector i in total nominal value added. Integrating equation (A3) over a time interval [0 ,T ] gives the Divisia decomposition of aggregate labour productivity growth:
78
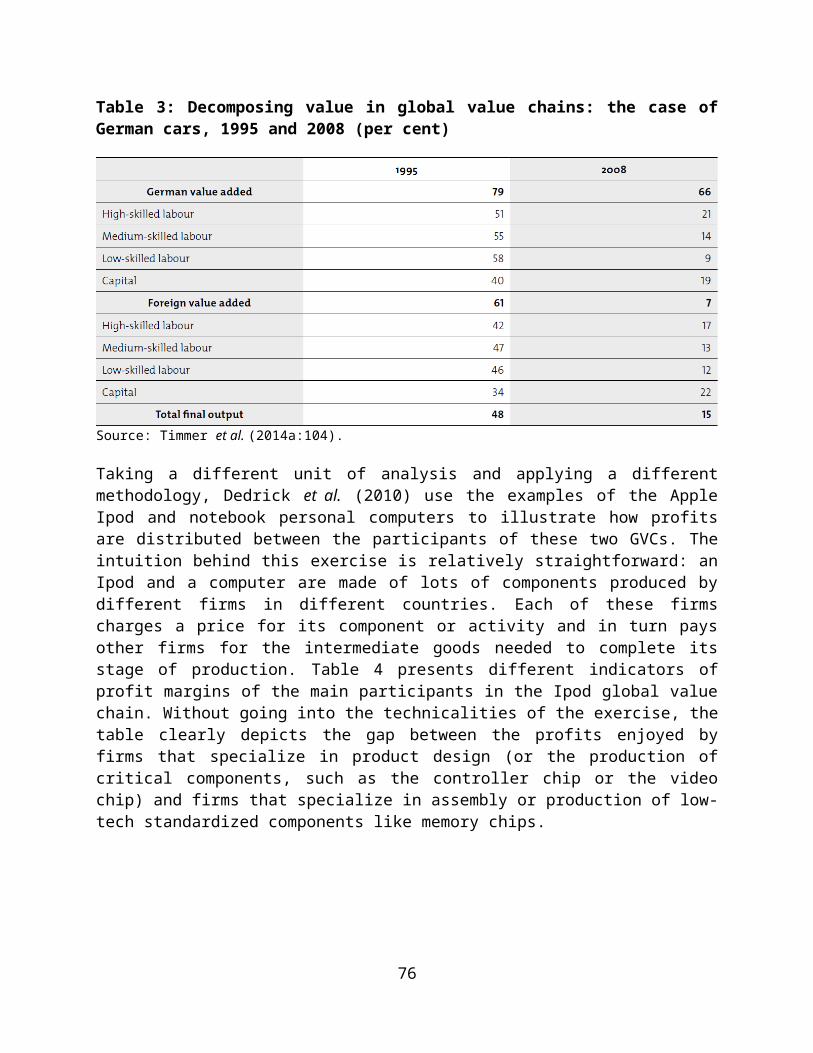
lnεT
ε0=∫
0
t
∑ θi[ d ln ( p i )dt ]+∫
0
t
∑ θi[ d ln (εi )dt ]+∫
0
T
∑ θi[ d ln ( λ i )dt ] . (A4)
Applying the exponential to equation (A4) we get:
Dagg=D∏ ¿ D str D price¿ (A5)
where the components are given by:
D∏ ¿=exp[∫
0
T
∑ θi [d ln(εi)/dt]dt ]¿ (A5.1)
Dstr=exp[∫0
T
∑ θi [d ln ( λi) /dt ]dt ] (A5.2)
D price=exp[∫0
T
∑ θi[d ln( pi)/dt ]dt ]. (A5.3)
To match the discrete format of the data we can write the decomposition in discrete terms:
D∏ ¿=exp[∑ ln (εi)(θi ,0+θi,T )/2] ¿ (A6.1)Dstr=exp[∑ ln (λi)(θi ,0+θ i ,T)/2] (A6.2)D price=exp[∑ ln ( p i)(θ i, 0+θi ,T ) /2]. (A6.3)
Turning to employment generation, a fundamental insight is that a sector creates enough jobs (i.e. creates jobs in excess of its population growth) if its output per capita grows faster than its labour productivity (Ocampo et al., 2009). To see the details we can start with the identity ϕ=L/P where P is the population. Labour productivity in sector i is ε i=X i / Li and sectoral output level per capita is defined by ξ i=X i /P. After simple algebraic manipulation, the employment-to-population ratio can be expressed as ϕ=∑ (ξi/ εi).
Following a similar approach as for aggregate labour productivity, the growth rate of ϕ can be decomposed according to:
lnϕT
ϕ0=∑
i=1
n
[ ln (ξi)−ln(εi)](λ i ,0+λi , T )/2 (A7)
where λ i are the sectoral employment shares. In a multiplicative form, the Divisia index decomposition of the employment-to-population-ratio growth rate is:
Dempl=Dinc
D∏ ¿¿(A8)
where Dinc is the income per capita index, and D∏ ¿ ¿ is the productivity index.
79
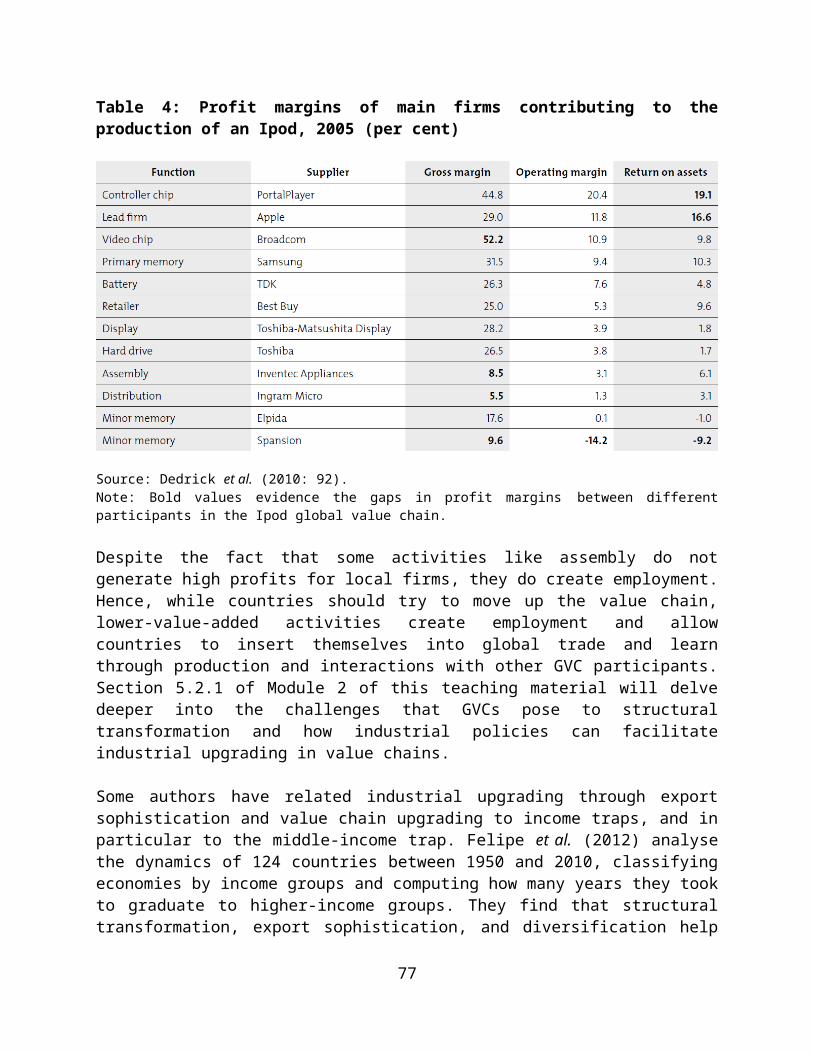
Source: Authors.
STEP 3: Analysing sectoral contributions to labour productivity growth
We now know that productivity growth is mainly due to direct productivity effects rather than reallocation effects. But which sectors contribute the most to this productivity growth? The third and last step of this analysis answers this empirical question. Before delving into the analysis, it is important to clarify two aspects of the decomposition method used here. First, the index assigns a negative reallocation effect to a sector whenever there is a decline in its share of employment. If workers transfer from a low- to a high-productivity sector, the (positive) reallocation effect observed for the high-productivity sector is, in absolute terms, above the (negative) reallocation effect observed for the low-productivity sector. Hence, the reallocation effect at the aggregate level will be positive. In this case, we can say that the process of structural change has benefitted the economy. Second, reallocation and direct productivity effects by sectors must be analysed concomitantly, since employment and labour productivity are closely related to each other. For example, a rise in employment in a sector can cause a decline in its labour productivity if output does not sufficiently expand. Similarly, a rise in a sector’s labour productivity caused by more capital-intensive modes of production can lead to a decline in employment. These examples suggest that the ideal structural transformation process is the one where high-productivity sectors create many jobs, while also generating strong productivity gains. In Section 2.1, we defined this as productive structural transformation. We are now ready to interpret the results of the analysis.
Direct productivity and reallocation effects by sector are presented in Table A3, while Table A4 shows correlations between aggregate labour productivity growth and its productivity and reallocation components by sector. Several conclusions can be drawn from these two tables. We limit our attention to the most visible ones. Table A4 indicates that labour productivity growth is mostly associated with direct productivity increases and with structural transformation in favour of the industrial sector occurring simultaneously, as suggested by the correlation between direct and aggregate and reallocation and aggregate which are higher in industry than in agriculture and services. This finding corroborates the insights from the literature reviewed in Section 3. In ODCs, the fastest-growing group of countries (see Figure A1), labour productivity in industry added 33.4 percentage points through direct productivity effects and 13.5 percentage points as a result of absorption of labour, leading to the highest aggregate productivity growth (114.2 per cent). The group with the second-highest aggregate productivity growth is the group of LDC manufacturing exporters, followed closely by LDC mixed exporters.
Another group of countries that registered high aggregate productivity growth, namely the group of LDC fuel exporters, achieved labour productivity enhancements mainly through direct effects within industry, with lower reallocation effects. A similar pattern characterizes the LDC mineral exporters, with even lower reallocation effects. This result can be explained by three factors. First, extractive industries are very capital-intensive. A more advanced machine, for example, can therefore increase labour productivity by facilitating the production of more output with the same amount of labour. This would explain the generally high direct productivity effects in industry. Second, due to their high capital intensity, resource-intensive industries are characterized by above-average labour productivity, meaning that a movement away from these
80
industries is likely to reduce, rather than enhance, aggregate labour productivity. Finally, as mentioned in Section 2.1, structural transformation is more difficult in resource-abundant economies, reducing the chances of productive structural transformation.
81
Table A3: Sectoral contributions to aggregate labour productivity growth, 1991–2011 (percentage points and per cent)
Source: Adapted from Table 15 in UNCTAD (2014b: 74).Note: Direct productivity effects and reallocation effects are expressed in percentage points, aggregate productivity growth in per cent. ODCs: other developing countries; LDCs: least developed countries.
Table A4: Correlation analysis of aggregate labour productivity growth and its components
Source: UNCTAD (2014b: 77).
82

References
Acemoglu D, Johnson S, and Robinson JA (2001). The colonial origins of comparative development: An empirical investigation. The American Economic Review 91(5): 1369–401.
Acevedo A, Mold A, and Perez E (2009). The sectoral drivers of economic growth: A long-term view of Latin American economic performance. Cuadernos Economicos de ICE 78: 1–26.
AfDB, OECD, and UNDP (2014). African Economic Outlook 2014. Paris. OECD Publishing.
AfDB, OECD, UNDP, and ECA (2013). African Economic Outlook 2013. Paris. OECD Publishing.
Aghion P, and P Howitt (1992). A model of growth through creative destruction. Econometrica 60(2): 323–51.
Amsden A (1989). Asia’s Next Giant: South Korea and Late Industrialisation. Oxford University Press. New York.
Andersen AD, Johnson BH, Marín A, Kaplan D, Stubrin L, Lundvall BÅ, and Kaplinsky R (2015). Natural resources, innovation and development. Aalborg Universitetsforlag. Available at http://vbn.aau.dk/en/publications/natural-resources-innovation-and-development%28bc247a12-54fc-46cc-a079-9011b0bbe45b%29.html.
Ang BW (2004). Decomposition analysis for policymaking in energy: Which is the preferred method?. Energy Policy 32(9): 1131-1139.
Astorga R, Cimoli M, and Porcile G (2014). The role of industrial and exchange rate policies in promoting structural change, productivity and employment. In: Salazar-Xirinachs JM, Nübler I, and Kozul-Wright R, eds. Transforming Economies: Making Industrial Policy Work for Growth, Jobs and Development. International Labour Organization. Geneva: 79–111. Available at http://www.ilo.org/wcmsp5/groups/public/---dgreports/---inst/documents/publication/wcms_315668.pdf
Auty RM (1990). Resource-based Industrialization: Sowing the Oil in Eight Developing Countries. Clarendon Press. Oxford, United Kingdom.
Auty RM (1993). Sustaining Development in Mineral Economies: The Resource Curse Thesis. Routledge. London and New York.
Baldwin R (2012). Trade and industrialisation after globalisation’s second unbundling: How building and joining a supply chain are different and why it matters. In: Feenstra R, and Taylor A, eds. Globalization in an Age of Crisis: Multilateral Economic Cooperation in the Twenty-First Century. University of Chicago Press. Chicago: 165–212.
83
Banga R (2013). Measuring value in global value chains. UNCTAD Background Paper No. RVC -8. United Nations Conference on Trade and Development. Geneva.
Banga R, Kumar D, and Cobbina P (2015). Trade-led regional value chains in sub-Saharan Africa: Case study on the leather sector. Commonwealth Trade Policy Discussion Paper 2015/02. Commonwealth Secretariat, London.
Baumol WJ (1967). Macroeconomics of unbalanced growth: The anatomy of urban crisis. The American Economic Review 57: 415–26.
Baumol WJ, and Bowen WG (1966). Performing Arts, the Economic Dilemma: A Study of Problems Common to Theater, Opera, Music, and Dance. Twentieth Century Fund. New York.
Baumol WJ, Blackman SAB, and Wolff EN (1985). Unbalanced growth revisited: Asymptotic stagnancy and new evidence. The American Economic Review 75(4): 806–17.
Bielschowsky R (2009). Sixty years of ECLAC: Structuralism and neo-structuralism. CEPAL Review 97: 171–92.
Bresser-Pereira L (2012). Structuralist macroeconomics and the new developmentalism. Revista de Economia Política 32(128): 347–66.
Chakravarty S, and A Mitra (2009). Is industry still the engine of growth? An econometric study of the organized sector employment in India. Journal of Policy Modeling 31(1): 22–35.
Chandrasekhar CP (2007). Unravelling India’s growth transition. Macroscan. 11 February. Available at http://www.macroscan.com/cur/nov07/cur021107transition.htm.
Chang PK (1949). Agriculture and Industrialization: The Adjustments that Take Place as an Agricultural Country Is Industralized. Harvard University Press. Cambridge, MA.
Chenery H, Robinson S, and Syrquin M (1986). Industrialisation and Growth. A Comparative Study. Oxford University Press. New York. Available at http://documents.worldbank.org/curated/en/1986/10/17058492/industrialization-growth-comparative-study.
Christiaensen L, and Demery L (2007). Down to Earth: Agriculture and Poverty Reduction in Africa. World Bank. Washington, DC. Available at http://documents.worldbank.org/curated/en/2007/01/7420086/down-earth-agriculture-poverty-reduction-africa.
Cimoli M (2005). Structural heterogeneity, technological asymmetries and growth in Latin America. MPRA Paper No. 3832. Munich Personal RePEc Archive. Available at https://mpra.ub.uni-muenchen.de/3832/1/MPRA_paper_3832.pdf.
84
Collier P (2007). The Bottom Billion: Why the Poorest Countries Are Failing and What Can Be Done about It. Oxford University Press. Oxford, United Kingdom.
Cornwall J (1977). Modern Capitalism: Its Growth and Transformation. Martin Roberston. London.
Cripps TF, and Tarling RJ (1973). Growth in advanced capitalist economies, 1950-1970. Cambridge Occasional Paper 40. Cambridge University, Cambridge, United Kingdom.
Dasgupta S, and Singh A (2005). Will services be the new engine of Indian economic growth? Development and Change 36(6): 1035–057.
Dasgupta S, and Singh A (2006). Manufacturing, services and premature de-industrialization in developing countries. Centre for Business Research Working Paper No. 327. Cambridge University, Cambridge, United Kingdom.
De Backer K, and Miroudot S (2013). Mapping global value chains. OECD Trade Policy Paper No. 159. OECD Publishing. Paris. Available at http://dx.doi.org/10.1787/5k3v1trgnbr4-en.
Dedrick J, Kraemer KL, and Linden G (2010). Who profits from innovation in global value chains? A study of the iPod and Notebook PCs. Industrial and Corporate Change 19(1): 81–116.
De Vries G, Timmer M, and de Vries K (2015). Structural transformation in Africa: Static gains, dynamic losses. The Journal of Development Studies 51(6): 674–88.
Domar E (1946). Capital expansion, rate of growth, and employment. Econometrica 14(2): 137–47.
Dosi G (1982). Technological paradigms and technological trajectories. Research Policy 11: 147–62.
Dosi G, Pavitt K, and Soete L (1990). The Economics of Technical Change and International Trade. New York University Press. New York.
Dosi G, Winter S, and Nelson RR (2000). The nature and dynamics of organizational capabilities. Oxford University Press. New York.
Easterly W (2001). The Elusive Quest for Growth: Economists’ Adventures and Misadventures in the Tropics. MIT Press. Cambridge, MA.
Engel E (1857). Die Produktions- und Consumptions Verhältnisse des Königreichs Sachsen. Zeitschrift des Statistichen Bureaus des Königlich Sächsischen Ministeriums des Innern.
Erten B, and Ocampo JA (2012). Super-cycles of commodity prices since the mid-nineteenth century. UN-DESA Working Paper No. 110. United Nations Department of Economic and Social Affairs. New York.
85

Fagerberg J (2000). Technological progress, structural change and productivity growth: A comparative study. Structural Change and Economic Dynamics 11(4): 393–411.
Fagerberg J, and Verspagen B (1999). Modern capitalism in the 1970s and 1980s. In: Setterfield M, ed. Growth, Employment and Inflation. Essays in Honour of John Cornwall. MacMillan Press. London. Available at: https://ideas.repec.org/p/tik/wparch/1999002.html.
Fagerberg J, and Verspagen B (2002). Technology-gaps, innovation-diffusion and transformation: An evolutionary interpretation. Research Policy 31(8-9): 1291–304.
Felipe J (1998). The role of the manufacturing sector in Southeast Asian development: A test of Kaldor’s first law. Journal of Post Keynesian Economics 20(3): 463–85.
Felipe J, and McCombie JSL (2003). Some methodological problems with the neoclassical analysis of the East Asian miracle. Cambridge Journal of Economics 27: 695–721.
Felipe J, Abdon A, and Kumar U (2012). Tracking the middle-income trap: What is it, who is in it, and why? Levy Economics Institute Working Paper No. 715.
Felipe J, Mehta A, and Rhee C (2014). Manufacturing matters…but it’s the jobs that count. Asian Development Bank Economics Working Paper No. 420.
Felipe J, Kumar U, Usui N, and Abdon A (2013). Why has China succeeded? And why it will continue to do so. Cambridge Journal of Economics 37(4): 791–818. Working paper version available at http://papers.ssrn.com/sol3/papers.cfm?abstract_id=1661920.
Felipe J, Leon-Ledesma M, Lanzafame M, and Estrada G (2009). Sectoral engines of growth in developing Asia: Stylized facts and implications. Malaysian Journal of Economic Studies 46(2): 107–33. Working paper version available at http://www.adb.org/publications/sectoral-engines-growth-developing-asia-stylized-facts-and-implications
Fortunato P, and Razo C (2014). Export sophistication, growth and the middle-income trap. In: Salazar-Xirinachs JM, Nübler I, and Kozul-Wright R, eds. Transforming Economies: Making Industrial Policy Work for Growth, Jobs and Development. International Labour Organization. Geneva: 267 –87.
Fortunato P, Razo C, and Vrolijk K (2015). Operationalizing the product space: A road map to export diversification. UNCTAD Discussion Paper No. 219. United Nations Conference on Trade and Development. Geneva.
Foster-McGregor N, Kaba I, and Szirmai A (2015). Structural change and the ability to sustain growth. Background paper prepared for the 2015 Industrial Development Report. United Nations Industrial Development Organization. Vienna. Available at http://www.merit.unu.edu/publications/working-papers/abstract/?id=5886.
86

Frankel JA (2012). The natural resource curse: A survey of diagnoses and some prescriptions. In: Arezki R, Pattillo C, and Min Z, eds. Commodity Price Volatility and Inclusive Growth in Low-Income Countries. International Monetary Fund. Washington, DC.
Freeman C, and Louça F (2001). As Time Goes By: From the Industrial Revolutions to the Information Revolution. Oxford University Press. Oxford, United Kingdom.
Gelb AH (1988). Oil Windfalls: Blessing or Curse? World Bank and Oxford University Press. New York.
Gereffi G (2014). Global value chains in a post-Washington consensus world. Review of International Political Economy 21(1): 9–37.
Gereffi G (2015). Global value chains, development and emerging economies. UNIDO Research, Statistics and Industrial Policy Branch Working Paper 18/2015. United Nations Industrial Development Organization. Vienna.
Gereffi G, and Fernández-Stark K (2011). Global value chain analysis: A primer. Center on Globalization, Governance & Competitiveness (CGGC), Duke University. Durham, NC.
Ghani E, and Kharas H (2010). The service revolution. World Bank Economic Premise 14: 1–5. Available at http://documents.worldbank.org/curated/en/2010/05/12286839/service-revolution
Ghani E, and O’Connell S (2014). Can service be a growth escalator in low income countries?. Policy Research Working Paper 6971. World Bank. Washington, DC. Available at http://documents.worldbank.org/curated/en/2014/07/19877603/can-service-growth-escalator-low-income-countries-can-service-growth-escalator-low-income-countries
Glaeser E, and Shleifer A (2002). Legal origins. Quarterly Journal of Economics 117: 1193–229.
Grossman G, and Helpman E (1991). Innovation and Growth in the Global Economy. MIT Press. Cambridge, MA.
Harrod R (1939). An essay in dynamic theory. The Economic Journal 49(193): 14–33.
Hasan R, and Quibria M (2004). Industry matters for poverty: A critique of agricultural fundamentalism. Kyklos 57: 253–64.
Hausmann R, and Klinger B (2007). Structural transformation and patterns of comparative advantage in the product space. Working Paper No. 128. Centre for International Development, Harvard University, Cambridge, MA.
Hausmann R, and Klinger B (2008). Achieving export-led growth in Colombia, Working Paper Series 08-063. Harvard University, John F. Kennedy School of Government.
87
Hausmann R, Hwang J, and Rodrik D (2007). What you export matters. Journal of Economic Growth 12(1): 1–25.
Hausmann R, Hidalgo CA, Bustos S, Coscia M, Chung S, and Jimenez J (2011). The atlas of economic complexity: Mapping paths to prosperity. Harvard University Center for International Development, Harvard Kennedy School, and Macro Connections, Massachusetts Institute of Technology. Cambridge, MA.
Herrendorf B, Rogerson R, and Valentinyi A (2013). Growth and structural transformation. Paper prepared for the Handbook of Economic Growth. Available at https://www.imf.org/external/np/seminars/eng/2013/SPR/pdf/rrog2.pdf.
Hidalgo C, Klinger B, Barabási A, and Hausmann R (2007). The product space conditions the development of nations. Science 317(5837): 482–87.
Hirschman A (1958). The Strategy of Economic Development. Yale University Press. New Haven, CT.
Hoffmann WG (1958). The Growth of Industrial Economies. Manchester University Press. Manchester, United Kingdom.
Humphrey J (2004). Upgrading in global value chains. ILO Policy Integration Department Working Paper No. 28. International Labour Organization. Geneva.
Humphrey J, and Schmitz H (2002). How does insertion in global value chains effect upgrading in industrial clusters? Regional Studies 36(9): 1017–027.
Humphreys M, Sachs J, and Stiglitz JE (2007). Escaping the Resource Curse. Columbia University Press. New York.
Imbs J, and Wacziarg R (2003). Stages of diversification. The American Economic Review 93(1): 63–86.
Jankowska A, Nagengast AJ, and Perea JR (2012). The product space and the middle-income trap: Comparing Asian and Latin American experiences. OECD Development Centre Working Paper No. 311. OECD Publishing. Paris.
Jones CI (1998). Introduction to Economic Growth. W.W. Norton. New York.
Joshi S (2011). Can IT and ITES be an engine of growth for India: An empirical analysis. World Journal of Science, Technology and Sustainable Development 8(1): 25–39.
Ju J, Lin J, and Wang Y (2009). Endowment structures, industrial dynamics, and economic growth. Policy Research Working Paper 5055. World Bank. Washington, DC.
Kaldor N (1957). A model of economic growth. Economic Journal 67: 591–624.
88
Kaldor N (1966). Causes of the Slow Rate of Economic Growth in the United Kingdom. Cambridge University Press. Cambridge, United Kingdom.
Kaldor N (1967). Strategic Factors in Economic Development. New York State School of Industrial and Labor Relations. Ithaca, NY.
Kaldor N (1968). Productivity and growth in manufacturing industry: A reply. Economica 35(140): 385–91.
Kaplan D (2012). South African mining equipment and specialist services: Technological capacity, export performance and policy. Resources Policy 37(4): 425–33.
Kaplinsky R (2011). Commodities for industrial development: Making linkages work. UNIDO Working Paper 01/2011. United Nations Industrial Development Organization. Vienna.
Kaplinsky R, and Farooki M (2011). How China Disrupted Global Commodities: The Reshaping of the World’s Resource Sector. Routledge. London.
Kaplinsky R, and Farooki M (2012). Promoting industrial diversification in resource intensive economies – The examples of sub-Saharan Africa and Central Asia regions. United Nations Industrial Development Organization. Vienna.
Kathuria V, and Raj R (2009). Is manufacturing an engine of growth in India? Analysis in the post nineties. Paper prepared for the UNU-WIDER/UNU-MERIT/UNIDO Workshop on Pathways to Industrialisation in the 21st Century: New Challenges and Emerging Paradigms, Maastricht, 22–23 October.
Katz J (2000). Structural change and labor productivity growth in Latin American manufacturing industries, 1970–96. World Development 28(9): 1583–596.
Krugman PR (1987). The narrow moving band, the Dutch disease, and the competitive consequences of Mrs Thatcher: Notes on trade in the presence of dynamic scale economies. Journal of Development Economics 27: 41–55.
Krugman PR, Obstfeld M, and Melitz MJ (2012). International Economics: Theory & Policy. Pearson Addison-Wesley. Boston. Available at http://dl1.cuni.cz/pluginfile.php/265896/mod_resource/content/1/Krugman%2C%20Obstsfeld_International%20Economics.pdf.
Kucera D, and Roncolato L (2012). Structure matters: Sectoral drivers of growth and the labour productivity-employment relationship. ILO Working Paper No. 471734. International Labour Organization. Geneva.
Kuznets S (1966). Modern Economic Growth: Rate, Structure and Spread. Yale University Press. New Haven, CT.
89

Kuznets S (1979). Growth and structural shifts. In: Galenson W, ed. Economic Growth and Structural Change in Taiwan. The Postwar Experience of the Republic of China. Cornell University Press. London.
Lall S (1992). Technological capabilities and industrialization. World Development 20(2): 165–86.
Lall SV, Selod H, and Shalizi Z (2006). Rural-urban migration in developing countries: A survey of theoretical predictions and empirical findings. Policy Research Working Paper 3915. World Bank. Washington, DC.
Lavopa A (2015). Technology-driven structural change and inclusiveness: The role of manufacturing. Inclusive and Sustainable Development Working Paper 14/2015. United Nations Industrial Development Organization. Vienna.
Lavopa A, and Szirmai A (2012). Industrialization, employment and poverty. UNU-MERIT Working Paper 2012-081. United Nations University - Maastricht Economic and Social Research Institute on Innovation and Technology. Available at http://www.merit.unu.edu/publications/working-papers/abstract/?id=4831
Lavopa A, and Szirmai A (2014). Structural modernization and development traps: An empirical approach. UNU-MERIT Working Paper 2014-076. United Nations University - Maastricht Economic and Social Research Institute on Innovation and Technology.
Lavopa A, and Szirmai A (2015). Industrialization in time and space. UNU-MERIT Working Paper 2015-039. United Nations University - Maastricht Economic and Social Research Institute on Innovation and Technology.
Lee K (2013). Schumpeterian Analysis of Economic Catch-up: Knowledge, Path-creation, and the Middle-income Trap. Cambridge University Press. Cambridge, United Kingdom.
Lewis WA (1954). Economic development with unlimited supplies of labour. The Manchester School 28: 139–91.
Lin JY (2011). New structural economics: A framework for rethinking development. The World Bank Research Observer 26(2): 193–221. Available at http://elibrary.worldbank.org/doi/pdf/10.1093/wbro/lkr007
Lin JY, and Chang HJ (2009). Should industrial policy in developing countries conform to comparative advantage or defy it? A debate between Justin Lin and Ha-Joon Chang, Development Policy Review 27(5): 483–502.
Lin JY, and Monga C (2010). Growth identification and facilitation: The role of the state in the dynamics of structural change. Policy Research Working Paper 5313. World Bank. Washington, DC.
90
Lin JY, and Treichel V (2014). Making industrial policy work for development. In: Salazar-Xirinachs JM, Nübler I, and Kozul-Wright R, eds. Transforming Economies: Making Industrial Policy Work for Growth, Jobs and Development. International Labour Organization. Geneva: 65–78.
Maddison A (2010). Statistics on world population, GDP and per capita GDP, 1-2008 AD. University of Groningen.
Maizels A (2000). The manufactures terms of trade of developing countries with the United States, 1981–97. Working Paper 36. Oxford University, Queen Elisabeth House. Oxford, United Kingdom.
Malerba F, Nelson R, Orsenigo L, and Winter S (1999). History-friendly models of industry evolution: The computer industry. Industrial and Corporate Change 8: 3–40.
Manyika J, Sinclair J, Dobbs R, Strube G, Rassey L, Mischke J, Remes J, Roxburgh C, and George K (2012). Manufacturing the Future: The Next Era of Global Growth and Innovation. McKinsey Global Institute. New York.
McMillan M, and Rodrik D (2011). Globalization, structural change and productivity growth. In: Bacchetta M, and Jansen M, eds. Making Globalization Socially Sustainable. International Labour Organization. Geneva.
Milberg W, Jang X, and Gereffi G (2014). Industrial policy in the era of vertically specialized industrialization. In: Salazar-Xirinachs JM, Nübler I, and Kozul-Wright R eds. Transforming Economies: Making Industrial Policy Work for Growth, Jobs and Development. International Labour Organization and United Nations Conference on Trade and Development. Geneva.
Minford P, Riley J, and Nowell E (1997). Trade, technology and labour markets in the world economy, 1970–90: A Computable General Equilibrium Analysis. Journal of Development Studies 34(2): 1–34.
Myrdal G (1957). Economic theory and under-developed regions. G. Duckworth. London.
Nelson R, and Winter SG (1982). An Evolutionary Theory of Economic Change. Harvard University Press. Cambridge, MA
Nurkse R (1953). Problems of Capital Formation in Underdeveloped Countries. Oxford University Press. New York.
Ocampo JA (2005). The quest for dynamic efficiency: Structural dynamics and economic growth in developing countries. In: Ocampo JA, ed. Beyond Reforms: Structural Dynamics and Macroeconomic Vulnerability. Stanford University Press and the World Bank: 3–44. Available at https://openknowledge.worldbank.org/handle/10986/7378
91
Ocampo JA (2014). Latin American structuralism and production development strategies. In: Salazar-Xirinachs JA, Nübler I, and Kozul-Wright R, eds. Transforming Economies: Making Industrial Policy Work for Growth, Jobs and Development. International Labour Organization: 79–111. Available at http://www.ilo.org/wcmsp5/groups/public/---dgreports/---inst/documents/publication/wcms_315665.pdf.
Ocampo JA, and Parra MA (2003). The terms of trade for commodities in the twentieth century. CEPAL Review 79(4): 7–35.
Ocampo JA, Rada C, and Taylor L (2009). Growth and Policy in Developing Countries: A Structuralist Approach. Columbia University Press. New York.
Palma G (2005). Four sources of “de-industrialization” and a new concept of the “Dutch-disease.” In: Ocampo JA, ed. Beyond Reforms, Structural Dynamics and Macroeconomic Vulnerability. Stanford University Press. Stanford, CA. Available at https://openknowledge.worldbank.org/handle/10986/7378
Peneder M (2003). Industrial structure and aggregate growth. Structural Change and Economic Dynamics 14(4): 427–48.
Perez C (2008). A vision for Latin America: A resource-based strategy for technological dynamism and social inclusion. GLOBELICS Working Paper No. 08-04.
Pieper U (2000). Deindustrialization and the social and economic sustainability nexus in developing countries: Cross-country evidence on productivity and employment. Journal of Development Studies 36(4): 66–99.
Prebisch R (1950). The economic development of Latin America and its principal problems. United Nations. New York. Reprinted in Economic Bulletin for Latin America 7(1): 1–22.
Priewe J (2015). Seven strategies for development in comparison. In: Calcagno A, Dullien S, Márquez-Velázquez A, Maystre N, and Priewe J, eds. Rethinking Development Strategies after the Financial Crisis: Volume 1. United Nations Conference on Trade and Development and Fachhochschule für Technik und Wirtschaft Berlin.
Ramsey F (1928). A mathematical theory of saving. The Economic Journal 38(152): 543–59.
Ranis G (2012). Labor surplus revisited. Yale University Economic Growth Center Discussion Paper No. 1016. New Haven, CT.
Ranis G, and Fei JCH (1961). A theory of economic development. The American Economic Review 51(4): 533–65.
Ravallion M, and Chen S (2007). China’s (uneven) progress against poverty. Journal of Development Economics 82(1): 1–42.
92

Ravallion M, and Datt G (1996). How important to India’s poor is the sectoral composition of economic growth? The World Bank Economic Review 10(1): 1–25.
Ray AS (2015). The enigma of the “Indian model” of development. In: Calcagno A, Dullien S, Márquez-Velázquez A, Maystre N, and Priewe J, eds. Rethinking Development Strategies after the Financial Crisis: Volume 2. United Nations Conference on Trade and Development and Fachhochschule für Technik und Wirtschaft Berlin.
Redding S (1999). Dynamic comparative advantage and the welfare effects of trade. Oxford Economic Papers 51(1): 15–39.
Rodrik D (2006). What’s so special about China’s exports? NBER Working Paper 11947. National Bureau of Economic Research. Cambridge, MA.
Rodrik D (2007). Industrial development: Some stylized facts and policies. In: Industrial Development for the 21st Century: Sustainable Development Perspectives. United Nations. New York.
Rodrik D (2009). Growth after the crisis. CEPR Discussion Paper 7480. Centre for Economic Policy Research. London.
Rodrik D (2013a). Unconditional convergence in manufacturing. The Quarterly Journal of Economics 128(1): 165–204.
Rodrik D (2013b). Structural change, fundamentals, and growth: An overview. Institute for Advanced Study. Princeton, NJ.
Rodrik D (2014). Are services the new manufactures? Project Syndicate. October 13. Available at https://www.project-syndicate.org/commentary/are-services-the-new-manufactures-by-dani-rodrik-2014-10.
Rodrik D (2016). Premature deindustrialization. Journal of Economic Growth 21: 1–33..
Romer PM (1987). Growth based on increasing returns due to specialization. American Economic Review 77(2): 56–62.
Romer PM (1990). Endogenous technological change. Journal of Political Economy 98(5): S71–102.
Rosenstein-Rodan P (1943). Problems of industrialisation of Eastern and South-eastern Europe, Economic Journal 53: 202–11.
Rowthorn R (1994). Korea at the cross-roads. Economic and Social Research Council Centre for Business Research Working Paper No. 11. University of Cambridge. Cambridge, United Kingdom.
93
Rowthorn R (1997). Replicating the experience of the newly industrialising economies. Economic and Social Research Council Centre for Business Studies Working Paper 57. University of Cambridge. Cambridge, United Kingdom.
Rowthorn R, and Wells JR (1987). De-industrialization and Foreign Trade. Cambridge University Press. Cambridge, United Kingdom.
Sachs JD, and Werner AM (1995). Natural resource abundance and economic growth. NBER Working Paper No. 5398. National Bureau of Economic Research. Cambridge, MA.
Salazar-Xirinachs JM, Nübler I, and Kozul-Wright R, eds. (2014). Transforming Economies: Making Industrial Policy Work for Growth, Jobs and Development. International Labour Organization. Geneva.
Sarkar P, and Singer HW (1991). Manufactured exports of developing countries and their terms of trade since 1965. World Development 19: 333–40.
Sato K (1976). The meaning and measurement of the real value added index. The Review of Economics and Statistics 58(4): 434–42.
Schneider BR (2015). Designing Industrial Policy in Latin America: Business-State Relations and the New Developmentalism. Palgrave Macmillan. New York.
Schumpeter JA (1934). The Theory of Economic Development: An Inquiry into Profits, Capital, Credit, Interest, and the Business Cycle. Harvard University Press. Cambridge, MA.
Silverberg G (2001). The discrete charm of the bourgeoisie: Quantum and continuous perspectives on innovation and growth. Research Policy 31: 1275–289.
Silverberg G, and Verspagen B (1994). Learning, innovation and economic growth: A long-run model of industrial dynamics. Industrial and Corporate Change 3: 199–223.
Singer HW (1950). The distribution of gains between investing and borrowing countries. The American Economic Review 40(2): 473–85.
Solow R (1956). A contribution to the theory of economic growth. Quarterly Journal of Economics 70(1): 65–94.
Starrs S (2014). The chimera of global Convergence. New Left Review 87(May/June): 81–96.
Studwell J (2014). How Asia Works: Success and Failure in the World’s Most Dynamic Region. Grove Press. New York.
Suryahadi A, Suryadarma D, and Sumarto S (2009). The effects of location and sectoral components of economic growth on poverty: Evidence from Indonesia. Journal of Development Economics 89(1): 109–17.
94

Szirmai A (2012). Industrialisation as an engine of growth in developing countries, 1950–2005. Structural Change and Economic Dynamics 23(4): 406–20.
Szirmai A, and Verspagen B (2015). Manufacturing and economic growth in developing countries, 1950–2005. Structural Change and Economic Dynamics 34(C): 46–259. Working paper version available at: http://www.merit.unu.edu/publications/working-papers/abstract/?id=4606.
Szirmai A, Gebreeyesus M, Guadagno F, and Verspagen B (2013). Promoting productive employment in sub-Saharan Africa: A review of the literature. UNU-MERIT Working Paper 2013-062 prepared for the Knowledge Platform Development Policies of the Ministry of Foreign Affairs of the Netherlands. United Nations University - Maastricht Economic and Social Research Institute on Innovation and Technology.
Tang K, and Zhu H (2015). Commodities as collateral. Available at http://papers.ssrn.com/sol3/papers.cfm?abstract_id=2355674
Taylor L (1991). Income Distribution, Inflation, and Growth. Lectures on Structuralist Macroeconomic Theory. MIT Press. Cambridge, MA.
Temple J (2005). Dual economy models: A primer for growth economists. The Manchester School 73(4): 435–79.
Thirlwall PA (1983). A plain man’s guide to Kaldor’s growth laws. Journal of Post Keynesian Economics 5(3): 345–58.
Timmer MP, and de Vries G (2009). Structural change and growth accelerations in Asia and Latin America: A new sectoral data set. Cliometrica 3(2): 165–90.
Timmer MP, and Szirmai A (2000). Productivity growth in Asian manufacturing: The structural bonus hypothesis examined. Structural Change and Economic Dynamics 11(4): 371–92.
Timmer MP, Erumban AA, Los B, Stehrer R, and de Vries GJ (2014a). Slicing up global value chains. Journal of Economic Perspectives 28(2): 99–118.
Timmer MP, de Vries G, and de Vries K (2014b). Patterns of structural change in developing countries. GGDC Research Memorandum 149. Groningen Growth and Development Centre, University of Groningen.
Todaro M (1980). Internal migration in developing countries: A survey. In: Easterling RA, ed. Population and Economic Change in Developing Countries. University of Chicago Press. Chicago, IL.
Tregenna F (2007). Which sectors can be engines of growth and employment in South Africa? An analysis of manufacturing and services. Paper presented at the HSRC EGDI Roundtable on
95
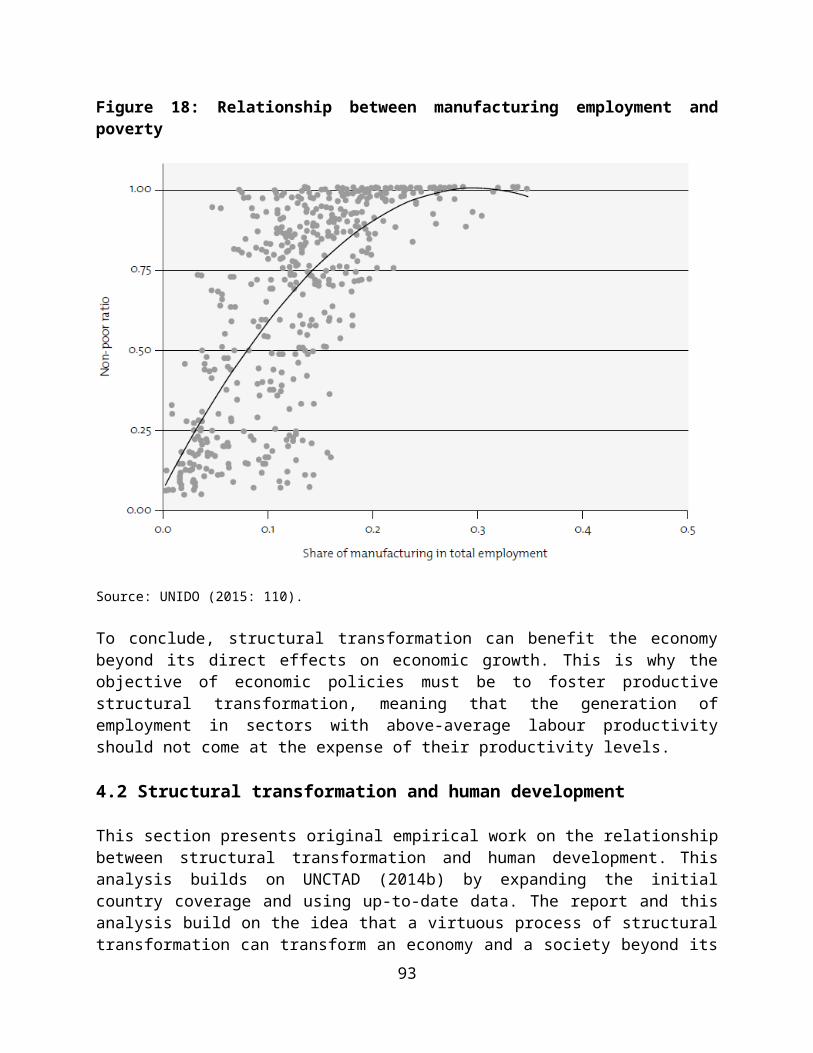
The Changing Character of Industrial Development: What Implications for Growth, Employment and Income Distribution? Human Sciences Research Council Employment Growth and Development Initiative.
Tregenna F (2009). Characterising deindustrialisation: An analysis of changes in manufacturing Employment and Output Internationally. Cambridge Journal of Economics 33: 433–66.
UNCTAD (1993). Trade and Development Report 1993. United Nations. Geneva and New York.
UNCTAD (1995). Trade and Development Report 1995. United Nations. Geneva and New York.
UNCTAD (1996). Trade and Development Report 1996. United Nations. Geneva and New York.
UNCTAD (1999). World Investment Report 1999. Foreign Direct Investment and the Challenge of Development. United Nations. Geneva and New York.
UNCTAD (2002). Trade and Development Report 2002: Global Trends and Prospects, Developing Countries in World Trade. United Nations. Geneva and New York.
UNCTAD (2003a). Trade and Development Report 2003: Capital Accumulation, Growth and Structural Change. United Nations. Geneva and New York.
UNCTAD (2003b). Economic Development in Africa Report 2003: Trade Performance and Commodity Dependence. United Nations. Geneva and New York.
UNCTAD (2005). Trade and Development Report 2005: New Features of Global Interdependence. United Nations. Geneva and New York.
UNCTAD (2006a). Trade and Development Report 2006: Global Partnerships and National Policies for Development. United Nations. Geneva and New York.
UNCTAD (2006b). World Investment Report 2006. FDI from Developing and Transition Economies: Implications for Development. United Nations. Geneva and New York.
UNCTAD (2006c). The Least Developed Countries Report 2006: Developing Productive Capabilities. United Nations. Geneva and New York.
UNCTAD (2006d). A Case Study of the Salmon Industry in Chile. United Nations. New York and Geneva.
UNCTAD (2008). Trade and Development Report 2008: Commodity Prices, Capital Flows and the Financing of Investment. United Nations. Geneva and New York.
UNCTAD (2009). Trade and Development Report 2009: Responding to the Global Crisis. Climate Change Mitigation and Development. United Nations. Geneva and New York.
96
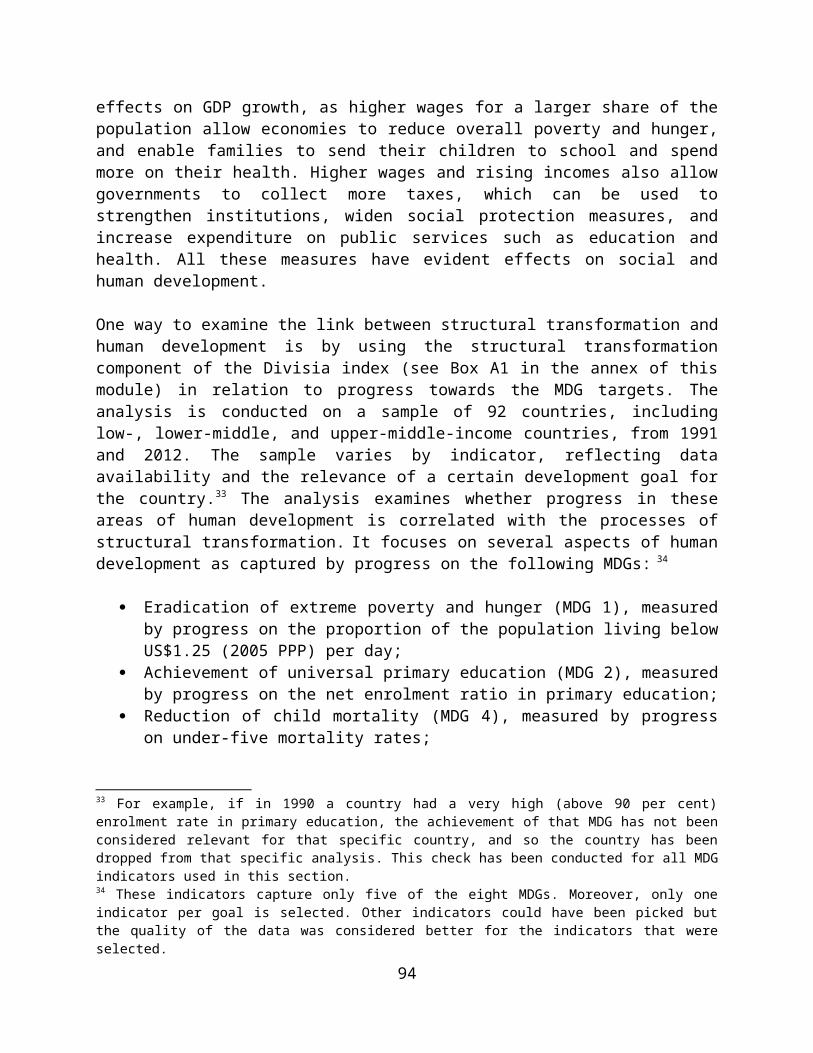
UNCTAD (2010). Trade and Development Report 2010: Employment, Globalization and Development. United Nations. Geneva and New York.
UNCTAD (2011a). Economic Development in Africa Report 2011: Fostering Industrial Development in Africa in the New Global Environment. United Nations. Geneva and New York.
UNCTAD (2011b). World Investment Report 2011: Non-Equity Modes of International Production and Development. United Nations. Geneva and New York.
UNCTAD (2011c). Trade and Development Report 2011: Post-crisis Policy Challenges in the World Economy. United Nations. Geneva and New York.
UNCTAD (2012). World Investment Report 2012: Policies for Inclusive and Balanced Growth. United Nations. Geneva and New York.
UNCTAD (2013a). World Investment Report 2013: Global Value Chains: Investment and Trade for Development. United Nations. Geneva and New York.
UNCTAD (2013b). Trade and Development Report 2013: Adjusting to the Changing Dynamics of the World Economy. United Nations. Geneva and New York.
UNCTAD (2013c). The Least Developed Countries Report 2013: Growth with Employment for Inclusive and Sustainable Development. United Nations. Geneva and New York.
UNCTAD (2014a). Trade and Development Report 2014: Global Governance and Policy Space for Development. United Nations. Geneva and New York.
UNCTAD (2014b). The Least Developed Countries Report 2014: Growth with Structural Transformation: A Post-2015 Development Agenda. United Nations. Geneva and New York.
UNCTAD (2015a). Global Value Chains and South-South Trade: Economic Cooperation and Integration among Developing Countries. United Nations. Geneva and New York.
UNCTAD (2015b). Trade and Development Report 2015: Making the International Financial Architecture Work for Development. United Nations. Geneva and New York.
UNCTAD (2015c). The Least Developed Countries Report 2015: Transforming Rural Economies. United Nations. Geneva and New York.
UNECA (2013). Making the Most of Africa’s Commodities: Industrializing for Growth, Jobs and Economic Transformation. United Nations Economic Commission for Africa. Addis Ababa.
UNIDO (2013). Industrial Development Report 2013: Sustaining Employment Growth: The Role of Manufacturing and Structural Change. United Nations Industrial Development Organization. Vienna.
97

UNIDO (2015). Industrial Development Report 2016: The Role of Technology and Innovation in Inclusive and Sustainable Industrial Development. United Nations Industrial Development Organization. Vienna.
UNRISD (2010). Combating Poverty and Inequality: Structural Change, Social Policy and Politics. United Nations Research Institute for Social Development. Geneva.
Wright G, and Czelusta J (2004). The myth of the resource curse. Challenge 47(2): 6–38. Available at http://web.stanford.edu/~write/papers/Wright%20Res%20Curse.pdf.
Wright G, and Czelusta J (2007). Resource-based growth, past and present. In: Lederman D, and Maloney F, eds. Natural Resources: Neither Curse nor Destiny. Stanford University Press. Palo Alto, CA.
van der Ploeg, F (2011). Natural resources: curse or blessing? Journal of Economic Literature 49(2): 366–420.
Venables AJ (2016). Using natural resources for development: Why has it proven so difficult? Journal of Economic Perspectives 30(1): 161–84.
Verdoorn PJ (1949). Fattori che regolano lo sviluppo della produttività del lavoro. L’Industria 1: 3–10.
Zhang M, and Balding C (2015). Carry trade dynamics under capital controls: The case of China. Available at http://ssrn.com/abstract=2623794.
Zheng Z, and Zhao Y (2002). China’s terms of trade in manufactures, 1993–2000. UNCTAD Discussion Paper No. 161. Geneva.
Young AA (1928). Increasing returns and economic progress. The Economic Journal 38(152): 527–42.
98

Module 2: Industrial policy: a theoretical and practical framework to analyse and apply industrial policy
1 Introduction
Government intervention, and industrial policy more specifically, have been issues of contention as long as the economics profession has existed. Early political and development economists such as Paul Rosenstein-Rodan, Albert Hirschman, Alexander Gerschenkron, and Raúl Prebisch emphasized the importance of government intervention and the ability of a state to mold economic activity in ways that would be most beneficial to society. In the early 1980s, development policy shifted towards a more market-centered approach, limiting government intervention to policies that try to make market outcomes more efficient by increasing competition or providing public goods. This view even led some economists to argue that the best industrial policy is not to have an industrial policy. More recently, however, there has been increased public pressure to reduce unemployment and stimulate economic growth, and, in this context, a revived interest in industrial policy.
As we will see throughout this module, historical accounts suggest that the use of industrial policies has been beneficial to many countries, spurring structural transformation and development. Structural transformation, technological upgrading, and innovation do not always take place autonomously, but rather require careful and consistent state intervention and support. Recent developments in the world economy, including the fallout from the 2007-2008 global financial crisis, have put industrial policy back on the policy agenda of developed and developing countries alike. The issue most governments face today is not whether to have an industrial policy, but how to best design and implement an industrial policy.
In Module 1 of this teaching material, we learned that the process of development entails profound structural changes in an economy. This module discusses how the government can support such a process. In doing so, we survey the debate on the role of industrial policy in structural transformation and discuss how an industrial policy can be implemented. Section 2 provides an overview of how the literature has defined industrial policy and classified industrial policy instruments. It also discusses the key conditions and principles of successful industrial policy design and implementation. Section 3 reviews arguments in favour of and against industrial policy, starting with a brief summary of the historical debate around the East Asian and Latin American experiences. The aim is to answer the question of why governments should have an industrial policy in the first place. Section 4 moves to more practical matters, providing some examples of successful and less successful industrial policies. Section 5 discusses some of the current challenges to industrial policies in developing countries, distinguishing between internal and external factors influencing industrial policymaking. The overall objective of the module is to provide the reader with both a theoretical and practical framework to analyse and apply industrial policy.
At the end of this module, students should be able to:
Explain what industrial policy is and how it can be best designed and implemented;
99
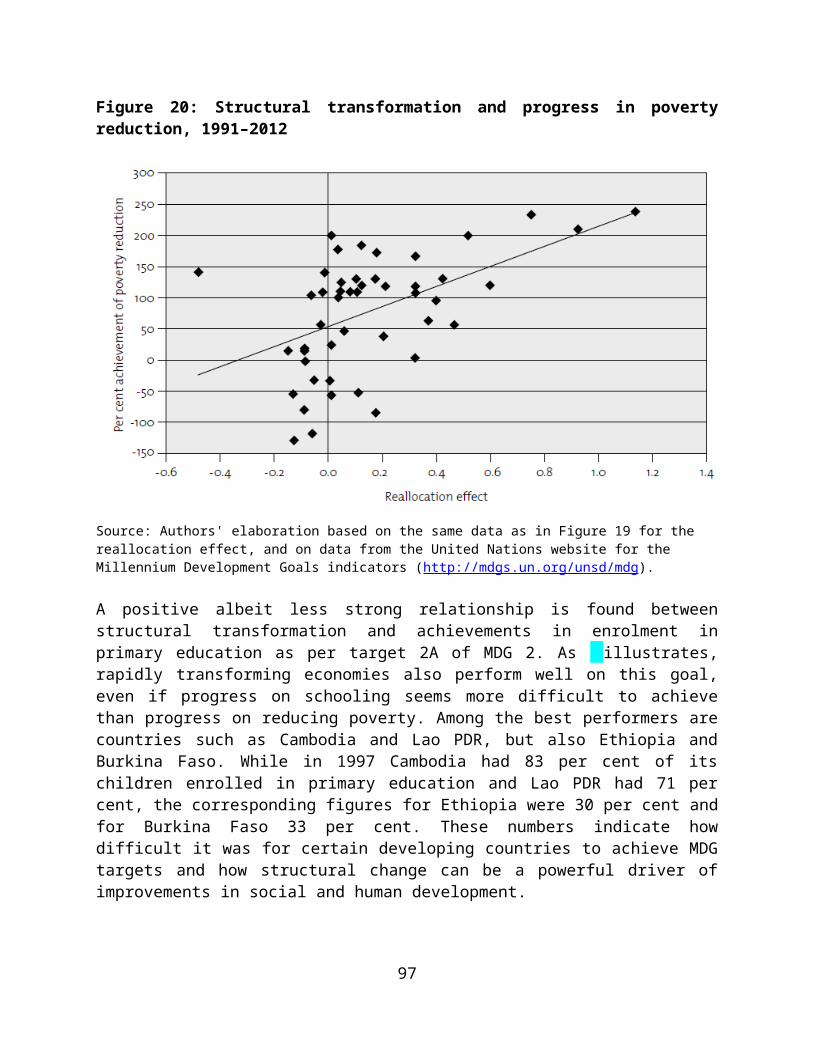
Describe the policy instruments that can be used to implement industrial policies; Describe the different views on the role of industrial policies; Analyse country experiences with specific industrial policy instruments; and Understand the challenges to industrial policies in the context of a developing economy.
2 What is industrial policy?
Both the definition and the implementation of industrial policy have varied considerably throughout history and across different countries. Based on the views of the leading industrial policy scholars, this section explains what constitutes an industrial policy, what policy instruments it uses, and how it can be implemented.
2.1 Defining industrial policy
There is no consensual definition of industrial policy, which reflects the controversy surrounding this concept. Adopting a broad definition, Warwick (2013: 16) defines industrial policy as “any type of intervention or government policy that attempts to improve the business environment or to alter the structure of economic activity toward sectors, technologies or tasks that are expected to offer better prospects for economic growth or societal welfare than would occur in the absence of such intervention” [emphasis by the original author]. Other authors (Chang, 2009; Landesmann, 1992; Pack and Saggi, 2006) provide narrower definitions of industrial policy. For instance, Pack and Saggi (2006: 2) consider industrial policy to be “any type of selective intervention or government policy that attempts to alter the structure of production toward sectors that are expected to offer better prospects for economic growth than would occur in the absence of such intervention, i.e. in the market equilibrium” [emphasis added].
2.1.1 Functional or selective industrial policies?
As we will see throughout this module, the issue of how actively industrial policy should seek to alter the structure of economic activity is at the heart of the discussion on industrial policy. More precisely, the debate has focused on how selective industrial policies should be, i.e. to what extent industrial policy should target (select) specific sectors, technologies, or tasks in order to alter the structure of the economy towards them. Using Warwick’s (2013) words, policies that attempt to improve business environments have been commonly referred to as functional, or horizontal, industrial policies. Policies that alter the structure of economic activity towards specific sectors have been referred to as selective, or vertical, industrial policies. 36 Functional policies would be the least interventionist because they are designed to support the operation of markets in general. Examples include policy measures that facilitate entry of firms through competition policy, or trade policies that liberalize imports. Selective industrial policies aim to promote certain industries and firms over others. They can make use of subsidies and other forms of support and protection such as import tariffs and restrictions, tax incentives, and public procurement.
36 Some authors have suggested different terminologies: soft and hard industrial policies (Harrison and Rodriguez-Clare, 2010), pro-market and pro-business policies (Rodrik and Subramanian, 2005), and market-based and promotional policies (Weiss, 2013).
100

Some authors (Lall and Teubal, 1998) have further divided functional/horizontal policies into two distinct categories. This approach has also been followed by UNCTAD and UNIDO (2011: 34), which describe industrial policy as involving “a combination of strategic or selective interventions aimed at propelling specific activities or sectors, functional interventions intended at improving the workings of markets, and horizontal interventions directed at promoting specific activities across sectors.” Following this literature, horizontal policies go slightly beyond functional policies, as they aim to promote cross-sector activities for which markets are missing or are difficult to create (a typical example is innovation policy). Hence, horizontal policy would lie somewhere between functional and selective industrial policies.
As several authors have argued, the distinction between functional and selective industrial policy might be less relevant than what the literature has suggested, as “even the most ‘general’ policy measures favour some sectors over others” (Salazar-Xirinachs et al., 2014: 20; see also Rodrik, 2008). For example, infrastructure investments, generally considered a functional industrial policy, favour a certain region and the industries that populate it. Similarly, training programmes aim to create knowledge and skills in specific technical areas. Moreover, prioritization – for example in choosing where to build a road – is always present in policymaking.
2.1.2 Which sectors deserve support from selective industrial policies?
Some authors have specified the characteristics that such sectors must have. They must have export, job, and knowledge creation potential (Reich, 1982), and they must be new to the economy (Rodrik, 2004). Ocampo et al. (2009) include dynamic effects by specifying that industrial policy should aim to restructure the economy and trade specialization towards activities with higher technological content and promote innovative activities with strong linkages to the rest of the economy. In their view, innovative activities should be understood in a broad sense as new technologies, but also new markets, industrial structures, or exploitation of previously underutilized natural resources. Finally, tension exists between promoting structural and technological change through productivity growth and achieving an acceptable quantity and quality of employment, as higher productivity in an industry reduces employment (see Module 1). Noting this, Salazar-Xirinachs et al. (2014: 2) call for a policy that can “strike a good balance in achieving the two fundamental objectives of productivity growth and more and better jobs.”
Given these characteristics, manufacturing is the most common target of industrial policies. Nevertheless, some authors, such as Rodrik (2004: 3), caution that “industrial policy is not about industry per se. Policies targeted at non-traditional agriculture or services qualify as much as incentives on manufactures.” Especially in economies heavily dependent on agriculture, industrial policies should simultaneously spur investments in productivity improvements and technological change in agriculture that lay the foundations for manufacturing and services expansion (Szirmai et al., 2013; UNCTAD, 2015a).
2.1.3 Should industrial policy conform to or defy comparative advantages?37
Authors have disagreed on whether industrial policy should be comparative-advantage-conforming or defying (Lin, 2011; Lin and Chang, 2009). The argument in favour of
37 For a review of the concept of comparative advantage, see Box 1 in Module 1 of this teaching material.
101

comparative-advantage-conforming industrial policy is that governments in developing countries should first focus on the industries where they have a comparative advantage (i.e. resource- and labour-intensive industries). Only when they accumulate sufficient physical and human capital should they upgrade their industrial policy and target higher-productivity industries. According to this view, comparative-advantage-defying industrial policies led developing countries to move into heavy (i.e. capital-intensive) industries: because capital was a scarce resource, production costs were much higher than in countries that had a comparative advantage in those industries. This led to what Lin and Treichel (2014: 66) called “a fatal mistake”, as production costs and costs incurred to protect these firms were much higher than the benefits of entering those industries. Following this view, therefore, the government should play a facilitating role, helping firms realize their latent comparative advantage.
The argument in defense of a comparative-advantage-defying strategy is that developing countries with an abundance of cheap labour have a comparative advantage – and can compete in global markets – only in labour-intensive industries. However, such industries cannot act as an engine of sustained economic growth or serve as an entry point to more advanced technological and skill-related activities. Moreover, comparative-advantage-complying industrial policies, such as those aimed at making markets free and competitive, would constrain countries to specialize according to their static comparative advantage that is in low-value-added, low-productivity sectors with few possibilities for learning and upgrading. Retraining workers from lower- to higher-productivity activities and adapting machinery is less straightforward than accounted for by those who defend comparative-advantage-conforming industrial policy. Using the example of his native Republic of Korea, Chang (1994) argues that industrial policy is about building comparative advantages and creating entirely new sectors and industries, rather than following static comparative advantages. Therefore, following this view, industrial policy should help countries discover and realize their dynamic comparative advantage.
The literature on industrial policy also frequently uses the notion of “picking winners”, albeit in different ways. Some have considered this a synonym for selective industrial policy (Noland and Pack, 2002; Pack and Saggi, 2006). Others have used it to refer to the more arbitrary use of selective industrial policies that, by being arbitrary, generated rent-seeking (Aghion et al., 2011). Others (Amsden, 2001; Cimoli et al., 2009; Wade, 1990) have argued that speaking about picking winners is often misleading because in many developing countries governments need to create rather than pick winners. This consideration led Wade (2010) to talk about leading the market and following the market policies. The former refers to policies through which governments invest where private firms would not invest, thereby creating potential new business opportunities and national champions, and the latter refers to policies that support investments that would have been undertaken anyway by private firms.38
To sum up, Figure 25 presents a visual representation of the policy categories discussed in this section. As we said, industrial policies have been classified into functional, horizontal, and selective policies, depending on the degree of government intervention. Functional industrial 38 The expression “national champion”, recurrent in the literature, refers to large domestic firms created or nurtured by the state in strategic industries, either due to a national interest or other characteristics of the industry (see also Section 3.2). From here, the phrase “nurturing national champions” means supporting national champions through market protection, subsidies, and other forms of selective industrial policies. Nurturing national champions can be understood as a synonym for picking winners.
102
policies are the most general, neutral, and least interventionist policies. Horizontal policies follow immediately thereafter. Selective industrial policies are considered the most active and distortive. As a consequence, functional and horizontal industrial policies are the most widely accepted, while selective industrial policies have generated considerable disagreement. This has led some authors to further distinguish within the broad category of selective industrial policies and to talk about picking winners versus creating winners; comparative-advantage-conforming versus comparative-advantage-defying policies; and leading the market versus following market policies. Each of these categories implies a different degree of government intervention.
Figure 25: A visual representation of industrial policy categories
Source: Authors' elaboration.
2.2 Industrial policy instruments
There are three dimensions of industrial policy that are sometimes confused in the literature: (a) overall vision or strategic direction; (b) industrial policy instruments; and (c) the process of industrial policymaking (Weiss, 2013). This section focuses on industrial policy instruments, which are the tools that governments have at their disposal to implement industrial policies. In the literature, industrial policy instruments have been classified in various ways, i.e. with different attributes.39 Some authors have used the categories described in Section 2.1, distinguishing between functional, horizontal, and selective industrial policies; others have distinguished according to policy domains.40 For example, Di Maio (2009: 107) distinguishes between innovation and technology policies, education and skill formation policies, trade policies, targeted industrial support measures, sectoral competitiveness policies, and competition-regulation policies. Warwick (2013) differentiates between policy instruments that affect the product market, capital market, labour and skills, land, technology, and systems/institutions.
Partly following Warwick (2013), a recent classification proposed by Weiss (2015) identifies five categories of industrial policy instruments: those related to the product market, labour
39 For a review, see Guadagno (2015a).40 Some have also used the expression “area of intervention” to refer to policy domains.
103
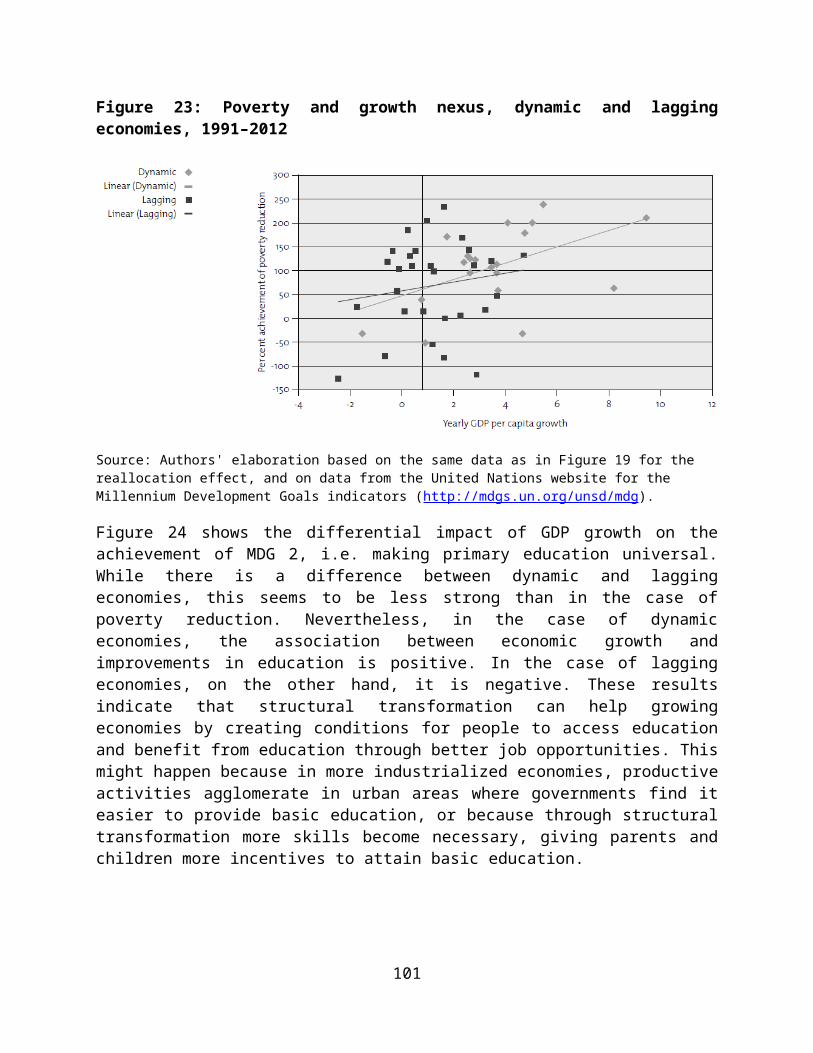
market, capital market, land market, and technology. Instruments are further categorized into market-based instruments, defined as instruments operating through pricing, and public goods, referring to the provision of goods and services that private firms would not supply on their own.
It is important to note that a number of industrial policy instruments are expensive, meaning that governments need considerable fiscal resources to implement them. This in turn requires fiscal capacity, i.e. the ability of the state to collect taxes, and adequate fiscal space (see Section 3.3). In this regard, the main advantage of the Weiss (2015) classification is that it distinguishes industrial policy instruments that are available to countries with different income levels.
shows the policy instruments available to low-income countries. In the product market domain, market-based policy instruments aim to increase the profitability of manufacturing activities. Import tariffs and export subsidies have been among the most important instruments used in East Asia and Latin America. While not completely prohibited under the new global trading regime, today the use of these instruments is restricted or discouraged (see Section 5.2.3). Therefore, alternative instruments, such as duty drawbacks and tax incentives, can be used. Among the instruments that do not directly affect prices are public procurement, but also (less costly and less controversial) instruments such as services to reduce information asymmetries (organization of fairs, linkage programmes, and other services that facilitate domestic and foreign investments). In the capital market domain, directed credits and interest rate subsidies (both market-based instruments) as well as development banks (a public goods instrument) played a key role in the industrialization strategy of first-tier East Asian newly industrialized economies (NIEs) (see Sections 3.1.2 and 4.3). In the land market domain, public goods instruments such as export processing zones (EPZs) and special economic zones (SEZs), which are among the most popular instruments in developing economies, have been used to attract foreign investment (see Section 4.4.2). Through EPZs and SEZs, governments can provide foreign firms with high-quality infrastructure, including reliable energy supply and fast Internet connections, and offer various tax incentives to compensate for the possible difficulties that firms might encounter by moving to their country. In the domain of technology, given the limited skill levels and financial resources available in low-income economies, industrial policy instruments should aim to facilitate the absorption of foreign knowledge by supporting technology transfer and extension programmes, both public goods instruments.
104
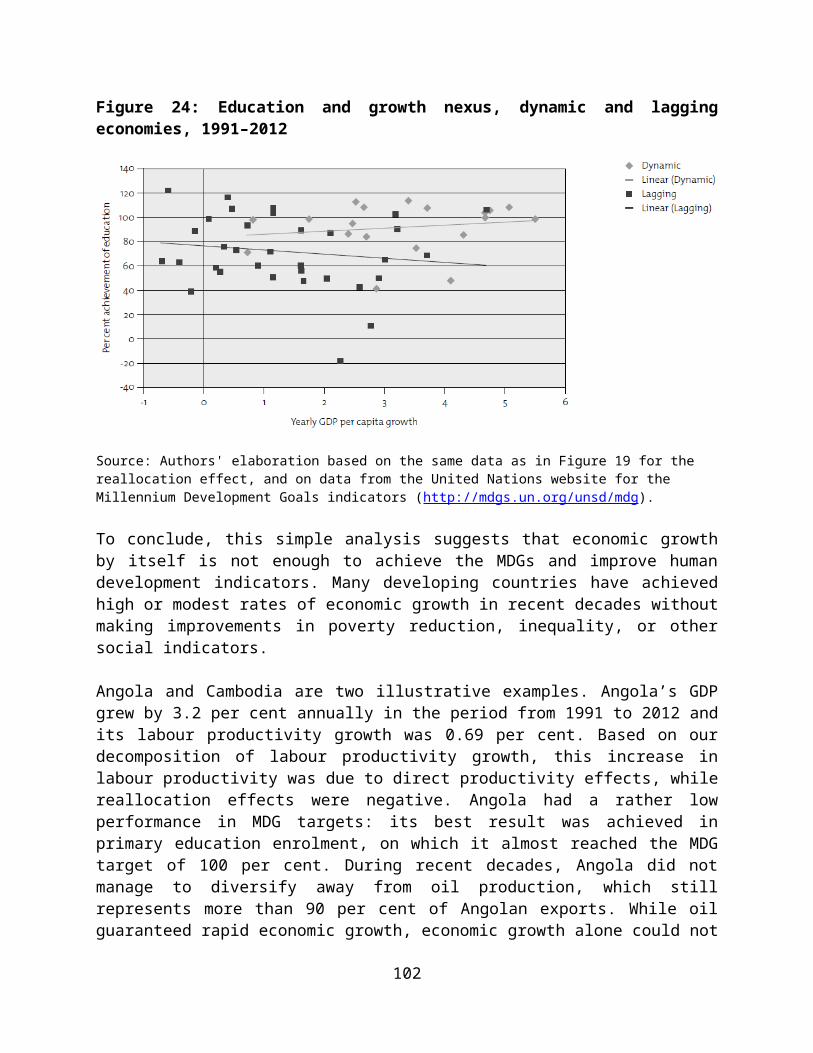
Table 5: Industrial policies in low-income economies
Source: Weiss (2015: 9).Notes: EPZs: export processing zones; FDI: foreign direct investment; SEZs: special economic zones.
tailors the previous classification of industrial policy instruments to middle-income economies. Comparing this table with Table 5 allows us to identify more costly and complex industrial policy instruments that middle-income countries can introduce to upgrade their industrial strategies and sustain industrialization and development. These instruments are found in two policy domains: capital markets and technology. Capital markets develop along with the level of development of the country, allowing governments to provide venture capital to projects with a high-risk profile and high growth potential (e.g. innovative projects in new technological fields). Similarly, as firms accumulate knowledge and capabilities and the state becomes more technically and administratively capable, governments can offer a number of incentives to stimulate innovation. In the technology domain, the classification includes two market-based policy instruments: research and development (R&D) subsidies (credits with subsidized interest rates, or tax rebates, for firms investing in R&D), and grants (disbursements of financial resources to advance promising technological or scientific fields). Instruments that do not directly affect markets include establishing and supporting public-private research consortia and research institutes. The experience of East Asian economies is once more illuminating in this regard: public-private research consortia and research institutes, initiated and financially supported by the government, created a strong knowledge base and established a strong research and innovation network (see Section 4.4.1).
105
Table 6: Industrial policies in middle-income economies
Source: Weiss (2015: 23).Notes: EPZs: export processing zones; FDI: foreign direct investment; R&D: research and development; SEZs: special economic zones.
2.3 Implementing industrial policy
There is no set rule as to how countries should design, coordinate, and implement an industrial policy. Successful cases have come through varying constellations of histories, institutional assets, time frames, natural resource endowments, and other factors. This means that there is not one simple “recipe” for industrial policy success. Instead, economic history shows that while it is important to learn from the experiences of other countries (both successes and failures), each country has to individually experiment and learn by doing when establishing its own industrial policy programmes.
Despite these country specificities, various authors have produced some general advice on how to effectively design and implement industrial policy. This concerns two main aspects of industrial policymaking processes: (a) how to build an institutional setting capable of implementing policies effectively; and (b) how to manage the delicate relationship with the private sector.
Devlin and Moguillansky (2011) outline a set of strategic and operational principles that they argue have emerged out of the good and bad experiences of a wide range of countries. They start with two over-arching strategic principles that should serve as the guide for effective industrial policy implementation. First, state initiatives must be pro-active, selective, and focused on the long term, rather than simply tied to the electoral cycle or the need to gain popular legitimacy over the short term to remain in power. Here the problem of carefully “picking winners” (and getting rid of “losers” over time) is of particular relevance. The government has to proactively seek solutions to cope with the problems faced by industry and improve government support to it in order for businesses to upgrade towards more productive and value-adding activities. The second strategic imperative is to stress the inter-connectedness of the industrial development and structural transformation process, as well as the need to forge a common vision for collective
106
action. The authors argue that public-private alliances are a means to accomplish this crucial task. Such structures allow for information sharing and collective action, but preclude the possibility of the state being “captured” by private interests.
Devlin and Moguillansky (2011) also provide a list of operational principles that the public sector could implement when designing and pursuing an industrial policy (see ).
107

Table 7: Key operational principles of industrial policy
Source: Authors' elaboration based on Devlin and Moguillansky (2011).1 UNCTAD (2009) also discusses the importance of establishing a pilot agency for development initiatives. Successful examples include the Ministry of International Trade and Industry (MITI) in Japan (see Box 8 in the main text), the Economic Planning Boards in the Republic of Korea and Singapore, and the Council on Economic Planning and Development in Taiwan Province of China.
108
2 With respect to the assignment of functions, Rodrik (2004) suggests that governments identify the most competent agencies and empower them. This might even be better than creating new agencies of uncertain competence. This also means that the location of competence should be prioritized over the choice of policy instruments, as it is better to use a second-best industrial policy instrument in an efficient setting than a first-best instrument ineffectively. For example, according to Rodrik, if a development bank is more competent than a tax office, then subsidized credits should be preferred over tax incentives.3 On this issue, see also Evans (1998) and Roll (2014).4 Coordination can be strengthened by entrusting coordination and deliberation councils that can facilitate information exchange and social learning between the private sector and government bodies. For a detailed review of how councils have been used and could be used for effective industrial policy, see Schneider (2013, 2015). On how deliberation councils have been used in Japan, see UNCTAD (1994).
According to Rodrik (2008: v), “[t]hree key design attributes that industrial policy must possess are embeddedness, carrots-and-sticks, and accountability.” Embeddedness concerns how close state-business relations should be (see below). The expression “carrots and sticks” refers to the combination of incentives (carrots) and discipline (sticks) that industrial policy should seek. Finally, accountability refers to the need to monitor bureaucrats and hold them responsible for how they spend public money. The first two of these attributes clearly concern state-business relations: the state needs to be embedded in close relations with the private sector, and state support must be combined with discipline (carrot-and-sticks) in order to reduce the chances of rent-seeking and corruption.
An abundant literature has studied state-business relations. This debate is inevitably linked to the concept of state capacity, i.e. the capacity of the state to perform all its tasks effectively and efficiently (see Section 3.3). While it is not possible to provide an exhaustive review of this literature in this module, we try to answer two main questions: (a) What are the essential ingredients for effective cooperation between the state and the business sector? and (b) How can this effective cooperation be achieved in practice?
Evans (1995) was one of the first authors to contribute to this important topic. He emphasizes that the crucial requirement for successful industrial policy is that private enterprises and economic elites play a role in its formulation and implementation, an idea that was captured in his notion of “embedded autonomy”. This concept affirms that the state should proactively partner with the private sector and non-governmental bodies, but it also emphasizes that the state must at the same time resist being captured by such interests so that it can ensure that the aims of the society as a whole are addressed rather than those of private entities.
Rodrik (2004) also focuses on the importance of business-state collaboration to reduce information asymmetries and co-design an industrial policy that can truly tackle the obstacles faced by the private sector. In doing so, the state needs to strike the right balance between being sufficiently close to the private sector – in order to collaborate with it and understand its challenges – and at the same time being sufficiently far from it – in order to avoid rent-seeking and corruption (in line with the embedded autonomy concept introduced by Evans, 1995).
Empirical evidence supports this view. For example, the process of industrial policymaking in the Republic of Korea saw an active government working in partnership with the largest family-owned industrial enterprises – the chaebol – and helping them upgrade their technologies, improve their products, introduce new products, and commence with exports. At the same time,
109

efficiency was maintained by ensuring that an unsuccessful chaebol would lose favour and state support would be transferred to another chaebol (Amsden, 1989; Chang, 1994).41
There are several elements of state-business relations – in particular information exchange, reciprocity, credibility, and trust – that are important for industrial policymaking (Schneider and Maxfield, 1997).42 With timely information exchanges, the government can have a better idea of the needs and general interests of the private sector, as well as access data that can help evaluate public policies. The private sector can in turn receive information on a number of issues that are important to define its investment plans (e.g. labour market conditions, investment conditions, export and sectoral market prospects).
Reciprocity in state-business relations has been defined by Amsden (1989: 146) as follows: “[I]n direct exchange for subsidies, the state exacts certain performance standards from firms.” This means that governments should ask for performance improvements – for example in terms of export performance, quality standards, and productivity gains – in return for support.43 In many cases, however, governments have been unable to monitor the implementation of such performance requirements and take appropriate action when they were not met (Evans, 1998; Lall, 2000; Schneider and Maxfield, 1997).
This “support/performance bargain”, as Evans (1998) calls it, cannot work well without two elements of state-business relations identified by Schneider and Maxfield (1997), namely fluid communication and mutual trust between the government and the private sector. Such communication and trust need to be built day by day through meetings, deliberative councils, and a number of ad hoc solutions that governments and business develop together in a complex and lengthy process of trial and error. As Schneider (2013: 13) puts it: “[I]n most successful cases of business-government collaboration, it was not a matter of simply assembling an initial set of institutions and allowing a virtuous process to unfold, but rather a more ad hoc and dynamic evolution where participants came together, sometimes informally to begin with, then cooperated through some initial set of institutions which over time the participants (or exogenous shocks) modified to better suit their evolving functions and political circumstances.”
To be able to do all this, the government needs to be credible – i.e. policies need to be sound and their implementation certain, and state-business relations need to be based on mutual trust. One way in which the government can show that it is credible is by phasing out support when industrial policies do not pay off. While mistakes are possible and the government should not minimize risky activities (due to the entrepreneurial nature of industrial policymaking), governments should minimize the costs of these failures, for example by discontinuing support. This is also related to the need for industrial policies to be able to “renew themselves”, i.e. to change over time. This means that governments might withdraw support to specific industries or firms as a result of the ongoing process of industrialization, reflecting the evolving needs and circumstances in which the process of discovery of new areas of (dynamic) comparative advantage occurs (Rodrik, 2004).
41 Japan is also a useful example in this regard (Johnson, 1982; see also UNCTAD, 1994). 42 To learn more about state-business relations, see Maxfield and Schneider (1997).43 Export performance seems to be the best indicator of performance improvement, as it is the easiest to monitor.
110
3 Why adopt an industrial policy?
By now we know how the literature has defined industrial policy and how industrial policy can be most effectively designed and implemented. This section aims to answer another crucial question: why do countries need an industrial policy in the first place? To this end, Section 3.1 reviews the historical debate on industrial policy, focusing in particular on the divergent experiences of East Asian and Latin American economies. It looks into why these economies have engaged in industrial policy and what concerns those policies have raised. Based on this analysis, Sections 3.2 and 3.3 review the most accepted arguments for and against industrial policy. As will be noted, arguments in support of industrial policy are theoretical, i.e. based on key economic concepts. Arguments against industrial policy, on the other hand, are practical in nature, i.e. they are related to how industrial policy has been implemented in practice.
3.1 A historical perspective
The literature on industrial policy has found fertile ground for discussion in the experiences of East Asia and Latin America. As discussed in Module 1, in the 1950s, Latin American economies were better positioned than East Asian economies to catch up with the advanced world, as they possessed more developed industrial sectors than those in East Asia. In spite of this, in only three decades, first-tier East Asian economies, namely the Republic of Korea, Taiwan Province of China, Singapore, and Hong Kong (China) (although with substantial differences with second-tier NIEs; see Section 4.4.2) managed to accumulate capital and capabilities so rapidly that they industrialized and joined the most advanced economies in the world. Latin American countries, on the other hand, enjoyed only modest and discontinuous economic and productivity growth, leading to stagnation and premature deindustrialization (see Sections 2.3.3 and 3.3 of Module 1). Public policies and industrial policy in particular have been identified as the key factors behind these divergent trajectories, as East Asian policies effectively spurred rapid capital accumulation in the form of plants, equipment, infrastructures, as well as human capital and R&D.
This section summarizes the literature on East Asia and Latin America by presenting the main arguments and contributions by (a) neoclassical economists; (b) “revisionists” 44 (Alice Amsden, Robert Wade, and Ha-Joon Chang); (c) the literature on the developmental state; (d) the literature on the investment-profit nexus; (e) Latin American structuralist economists; and (f) Schumpeterian evolutionary economists.
3.1.1 The neoclassical tradition
Authors in the neoclassical tradition attribute the East Asian success to limited state intervention and functional industrial policies aimed at creating a favourable business environment through human capital formation, infrastructural investments, and maintenance of political and macroeconomic stability. East Asian policies essentially aimed at “getting prices right”, meaning that they largely avoided distorting market prices (through price controls, subsidies, or other selective interventions), thus letting market signals drive resource allocation. The opposite happened in Latin American economies, where governments intervened in market functioning, 44 The term “revisionists” comes from World Bank (1993).
111
thus distorting market prices and granting excessive protection to domestic firms. Based on the neoclassical accounts, the discretionary nature of selective industrial policies in Latin America often induced rent-seeking behaviour, which ultimately led to inefficient resource allocation and unsatisfactory industrial results. In addition, it was argued that the interference of the state was so arbitrary and massive that delays and excessive paperwork related to bureaucratic controls and procedures, such as those required to obtain import licenses, hindered investments from genuine entrepreneurs (Balassa, 1971, 1982; Edwards, 1988; Little et al., 1970; Wolf, 1988; World Bank, 1987; see Box 7 for a brief discussion on the World Bank report on the “East Asian miracle”).45
In the neoclassical literature, Latin America’s adoption of import-substitution industrialization (ISI) and East Asia’s adoption of export-oriented industrialization (EOI) are also key to the interpretation of the divergent economic and industrial performances of these two regions.46 These strategies can be thought of as bundles of policy measures aimed at industrialization. In particular, ISI refers to the strategy by which countries try to industrialize by substituting industrial imports with domestic goods. This strategy requires the government to put in place a complex system of market protection instruments such as import tariffs and restrictions, investment incentives such as subsidized credits and tax incentives, and innovation incentives such as R&D subsidies. This policy mix aims to encourage production by domestic firms by protecting them from competition from foreign products, which, in developing economies, are likely to be less expensive and of higher quality.47
EOI refers to the strategy by which countries try to industrialize by boosting exports. This can be achieved through subsidized export credits and tax incentives. ISI and EOI are motivated by the same basic need: relaxing balance-of-payments constraints through savings of foreign exchange (through import substitution) and generating more foreign exchange (through export promotion). Together with this objective, ISI and EOI also aim to spur investments, create employment, allow firms to benefit from a more efficient scale of production, and give firms opportunities to accumulate knowledge, skills, and capabilities. By focusing on external rather than internal markets, EOI strategies are also particularly beneficial to small economies that cannot count on a sufficiently large domestic market to which firms can sell their products.
According to neoclassical analyses, while East Asia had relied on ISI early on in its industrialization process, it promptly liberalized imports and embarked on EOI. This switch allowed it to increase production volumes, generate more foreign exchange, and learn from the production process (i.e. learning by doing), from foreign firms and through the process of meeting international quality standards. In the neoclassical view, Latin American countries continued implementing ISI even when substitution possibilities had been exhausted and it was clear that the strategy was not leading to faster industrialization. Furthermore, it was argued that in Latin America, ISI produced a bias against exports, which further exacerbated the foreign exchange constraints faced by Latin American countries, ultimately contributing to the dramatic
45 These critiques extended to other developing regions (e.g. Krueger, 1974, on India and Turkey). 46 After the Second World War, most developing countries, from India to the Philippines and Turkey and most countries in the African continent, adopted ISI, albeit using different policy mixes and achieving highly heterogeneous results.47 By creating barriers to trade, ISI can be partly unsuited to the challenges posed by the rise of global value chains (see Section 5.2.1). In addition, today the policy space to implement ISI is to some extent restricted by the prevailing global trade order (see Section 5.2.3).
112
debt crisis of the 1980s. Finally, it was noted that for an economy that heavily relies on imports – since domestic firms cannot provide most of the inputs needed for production – ISI makes imports more expensive, resulting in higher production costs and reduced consumption (Krueger, 1978, 1984, 1990a; Little et al., 1970).
This interpretation of the history of East Asia and Latin America ultimately led neoclassical economists to argue against selective industrial policy. This view permeated the Washington Consensus and its policy prescriptions (Williamson, 1990),48 as well as the broad pessimism with regard to industrial policy that emerged in the early 1980s.49
3.1.2 The interpretation of the “revisionists”
“Revisionists” strongly contested the neoclassical interpretation of the “East Asian miracle”. Their work documents the role of selective industrial policies in the form of investment incentives, as well as domestic market protection and export promotion instruments. This strand of literature contradicts the neoclassical interpretation in various aspects, most notably on the use of selective industrial policy instruments and the late abandonment of ISI.
Among the pioneering works on the nature and role of industrial policy in East Asian economies, Alice Amsden (1989) demonstrates how the significant industrial success of the Republic of Korea was an outcome of a (selective) industrial policy that was strategically well designed, flexible, and operationally well managed. She stresses in particular the success of technological upgrading in terms of exports and in introducing clear performance standards for the companies benefitting from state support. Related to the experience of the Republic of Korea, Amsden (1989) coined the phrase “getting prices wrong”, meaning that the government had deliberately attempted to distort market prices in order to support industrialization. Two prices, in particular, were targeted: long-term interest rates and foreign exchange rates. Preferential long-term interest rates eased the financing constraints of targeted sectors and firms and thus stimulated investments. These selective incentives ultimately oriented the process of structural change towards industries that maximized growth and investment opportunities and spurred the accumulation of capabilities. A competitive real exchange rate (i.e. a cheap domestic currency relative to foreign currencies) lowered the price of domestic goods on global markets, which in turn stimulated exports and economic growth.
Thanks to his extensive work on Taiwan Province of China, Wade (1990) has also made an important contribution to the debate on the role of industrial policies. In his view, from the 1960s onward, Taiwan Province of China was able to design and implement a very sophisticated industrial policy that helped the economy emerge from poverty to become one of the most successful and technologically advanced economies in the world. Wade’s contribution to the theory and practice of industrial policy centres around his claim that the state is required to
48 The Washington Consensus consisted of six main policy prescriptions: (a) restricting budget deficits; (b) restricting public expenditure to areas like education and infrastructure; (c) domestic financial liberalization, leading to interest rates determined by the market; (d) competitive exchange rates, elimination of import restrictions, and reduction of import tariffs; (e) privatization of state-owned enterprises; and (f) measures to increase competition (see Priewe, 2015).49 See Salazar-Xirinachs et al. (2014), Shapiro (2007), and Wade (2015) for a review of how the perception of industrial policy changed over time.
113
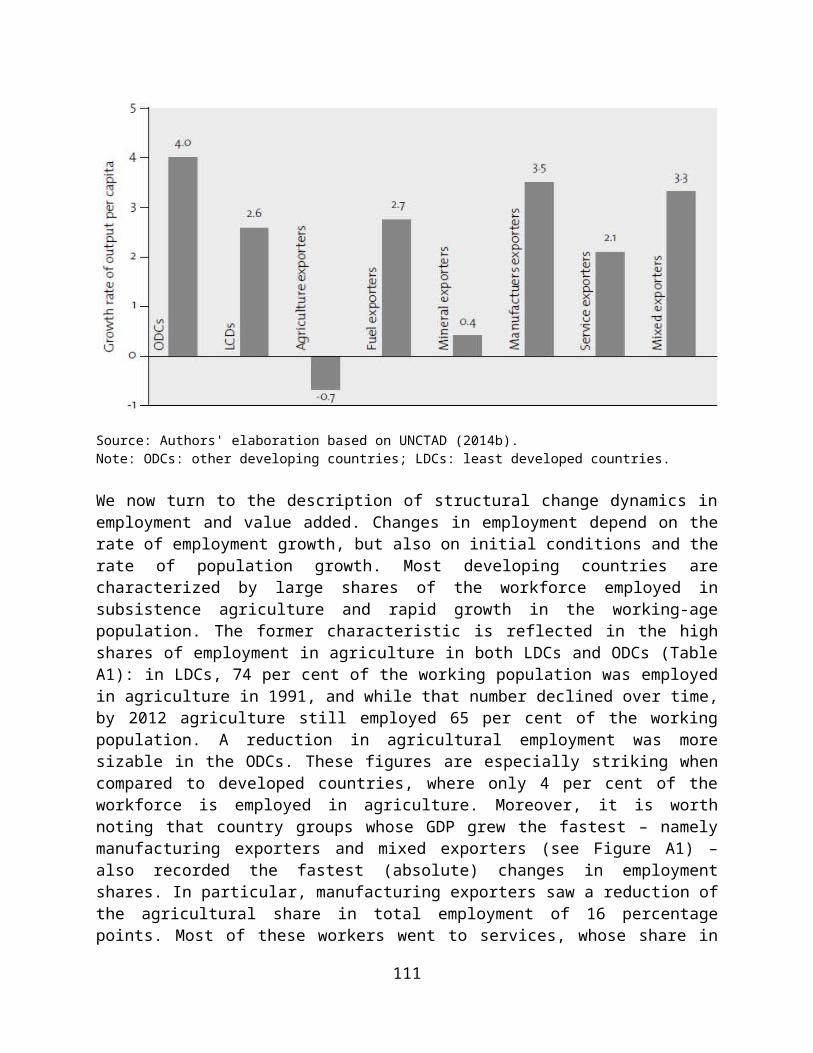
“guide the market” in building capabilities as the route to export success, that is, to pursue a more active role in the process of economic development.50
With the empirical evidence of the “East Asian miracle” in mind, Chang (2002) goes further back in history to show how virtually all of today’s richest economies were able to develop thanks to what we now call an industrial policy. Chang shows that today’s developed countries in Western Europe and North America utilized industrial policies that allowed them to master the production of many new manufactured products, which were subsequently sold on world markets in exchange for raw materials and other non-industrial goods. Such policies included non-tariff import barriers, subsidized inputs, and various incentives to investments.51
With respect to the debate on ISI and EOI, revisionists criticize the neoclassical interpretation of the East Asian experience according to which ISI was adopted and then quickly abandoned. Instead, they argue that East Asian industrial policies were particularly successful because they effectively combined ISI and EOI. In this regard, Amsden (2001) coined the expression “selective seclusion” referring to the mix of selective interventions that created a situation by which East Asian economies were not completely open to trade. Instead, through selective seclusion, the government “filtered” foreign knowledge and goods that entered the economy and created a complex system of incentives and discipline. By combining import substitution with export promotion, “exports are built into import substitutes through long-range capacity planning” [emphasis by the original author] (Amsden 2001: 174). In practice, in the Republic of Korea and Taiwan Province of China, this was achieved by linking ISI and EOI incentives so that exporters and their suppliers could obtain imported inputs and capital goods more freely and at lower costs (UNCTAD, 1994). In addition, competition policy protected these firms, giving them market power and allowing them to become market leaders. This practice created above-free-market rents, but at the same time contributed to the success of the industrial strategy through investment, higher exports, and productivity growth. As Wade (1990: 129) puts it, “those who get the windfalls (‘rents’) from importing scarce commodities are at the same time contributing to the economic success of the country by exporting” (see the literature on the profit-investment nexus in Section 3.1.4).
Box 7: The World Bank report on East Asian economic growth and public policies
In an effort to reconcile the views of neoclassical economists and revisionists, the World Bank (1993) published a report in 1993 titled “The East Asian Miracle: Economic Growth and Public Policies” . The report supports a “market friendly” view of the East Asian experience, according to which East Asian governments did less in areas where markets worked – in the production sector – and did more where markets could not be relied upon – in human capital formation, health and nutrition, and social, physical, and legal infrastructure.
The report recognizes the government’s role in two main areas, namely guaranteeing macroeconomic stability and investing in human capital. Productivity growth is considered important, but not the dominant factor. The report acknowledges the use of selective industrial policy in East Asia, even though it deemphasizes its role, claiming for example that “East Asian success sometimes occurred in spite of rather than because of market interventions” [emphasis in the original text] (World Bank, 1993: 86).50 On Taiwan Province of China see also Amsden and Chu (2003).51 Some smaller countries, such as Switzerland and the Netherlands, managed to develop without a comprehensive industrial policy package due to a number of unique compensating factors.
114

While the report was meant to absorb some of the criticisms of the so-called revisionists, it has been noted that its conclusions are very much in line with the neoclassical interpretation and fail to go beyond traditional dichotomies such as export promotion and import substitution (Akyüz et al., 1998; Fishlow et al., 1994).
Source: Authors.
3.1.3 The literature on the developmental state
The literature on the developmental state started with Johnson’s (1982) analysis of the Japanese “miracle” (see Box 8), in which he captures the role of the Japanese government in making Japan one of the richest economies of the world. According to the author, the Japanese state was developmental because it consciously and consistently aimed at development. In Johnson’s words, “[t]he issue is not one of the state intervention in the economy. All states intervene in their economies for various reasons.… Japan is a good example of a state in which the developmental orientation predominates” (Johnson, 1982: 17). Johnson (1987: 140) explained a development state more precisely as one where “(i) there is a developmentally-oriented political elite committed to break out of the stagnation of dependency and underdevelopment and for whom economic growth is a fundamental goal, (ii) such an elite is not committed first and foremost to the enhancement and perpetuation of its own elite privileges, and (iii) the elite sees its primary leadership task to discover how, organizationally, to make its own development goals compatible with the market mechanism and the private pursuit of profit.” Hence, the developmental state commits to development and can effectively translate its commitment into policies and institutions capable of achieving it.
In order to accomplish this mission, the Japanese developmental state followed two main routes: it made manufacturing activities profitable enough to attract private enterprises, and it induced these enterprises to redistribute their (monopoly) profits to the society at large, for example through reinvestments (see Section 3.1.4). In order to make manufacturing activities more attractive, the developmental state would perform four core functions: (a) development banking (see Section 4.2.1); (b) local content management, building national firms, capabilities, and saving, or earning foreign exchange; (c) “selective seclusion”, i.e. opening some markets to foreign actors and keeping others closed (see Sections 3.1.2 and 3.1.4); and (d) national firm formation, creating national leaders in strategic industries (Amsden, 2001). In order to redistribute profits to the larger society (e.g. through new investment and employment), the developmental state would regulate and impose discipline on the private sector, for example through the enforcement of performance criteria described in Section 2.3.
The developmental state concept was then taken up by others seeking to provide an explanatory framework for the experiences of the Republic of Korea and Taiwan Province of China (Amsden, 1989; Onis, 1991; UNCTAD, 1994, 1996, 2003; Wade, 1990; Woo-Cumings, 1999), Malaysia, Indonesia, and Thailand (Lall, 1996; Meyanathan, 1994), the People's Republic of China and Viet Nam (Studwell, 2014), and Brazil and Mexico (Schneider, 1999). Among the developed countries developmental states have been found in Austria and Finland (Vartiainen, 1999) and the United States (Block, 2009; Block and Keller, 2011; Lazonick, 2008).
115

Box 8: The role of Japan’s Ministry of International Trade and Industry
The Japanese economy, left devastated after 1945, was thought unable to recover swiftly. However, the first post-war Japanese government was determined to facilitate a rapid recovery and put in place a range of mechanisms to transform the economy. One of its most important moves was to establish the Ministry of International Trade and Industry (MITI), a pilot development agency with extensive powers to control the financial system and the allocation of (scarce) foreign exchange. MITI officials introduced a range of sector-based industrial policies and proved capable of arranging all of the necessary preconditions for successful establishment of firms and subsequent growth of the economy.
In the important machine tool sector, boosted by MITI’s efforts to promote R&D, targeted support was provided to specific micro- and small enterprises capable of providing sophisticated intermediate goods. Backed by generous financial assistance, Japan had overtaken the United States as the world’s leading producer in this sector by the 1980s (Amsden, 2007).
Another case is that of industrial robotics, where Japanese producers managed to edge out US-based firms to become the world’s leading producers by the 1980s. Important contributions to making this happen came from MITI and included numerous arrangements to stimulate initial demand for Japanese-made industrial robots among Japan’s small and medium-sized enterprises (SMEs) (to allow for learning by doing); significant support for R&D; and petitioning help from the Japan Development Bank (Porter, 1990). MITI has been especially active in promoting microenterprises and SMEs, which created a competitive advantage for Japan’s largest enterprises by providing them with easy access to quality and low-cost inputs (MITI, 1995).
Source: Authors.
Several observers have called for updating the concept of the developmental state, reflecting the experiences of a larger range of countries and current challenges to industrialization and industrial policy. UNCTAD (2009) discusses how the developmental state concept can be updated to the 21st century, identifying a number of characteristics that a forward-looking developmental state should have. First, the report discusses the increasingly important role of knowledge and innovation as determinants of economic growth and development, as well as the new role of foreign direct investment (FDI) and global value chains (GVCs) in stimulating the accumulation of capabilities within firms in developing countries (see Sections 3.1.6, 4.4.2, and 5.2.1). Second, while the interventions of the classical developmental states focused on manufacturing, the report suggests paying more attention to modern services. Because of their learning opportunities, these services could also promote diversification, structural transformation, and economic growth (Evans, 2008). Third, a regional approach to developmentalism could also help developing countries strengthen production and trade linkages between countries and build the conditions for structural transformation, although this could also create a number of institutional challenges, especially in terms of consensus-building and policy coordination (UNCTAD, 2007a, 2007b). Fourth, there have been objections to the classical developmental state because of its frequent authoritarian origin, as many of the successful developmental states were parts of authoritarian regimes. The literature on democratic developmental states has agreed that in order to build democratic developmental states, it is not enough to commit to a particular type of democratization (e.g. holding regular elections), but rather it is important to harness citizen participation in governance and developmental issues (Chang, 2010; Kozul-Wright and Rayment, 2007; Robinson and White, 1998). Finally, while the
116
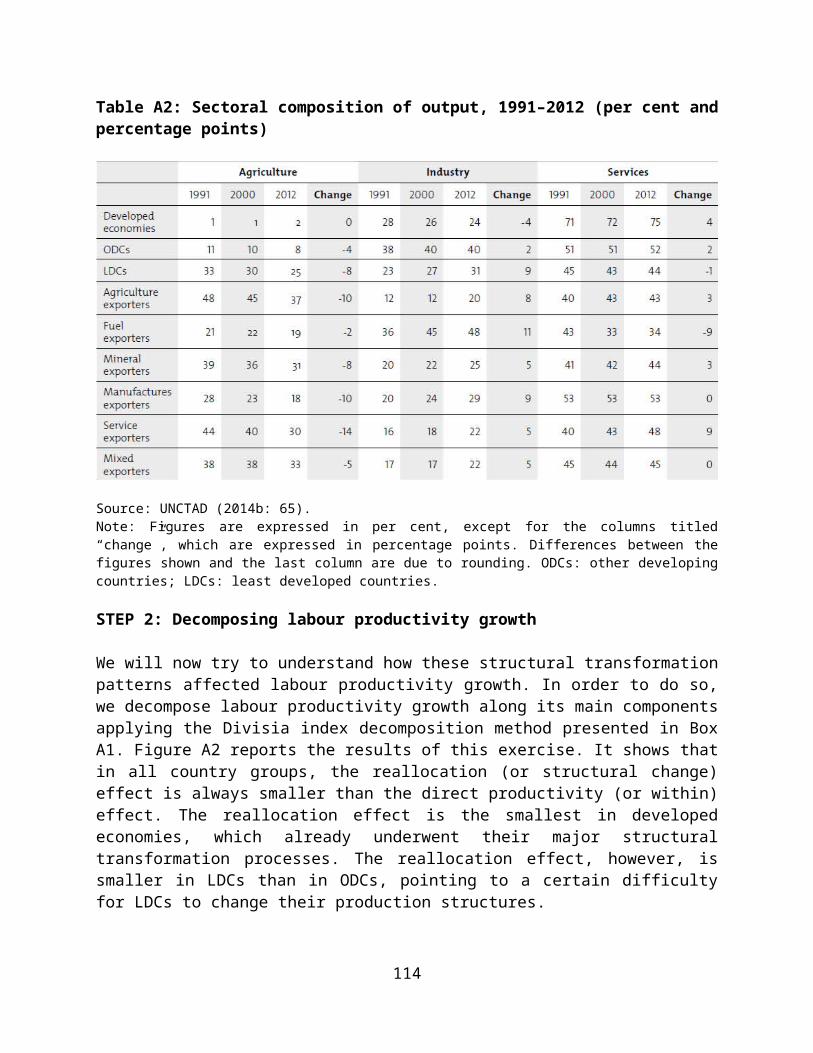
classical developmental state did not use top-down control, but rather involved careful management of state-business relations, the insights from the recent studies on modern governance can influence the conceptualization of a 21st century version of the developmental state. In particular, this literature can provide policymakers with new ideas on modalities of interactions with the society (see Jessop, 1998, for the concept of “network governance”), mixes of policy instruments (Howlett, 2004), and new approaches to improve administrative effectiveness (Evans, 2005).
According to Wade (2015), most of the roles of the classic developmental state cannot be performed as they used to in the classical developmental state model, due primarily to the reduced policy space available today to many developing economies (see Section 5.2.3). This led Wade (2015) to propose a modern version of the development state, which he labels as the “Developmental State Mark II”, consistent with World Trade Organization (WTO) rules and aimed at strategically attracting activities of GVCs. A new developmental state is particularly important for middle-income countries, which are too rich to benefit from WTO rule exemptions and compete with low-income countries for low-skill and labour-intensive activities of the GVCs, and therefore need a developmental state to provide a large and coherent mix of industrial policies to compete in knowledge- and skill-intensive activities of GVCs.
3.1.4 The literature on the profit-investment and export-investment nexus
The literature on the profit-investment and export-investment nexus (Akyüz and Gore, 1996; Akyüz et al., 1998; UNCTAD, 1994, 1996, 1997, 2002, 2003) explains the high rates of savings and investments that characterized East Asian NIEs starting in the 1950s. Akyüz and Gore (1996: 461) stress “that the success of East Asian industrialization depended very much on the role of government intervention in accelerating capital accumulation and growth, and that government policy achieved this by animating the investment-profits nexus; that is, the dynamic interactions between profits and investment which arise because profits are simultaneously an incentive for investment, a source of investment and an outcome of investment.”
This thesis builds on three propositions:
High rates of investment greatly contributed to fast economic growth in East Asia; Profits were the main source of investment; and Governments accelerated investment by creating above-free-market profits.
How did East Asian governments create rents and how did these rents spur investment? First, functional industrial policies were aimed at guaranteeing a pro-investment macroeconomic and political climate. Second, a complex and well-coordinated mix of selective industrial policies boosted profits above free-market levels, restricted luxury consumption, and eliminated speculative investment opportunities, thus encouraging productive investments. In particular, fiscal incentives, such as tax breaks and special depreciation allowances, boosted corporate savings and provided firms with financial resources to be reinvested. Higher investment enhanced capital utilization rates and productivity, thus further raising corporate profits. Controls on interest rates, credit allocation, and managed competition (e.g. encouragement of mergers, coordination of capacity expansion, restrictions on foreign investment, screening of technology
117

acquisitions, etc.) further raised profits above free-market levels by distorting market prices and creating national leading firms.
In Japan, for example, credit rationing was used together with other mechanisms to coordinate capacity expansion in order to avoid “investment races” among large oligopolistic firms, as these would have decreased profits (Akyüz and Gore, 1996). Restrictions on imports, high taxes on luxury consumption, restrictions on consumer credits, and restrictions on the outflow of capital guaranteed that these policy-driven profits would not be diverted towards unproductive uses. Rent-creating incentives were preferentially allocated to industries with greater potential for learning, scale economies and productivity enhancements, and the strongest linkages to the rest of the economy. The generation of rents through incentives stimulated investment, creating what is called the profit-investment nexus.
Another important characteristic of government-generated rents was their link with export performance. According to this strand of literature, although labour-intensive industries were in line with the comparative advantage of the East Asian economies, diversification did not happen automatically. Functional and selective industrial policies in the form of support services, domestic market protection, and export subsidies played a crucial role in nurturing these industries. In particular, subsidies, domestic market protection, and access to import licenses were subject to export performance (see also Section 2.3 and Section 3.1.2). In this way, the profit-investment nexus was also linked to an export-investment nexus.
In industrializing countries with incipient capital goods’ industries, investments naturally lead to an increase in imports, as the expansion of production requires more capital and intermediate goods that need to be sourced outside the country. In order to finance these imports without increasing external borrowing and thus avoid balance-of-payments constraints, export expansion is necessary. Export expansion allows for sustaining the momentum of industrialization without resorting to excessive external borrowing. This is not a one-off challenge: even when capital and intermediate goods’ industries are established, structural transformation is not over yet. Moving up value chains and upgrading technologies continues to demand technologically advanced (imported) capital goods and intermediate inputs, requiring therefore more export expansion.
3.1.5 The Latin American structuralist economists
The debate about industrial policy has also been informed by the writings of Latin American structuralist economists, particularly the Argentinian economist Raúl Prebisch, who also served as the founding Secretary-General of the United Nations Conference on Trade and Development (UNCTAD).52 In his major work “The Economic Development of Latin America and Its Principal Problems” (1950), he predicates the ISI approach on the ability of countries to substitute for an expanding range of manufactured imports, also incorporating technological
52 Raúl Prebisch greatly contributed to the development of the United Nations system. Under his direction, the Economic Commission on Latin America and the Caribbean became the most dynamic research and policy organization in the region, developing a Latin American theory of economic development and contributing to building the region. Later, under his direction as its first Secretary-General, UNCTAD helped developing countries organize their initiatives (e.g. through the G77 group) and promoted a new world economic order with less unequal power relations between the North and the South (Dosman, n.d.).
118

advances and innovations into locally manufactured products.53 According to Latin American structuralists, in several cases and within the right context (e.g. in the automotive industry in Brazil) ISI spurred growth in manufacturing and succeeded in raising productivity and generating indigenous innovation. However, it failed to fully substitute for foreign manufactured products and did not lead to sustained industrialization (Katz, 1987).
The positions of Prebisch and other structuralists supporting ISI were not meant to be against EOI: Prebisch himself encouraged combining ISI with EOI (Prebisch, 1950). Still, in practice, one of the central problems of Latin American industrial policies was that they focused more on ISI than EOI, contributing to the balance-of-payments constraints that led to the debt crisis of the 1980s. Another recognized pitfall of Latin American industrial policies concerns the process of industrial policymaking. In particular, the lack of performance criteria and limited state capacity to effectively implement industrial policy and impose discipline on the private sector contributed to the limited success of ISI. Little disagreement exists on this issue: limited state capacity and ill-suited state-business relations are widely considered among the most important determinants of the divergence of industrial policy outcomes between East Asia and Latin America.
ISI was ultimately abandoned in many Latin American countries under both internal and external pressure. Following the Washington Consensus, functional industrial policies replaced ISI. Latin American structuralists criticized the new policy regime and its impact on productivity and the process of accumulation of capabilities, holding it responsible for premature deindustrialization. Their studies show that import liberalization and the elimination of subsidies and other investment incentives drove domestic (less competitive) producers out of the market, also halting the processes of learning and accumulation of capabilities initiated and sustained by ISI (Cimoli and Katz, 2003; Katz, 2000).
3.1.6 The contribution of Schumpeterian or evolutionary economists
Schumpeterian or evolutionary economists also contributed to the debate on industrial policy, highlighting the role of public policies in stimulating technological change and the accumulation of capabilities (see Nübler, 2014; and Section 3.1.3.3 of Module 1 for a discussion of the contribution of the Schumpeterian economics school to the debate on structural transformation). This strand of literature conceptualizes the environment in which innovation occurs as an innovation system made up of firms, education and research centres, governments, and financial institutions, and forged by the interactions between these actors. Public policies constitute an important element of the innovation system, as they can increase the innovation potential of each actor and facilitate interactions among them. These two main roles of public policies are key to maximizing opportunities for learning and for knowledge and technology transfer.
53 For more details on Latin American structuralism and the theoretical reasons behind Prebisch’s support for ISI, see Section 3.1.2 in Module 1.
119
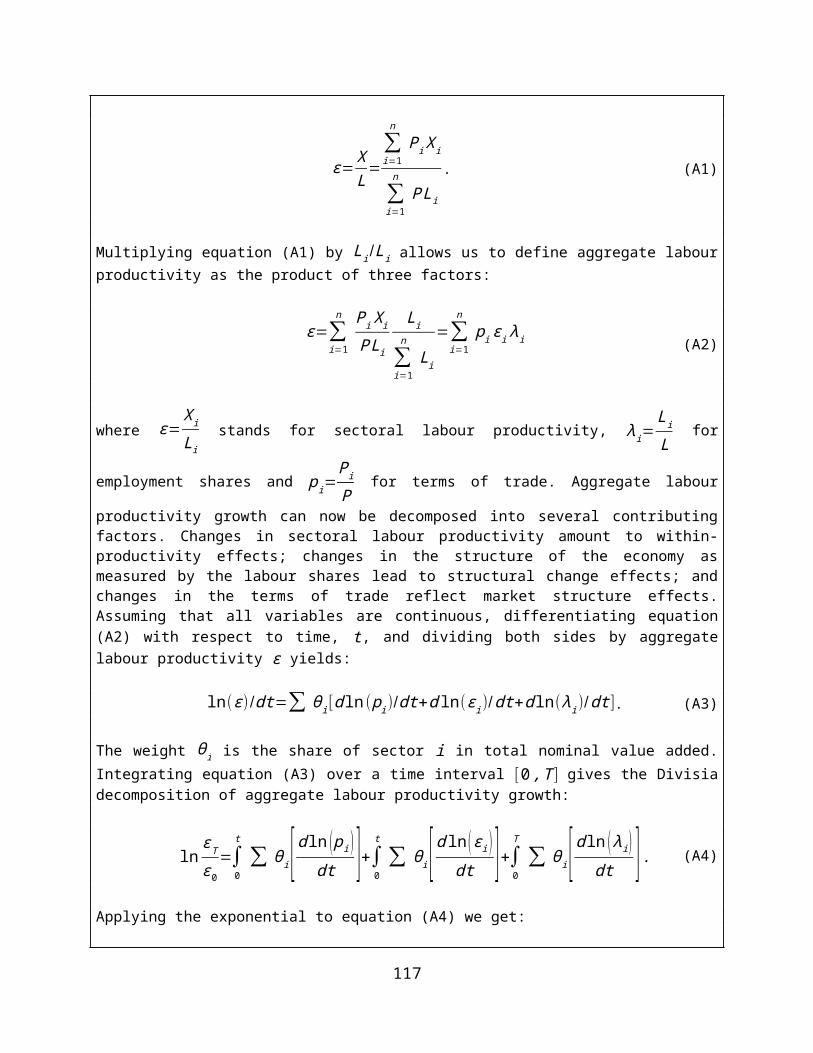
This idea was confirmed by a number of case studies.54 Based on the experience of East Asian economies, authors in this tradition stress that governments can play an important role in stimulating technological upgrading. In their interpretation, in East Asian economies, learning and innovation did not happen automatically as a result of high investment in physical and human capital. Public policies, and in particular industrial policies, ignited and sustained these processes. Industrial policy measures in East Asia were systemic, i.e. coordinated across a number of policy domains. Education policies aimed to train scientists and engineers, infrastructure investment created a science and technology infrastructure, and various incentives encouraged R&D efforts within firms (Freeman, 1987; Kim, 1992, 1997; Kim and Nelson, 2000; Lall, 2006; Lall and Teubal, 1998; Lee, 2015; Lee and Lim, 2001).
Based on this literature, evolutionary economists conclude that industrial policies should:
Focus on learning and adapt to its different phases. Firms and other actors in the innovation system learn in different ways, including through cooperation and networks; reverse-engineering, imitation, and adaptation of existing products, services, and organizational settings; and R&D and the generation of new knowledge. Industrial policies should accompany these phases and change their policy mixes accordingly (see Section 4.4. for some examples).
Experiment with different combinations of policy instruments in different technological areas, due to the uncertainty of innovation processes. This also means that government intervention should try to reduce this uncertainty by exploring new technological areas, and therefore create new business opportunities.55 In doing so, the state becomes an entrepreneur, exploring new promising technological fields, taking risks, creating new knowledge and networks, and harnessing the private sector to exploit these new business opportunities and thus contribute to the long-term vision of development of the country (Mazzucato, 2013).
3.1.7 Summarizing the industrial policy debate
summarizes the main arguments that have animated the industrial policy debate, highlighting the interpretations of the different strands of the literature reviewed in this section.
54 Nelson (1993) edited the first book on national innovation systems, analysing a number of countries, from the United States and Germany to the Republic of Korea, Argentina, and Brazil. The book documents how countries built their innovation systems and the role of the government in stimulating innovation. A similar endeavour was pursued by Kim and Nelson (2000), who extend the analysis to industrializing countries. Over time, innovation systems have also been analysed at the regional and sectoral levels. In the context of NIEs and developing countries, Malerba and Nelson (2012) examine sectoral innovation systems in information and communication technology, pharmaceuticals, and agro-food industries.55 As we will see in Section 3.2, market failures would lead to underinvestment in these areas, justifying government’s intervention.
120

Table 8: A summary of the historical debate on industrial policy
Source: Authors' elaboration based on Peres and Primi (2009).
3.2 Arguments in favour of industrial policy
Although other views have been expressed in favour of an industrial policy, the most widely accepted argument has generally been based on the notion of market failures, whereby “a competitive market system does not yield the socially efficient outcome” (Pack and Saggi, 2006: 3). This situation is exacerbated in the context of developing economies that fail to undergo the structural transformation envisioned by the standard neoclassical model because their markets are highly imperfect or missing. Market failures can be corrected through various government interventions. The literature on industrial policy and market failures is extensive.56 The discussion that follows is based mostly on Grossman (1990), who identifies three cases under which markets fail to work efficiently, namely the presence of economies of scale, externalities, and market imperfections. Each of these can be related to specific factors that are responsible for them.57
3.2.1 Economies of scale
Economies of scale consists of static and dynamic economies of scale, and strategic entry promotion discussed in further detail below.
Static economies of scale refer to an inverse relationship between average cost, or cost per unit of output, and the quantity of output, meaning that average cost declines as
56 For a review, see Grossman, (1990), Rodrik (2004), and Pack and Saggi (2006).57 A concise summary of these factors is also provided by Kosacoff and Ramos (1999).
121

output increases. The implication is that firms need to produce a minimum amount of goods in order to earn a profit. Two related features of modern industries are relevant in this context: large fixed entry costs, and the need for a minimum efficient scale of production. Large fixed entry costs (e.g. due to acquisition of capital goods and equipment, or R&D investments required prior to production) restrict the number of profitable firms in a particular industry. A minimum efficient scale of production is defined as that level of production that allows the firm to minimize its average cost. This feature of technology limits the number of firms that can be competitive within a specific industry because each firm must produce the quantity of output that is above this minimum efficient level of production. In both cases, “market failure arises because under the given technology profitable production is not possible for private producers, and the private firm neglects any positive spillover [in terms of lower prices] to consumers in making its entry decision” (Grossman, 1990: 98). In such cases, there is thus a rationale for the government to step in and subsidize firms to reduce initial fixed costs and improve overall efficiency of the production process.
Dynamic economies of scale, or learning by doing, concern cost savings made possible by the accumulation of production experience in a new activity. In other words, as the firm produces more and more output, it learns and becomes more efficient, which in turn leads to a decline in the cost per unit of output. Production is likely to be unprofitable during the learning period, which could prevent the firm from entering the industry in the first place. In the same manner as static economies of scale, there exists a rationale for the government to help firms get through the initial learning period in order to subsequently become competitive. This can be the case for firms in high-technology industries, which work on novel and complex products that require a sustained period of learning before they can use and absorb knowledge and finally be able to introduce innovations in the market. The infant industry argument (see below) can be justified on the grounds of dynamic economies of scale. Especially in the case of developing countries, this ultimately implies that on these grounds, it is possible to justify even industrial policies that target industries that are not consistent with static comparative advantages (see Section 2.1.3). As shown in Module 1, structural transformation is a source of economic growth, and some industries are stronger than others as engines of economic growth, productivity growth, and ultimately innovation and technological change. Yet, generally, market forces are insufficient to foster structural transformation and ignite inception and growth of such new and more advanced industries that either do not exist yet or are not profitable. Therefore, industrial policy should actively seek to support and protect these economic activities that have high potential to drive economic growth and technological change. The creation of new industries outside existing comparative advantages is a complex process that may require continuous effort by the government, for example through investments in infrastructure and development of physical and human capital as well as productive and technological capabilities.
Strategic entry promotion is an argument in favour of the government supporting the entry of domestic firms into global markets. It is based on the notion that in some industries, static and dynamic economies of scale and the limited size of global markets allow for profitable production by only one firm. The strategy requires that a
122
government’s commitment to support the domestic firm be credible and quick enough to deter a foreign firm from entering the market. A successful intervention produces insignificant gains for consumers (since costs of domestic and foreign firms, and hence prices, are nearly identical) but monopoly profits for the domestic firm and, hence, a net national welfare gain. The aerospace industry is a prime example of a case where governments opt for strategic entry promotion (see Section 4.3.1, and Box 13 in particular).
3.2.2 Externalities
Externalities are defined as the benefits (in the case of positive externalities) or costs (in the case of negative externalities58) experienced by a firm as a result of actions taken by another firm. Market failures arise because the firm where the action originates does not have adequate incentives to consider the effects of its action on other firms. Thus, it may shy away from activities that are not profitable for the firm, but which provide positive externalities for other economic actors (or, vice versa, undertake actions that are profitable for the firm but which have a negative effect on other economic actors). In sum, considering the positive externalities to other firms, the benefits of the investment may in fact outweigh the costs (and vice versa, in the case of negative externalities).
This is the case, for example, of education or infrastructure investments. A firm may lack incentive to provide basic education to its workers because workers might leave the firm (consequently benefiting other firms), or it may lack incentive to build a road to bring its products to the market because the road could also be used by other firms (and competitors) that did not pay for its construction. Similarly, as we will see below, individual entrepreneurs might not find innovative projects financially attractive. In the case of innovation (and in the absence of intellectual property rights), entrepreneurs might be discouraged from investing because the knowledge produced could benefit other firms. Venturing in new commercial areas or productive activities is also risky and can potentially open up new business routes for more firms that did not incur the costs and risks of the discovery process (see the argument below by Hausmann and Rodrik, 2003).
In these scenarios, the market mechanism fails because it allocates too few resources to activities that generate positive externalities, hence the need for intervention. This issue is particularly severe in capital markets, where private banks would not take into account positive externalities when evaluating socially profitable but privately unattractive projects (e.g. innovative projects). This ultimately leads to underinvestment in these projects (Atkinson and Stiglitz, 1980; Stiglitz, 1994).
In what follows, we focus on the two most relevant sources of externalities in the context of industrial policy: knowledge spillovers, and linkages and coordination failures.
58 An example of negative externalities is that of pollution from production where the polluting firm may not have enough incentives to reduce emissions, as this might entail investments in new (and often more expensive) machinery. In this case, the society as a whole suffers from the contamination that the polluting firm produces and in turn may incur such costs as additional health expenses or environmental clean-up costs that are due to the polluting firm’s actions, but that the firm does not consider when making its investment decisions.
123

Knowledge spillovers refer to the (unintentional) transfer of knowledge throughout the economy and society. Due to knowledge spillovers, a firm might obtain some knowledge without incurring the costs of producing it. This is made possible by the fact that knowledge is non-exhaustive, i.e. its use by one firm does not diminish its original value, and often non-excludable, i.e. the firm that incurred the costs of generating knowledge cannot, or can only marginally, prevent others from using it. Moreover, its use benefits from complementarities, meaning that knowledge is more useful if combined with other knowledge generated elsewhere. Due to these characteristics of knowledge, markets would allocate fewer resources than desirable to the production of knowledge. Prevention of spillovers, however, is socially undesirable because it prevents the use of knowledge by the rest of the economy. The government thus needs to strike a balance between protecting intellectual property of entrepreneurs (e.g. through patents) to give them incentives to create knowledge, and judging what knowledge, and to what extent that knowledge can be beneficial to society if freely shared with other economic actors. The case for government intervention in the event of knowledge spillovers can be considered a specific case of intervention in the supply of public goods, as knowledge shares some of characteristics of other public goods, such as education. As Grossman (1990) argues, human capital formation gives rise to positive externalities because the society and the economy benefit more from it than does a single firm (also because firms cannot prevent workers they have trained from moving to other firms). As a consequence, the market failure arises because firms will invest less than what efficiency requires to instill their workers with general knowledge (as opposed to firm-specific knowledge and skills).
Vertical linkages and coordination failures are relevant in the context of strong linkages between economic activities (see Section 3.1.2 in Module 1 for a discussion on linkages). Simultaneous investments (often in industries characterized by economies of scale) need to be made in order for these linkages to develop. Markets might generate coordination failures because single firms alone would not have enough benefits (and financial resources) to make these investments. In this case, the government can step in and coordinate investments in a manner that is beneficial for a cluster of firms and that can, when all the investments are made simultaneously, result in beneficial outcomes for all the firms involved. The government facilitates coordination of existing firms, but in the same manner it could also coordinate support for new firms (e.g. input suppliers), which would benefit existing firms in the industry (e.g. final producers in need of quality input suppliers). This has led some economists (Murphy et al., 1989; Nurkse, 1953; Rosenstein-Rodan, 1943; see also Shapiro, 2007) to advocate for a “big push” strategy, or “balanced growth path”, where complementary industries are promoted simultaneously.59
Another instance where externalities lead to underinvestment in socially valuable ventures is identified by Hausmann and Rodrik (2003) who describe industrial policymaking as a “self-discovery” process in which entrepreneurs try to discover a diversification path for their economy based on dynamic comparative advantages. This self-discovery does not necessarily imply R&D and innovation, but essentially entails finding out which goods can be produced in the country at comparatively low costs. This process is generally costly, its results are highly
59 Other economists (e.g. Hirschman, 1958) proposed a more targeted industrial strategy that selectively promotes industries with the strongest linkages with the rest of the economy. This is known as the “unbalanced growth path”.
124
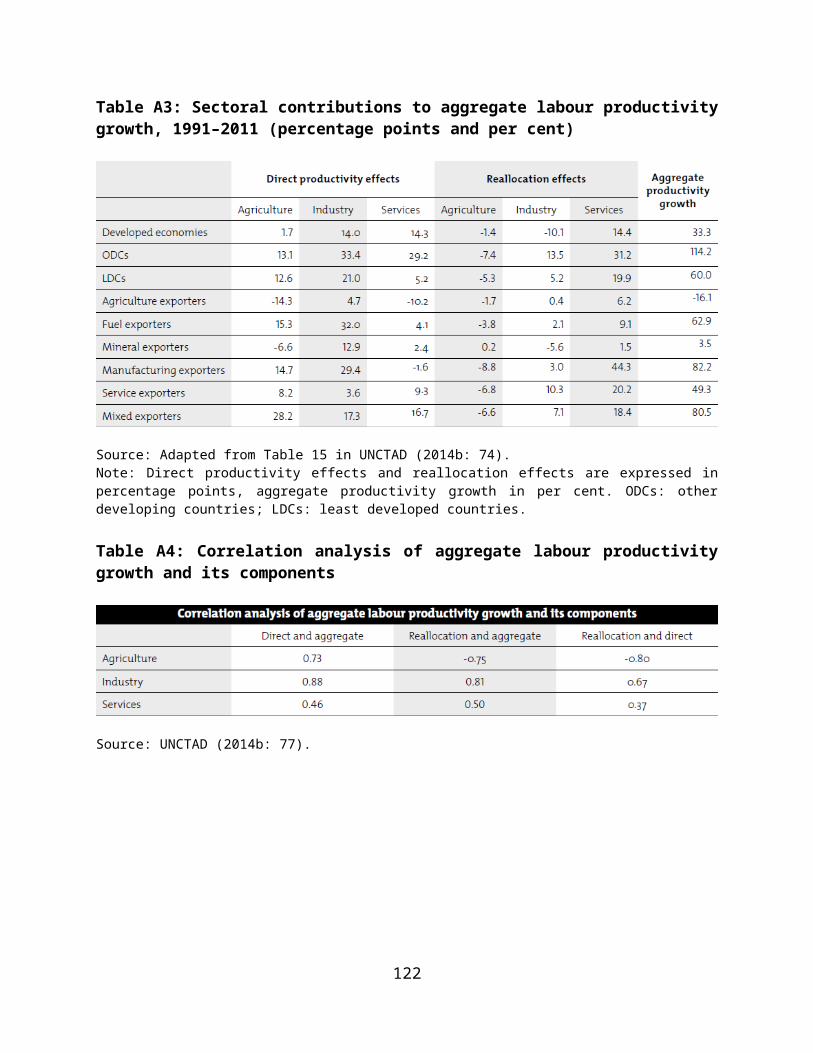
uncertain, and the social benefits of undertaking it are larger than what would accrue to private entrepreneurs. This would justify state intervention in this area. On these grounds, governments would support investments in new non-traditional industries where the economy could potentially have a dynamic comparative advantage. These investments might also be characterized by strong complementarities, needing coordination and considerable amounts of financial resources. This would further call for government’s intervention.
3.2.3 Imperfections in capital markets
Imperfections in capital markets are a third set of factors that lead to market failures. They are essentially due to informational asymmetries. Informational asymmetries in capital markets arise because the borrower knows more about the degree of risk and return of an investment than the lender does. Because of this, firms with riskier projects but also a potentially higher-than-average return (e.g. innovative projects in high-tech industries) will find it difficult to access credit and will therefore need to accept higher costs of borrowing. Lenders who are aware of this adverse selection will raise the interest rate beyond what is appropriate given the initial assessment. Hence, borrowers with marginally better projects are excluded and the overall social benefit is therefore lower than it would be otherwise.60 The government can address this issue by providing credit with lower interest rates and channelling financial resources into economic activities that are perceived as too risky by the banking system (see Section 4.2).
3.2.4 Arguments that go beyond market failures
While neoclassical economists understand market failure theory as the only possible justification for industrial policy, revisionists, structuralists, and evolutionary economists consider it too restrictive a framework. The critique of the market failure theory rests on its key principles. First, the neoclassical approach considers the perfectly competitive market as the ideal market. However, this is only one of the legitimate theories of markets. Therefore, what could be a failed market according to neoclassical theory might be a functioning market for another theory (Chang, 2003). Second, according to this theory, once the market failure is fixed, market forces will efficiently direct structural transformation towards a path of economic growth and development. However, because markets cannot always drive structural transformation towards the most promising industries and technological areas, government intervention is necessary to lead the process of structural transformation in these directions (Cimoli et al., 2009; Mazzucato, 2015; Weiss, 2013).
There are also learning-related reasons to reject the market failure theory. Revisionists, structuralists, and evolutionary economists emphasize the role of learning, capabilities, and innovation for structural transformation, giving governments the role of catalysts of these processes. Therefore, according to these strands of literature, stimulating learning, the 60 Beyond capital markets, there exists a rationale for the government to address general information asymmetries. The information asymmetry problem relates to the failure of the market to equally disperse information among economic actors. Economic actors function in a bounded reality (Williamson, 1981) and may not know which investment opportunities are available (Pack and Saggi, 2006). In such cases, the government can introduce mechanisms that allow economic actors to access relevant information and subsequently make decisions based on a wider array of background information.
125
accumulation of capabilities, and innovation are considered a key justification for government intervention (Cimoli et al., 2009; Mazzucato, 2013; Nübler, 2014; Soete, 2007). It is argued that market signals alone might discourage learning and the accumulation of capabilities because, especially in developing economies, learning opportunities might be greater in industries and economic activities where the economy is in significant comparative disadvantage. This would justify selective industrial policies and picking winners, because these interventions could direct structural transformation towards learning-intensive industries. By venturing into these industries, governments could also explore new business areas and create opportunities for other firms. Indeed, as mentioned in Section 2.1, authors in these strands of literature argue that instead of picking winners, many governments create winners, becoming leading investors and entrepreneurs (Cimoli et al., 2009; Mazzucato, 2013, 2015; Wade, 2010).
Learning is also at the basis of the infant industry argument. It justifies temporary support and market protection for particular firms or industries until they become capable of producing efficiently and surviving in international markets (Bastable, 1927; Hamilton, 1791; Kemp, 1960; List, 1841; Mill, 1848). The argument in favour of infant industry protection involves several of the conventional arguments discussed above. Taking the developing country perspective, production experience (leading to dynamic economies of scale), especially in manufacturing industries where production size, productivity, and learning are most important, provides significant cost advantages to established foreign firms. Domestic firms with little or no experience are unable to accrue such knowledge and compete with the foreign firms. In this scenario, private firms may be reluctant to establish new industries because of the high risks and high costs associated with entry in these new markets. Domestic markets, therefore, should be protected and domestic firms financially supported in order for them to take advantage of static and dynamic economies of scale and compete in regional and international markets. Finally, the realization of positive externalities, such as knowledge spillovers, and externalities arising from the accumulation of human capital through training and learning by doing, represents one of the main justifications for temporary protection of infant industries (Shaffaedin, 2000).
The infant industry argument has been used to justify ISI strategies. Although some empirical evidence showed that such temporary support and protection can help domestic industries successfully develop, it is difficult to determine whether an infant industry intervention is economically efficient, particularly because of the heterogeneity that exists between sectors (Hansen et al., 2003). It is therefore difficult to predict whether the infant industry is able to survive at a later stage without government support and whether it spreads externalities to other sectors that would balance the initial costs of support and protection.
The infant industry argument and the critique to market failure theory summarized above can be adapted to the specific case of resource-rich economies. In this respect, Latin American structuralists argue that in resource-rich economies, market forces alone will naturally drive structural change towards resource-intensive industries. Specialization based on static comparative advantages would create self-reinforcing patterns, ultimately hindering sustained economic growth and industrialization. In these cases, government intervention can play a crucial role. Selective industrial policies, in particular, can promote industries with more learning opportunities and stronger linkages to the rest of the economy, facilitating diversification and sustained industrialization (Cimoli and Katz, 2003; Ocampo, 2011, 2014).
126
3.3 Arguments against industrial policy
The main argument against industrial policy revolves around the concept of “government failure”, referring to the failures that governments can create when trying to fix market failures. Government failures can arise as side effects of both functional and selective industrial policy, but chances of government failures are higher in the case of selective policies, i.e. when governments interfere more with market functioning. As a consequence, the argument goes, unleashing the “invisible hand” would have a positive impact on economic growth and development. Government failures are also larger and more frequent in developing economies because of a generally lower capacity of governments to design and implement industrial policies.
Why do governments fail? “[G]overnments are not omniscient, selfless, social guardians and corrections are not costless,” explains Krueger (1990b: 11). Following this, three factors can be identified that may lead to government failures: information requirements, corruption, and lack of financial resources. All are related to the long-debated issue of state capacity: less capable states are also likely to be less knowledgeable, more corrupt, and less able to mobilize financial resources for policy implementation. We will now discuss these factors one by one.
First, governments need information – for example on market and export trends, technologies and innovation, and firms’ obstacles to investments and innovation – in order to design industrial policies. It has been argued that it is not clear why the state should know better than entrepreneurs which industries or technological areas are more promising, and which obstacles entrepreneurs face in their daily operations. Indeed, governments often know less than the private sector (Pack and Saggi, 2006; Rodrik, 2004, 2008). As a solution to this shortcoming, several authors advocate for more systematic cooperation with the private sector, as discussed in Section 2.3.
Corruption is a recurring theme in the debate on industrial policy. One view is that the government’s stated goal to maximize public welfare cannot be taken for granted because government officials may use public resources to win electoral support from certain groups, or for personal gains. As Rodrik (2008: 8) puts it, “[o]nce the government is in the business of providing support to firms, it becomes easy for the private sector to demand and extract benefits that distort competition and transfer rents to politically connected entities. Entrepreneurs and businessmen spend their time in the capital asking for favours, rather than looking for ways to expand markets and reduce costs.” Corruption, however, can be controlled in a number of ways, including through monitoring and performance criteria (see Section 2.3).
Finally, with respect to the lack of financial resources, Krueger (1990b) points to the high costs of maintaining state-owned enterprises (SOEs) and running investment programmes. Industrial policy also bears other costs, such as the cost of enforcing government controls and correcting government failures. Lin and Treichel (2014) also detail the costs of selective (especially comparative-advantage-defying) industrial policies: apart from the direct costs associated with SOEs, grants, and subsidies, industrial policy also entails implicit costs due to efficiency losses
127

caused by the monopolies created by the state and inefficient production scales, the resulting market fragmentation, and widespread support to domestic firms. Moreover, low or negative interest rates, overvalued exchange rates, price controls on raw materials, and import tariffs and restrictions distort market prices, increasing the costs of industrial policy. It has also been argued that public initiatives create competition to private initiatives (the “crowding out” argument). According to this argument, public investment crowds out private investment by draining away from the market financial resources that could be better utilized by the private sector (Friedman, 1978; see also Sections 4.3.1 and 4.4.3).
Most governments in the developing world have limited financial resources to guarantee basic social services like health and education and to implement industrial policies. Their fiscal space is limited by low incomes and low administrative capacity to collect taxes. Moreover, globalization poses additional challenges to increasing tax revenues: countries are in tax competition to attract FDI – a “race to the bottom” – and finance-driven globalization has led to the creation of a number of tax havens and similar settings where large firms and wealthy households can avoid taxes (Calcagno, 2015; Goedhuys et al., 2015; Guadagno, 2015b; UNCTAD, 2002). Such a limited fiscal space restricts the number and type of industrial policy instruments that the government can use.61
The concept of state capacity has attracted enormous attention in the literature.62 Governments in many developing economies are not able to effectively implement industrial policy, especially when it comes to selective industrial policies. Lall (2000) and Perez and Primi (2009) argue that the complexity of interventions and their selectivity depend on the level of bureaucratic capabilities of the state. Moreover, formulation and implementation of industrial policies require public employees with good technical and administrative skills and with experience in how to best support industries and solve urgent problems. This is what Salazar-Xirinachs et al. (2014) call “technocratic knowledge”.63 Governments with only basic capabilities should limit themselves to horizontal polices and venture into selective industrial policies only when they accumulate more capabilities. According to Altenburg (2011), state capacity has four dimensions: (a) the capability to define strategic goals and implement them effectively; (b) the capability to establish clear rules of the game for market-based competition; (c) the capability to deliver services effectively; and (d) the capability to avoid political capture. Box 9 describes several indicators that can be used to measure these four dimensions. Although widely used, these indicators have been criticized on methodological and practical grounds (Arndt and Oman, 2006; Ravallion, 2010). Constraints such as weak state capacity can be overcome and may in fact not be the prime barrier to introducing an industrial policy. To support this view, some scholars point out that the governments of East Asia managed to initiate a successful industrialization process despite weak initial capacity. For example, until the 1960s, bureaucrats from the Republic of Korea were sent to Pakistan to be trained in economic policymaking. State capacity was built over time through
61 On fiscal space, see UNCTAD (2011a, 2013a, and 2014a). For the African case, see UNCTAD (2007b).62 For a comprehensive review of the literature on state capacity, including most common measurements and methodological issues related to empirical studies on state capacity, see Cingolani (2013). On how East Asian states managed to strengthen their capacity, see Cheng et al. (1988) and Evans (1998).63 On the importance of education for the quality of governance, see Fortunato and Panizza (2015).
128
long processes of reform and experimentation, a difficult but not impossible task (Amsden, 1989; Chang, 2006, 2009; Evans, 1998; UNCTAD, 2009).64
Box 9: Measures of state capacity
Research in economics is often based on quantitative analysis. In order to perform such analysis, researchers need statistics (or economic indicators) that measure different dimensions of the economy. One of the main difficulties they face in identifying the impact of institutions on the quality of industrial policymaking and economic development has to do with how to measure the quality of institutions. According to Altenburg (2011), state capacity and good governance can be approximated by the following perception-based indicators:
(a) Strategic capability: Published every two years, the Bertelsmann Transformation Index (BTI) ranks 129 developing and transition countries according to the quality of governance, which is defined in terms of a government’s capability to define strategic goals and implement them effectively. The BTI is an aggregate of two indices: the Status Index, which evaluates the state of political transformation and the state of economic transformation; and the Management Index, which evaluates the ability of policymakers to carry out economic and political reforms. For more information see http://www.bti-project.org.
(b) Capability to establish clear rules: This capability can be approximated by the Global Competitiveness Index and the Doing Business Index. The Global Competitiveness Index, published by the World Economic Forum, ranks countries according to their competitiveness, defined as the set of institutions, policies (including transparency of government policymaking), and other factors that determine the level of productivity (see https://widgets.weforum.org/global-competitiveness-report-2015). The Doing Business Index, published by the World Bank, ranks countries according to how conducive the regulatory environment is to starting and operating a firm (see http://www.doingbusiness.org/rankings).
(c) Capability to deliver services effectively: The World Bank has put together a comprehensive database on government effectiveness indicators. These indicators are based on survey data that measure the perceptions of a large number of enterprises, citizens, and expert survey respondents on the “quality of public services, the quality of the civil service and the degree of its independence from political pressures, the quality of policy formulation and implementation, and the credibility of the government’s commitment to such policies” (see www.govindicators.org).
(d) Capability to avoid political capture: This capability can be approximated by the Corruption Perception Index prepared by Transparency International. The index ranks 180 countries according to indicators that measure perceptions of governance such as the government’s ability to control corruption, judicial independence, or favouritism in decisions of government officials (see www.transparency.org).
However, one of the problems with survey-based indicators is that opinions about government effectiveness tend to be pro-cyclical, i.e. respondents tend to have positive (negative) opinions during
64 UNCTAD (2009) proposes a pragmatic approach to build state capacity in the least developed countries. This approach is based on finding existing relevant practices and principles that fit the circumstances of the country and implementing a small number of institutional reforms to improve the political and technical capacity of the state.
129
good (bad) economic times.
Source: Authors' elaboration based on Altenburg (2011).
4 Some cases of industrial policies
The literature on industrial policy has produced interesting case studies documenting which industrial policies have worked and which have not.65 This section discusses some of the successful (and less successful) experiences with industrial policies. In doing so, it distinguishes four main roles that the state can perform with regard to industrial policy: (a) regulator and enabler; (b) financier; (c) producer and consumer; and (d) innovator.66 Most of the examples discussed in this section relate to initiatives taken at the central government level. Industrial policies, however, can also be implemented at the sub-national level. The Annex discusses characteristics and examples of sub-national industrial policies.
4.1 The state as regulator and enabler
Johnson (1982) characterizes the regulatory state as one that focuses on providing regulatory frameworks, i.e. sets the rules for business and society. The enabling state is one that facilitates and supports the provision of public services such as health and education (Gilbert, 2005; Taylor, 2008). Being a regulator and enabler means regulating market functioning, for example through competition policy, and enabling business by providing (or supporting the private provision of) basic services such as infrastructure, an educated workforce, and an efficient bureaucracy. Arduous regulatory frameworks are a concern in low-income countries. For example, surveys conducted for the 2015 Technology and Innovation Report (UNCTAD, 2015b) reveal that ill-suited regulatory frameworks are among the most severe obstacles to innovation and entrepreneurship in Tanzania.
Creating an enabling environment is important to attract FDI, as we will see in Section 4.4.2, but also to stimulate local entrepreneurship and innovation. For example, Lo and Wu (2014) described the industrial policy experience of the People's Republic of China in the last three decades as one where reforms to improve the enabling environment and policies in support of particular industries and firms were both implemented with some degree of success. The enabling function was implemented through policy measures that focused on increasing competition (through privatization of public enterprises), reforms of state banks, labour market reforms, and infrastructure investments. The latter two measures, in particular, were fundamental first to stimulate consumption-led growth, and then investment-led growth. Greater job security and higher wages, and an expansion of (urban) social services, fostered domestic demand by allowing the population to diversify consumption, thereby also spurring capital-intensive industries. Later, infrastructure development led to complementary (private) investments, for example in cars, telephones, and computers, thus contributing to the investment-led growth strategy. 65 It is worth noting, however, that given different countries’ preconditions, policymaking is highly contextual, limiting the replicability of successful experiences in other contexts and requiring countries to undertake their own experiments (Hobday, 2013).66 This distinction builds on Peres and Primi (2009) (also adopted by UNIDO, 2013), who distinguish between four roles: regulator, financier, producer, and consumer.
130
The example of the Republic of Korea provides a number of policy lessons that could be adapted to other contexts. Cheon (2014) reviews the education and training policies implemented there between 1965 and 1995, the country’s industrialization period. For the sake of our discussion, the most important feature of these policies was that they were truly designed as an industrial policy, meaning that they were intended to stimulate structural transformation. Education and training policies were gradually upgraded throughout the different phases of the country’s industrial strategy. The establishment of universal primary education in the 1960s was followed by an expansion of technical and vocational training in the 1970s aimed at accompanying the heavy and chemical industry drive of the 1970s. In the 1980s, universal middle-school education and expansion of higher education set the stage for the promotion of knowledge-based industries. The expansion of graduate programmes in the 1990s helped promote structural transformation towards high-tech industries. The alignment with other industrial policy measures was further achieved through enrolment and graduate quota systems, through which the government established how many students were allowed in each college based on estimations of industry needs. This policy measure was so successful that by the end of the century, the Republic of Korea had produced among the highest proportions of scientists and engineers in the world.
Ethiopia is currently trying to implement a similar approach: net enrolment in primary education increased from slightly more than 20 per cent in 1990 to over 70 per cent in the mid-2000s. The fast growth of primary education is fueling an increase in secondary enrolment. Technical and vocational training and higher education are also expanding, albeit at a slower pace. Expanding primary education at such a large scale and for such a huge population has been a major challenge: from 1997 to 2013, there was a 190 per cent increase in the number of primary schools in operation, and more than 19,000 primary schools were built between 1992 and 2012. Apart from the benefits strictly related to education, this policy has also created jobs for teachers as well as in construction and in the production of cement and other materials and goods needed to build and furnish schools (Lenhardt et al., 2015). The Ethiopian government has also set enrolment quotas for undergraduate studies according to which 70 per cent of students should enrol in scientific and engineering faculties, and the remaining 30 per cent in humanities and social sciences. While these policies are creating some concerns relating to the quality of education, they are clearly aimed at facilitating Ethiopian structural transformation.
Apart from basic education, technical vocational education and training is important, particularly for the accumulation of skills and upgrading in technologically advanced industries. In Viet Nam, the government has supported technical vocational education and training through the formulation of a strong policy framework to develop a profession-oriented education system and convert most existing universities into professional higher education institutions. The system connects the curricula with the changing needs of the industrial and services sectors, increasingly involving firms’ representatives in the development of curricula and quality standards (ADB, 2014; UNCTAD, 2011c).
4.2 The state as financier
For a very long time, economists have worked under the assumption that the financial sector had little to do with economic growth. Beginning with the work of King and Levine (1993a, 1993b),
131
an extensive literature began to emerge demonstrating that the financial sector actually plays a crucial role in promoting economic growth and development. A functioning financial sector is one that increases the quantity of finance available for enterprise development and ensures the quality of investments through particular institutions that proactively “guide” capital into growth-oriented enterprises based on – and in conjunction with – an existing industrial policy programme.
As discussed in Section 3.2, market failures, and in particular the existence of positive externalities and capital market imperfections, create a discrepancy between the social and the private value of certain investments, leading to underinvestment in projects with greater externalities or a high risk profile (e.g. innovative projects). In evaluating projects, private financial institutions do not take into account potential linkages and complementarities between industries, leading to the coordination failures discussed in Section 3.2.2. Externalities and capital market imperfections call for government intervention in the financial sector. In this regard, governments can provide resources and coordination to prioritize investments in industries with the highest potential for externalities and the strongest linkages with the rest of the economy, also guaranteeing minimum efficient scales. SMEs are generally credit-constrained due to the capital market imperfections described in Section 3.2.3. Facilitating SME access to credit helps them expand their businesses, and therefore become more productive and employ more people. Moreover, SME support schemes can be a vehicle for the formalization of businesses, as firms are required to be formally registered to have access to government programmes. Various institutions, institutional arrangements, and policy instruments have been important in this domain. This section focuses on development banks, SME support, and a relatively advanced policy instrument that has proved to be effective in industrialized economies: state venture capital and loan funds.
4.2.1 Development banks
Financial constraints are often cited as one of the major obstacles to investment in developing countries. An underdeveloped financial sector contributes to a scarcity of available capital, limiting local firms’ chances to grow, boost their competitiveness, and enter new markets (UNCTAD, 2007b, 2014b).67 Developed economies also suffer from imperfections in capital markets, albeit of a different nature. It has been argued that their financial sectors do not promote investments in the real economy and do not reward the most worthy firms, understood as the most innovative and risk-taking firms that create value and new business opportunities.68
Development banks aim to address these imperfections. During the post-war period, they played a major role in implementing industrial policy in almost all successful structural transformation
67 Empirical studies using, for example, the World Bank Enterprise Survey dataset, confirm this. For more details on these studies, see http://www.enterprisesurveys.org/research. To access data, see http://www.enterprisesurveys.org/data. 68 The European Financing Innovation and Growth (FINNOV) initiative has produced interesting studies on this topic. For more details, see http://www.finnov-fp7.eu. The INET-Levy Institute’s Financing Innovation Project has also been contributing to this debate. Outputs of this project can be found at http://www.levyinstitute.org/inet-levy .
132

experiences (Amsden, 2001). The most telling European experience is that of the then Federal Republic of Germany, where the state’s Reconstruction Loan Corporation (Kreditanstalt für Wiederaufbau – KfW) proved valuable in providing finance to back up an industrial-policy-driven recovery (Weiss, 1998). Today, KfW still plays a fundamental counter-cyclical and entrepreneurial role, guaranteeing investments in periods of low private investment and facilitating access to credit for the most innovative projects (Mazzucato and Penna, 2014).69 Japan, too, used state development banks to underpin an industrial policy based on capital-intensive industries such as motor vehicles, electronics, and shipbuilding, and to build a supportive infrastructure (Johnson, 1982).
Amsden (2001) finds that state development banks were behind the industrial development success of virtually all of the “late industrializers”, as well as the early examples of the Republic of Korea and Brazil (see Box 10).70 In the Republic of Korea, the state controlled the financial sector and established financing institutions – notably the Korea Development Bank (KDB) – to support its industrial policy goals. The KDB operated alongside various other state-owned banks that could also be instructed to support the government’s industrial policy objectives. In contrast to Brazil and the Republic of Korea, other countries like India opted for a different strategy: creating several specialized financial institutions whose mandates were restricted to particular industries such as power or shipping (Chandrasekhar, 2015).71
Box 10: The key role of BNDES in realizing Brazil’s industrial policy objectives
A textbook example of a large and influential development bank is Brazil’s National Bank for Economic and Social Development (Banco Nacional de Desenvolvimento Econômico e Social – BNDES). Established in 1951, BNDES greatly contributed to the ISI strategy implemented during the post-war period and the EOI strategy implemented since the 1970s. Benefiting from its close relationship with the government and strategies to guarantee an ever-increasing flow of resources, BNDES was able to specialize in the provision of medium- and long-term financing to projects in the industries targeted by the government (i.e. non-ferrous metals, chemicals and petrochemicals, paper, and machinery and equipment).
Lending activities have always been concentrated: in the 1950s, chemicals and petrochemicals accounted for 35.7 per cent of BNDES loans to manufacturing, and the metallurgical industry accounted for 34.5 per cent (Guadagno, 2015a). In 2012, two-fifths of BNDES loans were allocated to its five top borrowers,
69 In recent years, counter-cyclical lending has been a priority of many development banks such as the National Bank for Economic and Social Development (BNDES) in Brazil, the China Development Bank, and the European Investment Bank. Given their sizes, these banks could at least in part offset the decline of private investments (UNCTAD, 2015b).70 “Late industrializers” refers to economies that, by the end of World War II, had already gained some manufacturing experience. These include the People's Republic of China, India, Indonesia, the Republic of Korea, Malaysia, Taiwan Province of China, and Thailand in Asia; Argentina, Brazil, Chile, and Mexico in Latin America; and Turkey in the Middle East.71 Regional and local state development banks have also undertaken direct financing of industrial development projects. The then Federal Republic of Germany is a useful case in point, thanks to its regional state banks –ländesbanken – that were able to channel funds to SMEs, and particularly to the Mittelstand (medium-sized enterprises).
133

among them Petrobras, the state-controlled oil company (Chandrasekhar, 2015). Priority was given to projects directed towards acquiring (national) capital goods and equipment, a cornerstone of Brazil’s ISI strategy. To this end, in 1964, BNDES launched the Financing of Machinery and Equipment Programme (Financiamento de máquinas e equipamentos – FINAME). In the years that followed, similar programmes were launched in other NIEs such as the Republic of Korea and Mexico. In the mid-1970s, FINAME loans accounted for 1.5 per cent of Brazilian GDP (Guadagno, 2015a) and by 2013, for more than 3 per cent (Guadagno, 2016).
BNDES succeeded in helping establish a steel industry and make Brazil a major exporter of steel. The automobile industry also greatly benefited from BNDES activities. Thanks to careful oversight of its clients, BNDES was able to ensure that its loan facilities leveraged important technological benefits for the companies and, more importantly, for the local communities or industries in which they operated. One of its most famous successes – the aircraft manufacturer Embraer – was assisted in finding an important niche in the global aircraft sector. Through its offices across Brazil, BNDES also supports the SME sector, providing loans to promising SMEs and, even more importantly, attaching “local content agreements” to loans to big companies.
In the 2000s, BNDES expanded its foreign operations, supporting regional economic integration and investment promotion in neighbouring countries, strengthening links between Brazil and other developing regions (particularly Africa), and supporting the internationalization of Brazilian firms. In 2014, 14 per cent of BNDES loans were in foreign currency (UNCTAD, 2015c). Finally, since the 2007–2008 financial crisis, BNDES has played a counter-cyclical role in the economy, stimulating investments to reverse the economic downturn.
Source: Authors’ elaboration based on Amsden (2007), Chandrasekhar (2015), Ferraz et al. (2014), Guadagno (2015a, 2016), and UNCTAD (2015c).
What do the development banks do? Their role in industrial policy programmes is fairly straightforward: they are the financial arm of the state, “mandated to provide credit at terms that render industrial and infrastructure investment viable” (Chandrasekhar, 2015: 23). Development banks are in direct contact with, or are supervised by, ministries or other government bodies, fostering cooperation and ensuring policy coherence. They mobilize resources either domestically or internationally through government funds, official development assistance, bonds, and fiscal revenues.72 Once resources are mobilized, development banks invest these resources in industrial and infrastructure projects. They design and manage credit lines with subsidized interest rates, evaluating the developmental impact of the projects that seek financing and selecting projects that are more strategic and/or in line with government industrial plans (e.g. projects that aim to increase firms’ competitiveness or projects with a high social value, such as those that help marginalized segments of the society or are carried out in rural areas). Apart from credits, which are by far the most important instrument, development banks also provide equity investments, grants, trade finance, technical support, venture capital, and other financial instruments tailored to the needs of micro and small enterprises, such as mezzanine financing, convertible financing, and subordinated equity.73 Development banks also need to monitor the activities of the firms to which they lend, sometimes by nominating directors of their boards. 72 Whatever sources of funding they rely on should have a medium-to-long-term maturity; only in this way can they match the maturity of the credits that they provide, thereby guaranteeing matching maturity of assets and liabilities.73 See Guadagno (2016) for a description of these instruments.
134

How can we quantify the size of development banks? One indicator to measure development banks’ activities is the share of development bank loans in GDP.74 Figure 26 depicts the enormous resources channelled through BNDES and KDB between the 1960s and the 1980s. It also shows the gap in lending between these two banks: KDB invested between 4.5 and 8 per cent of GDP of the Republic of Korea; BNDES invested between 0.9 and 3.4 of Brazilian GDP. To put these numbers in perspective, in the mid-1970s, the government of the Republic of Korea spent 2.2 per cent of its GNP on education, and the Brazilian government 3.6 per cent.75
Figure 26: Development bank lending as a share of GDP, 1960–1990 (per cent)
Source: Authors' elaboration based on Table 4.14 in Guadagno (2015a: 106).Note: BNDES: National Bank for Economic and Social Development, Brazil; KDB: Korea Development Bank.
More recently, the industrial success of the People's Republic of China has also been underpinned by a huge development bank, the China Development Bank (see Box 11).
74 These are based on publicly available data published in banks’ annual reports and financial statements. Depending on the details provided by the bank, the researcher can also verify how important certain manufacturing industries are in the bank’s loan portfolio. 75 Figures from the World Bank's World Development Indicators (WDI).
135
Box 11: The role of the China Development Bank in China’s “going out” strategy
Established in 1994, the China Development Bank (CDB) initially contributed to the Chinese urbanization project, mobilizing funds and channelling them into infrastructure and housing. This was mainly achieved by lending to local government financing vehicles, the instruments through which provincial governments could borrow in order to finance their infrastructure projects. These loans accounted for roughly half of total CDB loans (Sanderson and Forsythe, 2013). Later, the bank fostered the expansion of important manufacturing industries such as telecommunications, and wind and solar energy, supporting the government’s “going out” strategy to help Chinese firms expand to foreign markets. In this area, the bulk of CDB activities concerned vendor financing credits and loans for oil. The former consist of loans provided to credit-constrained international customers of Chinese firms. The CDB intervenes by providing credits to these international buyers. These credits allow the buyer to pay the Chinese firm while the Chinese firm gains a new market. Some of these deals might also have the features of loans for oil, meaning that buyers can pay back their loans to the CDB by supplying oil or other commodities to local Chinese governments or firms.
The bank also owns an equity investment fund, the China-Africa Development Fund (CADF), which is dedicated to Chinese investments in Africa, where it provides equity and quasi-equity investments and technical support to firms starting up operations. Investments by the fund mainly involve infrastructure, but also agriculture, manufacturing, and resource extraction. In all these fields, the CADF can benefit from the CDB’s long-standing experience in evaluating projects, assisting clients throughout the different phases of their projects, and the contacts that the bank has developed. In 2014, the foreign currency loans provided by the CDB totalled US$267 billion, equalling roughly 22 per cent of total loans by the bank (UNCTAD, 2015c).
Today the CDB is huge: in 2011, its assets were estimated at US$991 billion, more than three times those of BNDES in Brazil, nine times more than KDB in the Republic of Korea, and almost double those of the World Bank (Sanderson and Forsythe, 2013). In 2012, the CDB was the fifth largest lender in the People' Republic of China, providing roughly 6 per cent of total credit in the economy and lending amounts close to 12 per cent of Chinese GDP (Guadagno, 2016). An example of its operations is the recent “Silk Road” strategy which involved large infrastructure investments in Asia.
Source: Authors' elaboration based on Chandrasekhar (2015), Guadagno (2016), Sanderson and Forsythe (2013), and UNCTAD (2015c).
What is the size of the loan portfolio of the most active development banks today? Guadagno (2016) analyses the experience of eight influential development banks: the Hungarian Development Bank (MFB), Brazil’s BNDES, China’s CDB, the South African Industrial Development Corporation (IDC), the Industrial Development Bank of Turkey (TSKB), the Small Industries Development Bank of India (SIDBI), the Viet Nam Development Bank (VDB), and the Development Bank of Ethiopia (DBE). Figure 27 shows the share of their loans in GDP in 2012. These banks spent between 0.1 and 11.7 per cent of their countries’ GDP on loans. Despite the lower incomes of Viet Nam and Ethiopia, their development banks are very active, devoting (mostly industrial) credits amounting to 7.5 and 1.7 per cent, respectively, of their countries’ GDP. The figure also shows how large the loan portfolios of BNDES and CDB are, representing 10.4 of Brazilian GDP and 11.7 per cent of Chinese GDP, respectively. As a benchmark, in
136
2012, the Chinese and Brazilian governments spent 3 and 4.5 per cent of their respective GDPs on public health.76
Figure 27: Development bank lending as a share of GDP, 2012 (per cent)
Source: Authors' elaboration based on Guadagno (2016).Notes: SIDBI: Small Industries Development Bank of India; IDC: South African Industrial Development Corporation; TSKB: Industrial Development Bank of Turkey; MFB: Hungarian Development Bank; DBE: Development Bank of Ethiopia; VDB: Viet Nam Development Bank; BNDES: National Bank for Economic and Social Development, Brazil; CDB: China Development Bank.
Guadagno (2016) also shows that these development banks address a market failure in the economy because they provide a type of “patient capital” (i.e. medium- and long-term credits) that private banks only provide in rationed quantities. Patient capital allows firms to undertake long-term industrial projects, for example to expand, modernize, or diversify production. shows average maturities of loans by BNDES and the ten major banks operating in Brazil in 2012. The vast majority of loans by those Brazilian banks have a maturity of less than three years; the opposite occurs in BNDES, with 75 per cent of the loans having a maturity of more than three years. If we look at loans with the longest maturity (more than 15 years), BNDES outperforms the other major banks with 9.2 per cent against 1.9 per cent of these loans in its portfolio.
76 Data from the World Bank’s World Development Indicators.
137
Figure 28: Average maturities of BNDES loans compared to maturities of major banks in Brazil, 2012 (per cent)
Source: Portugal (2013).Note: BNDES: National Bank for Economic and Social Development, Brazil.
4.2.2 Support for small and medium-sized enterprises
From the 1940s onward, a number of economists claimed that large industrial corporations are not the only meaningful source of innovation as SMEs can also contribute to it (Acs and Audretsch, 1990; Galbraith, 1971; Schumpeter, 1942). SMEs can be of two types: under-sized, low-productivity SMEs, which Nightingale and Coad (2014) call “muppets”, or early-stage and highly innovative SMEs, which they call “gazelles”. The latter can have an advantage over larger enterprises thanks to their agile organization, with less bureaucratic structures that allow for creativity and innovation. New SMEs are also blessed by their lack of prior history: since they are not locked into any specific product or process from which they generate profits, they are keener to adopt or develop new breakthrough innovations. A particular type of SMEs is the spin-off, a small entrepreneurial firm created by managers or engineers leaving large corporations, universities, or research institutes. Spin-offs were given huge retrospective justification in the United States on account of the growth and development impetus they provided in several locations, notably in the Silicon Valley in California.
In advanced countries, entry of new industrial SMEs has proved to be crucial to the success of industrial policy. Storey (1994) showed that it was only a few new SMEs that gave impetus for structural change through technology upgrading and innovation. The key for industrial policymakers is to try to identify “gazelles”, the innovative SMEs described above, and focus resources on helping them improve and expand. The alternative to this – a “scatter-gun” approach to new entry – would involve the entry of large numbers of enterprises, the majority of which would exit the market after a few years. Nightingale and Coad (2014: 136) point out that “[a]cross the board policy enthusiasm for entrepreneurial start-ups, no matter their quality, might be seen as another policy fad.” Their recommendation, very much following Storey (1994), is that industrial policy should focus on supporting not muppets, but gazelles, as they have the highest potential to make the largest impact on the economy. This impact could be achieved via generation and/or deployment of key technologies, ability to innovate, fostering of export potential, and the use of highly-skilled labour.
While the identification of such high-impact enterprises is not a perfect science by any means, the success of many enterprise development programmes, and of the private venture capital
138
industry as well, would suggest that it is indeed possible to identify the most likely high-impact enterprises and run with them. Moreover, even in cases when such high-impact enterprises close down quite quickly after launch, the possibility exists to recycle and recombine the capital equipment, knowledge, skilled labour, and other forms of acquired value through and into other local enterprises. For example, Taiwan Province of China relied on a very determined industrial policy programme aimed at supporting new high-tech SMEs (Lall, 1996; Wade, 1990). After 1960, numerous technology development organizations were founded to support these SMEs, including science parks (notably the Hsinchu Science Park, whose tenants in 1995 accounted for 4.2 per cent of output of Taiwan Province of China and 17.5 per cent of total R&D spending; see Amsden, 2001). Other organizations such as the public Industrial Technology Research Institute (ITRI) cooperated extensively with local SMEs, spinning off a number of them, most notably in electronics (see also Section 4.4.1).77 Early-stage SMEs also received support in order to help them achieve minimum efficient scales with state orders and assisted local purchases and other discount schemes (Wade, 1990).
In developing economies, SMEs are predominantly muppets. Despite their low productivity and often informal nature, these firms generally constitute the bulk of industrial production in such countries. This also means that they often represent the only source of jobs and incomes for large portions of the population, especially in rural areas. Due to this, many governments have implemented policies to support their growth. The Ethiopian government, for example, has implemented a programme to support micro and small enterprises by providing them with financial support, thus contributing to their formalization and the consequent reduction of informal employment. In this way, the government is tackling one of key determinants of the missing-middle phenomenon facing the country (see Box 12 for a short discussion), namely the lack of finance. According to some estimates (World Bank, 2015), the share of SME lending in overall lending in Ethiopia is among the lowest in sub-Saharan Africa, accounting for only 7 per cent of total lending. This is mainly due to the particularly high collateral rates required to obtain a loan. In this regard, the partial credit guarantee scheme offered by the government further helps SMEs access credit markets (Lenhardt et al., 2015; World Bank, 2015).
Box 12: The “missing middle” phenomenon
The expression “missing middle” refers to a crucial characteristic of productive structures of many African economies. These structures are typically composed of a myriad of micro and small enterprises, with only a few large enterprises and far fewer medium-sized enterprises. Large firms are generally capital-intensive, resource-based, import-dependent, or assembly-oriented, and are often affiliates of foreign firms or SOEs. Micro and small firms employ considerable portions of the workforce, but have low productivity levels, use basic technologies, and are generally informal. This creates a productivity divide between large and small firms, contributing to the structural heterogeneity described in Module 1 of this teaching material. Empirical research in this area has shown that the main obstacles to firms’ growth in these economies include lack of finance, family-dominated ownership structures, and entrepreneurs’ preferences to remain small and avoid formalization (Iacovone et al., 2014; UNCTAD, 2001). Apart from facilitating access to finance, governments can initiate the creation of linkages and networks between more and less productive firms (Kauffmann, 2005; UNCTAD, 2006a).
Source: Authors.
77 For more details, see Hu et al. (2005).
139
4.2.3 State venture capital and loan funds
At higher income levels, state venture capital funds have proved to be important contributors to industrial policy programmes, supporting innovations that could be commercialized by local companies. For example, Ireland’s development agency, “Enterprise Ireland”, has been a pioneer in using its own venture capital fund to support export-oriented innovative enterprises. The success of Enterprise Ireland’s equity stakes in a number of high-technology start-ups has been shown to have provided a major fillip to local industrial development and plans to reorient Ireland’s economy away from traditional industries (Barry and Topa, 2006). In Israel, the Office of the Chief Scientist financed investments in many new technologies and created an industrial network that is said to be one of the world’s best examples (Breznitz and Ornston, 2013).
Another country that very creatively used the state venture capital model is Finland. A low-technology-based economy until quite recently, Finland has enjoyed remarkable success thanks to a range of industrial policy programmes, and especially thanks to a number of public venture capital funds. Two such funds in particular have played a decisive role in facilitating innovation-led structural transformation. The first, and by some accounts the most dynamic, is SITRA, the Finnish National Fund for Research and Development. Established in 1967 as a state investment fund that operated as part of the Bank of Finland, SITRA was tasked with promoting innovation in SMEs. By taking equity stakes in early-stage innovative SMEs, and by supporting a range of other venture capital funds, SITRA was able to leverage large amounts of capital into innovation industries. A noted contribution was SITRA’s support to develop a local high-tech SME network that Nokia was later to rely heavily upon for highly specific inputs and R&D activity in relation to its mobile phone operations (Breznitz and Ornston, 2013).
The other institution of note here is Finland’s development agency, TEKES, the Finnish Funding Agency for Technology and Innovation. TEKES also provides large sums of capital to underpin early-stage innovative SMEs. By 2000, it enjoyed a budget of roughly 400 million euros to support R&D activities and in general the drive to establish a knowledge-based economy. TEKES-supported SMEs could also link into the growing capacity of Nokia, not least because TEKES was also responsible for co-financing the software protocol for the GSM digital mobile communications standard that launched Nokia on to the world stage.
4.3 The state as producer and consumer
The role of the state as producer is probably the most controversial in the literature. States have often decided to directly produce goods or technologies that they deem strategic for the industrial development of their economies. In certain industries, minimum efficient scales of production require firms to make huge fixed capital investments, with all the risks associated with such investments. Especially if the state considers an industry particularly strategic, it might see it as beneficial to invest in it by setting up public enterprises (SOEs). The state can also act as a consumer through public procurement. In this area, state intervention can be justified on the
140

grounds of externalities: by procuring goods characterized by high externalities (e.g. infrastructure, education and health, science and innovation), governments can re-establish the socially desirable rate of investment in those areas. Public procurement can also be justified by the promotion of strategic entry, for example in the case of defence procurement. We will now discuss these two policy instruments one by one.
4.3.1 State-owned enterprises
SOEs are one of the industrial policy instruments that have generated opposing views in the literature. Some observers, mostly in the neoliberal tradition, have criticized the use of SOEs because of their high costs, which aggravate the fiscal deficits of developing countries, and their inefficiency. The main cause of such inefficiency, it was argued, is that public enterprises have no clear residual claimant, meaning that no one has a clear interest in the firm generating profits (as no one can claim benefits at the end of operations). In the absence of a market for the assets of public firms, managers are not threatened by external takeovers. This lack of competition translates into a lack of self-discipline, which ultimately reduces incentives to be efficient (Alchian and Demsetz, 1972; Grossman and Hart, 1986). Another argument against public enterprises is that they crowd out private investments, i.e. they subtract excessive portions of credit to private entrepreneurs who would perform better than governments in running businesses. Indeed, in operating SOEs, government officials might also be subject to conflicting objectives, leading to corruption and favouritism. Moreover, it was argued that SOEs are inefficient because they follow national interests, rather than pursue profit maximization (Bennedsen, 2000; Buchanan et al.; 1980; Niskanen, 1971; Shleifer and Vishny, 1994; see also Floyd, 1984; Shleifer, 1998; Shirley, 1999; and World Bank, 1995).
Others noted that in some cases SOEs have acted as engines of technology development and transfer. Empirical evidence shows that while at times SOEs have aggravated public deficits, becoming a burden to the state, in other cases they have been at the vanguard of structural transformation and industrial upgrading (Amsden, 2007). SOEs were also crucial as they “strengthened professional management, invested in R&D, and became a training ground for technical staff and entrepreneurs who later entered private industry” (Amsden, 2001: 214). Europe is not unfamiliar with the role that SOEs can play, especially if their activities are linked to major industrial development projects (see Box 13 for an example). In post-war Austria and France, for example, SOEs took the lead in transferring technologies and introducing innovations into heavy industries. In the United Kingdom in the same period, under-investing private enterprises were displaced by public ownership in order to raise efficiency and increase R&D and investments in state-of-the-art technologies.
Chang (1994) reports that while the Republic of Korea’s industrial policy experience was largely forged in cooperation with privately owned enterprises (chaebols), whenever private enterprises were not up to the task, the state regularly set up a SOE (Chang, 1994; see also Chang, 2002; Chang and Grabel, 2004). This was, for instance, the case of POSCO, the Pohang Iron and Steel Company established in 1968 (Amsden, 1989; Sohal and Ferme, 1996). Other successful
141
experiences are PEMEX, Petrobras, and the China Petroleum Company, the oil companies of Mexico, Brazil, and China, respectively, as well as Embraer in Brazil (Goldstein, 2002).78 Spillovers from technological and human capital investments undertaken by SOEs greatly benefited local firms by providing them with a trained workforce, professional managers, and knowledge in the field of engineering and equipment for petrochemical plants (Amsden, 2001). At lower income levels in India, for example, the government established two SOEs, Hindustan Antibiotics Limited and Indian Drugs and Pharmaceuticals Limited, in order to create production capacity in the pharmaceutical industry (Guadagno, 2015b). In Ethiopia, during the rule of the Provisional Military Administrative Council (1974–1991), SOEs developed certain technologies that were later adopted and further advanced by private firms (Vrolijk, forthcoming).
State ownership has also been a cornerstone of Chinese industrial policy: while the value-added share accounted for by SOEs decreased as a result of the reforms of the 1990s, it has steadily increased since the 2000s, reaching 38 per cent in 2010 (Lo and Wu, 2014). Most Chinese SOEs are large-scale and capital-intensive, reflecting the strategic nature of state investments. An illustrative example of the role of Chinese SOEs comes from the high-speed railway industry, where “main vehicles for the development of frontier technology are the SOEs” (Lo and Wu, 2014: 320). In this industry, the Chinese government realized that it could not rely on transnational corporations (TNCs) to develop breakthrough innovations. Although their presence in the country had facilitated absorption and accumulation of knowledge and skills by local firms, TNCs did not have enough incentives to start innovative projects in the country. In a matter of a few years, SOEs were able to import and absorb the technologies used by the TNCs and improve them further, which led in 2009 to the development of an entirely domestically produced train that could reach the speed of 500 km/hour.
Box 13: Airbus as an example of the positive role of state-owned enterprises in industrial policy
Once a market sector dominated by US-based companies, aircraft manufacturing requires massive resources, perfecting and going beyond state-of-the-art technologies, an innovative mindset that encourages experimentation, and a solid network of SMEs producing to extremely high tolerances. For political, security, and economic reasons, the European Union set a goal of establishing an aircraft industry capable of competing with the aircraft corporations based in the United States. Consequently, the Airbus Corporation was founded in 1970 by a consortium initially composed of France, Germany, the United Kingdom, and the Netherlands. Airbus pioneered forms of cross-border knowledge and information-sharing that would have been impossible without the mediating presence of the various states. It pioneered new technologies such as those in the field of carbon composites and fly-by-wire technologies. Finally, it developed a strong network of subcontractors that received technical support from the head office and affiliates. Extensive and consistent state support was provided by all consortium members in order to get the Airbus project into operation. Scholars assessed the impact of Airbus in positive terms, pointing to positive technological externalities benefiting other economic activities (Neven and Seabright, 1995).
Source: Authors.
78 Steel, oil, and aerospace are all large-scale capital-intensive industries where economies of scale and minimum efficient scales are paramount.
142

SOEs can also play an important role in fulfilling an industrial policy mandate at the regional or local level, as shown in the case of Medellin, Colombia (Box 14). In particular, the willingness and ability of an enterprise to support a local network of subcontracting SMEs is a valuable asset for the community, but one that has become more difficult to achieve due to globalization and GVCs. Privately-owned enterprises are far more likely to abandon the local community and local subcontracting chains than are local public enterprises, which generally imbibe strategic goals other than simply profit maximization (McDonald and Ruiters, 2012).
Box 14: The role of state-owned enterprises in local development: The case of Medellin
Empresas Publicas de Medellín (EPM), established by the regional municipality of Medellín, Colombia, has played a central role in spurring economic growth depressed since the 1980s. Thanks to its contribution, Medellín was voted in 2014 the world’s most innovative city owing to its progress in urban development, social inclusion, and the creative use of technologies. EPM has also helped implement an industrial policy. By channeling around 30 per cent of its revenues into economic and social development programmes, it has contributed to the technological upgrading of the city, relaxing the budget constraints faced by most other Colombian cities. The Medellín Cluster City Programme, a major business incubation programme, was established and funded by EPM. The programme involves six strategic clusters in electric power; textiles, apparel and fashion design; construction; tourism; medical and dental services; and information and communication communications technology (ICT). In addition, its fluid relationships with local SMEs and subcontractors facilitate knowledge and technology transfer, improving the quality of goods and services by subcontractors, and maximizing its impact on the local economy.
Source: Authors' elaboration based on Bateman et al. (2011).
Despite the evidence of these successes, history is replete with cases of inefficient SOEs. Some cases can help to illustrate the mistakes that government can make in establishing and running SOEs. Inefficiently managed SOEs can lead to capacity underutilization and financial losses, culminating in bankruptcy, as was the case of many African SOEs (e.g. the Tanzanian Morogoro shoe factory, which was created to boost exports but never operated at more than 4 per cent of its installed capacity; see Easterly, 2001). Lack of managerial skills can delay production and create inefficiencies in daily operations, as happened in the early history of the Altos Hornos, the steel mill established in Mexico in the early 1940s (Amsden, 2001). Conflicting interests can create conflicting incentives: for example, in the case of a sugar milling monopoly established in Bangladesh, the government required farmers to sell sugar cane at below-market prices. This induced farmers to plant other crops, creating a shortage of sugar cane and a consequent increase in sugar prices (World Bank, 1995).
4.3.2 Public procurement
Through public procurement, governments and state agencies procure goods and services for their own use, guaranteeing sufficient demand. By setting standards and technical characteristics that the procured good must have, governments can also spur technological change and act as knowledgeable consumers with which firms can interact and cooperate. Clearly, this policy
143
instrument requires that governments, or better yet, state agencies, possess the necessary technical knowledge and capabilities to perform this task.
Textbook examples of effective public procurement come from the computer and semiconductor industries, where the US government and its military agencies directed the scientific and technological efforts of firms by specifying the technical characteristics and requirements of the goods they procured. Similar strategies also led to successful innovations and investments, for example in aeronautics.79 Public procurement also plays a crucial role in Europe, where recent estimates indicate that it accounts for roughly 16 per cent of the European Union’s GDP, double the amounts for public health expenditures (Farla et al., 2015).
More recent experiments with procurement come from the Republic of Korea and Malaysia. In the former case, public procurement has been used since the 1970s to guarantee stable demand for firms’ products and a source of revenue for them. In the latter case, the government required recipients of government support to source a portion of their production domestically, therefore imposing local content requirements (Felipe and Rhee, 2015). Local, or domestic, content requirements have often been linked to public procurement agreements, but today their use has been restricted by WTO regulations on the grounds of competition concerns (see Section 5.2.3 for more details). Box 15 provides an example of how public procurement can be used to increase domestic production.
Box 15: The use of offset clauses in defence public procurement: The case of India
In order to spur Indian exports, the Indian government introduced an offset clause in 2005 in defence public procurement. Offset clauses are common in defence procurement, where they work as a compensatory requirement by which foreign suppliers must offset the cost of procurement by supporting the domestic economy. These clauses are generally set as percentages of the procurement contract. In the Indian law, for procurement above Rs 3 billion, the offset policy requires foreign firms to reinvest at least 30 per cent of their procurement in Indian industries. This reinvestment can take different forms: direct purchases of domestic goods or services (formally treated as export orders); equity investments in joint ventures with Indian enterprises; technology transfer agreements; and/or provision of equipment to Indian firms or government institutions. Thanks to the offset clause, whenever a foreign supplier offsets its procurement with the Indian government by purchasing inputs, intermediate goods, or services from Indian companies, these purchases qualify as exports, driving up domestic production. Given the high capital intensity of the aerospace industry, public procurement contracts are generally onerous, thereby implying high reinvestment amounts by foreign vendors.
Source: Authors' elaboration based on Guadagno (2015b).
4.4 The state as innovator
Innovation is an important determinant of industrialization (see Module 1). Government intervention to spur innovation can be justified on two grounds. First, due to information asymmetries in the capital market and the highly uncertain nature of innovative activities, lenders find it difficult to evaluate the quality of innovative projects and consequently deny credit to such projects or make it more expensive. Second, knowledge production and innovation are
79 For a recent review of these experiences, see Hoeren et al. (2015), Mowery (2015), and WIPO (2015).
144
characterized by significant externalities in the form of knowledge spillovers and linkages, leading to underinvestment in these areas.
Empirical evidence has demonstrated that public policies can play a fundamental catalytic role in advancing science and technology, and in spurring firms’ R&D investments through STI policies (see Box 16 for a discussion of the differences between these policies). In particular, through science policies governments can create a knowledge base on which firms can build to produce innovative products and services. Technology policies address generic technologies, such as ICT, and stimulate the development of technological capabilities, for example through technology transfer. As the experience of East Asian economies showed, however, these policies need to be complemented by innovation policies, i.e. policies that stimulate R&D investments within firms.
This section focuses on several STI policy instruments that have been prominently featured in the industrial experiences of advanced economies, NIEs, and middle-income countries. Few low-income countries have experimented with STI policies, mainly due to the high costs of these policy instruments and their requirements in terms of skilled labour, human development, and state capacity. Box 20 at the end of Section 4 provides some examples of STI policies that have been undertaken by low-income countries. In the domain of science policies, this section discusses the role of public research programmes and government-supported research institutes. These proved to be crucial ingredients of the innovation systems of various successful countries. Publicly available knowledge can create a knowledge base and form a pool of experts who can benefit private firms through spin-offs, consortia, and other forms of cooperation. In the domain of technology policies, FDI attraction is the mechanism of technology transfer that has received most of the attention in the literature. In the domain of innovation policies, R&D subsidies are gaining importance in countries’ development and innovation strategies.
Box 16: Defining science, technology, and innovation policy
This box outlines the differences between STI policies (see Error: Reference source not found16.1). In doing so, it adopts a systemic approach to innovation, making a broad range of actors responsible for the innovative performance of the economy (see Section 3.1.6 in the main text). Following this approach, the instruments of STI policy include measures to stimulate the supply and demand side of technology and innovation, strengthen the performance of the actors of the innovation system and the relationships among them, and address framework conditions for innovation.
Table 16.1: Differences between STI policies
145
Source: Authors.
Setting the boundaries of public policies is never an easy task because policy areas can overlap and policy instruments rarely serve only one objective. For example, investing in an education policy instrument such as technical vocational education and training can also be considered a technology policy instrument because it strengthens absorptive capacity, equipping the labour force with technical skills and capabilities that can allow workers to move to more productive industries and economic activities. Similarly, imposing import licenses, a trade policy instrument, can influence the innovative performance of an economy because it can foster domestic technology development. Innovation also requires considerable financial resources, as R&D is generally costly and the uncertain nature of the innovation process requires firms to go through processes of learning and trial and error. Given this, investment policy instruments such as loans and venture capital are key to spur innovation.
Source: Authors' elaboration based on Guadagno (2015a), Lundvall and Borras (2006), and UNCTAD (2007c).
4.4.1 Public research programmes and government-supported research institutes
In the domain of science policies, public research programmes, especially in the United States, have contributed to great scientific and technological breakthroughs such as the Internet and personal computers. The US Defense Advanced Research Projects Agency initiated and managed most of these programmes, providing them financing and establishing research networks around them. These programmes were exploratory and not purely scientific in nature, allowing firms to benefit from this research, learn from it, and finally commercialize products that originated there. Abundant literature has documented these successes, detailing government policies and amounts disbursed (Langlois and Mowery, 1996; Levin, 1982; Mowery and Rosenberg, 1993; Mowery and Nelson, 1999; and more recently, Block and Keller, 2011; Mazzucato, 2013; Wade, 2014).
Most countries in the world, however, cannot equal the financial and human resources of the United States, although some public research programmes have been or are in the process of becoming quite successful.80 Most developing countries have neither a private sector capable of absorbing publicly funded research nor an innovation system that can generate the sort of
80 See, for example, the Technology Development Programmes in Taiwan Province of China (Hsu and Chiang, 2001).
146
innovations produced by advanced economies. So what can governments in developing countries do? At first, firms need to accumulate some prior knowledge that can help them understand, absorb, and use the knowledge produced outside the firm (whether in public research institutes or TNCs). In other words, firms need to acquire absorptive capacity (Cohen and Levinthal, 1990). This requires firms to employ skilled and knowledgeable engineers and establish their own in-house R&D centres. In countries with limited financial and human resources, however, firms might find it difficult to set up an in-house R&D centre from scratch. Public policies can therefore facilitate this process by creating a knowledge base that firms can tap into. Government research institutes can be established, and local firms can be invited to cooperate with them to facilitate knowledge diffusion and mutual learning.
Government-supported research institutes (GRIs) have been set up in various countries during the post-war period. They are either dedicated to specific industries/technological areas or have a broad scientific focus. In the former case, research is more applied, leading to technologies that are closer to the commercialization phase. This increases the potential for collaboration with the private sector and makes GRIs a fundamental actor in the government’s structural transformation programme, venturing into new industries and facilitating firms’ entry by reducing their costs and risks and providing guidance on the promising technological trajectories for innovation in those industries. In the latter case, research is more basic, i.e. less applied and far from the commercialization phase. Less intense linkages with the productive sector reduce the scope for knowledge spillovers, mutual learning, and technology transfer.
The experience of ITRI in Taiwan Province of China is particularly instructive in this regard (see Error: Reference source not found7), although there have been GRIs as well in other industrializing countries. The Korean Institute for Science and Technology in the Republic of Korea, established in 1966, accomplished the same task as ITRI (Kim, 1992). In Brazil, the Aerospace Technology Centre (Centro Tecnológico Aerospacial) was established in 1945 as an umbrella organization for aeronautical research modeled on the Massachusetts Institute of Technology in the United States. Over time, it became probably the most advanced research institution in industrializing countries (Dahlman and Frischtak, 1992). Its research activities were so advanced that Embraer took over some of its research projects, confirming how important GRIs can be for knowledge creation and accumulation of capabilities for local firms (Goldstein, 2002). Even at lower income levels, there are examples of GRIs contributing to successful catch-up by some industries. In the Indian aerospace industry, for example, a number of research institutes, located mainly in the Bangalore district, advanced scientific knowledge and created a pool of skilled workers who could be later employed by domestic and foreign firms (Mani, 2010).
R&D consortia involving GRIs, domestic firms, and even foreign firms can be an effective means of learning for firms with incipient in-house R&D centers. East Asian governments extensively used this learning model to develop new technologies, for example in the telecommunications equipment and computer industry. These policies helped to turn domestic firms into global market leaders. When domestic firms have accumulated the necessary prior knowledge to be able to generate novel knowledge and come up with new products and processes, governments can stimulate their efforts through financial and fiscal incentives for R&D (Cheon, 2014; Lee, 2015; Lee and Lim, 2001; Mathews, 2002).
147

Box 17: Government-supported research institutes: The experience of the Industrial Technology Research Institute in Taiwan Province of China
One of the most successful cases of GRIs is certainly ITRI in Taiwan Province of China. It was established in 1973 and located in the Hsinchu Science Park. According to Hsu and Chiang (2001: 127), “ITRI is responsible for conducting two types of technical work. It firstly develops innovative technologies for the establishment of new high-tech industries and then it integrates relevant technologies into existing industries to improve their manufacturing processes and quality.” In other words, ITRI explores promising technological areas and experiments with technologies that have a commercial potential; this means that ITRI itself develops and tests prototypes of potential new products.
It is undisputed that ITRI has played an enormous role in the transformation of Taiwan Province of China from a low-tech, labour-intensive economy to a modern high-tech economy. In general, the role of GRIs in the industrial policy of Taiwan Province of China was such that in the first phase of implementation of STI policies, only GRIs received state support to develop new technologies. At a later stage, cooperation between GRIs and firms with incipient R&D programmes was encouraged, and only then were firms entrusted to perform publicly funded R&D (Hou and Gee, 1993). While in the late 1980s ITRI’s budget accounted for 16 per cent of total R&D in Taiwan Province of China and 0.2 per cent of its GDP, by the late 1990s these figures had been halved (Guadagno, 2015a).
How did ITRI achieve such an impact on the innovation system of Taiwan Province of China? As discussed in Section 3.1.6 of the main text, innovation is a systemic endeavour of a number of interconnected actors in the economy. The stronger the linkages between these actors, the faster the knowledge diffusion and the greater the innovation rate of the economy. Subordinated to the Ministry of Economic Affairs, which determines its research focus, ITRI is an integral part of the complex system of innovation of Taiwan Province of China, a system composed of a large number of institutions and governmental bodies (Hou and Gee, 1993). ITRI was, and still is, well embedded in the institutional STI system and connected to the productive side of the economy. It is located inside the most dynamic science park on the island. The co-location of ITRI with many other research institutes and high-tech companies facilitated opportunities of knowledge-sharing and learning. ITRI also licenses its technologies to local firms, offering better conditions than foreign firms. As mentioned in Section 4.4.2 of the main text, ITRI spun off a number of high-tech firms that later became successful global players (e.g. the Taiwan Semiconductor Manufacturing Company, the world’s largest semiconductor foundry). It has been estimated that since its foundation, ITRI has spun off 162 firms and contributed to the creation of many others.
Source: Authors.
4.4.2 Attracting foreign direct investment
FDI can be a channel for technology transfer, and is therefore particularly relevant for low-income economies, where innovation efforts are geared towards absorption of foreign knowledge and technologies.81 The role of FDI in economic growth and development has been an important topic of discussion in the literature.82 It can be argued that the inflow of foreign investment 81 The literature has identified several mechanisms for technology transfer: FDI, licensing, consultancy and technical agreements, trade in capital goods, joint ventures, subcontracting, exports, labour mobility, and technical developmental assistance (UNCTAD, 1999).82 For reviews, see Lall (2000) and UNCTAD (1999, 2000, 2006b, 2006c). For the role of FDI in African development, see UNCTAD (2005a).
148
should automatically benefit the host economy, as FDI can relax financing constraints, increase competition, bring in technology, and create new jobs, investment opportunities, and knowledge spillovers (Borensztein et al., 1998; Lipsey, 2002; Markusen and Venables, 1999). Yet, it can also be argued that these benefits depend on the size and type of FDI (see Box 18), its mode of entry, the characteristics of the host country, and how much the government is able and willing to direct such inflows (Lall, 2000; Moran, 2011, 2015; UNCTAD, 1999, 2000, 2006c; Wade, 2010). The impact of FDI on host economies might even be negative, for example by crowding out investment opportunities for local entrepreneurs (Kumar, 1996).
Box 18: Types of foreign direct investment
The literature identifies several types of FDI:
Technology-leveraging FDI: Firms that undertake technology-leveraging outward FDI seek to acquire foreign technology and knowledge on new processes and products by setting up research and design divisions in technologically advanced economies. Resource-seeking FDI aims to exploit the host country’s comparative advantage in natural resources (such as minerals, oil, raw material, agricultural products, and other commodities), and low-skilled or specialized labour.
Market-seeking FDI aims to gain access to local markets in response to actual or future demand for the firm’s products in such markets. These firms thus target markets that are situated outside their home market and which may be profitable because of the size of the demand or because it is more profitable to produce in the local market rather than producing in the home market and exporting (e.g. due to trade barriers in host country).
Efficiency-seeking FDI occurs in response to low costs of production, specialization, economies of scale and scope, and other sources of cost advantages offered by the host economy. Some authors have argued that the definitions of resource-seeking and efficiency-seeking FDI overlap when it comes to cheap labour as the main driver of foreign investment.
Strategic asset-seeking FDI: Firms undertake strategic asset-seeking FDI in order to access strategic assets (e.g. technology, brands, and capabilities) that allow them to achieve their long-term strategic goals such as maintaining or creating competitiveness. Strategic asset-seeking investments often take place through mergers and acquisitions.
Source: Authors' elaboration based on Dunning (1993), Kaplinsky and Messner (2008), UNCTAD (2006b), and World Bank (n.d.).
Some types of FDI, such as resource-seeking and market-seeking FDI, generate limited benefits for the host economy and can even hurt it by (a) displacing local producers who cannot compete with foreign firms that usually have access to superior technology, financing, and better-skilled labour; (b) reinforcing structural heterogeneity by establishing enclave sectors; and (c) constraining long-term economic growth by pushing the economy to specialize in industries such as oil and mining. Modes of entry can also affect the developmental impact of FDI. Greenfield investments can create additional employment and investment, and mergers and acquisitions have high knowledge transfer potential.83 Finally, the developmental impact of FDI also depends 83 For the impact of mergers and acquisitions on development, see UNCTAD (1999, 2000).
149
on the characteristics of the host economy, especially in terms of the quality of infrastructure, institutions, education, absorptive capacity, and productive structures. The existence of a domestic productive sector offers foreign firms a network of potential local suppliers of inputs and components, multiplying opportunities for technology transfer and knowledge spillovers.
Public policies have a role to play in shaping these factors. Governments can create an enabling environment for FDI by reducing restrictions, controls, and bureaucratic procedures. FDI has also been encouraged by opening privatization programmes and public procurement to foreign investors. Many governments set up SEZs, EPZs, and free tax zones with efficient infrastructure and generous tax exemptions. These initiatives can be accompanied by promotional initiatives to disseminate information on the incentives and promote a positive international image of the country. In this regard, attracting a renowned international firm can be an effective strategy to attract more FDI, as this can work as a signal for other firms. This is what happened in Costa Rica, for example, when Intel invested in the country. Some countries have also granted foreign investors’ market protection from imports and from the pressure of market entry, but this policy has not always worked.84
FDI has played an important role in the industrialization process of East Asian economies. Japanese firms “recycled” the comparative advantage in less advanced countries in the region, giving rise to the “flying geese” paradigm.85 As the literature shows, Japanese industrial policies to restructure “sunset” industries (i.e. declining industries that were no longer in line with the country’s dynamic comparative advantage) encouraged Japanese producers to move to nearby economies with a comparative advantage in those industries. As a consequence, Japan became a major foreign investor in the region, benefiting the Republic of Korea, Taiwan Province of China, Indonesia, Singapore, and Hong Kong (China). Following the flying geese paradigm, FDI was first concentrated in extractive industries (due to the need to fuel industrialization at home), and later shifted to (mostly labour-intensive) manufacturing. This process was replicated when firms from the Republic of Korea and Taiwan Province of China moved production in second-tier NIEs in Southeast Asia. Indeed, inherent to the flying geese paradigm is the progression of FDI in terms of countries and industries (UNCTAD, 1994, 1996).
Second-tier NIEs, however, could not replicate the trajectory of first-tier NIEs, mostly due to the different nature of their interactions with foreign investors (Akyuz et al., 1998; Hobday, 1995; Lall and Narula, 2004; UNCTAD, 1994, 1996, 1999, 2002). Southeast Asian economies still faced difficulties in upgrading to high value-added activities, even though they had managed to enter dynamic industries such as electronics and electrical engineering (Wade, 2015). Instead, it has been argued that it was exactly this premature entry in high-tech industries that restricted their chances of technological upgrading. Skipping the stage of specialization in medium-tech industries left them dependent on imports of capital and intermediary goods, thereby limiting linkages of FDI with the rest of the economy (UNCTAD, 1996, 1999). The gap between first-tier and second-tier NIEs can be observed in many cases, from Malaysia to the Philippines and Indonesia. These patterns, unfortunately, are not new. Some authors have expressed concerns 84 See Lo and Wu (2014) and Guadagno (2015b) for the case of the automotive industry in the People’s Republic of China and Indonesia.85 The flying geese paradigm was originally formulated by Kaname Akamatsu in 1932 in an article in Japanese. The first discussion in English appeared in 1962 (Akamatsu, 1962). For more details, see Korhonen (1994) and UNCTAD (1995).
150
that insertion in international trade based on the maquiladora model in Mexico and other Central American countries has not led to sufficient accumulation of knowledge and capabilities, reducing the opportunities for technological and structural change (Katz, 2000; UNCTAD, 1999).86 Box 19 discusses the experiences of the Philippines, Indonesia, and Costa Rica with FDI attraction and industrial upgrading.
86 The term maquiladora (or maquila) refers to the most common type of EPZs in Mexico and other Central American countries. TNC affiliates locate the labour-intensive, assembly-type activities of their value chains there, importing all the inputs and intermediate goods required for assembly.
151

Box 19: Transnational-corporation-dependent industrialization strategies: The cases of the Philippines, Indonesia, and Costa Rica
In the Philippines, the establishment of an EPZ with modern infrastructure and preferential tax rates, combined with favourable domestic conditions such as low wages and an educated, technically capable, and English-speaking workforce, managed to attract FDI, especially in electronics. FDI contributed to employment growth and diversification away from resource-based industries. However, these EPZs became enclaves with limited linkages with domestic economic activities, restricting opportunities for knowledge and technology transfer. Moreover, as complementary STI policies were not adequately implemented, technological upgrading was difficult, and the activities performed by TNCs generally had low value added. A similar situation occurred in the Indonesian automotive industry, which attracted many (especially Japanese) market leaders, but could not effectively link them with local SMEs. Local content requirements imposed by the government on foreign firms in exchange for market protection were rarely adhered to, as domestic firms could only produce low-tech components, and limited incentives and policies existed to upgrade their capabilities. To address these issues, the government has recently set up a government-supported research institute to foster knowledge creation in the industry (Guadagno, 2015b).
Costa Rica can also be listed as one of the most successful cases of FDI attraction, culminating with the 1996 investment by Intel. The FDI received by Costa Rica was efficiency-seeking and aimed at benefiting from the country’s resources, such as its geographical position, educated workforce, political stability, and the favourable fiscal regime offered by the government. FDI resulted in substantial export growth and diversification of exports, mainly towards electronics and electrical equipment. Industrial upgrading, however, required the government and local firms to undertake complementary investments in order to keep up with the infrastructural, educational, and innovation requirements of foreign investors. As a consequence, activities performed by TNCs remained limited to the lowest end of the value-adding process of the value chain. Therefore, although Costa Rica managed to diversify its export structure towards high-tech industries, the activities performed in Costa Rica had little technological and knowledge content, requiring minimum skills and limiting the potential for knowledge spillovers and learning opportunities for local workers and firms (Paus, 2014).
Source: Authors' elaboration based on Guadagno (2015b) and Paus (2014).
This empirical evidence suggests that attraction of FDI in itself is not enough to initiate and spur structural and technological change. The positive dynamics from FDI that, through technological transfer, strengthened domestic capabilities and export sophistication in the Republic of Korea and Taiwan Province of China were not replicated in second-tier NIEs and elsewhere. Public policies in Northeast Asian economies played a huge role in maximizing benefits from FDI.
So, what can governments do in this regard? Through selective seclusion (i.e. the selective opening of industries and economic activities to foreign investment) and complementary investments in education and infrastructure, governments can attract more strategic FDI and retain it when foreign investors find cheaper locations. Governments can also help firms negotiate with TNCs, for example for knowledge and technology transfer and local employment. In this regard, promoting joint ventures can be a way to strengthen linkages between local and foreign enterprises, facilitating the transfer of knowledge and capabilities (UNCTAD, 2014a).
152
FDI attraction measures can also be complemented by education policies, incentives for the accumulation of capabilities and innovation, and policies to strengthen local SMEs so as to enable them to supply TNCs with the intermediary goods and services they require for their operations. Most of these policies were implemented in first-tier but not in second-tier NIEs (UNCTAD, 1996).
4.4.3 Research and development subsidies
R&D subsidies in the form of preferential credits or tax reductions have been widely used, albeit generally in high- or middle-income countries.87 Such incentives are used to push firms to invest in R&D, especially in new and promising technological areas, but they are expensive instruments. For example, R&D incentives in the Republic of Korea cost almost half a percentage point of GDP in the second half of the 1980s (Guadagno, 2015a). It is expected that developing countries in particular would use these subsidies more in the future, given the recognized role of technological change in industrialization and the restricted policy space that these countries have today (see Section 5.2.3). As a matter of fact, R&D subsidies have been subject to relatively little WTO enforcement (Maskus, 2015).
It can be argued that if a technological area offers interesting profit opportunities, private firms and entrepreneurs are ready to invest in it, so R&D subsidies might crowd out private R&D. The literature has developed econometric techniques to estimate the additionality of R&D incentives, i.e. to determine if R&D incentives were used to cover investments that would have not taken place without the incentive. Most of the empirical studies on additionality of R&D incentives focus on developed economies (especially the United States and Europe) and find that R&D incentives have led to additional R&D investments, but have indeed crowded in, rather than crowded out, private investments.88
Box 20: Examples of science, technology, and innovation policies in low-income economies
Low-income economies generally lack the physical and human capital to implement a full-fledged STI policy. Moreover, their poor infrastructure and underdeveloped financial systems hinder the development of modern industries (UNCTAD, 2007c). Yet, due to their role in structural and technological change, STI policies cannot only be a prerogative of high- and middle-income countries (UNCTAD, 2007c). As we will see in Section 5.2.1, skills and capabilities are also fundamental to successfully enter into and benefit from GVCs. Examples of successful experiments with STI policies can also be found in low- and lower-middle-income countries.
Ethiopia has been implementing an ambitious industrial development plan since 2005. As part of this plan, several industries are targeted in various ways. In the leather industry, recognizing the bottlenecks that firms face in upgrading production to higher quality standards, the government established the Leather Industrial Development Institute. The institute provides animal vaccinations and extension services to improve workers’ skills, helping them to abandon traditional animal husbandry practices and adopt modern techniques that can preserve the quality of skins and hides (Lenhardt et al., 2015).
Cambodia has implemented several policy initiatives to attract and benefit from FDI inflows. Apart from streamlining and facilitating bureaucratic procedures, the government created SEZs and complementary 87 For examples from Europe, see Farla et al. (2015). For Taiwan Province of China, see Hsu et al. (2009).88 For a review of this literature, see Mairesse and Mohnen (2010) and Zúñiga-Vicente et al. (2014).
153

institutions aimed at strengthening its national innovation system. Among these, the National Productivity Centre of Cambodia was established to improve productivity, especially of SMEs, by providing technical assistance and developing technologies to enhance efficiency and environmental responsibility. The Industrial Laboratory Centre of Cambodia is responsible for the testing and analysis of product quality, a particularly relevant issue when dealing with TNCs and GVCs. Finally, in 2008, the Technology Incubation Centre was established with support from the Asian Development Bank to drive innovation and new technology development (OECD, 2013a).
In other countries, bottom-up initiatives are emerging and producing innovations, also with a social value. For example, in Kenya, innovation hubs have been created where potential local entrepreneurs can benefit from mentoring and training programmes and use a reliable Internet connection and office equipment. These hubs have successfully produced a number of innovations especially in ICT, creative industries, and renewable energy (WIPO, 2015).
Source: Authors.
5 Current challenges to industrialization and industrial policy in developing countries
The relatively meagre results of policies based on the Washington Consensus, the effects of the 2007–2008 financial crisis, and the slowdown in growth rates of emerging economies after 2010 all contributed to bringing industrial policy back into the spotlight. Moreover, evidence that a middle-income trap is limiting opportunities for industrial upgrading and accelerating deindustrialization in several Latin American and Southeast Asian countries also suggested a need to return to industrial policy (Felipe, 2015; OECD, 2013b; Peres, 2009). In addition, there is a concern that the commodity price boom that affected resource-rich economies during the first decade of the 21st century (see Section 3.1.3.5 in Module 1) could accelerate deindustrialization, generating economic growth, but with little equity and employment.
This shows that developing countries still face a number of challenges to industrialize. These challenges are the result of internal and external conditions. The next sections focus on some of these issues, paying particular attention to those that are the most pressing for low- and middle-income countries.
5.1 Challenges from internal conditions
Economies face different constraints and opportunities resulting from differences in their human, institutional and economic development, policy priorities, location, history, and endowments. For this reason, industrial policy and national development strategies need to be context-specific. At the same time, countries share some common features that allow for some adaptation of successful policies. The following discussion highlights some of the country conditions that affect industrial policymaking in developing economies.
5.1.1 Level of economic, institutional, and human development
Constraints and opportunities for structural transformation are closely associated with the existing level of a country’s economic, institutional, and human development. This section
154

reviews demand, supply, and structural factors that represent a challenge to policymaking in developing countries, and discusses the impact of institutional and human development on industrial policy implementation.
On the demand side, efforts to develop competitive industry are constrained by low income levels that limit the size of domestic markets and restrict demand to a limited range of usually low-quality products. Low incomes also result in low government revenues because the state is able to raise less through taxes, which subsequently leads to significant budget constraints that further limit aggregate demand. To overcome insufficient domestic demand, developing countries often turn to external markets. For the least advanced countries, external markets are difficult to reach because of poor infrastructure within the country and built out towards hubs outside the country, which in turn affects transportation costs, profitability of firms, and countries’ competitiveness. Research shows that such factors lead to segmentation of markets, preventing firms from taking advantage of economies of scale or investing in new products and new and better ways of production (Bigsten and Söderbom, 2006; Porter, 1990). Public procurement and policy instruments for export promotion are the key policy instruments to relax demand-side constraints.
On the supply side, developing countries generally lack skilled labour, basic infrastructure such as electricity and roads, and a science and technology infrastructure that allows for the use of modern technologies such as ICT. Domestic firms need these prerequisites to boost their capabilities and competitiveness. Often, only a few firms are technologically capable of competing on global markets, leading to the structural heterogeneities described in Module 1. Most of the policies discussed in Section 4 can be thought of as supply-side policies tackling supply-side constraints to production.
Structural heterogeneity can obstruct a policy-driven process of structural transformation because of weak linkages. Gains from growth in leading sectors must be linked to the rest of the economy; otherwise structural heterogeneity will be reinforced, slowing down industrialization and development. Developing countries also have to deal with a scale issue posed by the prevalence of small and mostly informal firms. Widespread informality has consequences for the formulation and implementation of industrial policy through several channels. Informality tends to be concentrated in small enterprises that cannot take advantage of economies of scale. In these firms, opportunities for learning are typically constrained by low capital intensity and the nature of the activities performed, generally requiring unskilled labour. Informality also makes it difficult for the government to reach entrepreneurs and workers operating outside the spheres of state regulations and public incentive schemes. What is more, widespread informality decreases tax revenues, providing an additional rationale for government intervention. The scale of the structural transformation challenge is also evident in the sectoral distribution of the labour force. The statistics presented in Module 1 show that in developing countries a significant share of the labour force is employed in low-productivity sectors such as agriculture and non-tradable services.
With respect to the institutional development of the country, Sections 2.3 and 3.3 have already outlined the major institutional challenges that countries face in the design and implementation of an effective industrial policy. Strong institutions facilitate such policy and enable governments
155

to use a wider set of industrial policy instruments, thanks to the higher capacity of the state and its bureaucracy. Institutions also influence distribution of power and rents in the society, affecting production structures, income levels, inequality, and so on. In the African case, for example, it has been argued that inequality and weak institutions created a system in which centralized power and informal loyalty networks often curbed industrial policy incentives in the wrong directions and made it difficult to correct failures. This contributed to leaving the private sector small and fragile and to deepening inequalities and ethnic conflicts (Altenburg, 2013; Altenburg and Melia, 2014). While these institutional factors have to some extent contributed to the design and implementation of industrial policies, it can be argued that institutions evolve and strengthen with development, as economic development can also be achieved in contexts characterized by weak institutions (Cervellati et al. 2008; Khan, 1996).
Low levels of human development can affect industrial policymaking, for example through malnutrition, poor health conditions of workers, or low education levels. As discussed in Section 4.2 in Module 1, economic growth per se might not be enough to foster social and human development. In some cases, economic growth is associated with large reductions in the number of poor, while in other cases the benefits of economic growth bypass the poor, or growth even leads to rising poverty levels. As a consequence, industrial policy has to be coupled with other economic policies in order to make sure that economic growth and structural transformation is not only concerned with shifting labour from agriculture to manufacturing, but also includes the poor and improves their living conditions and well-being (UNCTAD, 2011b).
Altenburg (2011) provides several examples of how trade-offs between economic efficiency and equity can manifest themselves in industrial policymaking. For example, rapid liberalization in developing countries might achieve quick productivity gains, but might also make it difficult for producers to adapt to the new regime. Moreover, by channelling resources towards resource-based industries (i.e. where many developing countries have a comparative advantage) liberalization might implicitly favour particular social classes. This shows that industrial policy must not only be growth-oriented, but also concerned with poverty. To this end, Altenburg (2011) calls for “inclusive industrial policy”, which, in his view, should take into account the most vulnerable parts of society and ensure productive employment and decent wages (see also Altenburg and Lütkenhorst, 2015). Moreover, given the limited fiscal space of low-income countries, the opportunity costs of industrial policy against social services should also be carefully considered.
5.1.2 Location and endowment with natural resources
Some scholars argue that the location of countries, and essentially whether they are landlocked, determines their ability to grow and transform their production structures (Collier, 2007; Sachs et al., 2004). The location of an economy can affect a country’s ability to compete on global markets. Landlocked economies further away from major consumer markets or trading routes face higher transportation costs, which in turn lead to higher sale prices that hurt their competitiveness. To overcome these circumstances, countries can improve their relations with
156

coastal neighbours through regional integration, or develop a strong tradable services industry that allows for circumventing logistic obstacles (Altenburg and Melia, 2014).
Critics of this view argue that it is not the location of the country, but rather the lack of investment in transportation that makes such countries perform poorly. Switzerland and Austria, but also Burkina Faso and Zimbabwe, are landlocked, but while the former set of countries has good river transport, the latter set does not (Chang, 2012). The case of Ethiopia is also illustrative in this respect. Despite being landlocked and having problematic transportation systems (both in terms of transport costs and time), Ethiopia is able to attract investment, mainly thanks to its relatively low labour costs and by encouraging prospects for future investment in transportation (Vrolijk, forthcoming).
Endowments with agricultural and mineral resources vary greatly across countries. Industrialization of resource-rich countries may be challenged by Dutch disease effects (see Sections 3.1.2 and 3.1.3.5 in Module 1). A boom in commodity prices during the first decade of the 21st century and the discovery of reserves of minerals and fuel in many developing countries allowed resource-rich countries to take advantage of favourable terms of trade. These recent developments have prompted some scholars to challenge the view that natural resources must necessarily represent a curse for developing countries (Torvik, 2009). Instead, they argue that with the right policy approach, commodity-based activities can be beneficial to countries that wish to industrialize. This literature identified production linkages between commodity industries and the rest of the economy that can sustain structural transformation and the rise of modern industries (see Box 3 in Module 1). These linkages and externalities would justify government intervention. Governments can intervene to strengthen production linkages and maximize the extent to which local firms can benefit from innovations and knowledge creation in the commodity industry.
Country experiences demonstrate how difficult it can be to realize and maximize linkages. For example, in Mozambique, in order to complement the investment in the Mozal project (the aluminum smelter created at the end of the 1990s), the government attempted to establish linkages with local SMEs through the SME Empowerment Linkages Programme. However, the programme did not meet with great success, as knowledge spillovers were limited and local SMEs failed to accumulate sufficient capabilities (Ramdoo, 2015). In Botswana, the Mineral Beneficiation Policy, in coordination with the National Development Plan, is creating a comprehensive incentive system to attract firms in the diamond processing industry, and to develop a knowledgeable workforce employable in this skill-intensive industry. Incentives include tax benefits, reduction of red tape for expats employed in the industry, incentives for knowledge and skill transfer from foreign experts, and skill accumulation within local knowledge centres (Mbayi, 2011). Finally, it can be argued that infrastructure investments to facilitate transport of commodities can create positive externalities in other industries, regions, or neighbouring countries (Perkins and Robbins, 2011). 89
89 For more examples, see the outcomes of the Making the Most of the Commodity Price Boom Project. Available at: http://dpp.open.ac.uk/research/projects/making-most-commodities .
157
Apart from production linkages, fiscal linkages can also benefit the modern sector, fostering structural transformation. Fiscal linkages refer to the possibility for the government to use commodity revenues, for example in the form of tax and royalty revenues, to promote industrial development of non-commodity industries (Kaplinsky, 2011; UNCTAD, 2014b). Industrial policy can leverage these fiscal linkages. Throughout history, governments have accumulated the financial resources required to be able to consistently implement an industrial policy in part through the appropriation of natural resource rents (UNCTAD, 2011a, 2012, 2014a, 2014b). Indeed, the realization that oil and gas will run out in the future has motivated many governments to begin to use these resource rents to underpin an industrial policy.
For example, in the mid-1960s, the discovery of significant reserves of oil and gas in the North Sea created a once-in-a-generation opportunity for the Norwegian and UK governments. In Norway, a major industrial policy programme was designed to capture the benefits of these reserves. The government established a SOE, Statoil, which quickly became a key player in the national industrial development effort thanks to its licensing agreements with international companies to transfer technologies to local companies and help them build their capabilities through local content agreements. Thanks to this strategy, Norway managed to develop a whole array of new industries, some world-leading technologies, key R&D institutions, and quality educational institutions. This policy helped sustain and drive forward its district of new innovative SMEs in the Stavanger region (Hatakenaka et al., 2006). Similarly, in Chile, the state-owned CODELCO (National Copper Corporation of Chile, or Corporación Nacional del Cobre), the world’s largest copper producer and one of the most profitable facilities in the world, channels part of its revenues into the state budget. These resources helped Chile finance many of its most important industrial development and social programmes such as Fundación Chile and CORFO (Chilean Economic Development Agency, or Corporación de Fomento de la Producción de Chile) (see also UNCTAD, 2006d).
The recent commodity price boom (see Section 3.1.3.5 in Module 1) has prompted governments to attempt to increase natural-resource rents and reduce incentives to investment, given the higher attractiveness of such investment in times of price booms. To this end, governments updated their regulatory and fiscal frameworks, increasing royalty and corporate tax rates, introducing new taxes, renegotiating contracts, and increasing state equity participation in extractive companies. In spite of these reforms, government revenues did not grow as much as firms’ profits from extractive activities, showing that during the price boom, incentives may have remained too generous and created losses in public revenues. Limited growth of government revenues might also be a sign of limited enforcement of the new regulatory and fiscal frameworks. Several countries decided not to implement their regulatory changes as a result of various types of pressures. Moreover, aggressive tax planning and accounting practices of TNCs, such as transfer mispricing practices, further reduced the efficacy of the reforms (UNCTAD, 2014b).90
Finally, exchange rate policies are also particularly important in resource-rich economies. As structuralist economists have argued (see Sections 3.1.2 and 3.1.3.2 in Module 1), resource-
90 Transfer mispricing practices, common in the extractive industries, refer to TNCs manipulating profits by inflating costs and undervaluing prices in intra-firm operations. In this way, TNCs can move profits from the tax jurisdiction of the natural-resource-producing country to a lower tax jurisdiction (UNCTAD, 2014b).
158
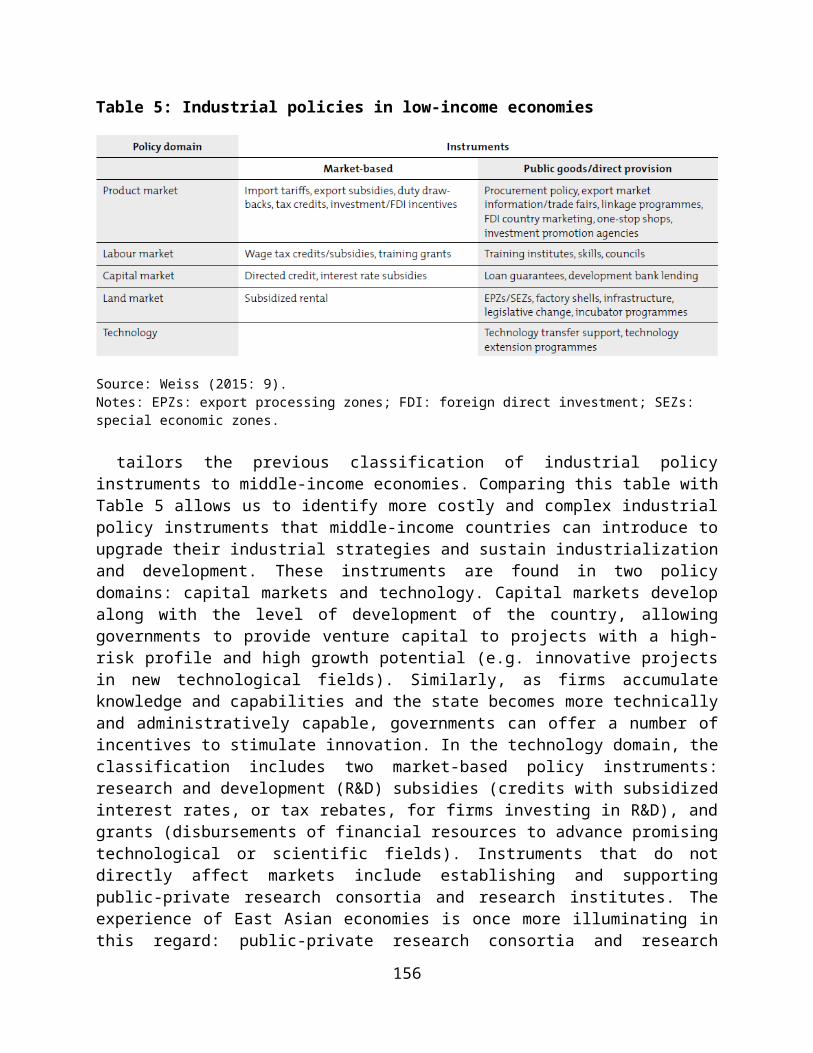
abundant economies suffer from cyclical overvaluations of the exchange rate that penalize manufacturing. In these cases, a careful exchange rate policy is paramount to avoid the industrialization process getting halted or aborted (Ocampo, 2014).
5.2 Challenges from external conditions
Globalization and the emergence of GVCs, and the rise of the People's Republic of China as an economic powerhouse, are some of the key developments that have contributed to a fast-changing global environment that poses challenges but also presents opportunities for developing countries. Strategies that a decade or two ago would have helped domestic firms become more competitive may fail to deliver the same results today. Moreover, some claim that the “policy space” of many developing countries is shrinking as their economies become more integrated through trade and financial linkages, facilitated by multilateral and regional agreements. This section surveys the most pressing global challenges to industrialization and industrial policy in developing countries.
5.2.1 Policies to profitably integrate into global value chains
As discussed in Sections 3.1.3.4 and 3.2.4 of Module 1, globalization has led to the fragmentation of global production and the rise of GVCs. In this new scenario, firms and countries integrate into international trade by specializing in tasks of the GVCs, rather than in goods and services. A huge literature exists on industrial policies for successful insertion and upgrading in GVCs. This literature also builds on the policy lessons from the past and more recent experiences with FDI, as GVCs are generally TNC-led (see Section 3.1.3.4 of Module 1). This section discusses the developing countries’ industrial policy options to integrate into GVCs and upgrade their capabilities within them. As explained in Section 4.4, while developing countries can be successful in inserting themselves into GVCs, even in high-tech industries like electronics, upgrading within these chains or in related chains is a much more difficult task.
Table 9 provides an overview of the main policy actions that can help developing countries benefit from insertion into GVCs. The first element of industrial policy in a GVC-dominated world is embedding GVCs in development strategies (UNCTAD, 2015d). This requires industrial policy to target activities, rather than goods or services. Policy instruments such as subsidies to develop a vertically integrated industry (i.e. owning multiple parts of the supply chain), or restrictions on imports that are crucial for exporting activities, are deemed inefficient in the context of GVCs (Milberg et al., 2014). Upgrading is also crucial, as shown in Section 4.4.2. Through upgrading, countries can avoid “commodity traps” 91 and middle-income traps that leave them dependent on a limited range of technologies and markets, and on TNCs. A dynamic view of industrial development is also necessary because investments by TNCs are usually volatile. Competitiveness based on low costs can easily vanish as countries develop and competition between developing countries continuously creates new business opportunities in new locations. In this scenario, retaining FDI becomes equally or even more important than attracting it. Trade and investment policies can increase the “stickiness” of investments by
91 The expression “commodity trap” refers to a situation in which developing economies specialize in resource-intensive stages of production within GVCs and face difficulties in diversifying away from them (Farfan, 2005).
159

stimulating partnerships and long-term collaboration between foreign and local firms and creating a local cluster of secondary suppliers (UNCTAD, 2011c, 2013b). In doing this, governments should try to strike a balance between specialization (through accumulation of skills and knowledge to upgrade their role in a GVC) and diversification (through the accumulation of capabilities in various activities along various GVCs) (UNCTAD, 2011c).
Upgrading in GVCs is affected by the governance structures of those value chains. There is a huge literature on GVC governance structures and their impact on industrialization and development (Gereffi, 2014, 2015; Gereffi et al., 2005; Humphrey and Schmitz, 2002). Governance structures depend on firm characteristics such as size, crucial for achieving economies of scale and establishing linkages with global lead firms, and the existing level of capabilities, which determines the potential for productivity growth and upgrading towards higher-value-added activities and more sophisticated products (Farfan, 2005). Governance structures influence the impact that GVCs can have on firms in developing countries by determining the power relations within the chain. When some players gain too much power in the chain, they might adopt strategies to capture higher shares of value added. For example, by creating trade-related constraints in the form of tariffs and other taxes, lead firms in downstream activities can reduce the profit margins of upstream firms. Alternatively, they might hamper technological upgrading and entry into downstream activities, for example by limiting knowledge and technology transfers or by imposing standards through trade and investment agreements (Milberg and Winkler, 2013; UNCTAD, 2014b). These strategies are likely to cement the asymmetries in power and skills between developed and developing country firms. Governments in developing countries can help local firms negotiate contracts with foreign firms, for example by encouraging long-term contracts between them, supporting collective bargaining through producer associations, or providing training in bargaining and model contracts (Milberg et al., 2014; UNCTAD, 2011c, 2013b).
The potential for upgrading also depends on the characteristics of the private sector in the developing country. In particular, the quality and availability of local supply chains allow for lead firms to source intermediate inputs in the country and build linkages with local suppliers. Moreover, an entrepreneurial drive in the local economy can contribute to the emergence and strengthening of a dynamic private sector (Farfan, 2005). Industrial policy can foster these processes by supporting local SMEs, strengthening their linkages with TNCs and promoting entrepreneurship, as discussed in Sections 4.2.2 and 4.4.2.
The second industrial policy element – enabling participation in GVCs – refers to the importance of creating and maintaining an environment conducive to business, as discussed in Section 4.1. In the context of GVCs in particular, UNCTAD (2013b) points to the importance of trade facilitation, for example by streamlining port and customs procedures, and investment facilitation, including measures to streamline procedures related to entry and establishment of foreign-invested firms (e.g. registration, licensing, access to land, hiring, and taxes).
Building domestic productive capacity, the third element listed in Table 9, is paramount for industrialization. UNCTAD (2013b) identifies a number of policies in this area: (a) development of clustering and linkages to foster competitiveness via learning from competitors, suppliers, and customers; (b) support for science and technology to enhance product quality and productivity,
160

and an effective intellectual property rights framework to give lead firms confidence in employing state-of-the-art technologies; (c) business development services such as business development service centres and capacity-building facilities; (d) promotion of entrepreneurship through incubators, training, or support with venture capital (see Section 4.2.3 for some examples); and (e) access to finance for SMEs to support development of domestic capacity and allow small firms to grow and reach minimum efficient scales of production (see Section 4.2.2). To this list, UNCTAD (2011c) adds education policies, particularly technical vocational education and training.
The fourth policy element to cope with GVCs relates to environmental, social, and governance challenges. Working conditions in firms supplying to GVCs have been a source of concern, especially when FDI seeks low-cost labour in countries with relatively weak regulatory environments. Similarly, it has been argued that GVCs can also facilitate the relocation of polluting production processes to developing countries (Kozul-Wright and Fortunato, 2012). In this regard, government procurement policies can require compliance with international labour, human rights, and environmental standards. Additionally, EPZs can provide assistance with labour issues, informing firms about national labour regulations and providing support services. Similarly, EPZs can adopt environmental standards, for example in the form of environmental reporting requirements under which companies report their anticipated amounts of pollution and waste. Finally, in the area of good governance, it has been noted that part of the earnings of TNC affiliates is sometimes repatriated, and consequently the value created in the host country cannot be used by the government of the developing economy. Governments are increasingly strengthening regulatory frameworks in this area, imposing fines and penalties in cases of non-compliance.
The last policy area in Table 9 concerns the need for policy coherence, especially with regard to trade and investment policies. This has led many governments to merge investment promotion agencies and trade promotion organizations. These considerations, however, are context-specific, requiring case-by-case evaluations.
Table 9: Implications of global value chains for industrial policies
Source: UNCTAD (2013b: 176).Note: GVCs: global value chains.
161
5.2.2 The rise of the People's Republic of China
The fast growth of the People's Republic of China is receiving a fair amount of attention in current debates on globalization and the catching-up processes of middle- and low-income economies. Scholars have begun to analyse the challenges and opportunities that China's growth represents for industrial policy in the rest of the developing world (Fu et al., 2012; Kaplinsky and Messner, 2008; Lall and Albaladejo, 2004; Lall and Weiss, 2005; Naudé, 2010; Reiner and Staritz, 2013; UNCTAD, 1999, 2005b, 2010, 2011d; Weiss, 2013).
Opportunities largely depend on the extent to which growth in the People's Republic of China (a) creates a market for exports from other developing countries (i.e. products produced by developing countries going to the Chinese market); (b) allows access to cheaper inputs; and (c) integrates other developing countries into GVCs. Several studies show that the rise of People's Republic of China has led to higher exports from Latin America and Africa and to an increase in FDI to these regions, as noted in the following observations:
Perry (2006) and Bizquez-Lidoy et al. (2006) find that economic growth in the People's Republic of China has led to higher prices for commodities exported by Latin American countries. Jenkins et al. (2008) also report a sevenfold increase in exports from Latin America to the People's Republic of China between 1999 and 2005.
A similar trend is found in the case of Africa, where between 1999 and 2004 exports to the People's Republic of China grew by 48 per cent annually (Broadman, 2007).
According to Ulltveit-Moe (2008), FDI from the People's Republic of China and India to other developing countries has grown rapidly during the last decade, exceeding US$70 billion in 2006. However, as Jenkins et al. (2008) point out, most of the expanding FDI has been in mining, infrastructure, and energy, rather than in sectors such as manufacturing that arguably offer more opportunities for employment creation, spillovers, and learning.
While the growth of the People's Republic of China may create opportunities for other developing countries, the evidence remains inconclusive with regard to the net benefits in the longer run. The rise of the People's Republic of China, a country with large reserves of cheap labour but also human and technological capabilities, does not necessarily offer opportunities for industrialization for Latin American and sub-Saharan African countries. Researchers have found that:
Data on patterns of trade show that developing countries tend to supply primary products and resource-based manufactures to the People's Republic of China. For example, Kaplinsky and Morris (2008) find that the share of oil and gas in Africa’s exports expanded from 31 to 47 per cent during 1995–2005. Jenkins et al. (2008) show that more than two-thirds of Latin American exports to the People's Republic of China consist of primary products such as soya, iron, ore, copper, pulp, fish, and leather.
The pattern of trade is reversed when it comes to the type of goods imported from People's Republic of China by developing countries. Notwithstanding variations across countries, Lall and Weiss (2005) note that more than 90 per cent of goods imported by
162
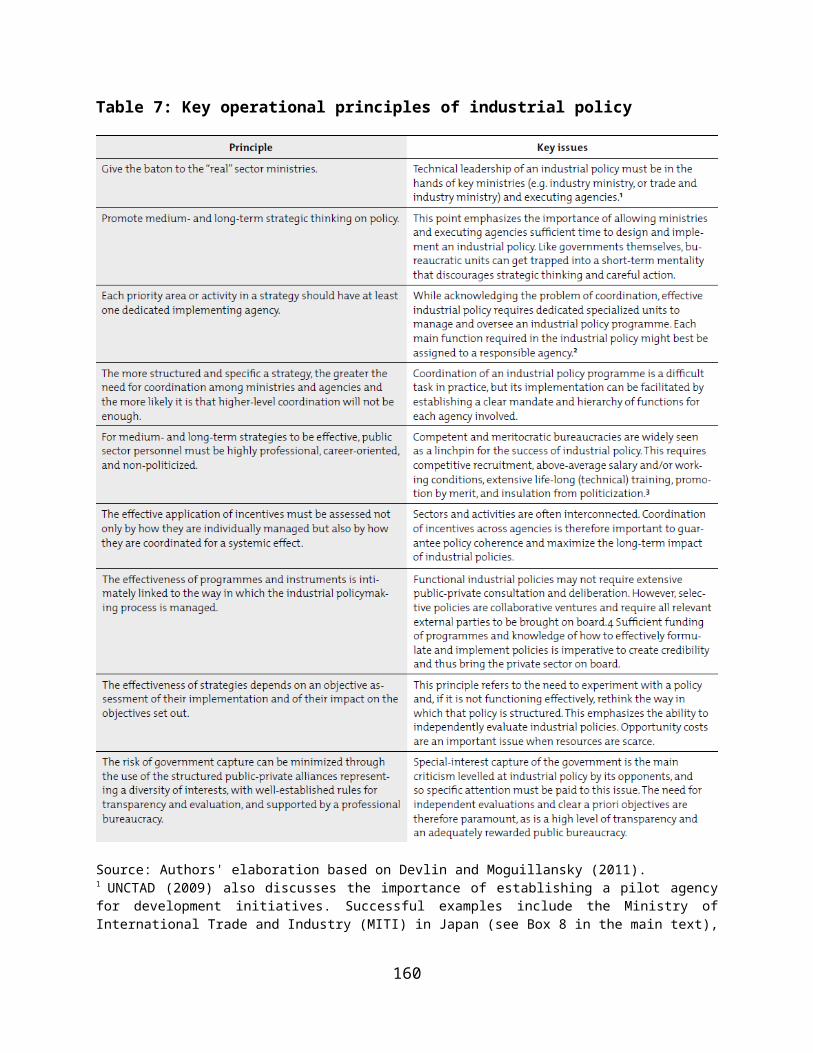
Latin American countries are manufactured products and over 85 per cent are non-resource-based manufactures. A similar pattern is observed for African countries, where about half of total imports from the People's Republic of China in 2005 were medium- and high-tech products (Kaplinsky and Morris, 2008).
Latin American countries have faced significant Chinese competition, especially in high-wage and capital-intensive products (Jenkins et al., 2008). For example, Dussel (2005) finds that Mexico has lost production and FDI as a result of competition from Asia and particularly from the People's Republic of China. In Brazil, low-tech industries suffered the highest losses of export markets to Chinese competition (7.2 per cent of 2004 exports), followed by the high-tech (2.1 per cent), medium-tech (1.4 per cent), and resource-based industries (1 per cent) (Jenkins et al., 2008).
Can industrial policy provide effective means to overcome these challenges and, at the same time, help take advantage of the new opportunities? Does the rise of the People's Republic of China leave room for export-led growth of other developing countries? Is a development strategy based on labour-intensive industries still feasible for low-income countries? Should industrial policy in developing countries shift attention from exports and production for high-income countries towards regional and South-South integration and domestic markets? These are some of the questions that arise from the findings of this literature.
The People's Republic of China holds many advantages over other developing countries. It benefits from significant reserves of labour, which are likely to keep wages low for at least some years to come, and it is increasingly building up local capabilities to foster innovation. These advantages allow it, at least in the short term, to maintain a large presence in the markets for low- and medium-tech manufacturing activities. Increasingly, however, some of the economic activities in the People's Republic of China are redirected towards other developing countries (e.g. Viet Nam or Ethiopia) where labour costs are relatively lower. This implies that as wages are rising, other developing countries may be able to capture production of some of the low-labour-cost manufactured goods. FDI from the People's Republic of China can potentially lead to technology transfer and knowledge spillovers, but as we saw in Section 4.4.2, this is not an automatic process. In order to re-create the flying geese paradigm that allowed the Republic of Korea and Taiwan Province of China to benefit from Japanese FDI, governments in developing countries should facilitate the transfer of knowledge, technology and skills, and the accumulation of capabilities, for example by using the industrial policy instruments described in Section 4.4.
While it is undisputed that EOI strategies have produced extraordinary export growth and greatly contributed to structural and technological change in past industrial experiences, it is increasingly recognized that export-led growth cannot be an option for each country in the world. Export-led industrialization strategies must sooner or later reach their natural limits because not all countries can simultaneously pursue such strategies. This has been referred to as the “fallacy of composition argument”. According to the fallacy of composition argument, also referred to as the “adding-up problem”, what is viable for a small economy might not be viable for a group of economies, especially if they are large. In particular, according to this argument, large developing countries that try to simultaneously implement export-led strategies might encounter increasing protective resistance from other developing countries and might incur losses because prices of manufactures would tend to decrease (UNCTAD, 1999, 2002, 2005b; see also Mayer,
163
2003). This is what happened, for example, in the clothing industry, where many developing countries, and in particular the People's Republic of China, adopted export promotion policies. The stronger Chinese participation in international trade significantly contributed to the decline in the unit values of its major exports (UNCTAD, 2005b). This phenomenon might have negative consequences for other developing countries entering those industries. However, while this is likely to reduce the scope for export-led growth and industrialization strategies based on labour-intensive manufacturing in developing countries, such manufacturing is no longer a comparative advantage or a development interest of the People's Republic of China, which is trying to move to activities with higher skill and knowledge content (UNCTAD, 2005b).
In addition to the arguments presented above, the 2007–2008 financial crisis and the subsequent economic recession in many developed countries have proved that foreign demand is not only finite, but that it can also be rather limited. Competition for export markets based on cheap labour and low taxes is already leading developing countries to a “race to the bottom” that in the long run risks jeopardizing their chances to integrate into international trade in a sustainable manner. In light of this, large developing economies might choose to re-orient their industrial policies towards their (often expanding) domestic markets. This shift implies a change in demand patterns and characteristics, as firms would increasingly need to cater to low- and middle-income consumers in their countries instead of high-income consumers in developed countries. However, moving to domestic-demand-oriented growth might be complex for developing countries that specialize in commodities and natural resources, or for countries that are integrated into international trade through the production of goods that domestic consumers do not consume (UNCTAD, 2013a, 2014b).
5.2.3 Policy space
It is often argued that the policy space that developing countries have today to pursue industrial policies is much narrower than that enjoyed by first-tier East Asian NIEs. The concept of policy space refers to “the freedom and ability of a government to identify and pursue the most appropriate mix of economic and social policies to achieve equitable and sustainable development that is best suited to its particular national context. It can be defined as the combination of de jure policy sovereignty, which is the formal authority of national policymakers over policy goals and instruments, and de facto national policy control, which involves the ability of national policymakers to set priorities, influence specific targets, and weigh possible tradeoffs” (UNCTAD, 2014b: 45). In other words, policy space defines the space for maneuver that policymakers have to pursue industrial policy.
Over the past decades, the pursuit of economic liberalization has led to the conclusion of a wide range of multilateral, regional, and bilateral trade and investment agreements by developing countries. These agreements may to varying extents restrict the possibilities that developing countries have to support their domestic industries (Altenburg, 2011; Chang, 2002; Rodrik, 2004; UNCTAD, 1996, 2006). This section focuses on the changes in global governance that affect the policy space of developing countries. In particular, it analyses the constraints developing countries face due to changes in their policy space, and the options they still have in
164
terms of flexibility in designing and pursuing their trade and investment policies.92 The discussion is conducted separately for multilateral, regional, and bilateral trade and investment agreements, and it draws particularly on UNCTAD (2006, 2014b), Rodrik (2004), and Lall (2004).
Multilateral trade agreements are rules set up to facilitate a more efficient flow of trade between countries. In other words, as stated in UNCTAD (2014b: 82), “The multilateral trade regime comprises a set of negotiated, binding and enforceable rules and commitments that are built on the core principles of reciprocity and non-discrimination, as reflected in the most-favoured-nation treatment and the commitment to national treatment (i.e. equal treatment for domestic and foreign goods and enterprises in domestic markets) requirements” (see Box 21 for definitions). There are, however, (temporary) exceptions to the above rules, such as special and differential treatment, that allow developing countries to retain or use some policy instruments whose use would otherwise be forbidden or restricted.
Box 21: Trade and investment agreements: Definitions of terms
Most-favoured-nation: A product made in one member country cannot be treated less favourably than an “alike” product from another country.
National treatment principle: Once foreign goods and enterprises have satisfied whatever border measures are applied, they cannot be treated less favourably (e.g. in terms of internal taxation) than alike or directly competitive domestically produced goods or enterprises.
Reciprocity: Mutual or correspondent concessions of advantages or privileges in the commercial relations between two countries.
Source: Authors' elaboration based on Rodrik (2004) and UNCTAD (2014b).
Some selective interventions that affect trade by protecting domestic markets or promoting exports are prohibited or restricted under multilateral trade agreements signed under the auspices of the WTO. Among them are restrictions to use export subsidies, prohibition of performance requirements such as domestic content requirements, and limits on the use of quantitative restrictions on imports (Rodrik, 2004). Several WTO agreements, which deserve special attention in this context, are discussed in detail below (UNCTAD, 2014b).
The Agreement on Trade-related Investment Measures (TRIMs) prohibits signatory countries from imposing discriminatory requirements on foreign investors such as local content, local employment, and trade-balancing requirements, foreign exchange balancing restrictions, and technology transfer requirements.93 Empirical evidence demonstrated that in the past these instruments have been widely used to support structural transformation, allowing developing countries to derive greater benefits from FDI, increase linkages between foreign investors and local producers (see Section 4.4.2), and establish performance-based criteria such as export
92 For a discussion of how African countries can use the policy space available to them, see UNCTAD (2007a); for low-income and lower-middle income countries see Ramdoo (2015) and Guadagno (2015b), respectively.93 The foreign-exchange balancing requirement acts as a restriction on the volume of imports of an enterprise. Imports are allowed up to the value of foreign exchange inflows attributable to the enterprise.
165
targets (see Section 2.3). There is, however, some flexibility in the agreement that allows countries to utilize some industrial policy instruments. For example, TRIMS does not prohibit countries from offering concessions to foreign investors (even if these may hurt domestic producers), as often occurs within EPZs and SEZs (see Section 4.4.2). Moreover, countries are allowed to impose sector-specific entry conditions on foreign investors, including industry-specific limitations, local content requirements for the procurement of services, and offset clauses in defence procurements (see Box 15).
The Agreement on Trade-related Aspects of Intellectual Property Rights (TRIPS) establishes the standards for granting and protecting intellectual property rights such as patents, copyrights, and trademarks. The TRIPS agreement protects R&D outcomes to allow entrepreneurs to appropriate the benefits that arise from their investments in R&D.94 The agreement restricts reverse engineering and other forms of imitative innovation, which in the current advanced economies, including East Asian economies, has proven to be crucial to gain knowledge and accumulate production and technological capabilities (Chang, 2002). Under the agreement, however, developing countries still enjoy some flexibility, mainly granted through two mechanisms: compulsory licensing and parallel imports. With compulsory licensing, authorities can license companies other than the patent owner to make, use, sell to the domestic market, or import a product under patent protection without the permission of the patent owner.95 With parallel imports, countries can import branded goods and sell them without the consent of the owner of the trademark. In addition to these two principles, adapting imported technologies to local conditions is allowed thanks to the granting of narrow patents for incremental innovations that build on more fundamental discoveries.96
The General Agreement on Trade in Services (GATS) extends the most-favoured-nation and national treatment principles (see Box 21 for definitions) to trade in a wide range of services, such as finance, tourism, education, and health. The agreement allows countries to make a list of activities that they commit to liberalize, as well as the mode and sequencing of “opening up” these activities to foreign investors. For this reason, the GATS is generally considered less binding than other agreements, although some observers insist that its reach is much broader than it appears, since it often covers a wide range of domestic laws and regulations (Chanda, 2002).
The Agreement on Subsidies and Countervailing Measures (ASCM) prohibits the use of subsidies contingent upon the use of domestic over imported goods (i.e. local content requirements) and export performance (i.e. export subsidies). The agreement thus restricts the capacity of developing countries to use these policies for the development of domestic firms. Other subsidies, such as production subsidies, are considered “actionable”, meaning that they are
94 Alternatively, entrepreneurs would bear the costs of innovations, but not the profits potentially originating from them. In the absence of protection, due to the characteristics of knowledge described in Section 3.2.2, other entrepreneurs would be able to use that knowledge, replicate their innovations, re-sell them at lower prices and thus profit from these innovations.95 The firm that applies for the licence should have previously tried to directly negotiate a voluntary licence with the patent holder, unless there is a national emergency or extreme urgency, or for public non-commercial use, or in cases of anti-competitive practices.96 For more in-depth treatment, see also Correa (2015) and UNCTAD (2007c). For the impact of TRIPS on measures against climate change, see Fortunato et al. (2009).
166

not prohibited, but can be challenged. As an exception to the agreement, countries that are classified as least developed, or WTO member countries with per capita incomes below US$1,000 (in constant 1990 US$) for three consecutive years, are excluded from this agreement. They can effectively use export subsidies to develop domestic industries, as long as they remain below that per capita income threshold (see Annex 7 of the ASCM).
Regional and bilateral trade and investment agreements. In addition to multilateral trade agreements, the conclusion of regional and bilateral trade agreements has further eroded the policy space available to developing countries by strengthening the overall level of enforcement, and by eliminating exceptions or demanding commitments not included in the multilateral agreements ratified under the WTO. Overall, measures included in regional trade agreements are often more stringent than provisions under the multilateral trade regime. This is why they are often referred to as “WTO-plus” (e.g. they stipulate additional tariff reductions), and/or they go beyond current multilateral agreements and are referred to as “WTO-extra” (e.g. they include additional provisions on environmental standards or rules of competition). Moreover, regional trade agreements tend to provide fewer exemptions compared to TRIPS and TRIMS. For example, in TRIPS-plus commitments, regional trade agreements often prohibit the use of parallel imports and allow compulsory licensing only in emergency situations. Furthermore, regional trade agreements have pushed for harmonization and mutual recognition of standards and technical regulations in order to remove technical barriers to trade and reduce transaction costs for foreign firms. In the context of promoting industrial development, this means that domestic firms would face greater competition at home (because entry in their domestic market is now easier for foreign investors) and obstacles to enter foreign markets (because they have to comply with stricter quality or environmental standards).
Regional trade agreements can also include an “investment chapter” that imposes rules on the functioning of capital markets and foreign investment, and that implicitly affects domestic policymaking. Alternatively, these provisions can be included in bilateral investment treaties. It has been argued that these investment agreements restrict the policy space of developing countries. For example, through the “investor-state dispute settlement” mechanism, countries accept the jurisdiction of foreign arbitration centres on issues that might affect the profitability of the foreign investment. Such mechanisms have allowed international investors to sue governments and obtain compensation for policies related to development, such as energy policies or macroeconomic policies (e.g. with regard to exchange rate management and restructuring of the banking system). In addition, these agreements often call for full liberalization of all sorts of capital flows and deregulation of financial services, impeding a selective approach to capital inflows (including FDI) and restricting the policy space to regulate domestic finance (Calcagno, 2015; UNCTAD, 2003, 2007, 2014b).97
6 Conclusions
This module has examined the role of industrial policy in structural transformation. It has presented the main views on industrial policy, highlighting the divergences between different schools and interpretations. It has also discussed the main arguments in favour and against
97 See UNCTAD (2011c) on how to safeguard policy space and preserve countries' industrial policy priorities when signing international investment agreements.
167
industrial policies, explaining how policies can be effectively designed and implemented in order to reduce potential risks of government failures. In this regard, the module described how governments have used specific industrial policy instruments to support successful catch-up by local industries. Finally, the module discussed some of the most important challenges to industrial policies in developing economies, differentiating between the internal and external factors.
The key messages of this module include:
Industrial policies have been a rather controversial topic, with authors in different traditions presenting very different views on what industrial policy is, what successful industrialized economies have done in terms of such policy, and what an optimal industrial policy should look like.
Arguments in favour of industrial policy are mainly theoretical, i.e. they rely on economic concepts such as externalities and economies of scale, while arguments against industrial policy relate mainly to how industrial policies are implemented in practice.
Industrial policies are not easy to implement, as they entail a number of potential risks and government failures.
Despite these concerns, there are some industrial policy instruments that have proved successful in a number of industrialized and middle-income economies.
Empirical evidence shows that successful industrial policies require a well-crafted mix of policy instruments and strong institutions with competent and efficient bureaucrats and officials.
Successful industrial policy in developing economies also needs to take into account challenges from the international political and economic environment: GVCs, with their skills and knowledge requirements; the rise of the People's Republic of China; and a reduced policy space resulting from multilateral, but especially regional and bilateral, trade and investment agreements that can condition industrial policy.
Exercises and questions for discussion
Question for discussion No. 1: What is industrial policy?
(a) Two groups of students (3-4 students each) debate the different definitions of industrial policy discussed in Section 2.l.
(b) Each student chooses an industrial policy instrument and discusses how it affects the economy and how it can be classified, following the classification proposed in Section 2.2.
(c) After reading Section 2.3 and Rodrik (2004, 2008), students should answer the following questions:
What does the expression “carrots and sticks” refer to? What does “embedded autonomy” mean? What is the main advice in the literature with respect to industrial policy design and
implementation, and management of state-business relations?
168
Question for discussion No. 2: Arguments in favour and against industrial policy
(a) Each student picks one of the strands of literature summarized in Section 3.1 and explains its interpretation of the East Asian experience, taking into account the cases of other developing regions. Based on the East Asian experience, which policy elements would you recommend, and why, to developing countries that seek to industrialize?
(b) After reading Sections 3.2 and 3.3 students should answer the following questions:
What are market failures? What are economies of scale? Provide examples of how market failures arise in the
presence of economies of scale and what the government can do to fix them. What are externalities? Provide examples of factors that give rise to externalities and
explain how and why market failures occur and what the government can do. What are the factors that lead to imperfections in capital markets? Discuss the infant industry argument. What are the main arguments against industrial policy?
(c) Two groups of students (3-4 students each) debate the merits and relevance for developing countries of arguments in favour and against industrial policy.
(d) Each student chooses an industrial policy instrument and discusses how the use of that instrument can be justified and criticized, using the arguments reviewed in point (b).
Case study No. 1
Each student chooses one of the roles of the state outlined in Section 4 and identifies and discusses a policy experience of a country of the student’s choice in that particular area.
Question for discussion No. 3: Challenges to industrial policy in developing countries
(a) Two groups of students (3-4 students each) pick a country and discuss which of the internal conditions described in Section 5.1 are most relevant to the selected country and how they affect industrial policymaking.
(b) After reading Chapter IV of UNCTAD (2013b) and Farfan (2005) students should:
Discuss and provide examples of the main forms of industrial upgrading in GVCs. Discuss the factors that impede or facilitate upgrading in GVCs in developing countries. Take one of the case studies on upgrading in commodity-dependent economies presented
in Farfan (2005) and discuss the strategy and interventions used by policymakers to overcome commodity dependency. Do you think that the observed upgrading patterns could be replicated in other commodity-dependent economies? Why or why not?
169
(e) Each student chooses a country and discusses how its economy is affected by the rise of the People's Republic of China as a global superpower. Which industrial policy can help the country benefit from this new international scenario?
(c) After reading Chapters V and VII of UNCTAD (2014b), students should answer the following questions:
What types of selective interventions are prohibited by the WTO multilateral agreements? And what are the flexibilities that countries enjoy under these agreements?
What is the meaning of “WTO-plus” and “WTO-extra” measures included in regional and bilateral trade and investment agreements?
Case study No. 2
Students should work, either on an individual basis or in a group, on a case study of industrial policymaking for a country of their choice. Specifically, they should:
(a) Assess the industrialization possibilities for the economy and identify the challenges and factors that may constrain policy interventions (e.g. in terms of the factors discussed in Sections 2.3, 3.3 and 5 and with particular attention to the level of state capacity).
(b) Analyse the industrial policies implemented in the recent past, distinguishing the different roles played by the state and discussing the elements of industrial policymaking that contributed to the success or failure of these policies.
(c) Identify priorities and complementary policies that are most relevant for the economy and justify their choices in terms of industrialization priorities, types of interventions, etc.
(d) Evaluate the relations between the selected country and the People's Republic of China or other emerging economies. Examine the opportunities and challenges arising from these relations and the possible industrial policies that can maximize opportunities and address challenges.
(e) Propose policy interventions that can help the country insert itself into GVCs and upgrade its capabilities within them.
170

Annex: Industrial policy at the local level
Until relatively recently, the central government was portrayed as the driving force behind industrial policy design and implementation. However, as Bateman (2000) notes, a good number of industrial-policy-led successes have been undertaken – that is, designed, financed, implemented, and monitored – at the sub-national level, involving combinations of pro-active municipal and regional governments (albeit often achieved with a helping hand from central governments). The most important difference between central and local industrial policy measures lies in the scale of the enterprises supported. Rather than focusing on large enterprises, the emphasis of local industrial policy is mainly on promoting a thriving, technologically forward-looking, innovative, networked (both vertically and horizontally), and growth-oriented SME sector. This objective is important not only for employment, but also for innovation (see Section 4.2.2).
The examples of the then Federal Republic of Germany, Italy, and the People's Republic of China illustrate this point. Networks and subcontracting in supply chains and collectively owned enterprises also proved to be important policy areas at the local level.
Regional support for small and medium-sized enterprises in the then Federal Republic of Germany
The then Federal Republic of Germany rose from almost total destruction in 1945 to become an industrial powerhouse and one of the world’s leading industrial export nations by the 2000s. The key to its transformation was an industrial policy approach built around a decentralized regional state-owned institutional support system that included banks, industrial R&D entities, technology development institutions, training institutions, and enterprise development entities that gave support both to create and later sustain industrial enterprise success (Meyer-Stamer and Wältring, 2000) The regional (Länder) government institutions were especially strong and motivated to promote the reconstruction and industrial development process, financing key enterprises and sectors based on careful technical studies and growth forecasts for the proposed market. The Länder and local governments were both instrumental in establishing and regulating a wide range of support structures that could promote SMEs through technology use, innovation, product and process upgrading, and prototype development. This dense local institutional structure was critical to the re-emergence of the Mittelstand (medium-sized enterprises), which in many important respects lay at the heart of then Federal Republic of Germany’s post-war economic performance. As in post-war Japan and Italy, therefore, the state of the then Federal Republic of Germany based its post-war development on pro-active regional and local state administrations that were able to develop capacity and generate the local resources to promote recovery and development from the bottom up.
Regional support for small and medium-sized enterprises in Italy
Italy is often held out as one of the countries that have shown considerable effort to promote the concept of local industrial policy. After 1945, the Italian government set out to support SME development through numerous financial support schemes. Of particular importance was the Artisan Fund dating from 1947, which provided 10-year loans at low interest rates for equipment
171

purchases and the modernization of workshops. In just over 20 years (1953–1976), the Artisan Fund granted over 300,000 loans. However, the vast bulk of these loans (nearly 90 per cent) went to the northern regions of the country, where local and regional governments had established a very effective set of institutions capable of granting these loans on the basis of an industrial policy. The result was that nearly 36 per cent of all small-industry-based enterprises in the northern regions received one or more Artisan loans in this period. Between 1951 and 1971, the Artisan Fund extended nearly 172,000 loans, while the increase in the number of enterprises totaled 226,700 – meaning that the number of loans amounted to nearly 75 per cent of total sectoral growth. A very large portion of the loans went towards capital equipment imported from abroad, including from the United States. This equipment served to upgrade the level of local technology in a short period of time (Weiss, 1988).
In 1950, the government also established a loan scheme to be administered through the Mediocredito Centrale that was specifically directed towards more innovative small manufacturing enterprises. As with the Artisan Fund, a very high proportion of these enterprises accessed these loans. But again, enterprises located in the northern regions were the main beneficiaries. The main reason for the huge disparity in loan applications and approvals between the north and south was not differing economic pre-conditions and business opportunities – many of the northern regions in 1945 were just as poor and devastated as the south – but the well-funded, comprehensive, and highly sophisticated regional and local state-led support institutions established by the regional, provincial, and municipal governments. This high level of support for the development of the local enterprise sector – crucially including significant financial support to facilitate access by key local enterprises to the latest state-of-the-art technologies – very much contributed to the rise of the “Third Italy” phenomenon of regional economic success achieved via spectacular SME growth and technological sophistication (Peluffo and Giacchè, 1970).
As a final example, northern Italy’s servizi reali were local economic development agencies established by regional and local governments to support growth-oriented industrial SMEs and clusters of SMEs. With a total of 40 servizi reali by the mid-1990s, a third of Italy’s total, the northern regions were well placed to pro-actively promote local structural transformation and industrial upgrading. The Emilia-Romagna region alone supported 15 per cent of the Italian total of servizi reali, and it became known as the location for many of the world’s leading industrial SMEs and some of the largest and most prestigious technology-based companies (e.g. Ferrari). The most well-known of the servizi reali is ERVET (Emilia-Romagna Valorizzazione Economica Territorio, or Emilia-Romagna Regional Development Agency). Located in Bologna, the capital of Emilia-Romagna, ERVET has provided critical support to the region’s industrial clusters of innovative microenterprises and SMEs, including those operating within its famous industrial districts. With the government in Emilia-Romagna providing secure financial support for its operations, ERVET achieved its goal of building a flourishing innovation-driven, growth-oriented microenterprise and SME sector. By the 1970s, the manifest success of the Emilian model began to serve as the role model for other sub-national governments around the world wanting to establish a local industrial policy.
172

Regional support for small and medium-sized enterprises in the People's Republic of China
The remarkable structural transformation of the People's Republic of China achieved since the early 1980s was also the result of decentralization in the 1980s that opened the way for pro-active local governments and cities to introduce a range of industrial policies that combined to provide the impetus for the economic transformation of the Chinese economy. Blecher (1991) and Oi (1992) showed that the local governments were relatively pro-active and, among other things, free to raise their own funds to promote a local industrial policy. One of the motivating factors here was that seniority within the Chinese state bureaucracy depended on successful economic advancement of the locality, which in turn stimulated a form of inter-locality competition mediated by the central government in order to avoid over-capacity.
The first moves by local governments involved support for township and village enterprises (TVEs), which were local government-owned enterprises operating under hard budget constraints and pushed to use as much state-of-the-art technology as possible in order to expand. By 1996, there were some 7.6 million industrial TVEs in the People's Republic of China (O’Connor, 1998), representing probably one of the most successful experiences of “municipal entrepreneurship” (Qian, 2000). Over time, external and internal pressure mounted to privatize the TVEs. The largest and most successful local governments then moved away from the TVE experiment to begin to establish whole industries from scratch. With the support of the national government, many city governments were able to build world-beating industrial sectors centred on shipbuilding, electronics, and engineering. Perhaps the best example of what came to be known as the “local developmental state” approach is with regard to automobiles. As Thun (2006) makes clear, political leaders were all keen to see the emergence of a domestic automobile industry, but it was at the local government level that real actions were taken. The city of Shanghai, in particular, was pro-active in developing a major automobile industry. City officials were involved in selecting the foreign partners, promoting the required cluster of SMEs with the capacity to subcontract items that required high technical specifications, and stimulating local R&D and innovation in order to rapidly improve quality.
Networks and subcontracting in supply chains
The importance of local industrial policy in structural transformation is even more pronounced if we consider networks and subcontracting in supply chains. From the mid-1800s onwards, scholars observed that large enterprises operate best when embedded within a dynamic SME sector able to directly provide quality intermediate inputs, skilled labour, technical knowledge, new technologies and innovations, and, indirectly, a range of other benefits (informal knowledge transfer, etc.). Alfred Marshall (1890) first identified this “agglomeration effect” in 19th century northern England, a region where large industries – textiles, textile machinery, machine tools, etc. – were continually upgraded thanks to constant interaction and cooperation between constituent large firms and SMEs operating in “industrial districts”. Importantly, it was found that dynamic local governments and city administrations stood behind many of the crucial institutional innovations undertaken to establish and expand these industrial districts, such as in basic education and technical vocational education and training, technology transfer, new product and process generation, and public procurement. Agglomeration effects are a crucial factor in achieving productivity increases and structural transformation from the bottom up.
173
Importantly, local industrial policies can link microenterprises, SMEs, and large enterprises in such a way that, among other things, knowledge and skills flows are spurred, technologies transferred both up and down the supply chain, and risks and rewards shared in an atmosphere of trust and cooperation based on a strong identification with the health of the local community. Several examples illustrate the important potential here.
For example, much success in the then Federal Republic of Germany was achieved in supporting the medium-sized enterprises (Mittelstand). But the wider, less-publicized success was in creating a highly efficient supply chain involving SMEs supplying highly specific inputs to major companies operating in the automobile, electronics, engineering, and other industries. Similarly, the industrial policy approach in northern Italy post-1945 was also very much developed around support for highly productive local enterprise networks and clusters that provided quality inputs to a new generation of Italian corporations. In addition, many of the supply chains supported were composed of solidarity/equity-promoting cooperative enterprises, a preference that helped build up important further reserves of trust, reciprocity, and cooperation in the local industrial community (Zamagni and Zamagni, 2010).
Alternatively, Japan established a local supply chain model that some scholars describe as the core factor behind Japan’s post-war industrial success and structural transformation (Friedman, 1988). The essence of the Japanese local supply chain model is the extent of cooperation established between the large company at the top of the supply chain and the industrial microenterprises and SMEs in the local community that supply it. In contrast with industrial development models in the United States and the United Kingdom, in Japan a leading company’s cooperation with suppliers is typically long term. A minimum profit is guaranteed to suppliers, risks are shared, and financial, technical, and other forms of support are made freely available to suppliers by the leading company (Nishiguchi, 1994). One obvious case in point is the automobile industry (Womack et al., 1990). For their part, local and regional governments establish a comprehensive support structure for local industrial microenterprises and SMEs that can resolve almost all of their main financial, training, technical, and technology transfer problems.
Collectively owned enterprises
Collectively owned enterprises are also positively associated with important episodes of local and regional structural transformation. Cooperative enterprises have a long history of innovating and promoting industrial development in areas in which conventional privately owned companies, or even the state, are unlikely to invest. One example concerns the Mondragon Cooperative Complex, a network of almost 120 worker cooperatives that was established in the small town of Mondragon in the Basque country of northern Spain. Mondragon houses a network of worker cooperative enterprises (Ellerman, 1982). Catalysed into life in the 1950s by a Roman Catholic priest who wanted to address the town’s high unemployment and poverty rates, the Mondragon cooperative complex began with one worker cooperative making simple industrial items for sale in the locality and wider region. It eventually grew to become one of the world’s leading innovative companies, while retaining almost all of its original cooperative philosophy and structures. Early on, the municipality realized that growth (and thus jobs and incomes in the community) was likely only if there was an industrial policy framework that
174

could offer dedicated support to industry-based worker cooperatives. Accordingly, the Mondragon community began by putting together a wide range of industrial policy interventions including a financial support cooperative offering low-cost capital (the Working People’s Bank or Caja Laboral Popular), a high-quality technical advisory and business support body (the Entrepreneurial Division or Empresarial Division), an applied research and technology transfer centre (Ikerlan), and a local college (Escuela Politécnica Superior) for industrial R&D and vocational education and training. A particular strength of the Mondragon cooperative complex was the ease with which innovations and tacit knowledge were passed around the group, greatly contributing to upgrading technology in all of the Mondragon groups’ products and processes. Recognizing the great success of the Mondragon industrial cooperative complex, the Basque regional government began to construct an industrial policy framework along the same lines in the 1970s. After some setbacks, this framework has transformed the region from one of Spain’s poorest in the 1960s into one of its richest regions (Cooke and Morgan, 1998).
175

References
Acs ZJ, and Audretsch DB (1990). Innovation and Small Firms. MIT Press. Cambridge, MA.
ADB (2014). Technical and vocational education and training in the Socialist Republic of Viet Nam: An assessment. Asian Development Bank. Mandaluyong City, Philippines.
Aghion P, Boulanger J, and Cohen E (2011). Rethinking industrial policy. Bruegel Policy Brief 2011/04.
Akamatsu K (1962). A historical pattern of economic growth in developing countries. The Developing Economies 1(S1): 3–25.
Akyüz Y, and Gore C (1996). The investment–profits nexus in East Asian industrialization. World Development 24 (3): 461–70.
Akyüz Y, Chang HJ, and Kozul-Wright R (1998). New perspectives on East Asian development. The Journal of Development Studies 34(6): 4–36.
Alchian AA, and Demsetz H (1972). Production, information costs and economic organization. American Economic Review 62(5): 777–95.
Altenburg T (2011). Industrial policy in developing countries: Overview and lessons from seven country cases. DIE Discussion Paper No. 4/2011. German Development Institute.
Altenburg T (2013). Can industrial policy work under neopatrimonial rule? In: Pathways to Industrialization in the Twenty-first Century: New Challenges and Emerging Paradigms, Szirmai A, Naudé WA, and Alcorta L, eds. Oxford University Press. Oxford, UK.
Altenburg T, and Lütkenhorst W (2015). Industrial policy in developing countries: Failing, markets, weak states. Edward Elgar Publishing. Cheltenham, UK.
Altenburg T, and Melia E (2014). Kick-starting industrial transformation in sub-Saharan Africa. In: Transforming Economies: Making Industrial Policy Work for Growth, Jobs and Development, Salazar-Xirinachs JM, Nübler I, and Kozul-Wright R, eds. International Labour Organization. Geneva: 355–78.
Amsden A (1989). Asia’s Next Giant: South Korea and Late Industrialization. Oxford University Press. New York and Oxford, UK.
Amsden A (2001). The Rise of “The Rest:” Challenges to the West from Late-Industrializing Economies. Oxford University Press. New York.
Amsden A (2007). Escape from Empire: The Developing World’s Journey through Heaven and Hell. MIT Press. Cambridge, MA.
176
Amsden A, and Chu W (2003). Beyond Late Development: Taiwan’s Upgrading Policies. MIT Press. Cambridge, MA.
Arndt C, and Oman C (2006). Uses and Abuses of Governance Indicators. OECD Development Centre Study. Organization for Economic Cooperation and Development. Paris.
Atkinson AB, and Stiglitz JE (1980). Lectures on Public Economics. McGraw-Hill Book Co. London.
Balassa B (1971). The Structure of Protection in Developing Countries. Johns Hopkins University Press. Baltimore.
Balassa B (1982). Development Strategies in Semi-Industrial Economics. Johns Hopkins University Press. Baltimore.
Barry F, and Topa B (2006). The state, venture capital and domestic high-tech start-ups in a late-developing economy: Ireland. UCD Centre for Economic Research Working Paper 06/25. University College Dublin.
Bastable CF (1927). The Commerce of Nations. Methuen & Co. London.
Bateman M (2000). Neo-liberalism, SME development and the role of business support centres in the transition economies of Central and Eastern Europe. Small Business Economics 14(4):275–98. Available at: https://www.researchgate.net/publication/5158021_Neo-Liberalism_SME_Development_and_the_Role_of_Business_Support_Centres_in_the_Transition_Economies_of_Central_and_Eastern_Europe .
Bateman M, Duran Ortĩz JP, and Maclean K (2011). A post-Washington consensus approach to local economic development in Latin America? An example from Medellin, Colombia. ODI Background Note (April). Overseas Development Institute. London.
Bennedsen M (2000). Political ownership. Journal of Public Economics 76(3), 559–81.
Bigsten A, and Söderbom M (2006). What have we learned from a decade of manufacturing enterprise surveys in Africa? World Bank Research Observer 21 (2): 241–65.
Bizquez-Lidoy J, Rodriquez J, and Santiso J (2006). Angel or Devil? China’s Impact on Latin American Emerging Markets. Organization for Economic Cooperation and Development. Paris.
Blecher M (1991). Development state, entrepreneurial state: The political economy of socialist reform in Xinju municipality and Guanghan county. In: The Chinese State in the Era of Economic Reform: The Road to Crisis, White G, ed. M.E. Sharpe. Armonk, NY: 265–91.
Block F (2009). Swimming against the current: The rise of a hidden developmental state in the United States. Politics & Society 36(2): 169–206.
177

Block F, and Keller M (2011). State of Innovation: The U.S. Government’s Role in Technology Development. Paradigm Publishers. Boulder, CO
Borensztein E, De Gregorio J, and Lee JW (1998). How does foreign direct investment affect economic growth? Journal of International Economics 45(1): 115–35.
Breznitz D, and Ornston D (2013). The revolutionary power of peripheral agencies: Explaining radical policy innovation in Finland and Israel. Comparative Political Studies 46(10): 1219–245.
Broadman HG (2007). Africa’s Silk Road. World Bank. Washington, DC.
Buchanan JM, Tollison RD, and Tullock G (1980). Toward a Theory of the Rent-seeking Society. Texas A & M University. College Station, TX.
Calcagno A (2015). Rethinking development strategies after the global financial crisis. In: Rethinking Development Strategies after the Financial Crisis, Volume 1, Calcagno A, Dullien S, Márquez-Velázquez A, Maystre N, and Priewe J, eds. United Nations Conference on Trade and Development and Fachhochschule für Technik und Wirtschaft Berlin.
Chanda R (2002). GATS and its implications for developing countries: Key issues and concerns. Discussion Paper No. 25. ST/ESA/2002/DP.25. United Nations Department of Economic and Social Affairs. New York.
Cervellati M, Fortunato P, and Sunde U (2008). Hobbes to Rousseau: Inequality, institutions, and development. The Economic Journal 118(531): 1354–384.
Chandrasekhar CP (2015). National development banks in a comparative perspective. In: Rethinking Development Strategies after the Financial Crisis, Volume 1, Calcagno A, Dullien S, Márquez-Velázquez A, Maystre N, and Priewe J, eds. United Nations Conference on Trade and Development and Fachhochschule für Technik und Wirtschaft Berlin.
Chang HJ (1994). The Political Economy of Industrial Policy. St. Martin’s Press. New York.
Chang HJ (2002). Kicking Away the Ladder: Development Strategy in Historical Perspective. Anthem Press.
Chang HJ (2003). The market, the state and institutions. In: Rethinking Development Economics, Chang HJ, ed. Anthem Press. London: 41–60.
Chang HJ (2006). How important were the “initial conditions” for economic development – East Asia vs. Sub-Saharan Africa. In: The East Asian Development Experience: The Miracle, the Crisis, and the Future, Chang HJ, ed. Cornell University Press. London.
Chang HJ (2009). Industrial policy: Can we go beyond an unproductive confrontation? Paper presented at the Annual World Bank Conference on Development Economics, 22-24 June, Seoul,
178
Republic of Korea. Available at: http://siteresources.worldbank.org/INTABCDESK2009/Resources/Ha-Joon-Chang.pdf .
Chang HJ (2010). How to “do” a developmental state: Political, organizational, and human resource requirements for the developmental state. In: Constructing a Democratic Developmental State in South Africa – Potentials and Challenges, Edigheji O, ed. Human Science Research Council Press. Cape Town.
Chang HJ (2012). 23 Things They Don’t Tell You about Capitalism. Bloomsbury Publishing.
Chang HJ, and Grabel I (2004). Reclaiming Development: An Alternative Economic Policy Manual. Zed Books. London.
Cheng TJ, Haggard S, and Kang D (1998). Institutions and growth in Korea and Taiwan: The bureaucracy. In: East Asian Development: New Perspectives, Akyüz Y, ed. F. Cass. London: 87–111.
Cheon BY (2014). Skills development strategies and the high road to development in the Republic of Korea. In: Transforming Economies: Making Industrial Policy Work for Growth, Jobs and Development, Salazar-Xirinachs JM, Nübler I, and Kozul-Wright R, eds. International Labour Organization. Geneva: 213–18.
Cimoli M, and Katz J (2003). Structural reforms, technological gaps and economic development: A Latin American perspective. Industrial and Corporate Change 12(2): 387–411.
Cimoli M, Dosi G, and Stiglitz JE (2009). The Political Economy of Capabilities Accumulation: The Past and Future of Policies for Industrial Development. Oxford University Press. New York and Oxford, UK.
Cimoli M, Dosi G, Nelson R, and Stiglitz J (2009). Institutions and policies shaping industrial development: An introductory note. In: The Political Economy of Capabilities Accumulation: The Past and Future of Policies for Industrial Development, Cimoli M, Dosi G, and Stiglitz JE, eds. Oxford University Press. New York and Oxford, UK: 19–38.
Cingolani L (2013). The state of state capacity: A review of concepts, evidence and measures, UNU-MERIT Working Paper 2013–053. United Nations University/Maastricht Economic and Social Research Institute.
Cohen WM, and Levinthal DA (1990). Absorptive capacity: A new perspective on learning and innovation. Administrative Science Quarterly 35(1): 128–52.
Collier P (2007). The Bottom Billion: Why the Poorest Countries Are Failing and What Can Be Done about It. Oxford University Press. Oxford, UK.
Cooke P, and Morgan K (1998). The Associational Economy: Firms, Regions and Innovation. Oxford University Press. Oxford, UK.
179

Correa CM (2015). Intellectual property: How much room is left for industrial policy? UNCTAD Discussion Paper No. 223. United Nations Conference on Trade and Development. Geneva.
Dahlman C, and Frischtak C (1992). National systems supporting technical advance in industry: The Brazilian experience. In: National Innovation Systems, Nelson, RR, ed. Oxford University Press. Oxford, UK.
Devlin R, and Moguillansky G (2011). Breeding Latin American Tigers: Operational Principles for Rehabilitating Industrial Policies in the Region. World Bank. Washington, DC.
Di Maio M (2009). Industrial policies in developing countries: History and prospectives. In: The Political Economy of Capabilities Accumulation: The Past and Future of Policies for Industrial Development, Cimoli M, Dosi G, and Stiglitz JE, eds. Oxford University Press. New York and Oxford, UK. Dosman EJ (n.d.). Raúl Prebisch and the XXIst Century Development Challenges. Raúl Prebisch (1901–1986). Economic Commission for Latin America and the Caribbean. Santiago.
Dunning JH (1993). Multinational Enterprises and the Global Economy. Addison-Wesley. Harlow, UK.
Dussel PE (2005). Economic Opportunities and Challenges Posed by China for Mexico and Central America. German Development Institute. Bonn.
Easterly W (2001). The Elusive Quest for Growth: Economists’ Adventures and Misadventures in the Tropics. MIT Press. Cambridge, MA.
Edwards S (1988). Exchange Rate Misalignment in Developing Countries. John Hopkins University Press. Baltimore.
Ellerman D (1982). The socialisation of entrepreneurship: The empresarial division of the Caja Laboral Popular. Industrial Cooperative Association. Brookline, MA.
Evans P (1995). Embedded Autonomy: States and Industrial Transformation. Princeton University Press. Princeton, NJ.
Evans P (1998). Transferable lessons? Re-examining the institutional prerequisite of East Asian economic policies. In: East Asian Development: New Perspectives, Akyüz Y, ed. F. Cass. London: 66–86.
Evans P (2005). Harnessing the state: Rebalancing strategies for monitoring and motivation. In: States and Development: Historical Antecedents of Stagnation and Advance, Lange M, and Rueschemeyer D, eds. Palgrave Macmillan. New York.
180
Evans P (2008). In search of the 21st century developmental state. Centre for Global Political Economy Working Paper No. 4 University of Sussex. Brighton, UK.
Farla K, Guadagno F, and Verspagen B (2015). Industrial policy in the European Union. In: Development and Modern Industrial Policy in Practice: Issues and Country Experiences, Felipe J, ed. Edward Elgar Publishing. Cheltenham, UK.
Farfan O (2005). Understanding and escaping commodity dependency: A global value chain perspective. Paper prepared for the Investment Climate Unit, International Finance Corporation. World Bank Group. Washington, DC.
Felipe J (2015). Development and Modern Industrial Policy in Practice: Issues and Country Experiences. Edward Elgar Publishing. Cheltenham, UK.
Felipe J, and Rhee C (2015). Issues in modern industrial policy (I): sector selection, who, how, and sector promotion. In: Development and Modern Industrial Policy in Practice: Issues and Country Experiences, Felipe J, ed. Edward Elgar Publishing. Cheltenham, UK.
Ferraz JC, Kupfer D, and Marques FS (2014). Industrial policy as an effective developmental tool: Lessons from Brazil. In: Transforming Economies: Making Industrial Policy Work for Growth, Jobs and Development, Salazar-Xirinachs JM, Nübler I, and Kozul-Wright R, eds. International Labour Organization. Geneva: 291–305.
Fishlow A, Gwin C, Haggard S, Rodrik D, and Wade R (1994), Miracle or design? Lessons from the East Asian experience. Policy Essay No. 11. Overseas Development Council. Washington, DC.
Floyd R (1984). Some topical issues concerning public enterprises. In: Public Enterprise in Mixed Economies: Some Macroeconomic Aspects, Gray C, Short R, and Floyd R, eds. International Monetary Fund. Washington D.C.
Fortunato P, and Panizza U (2015). Democracy, education and the quality of government. Journal of Economic Growth 20(4): 333–63.
Fortunato P, Kozul-Wright R, and Vos R (2009). Technology transfer and climate change: Beyond TRIPS. UN-DESA Policy Brief No. 19. United Nations Department of Economic and Social Affairs. New York.
Freeman C (1987). Technology, Policy, and Economic Performance: Lessons from Japan. Pinter Publishers. London.
Friedman BM (1978). Crowding out or crowding in? The economic consequences of financing government deficits. Brookings Papers on Economic Activity 9(3): 593–654.
Friedman D (1988). The Misunderstood Miracle: Industrial Development and Political Change in Japan. Cornell University Press. Ithaca, NY.
181
Fu X, Kaplinsky R, and Zhang J (2012). The impact of China on low and middle income countries’ export prices in industrial-country markets. World Development 40(8): 1483–496.
Galbraith JK (1971). The New Industrial State. Houghton-Mifflin. Boston.
Gereffi G (2014). Global value chains in a post-Washington Consensus world. Review of International Political Economy 21(1): 9–37.
Gereffi G (2015). Global value chains, development and emerging economies. UNIDO Research, Statistics and Industrial Policy Branch Working Paper 18/2015. United Nations Industrial Development Organization. Vienna.
Gereffi G, Humphrey J, and Sturgeon T (2005). The governance of global value chains. Review of International Political Economy 12(1): 78–104.
Gilbert N (2005). The “enabling state”? From public to private responsibility for social protection: Pathways and pitfalls. OECD Social, Employment and Migration Working Paper No. 26, Organization for Economic Cooperation and Development. Paris.
Goedhuys M, Hollanders H, and Pierre Mohnen P (2015). Innovation policies for development. In: The Global Innovation Index 2015: Effective Innovation Policies for Development. Cornell University, INSEAD, and WIPO. Fontainebleau, Ithaca, and Geneva: 81–87. Available at: https://www.globalinnovationindex.org/userfiles/file/reportpdf/GII-2015-v5.pdf .
Goldstein A (2002). EMBRAER: From national champion to global player. CEPAL Review 77 (August).
Grossman G (1990). Promoting new industrial activities: a survey of recent arguments and evidence. OECD Economic Studies No. 14. Organization for Economic Cooperation and Development. Paris.
Grossman SJ, and OD Hart (1986). The costs and benefits of ownership: The theory of vertical and lateral integration. Journal of Political Economy 94: 691–719.
Guadagno F (2015a). Why have so few countries industrialised? Maastricht University PhD dissertation. Available at: http://pub.maastrichtuniversity.nl/4b5c53bd-65b4-4006-ab36-53d6fb60d107 .
Guadagno F (2015b). Industrial policies in lower-middle-income countries. E15Initiative. International Centre for Trade and Sustainable Development (ICTSD) and World Economic Forum. Geneva. Available at: http://e15initiative.org/publications/industrial-policies-in-lower-middle-income-countries/.
Guadagno F (2016). The role of industrial development banking in structural transformation. UNIDO Working Paper Series. United Nations Industrial Development Organization. Vienna.
182
Hamilton A (1791). Report on manufactures. Available at: http://www.banccentraldecatalunya.ch/wordpress/wp-content/uploads/2014/Biblioteca_Banca_Central/2014Maig/ReportOnManufactures_1791.pdf.
Hansen JD, Jensen C, and Madsen ES (2003). The establishment of the Danish windmill industry—Was it worthwhile? Review of World Economics 139(2): 324–47.
Harrison A, and Rodriguez-Clare A (2010). Trade, foreign investment, and industrial policy for developing countries. In: Handbook of Development Economics, Volume 5, Rodrik D, and Rosenzweig M, eds. North-Holland. Amsterdam: 4039–214.
Hatakenaka S, Westnes P, Gjelsvik M, and Lester RK (2006). The regional dynamics of innovation: A comparative case study of oil and gas industry development in Stavanger and Aberdeen. Paper presented at the SPRU 40th Anniversary Conference on “The Future of Science, Technology and Innovation Policy: Linking Research and Practice.” University of Sussex, Brighton, UK, September 11-13.
Hausmann R, and Rodrik D (2003). Economic development as self-discovery. Journal of Development Economics 72 (2): 603–33.
Hirschman A (1958). The Strategy of Economic Development. Yale University Press. New Haven, CT.
Hobday M (1995). Innovation in East Asia: The Challenge to Japan. Edward Elgar. Aldershot, Hants, UK.
Hobday M (2013). Learning from Asia’s success: Beyond simplistic “lesson-making.” In: Pathways to Industrialisation in the Twenty-First Century. New Challenges and Emerging Paradigms, Szirmai A, Naudé W, and Alcorta L, eds. Oxford University Press. Oxford, UK: 131–54.
Hoeren T, Guadagno F, and Wunsch-Vincent S (2015). Breakthrough technologies – Semiconductor, innovation and intellectual property. WIPO Economic Research Working Paper No. 27. World Intellectual Property Organization. Vienna.
Hou CM, and Gee S (1993). National systems supporting technical advance in industry: The case of Taiwan. In National Innovation Systems: A Comparative Analysis, Nelson RR, ed. Oxford University Press. New York: 384–413.
Howlett M (2004). Beyond good and evil in policy implementation: Instrument mixes, implementation styles and second generation theories of policy instrument choice. Policy and Society 23(2): 1–17.
Hsu CW, and Chiang HC (2001). The government strategy for the upgrading of industrial technology in Taiwan. Technovation 21(2): 123–32.
183
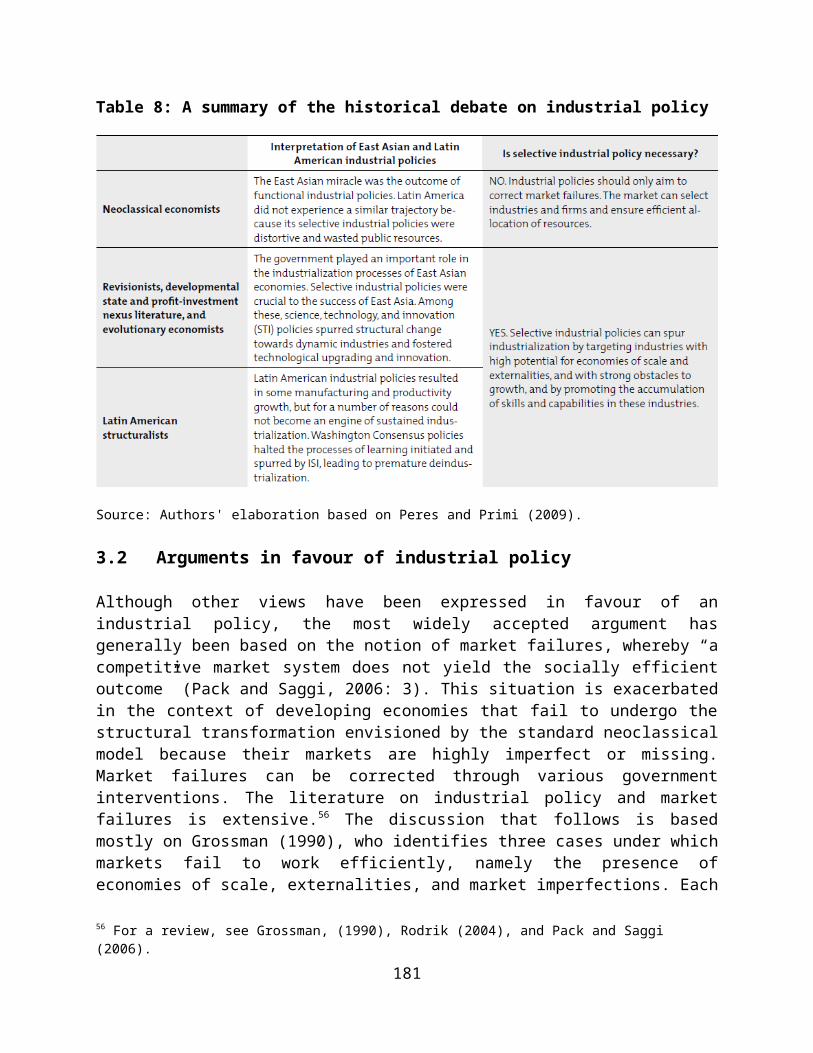
Hsu F-M, Horng D-J, and Hsueh C-C. (2009). The effect of government-sponsored R&D programmes on additionality in recipient firms in Taiwan. Technovation 29(3): 204–17.
Hu T-S, Lin C-Y, and Chang S-L (2005). Technology-based regional development strategies and the emergence of technological communities: A case study of HSIP, Taiwan. Technovation 25(4): 367–80.
Humphrey J, and Schmitz H (2002). How does insertion in global value chains affect upgrading in industrial clusters? Regional Studies 36(9): 1017–027.
Iacovone L, Ramachandran V, and Schmidt M (2014). Stunted growth: Why don’t African firms create more jobs? CGD Working Paper No. 353. Center for Global Development. Washington, DC.
Jenkins R, Peters ED, and Moreira MM (2008). The impact of China on Latin America and the Caribbean. World Development 36(2): 235–53.
Jessop B (1998). The rise of governance and the risk of failure: The case of economic development. International Social Science Journal 155(1): 29–45.
Johnson C (1982). MITI and the Japanese Miracle: The Growth of Industrial Policy, 1925–1975. Stanford University Press. Stanford, CA.
Johnson C (1987). Political institutions and economic performance: The government-business relationship in Japan, South Korea and Taiwan. In: The Political Economy of New Asian Industrialism, Deyo FC, ed. Cornell University Press. Ithaca, NY.
Kaplinsky R (2011). Commodities for industrial development: Making linkages work. UNIDO Working Paper 01/2011. United Nations Industrial Development Organization. Vienna.
Kaplinsky R, and Messner D (2008). Introduction: The impact of Asian drivers on the developing world. World Development 36(2): 197–209.
Kaplinsky R, and Morris M (2008). Do the Asian drivers undermine export-oriented industrialization in SSA? World Development 36(2): 254–73.
Katz J (1987). Technology Generation in Latin American Manufacturing Industries: Theory and Case-Studies Concerning its Nature, Magnitude and Consequences. The Macmillan Press. London.
Katz J (2000). The dynamism of technological learning during the import-substitution period and recent structural changes in the industrial sector in Argentina, Brazil, and Mexico. In: Technology, Learning and Innovation: Experiences of Newly Industrialising Economies, Kim L, and Nelson RR, eds. Cambridge University Press. Cambridge, UK: 307–34.
184
Kauffmann C (2005). Financing SMEs in Africa. Policy Insights No. 7. OECD Development Centre. Organization for Economic Cooperation and Development. Paris.
Kemp MC (1960). The Mill-Bastable infant-industry dogma. The Journal of Political Economy 68(1): 65–67.
Khan M (1996). The efficiency implications of corruption. Journal of International Development 8(5): 683–96.
Kim L (1992). National system of industrial innovation: Dynamics of capability building in Korea. In: National Innovation Systems: A Comparative Analysis, Nelson, RR, ed. Oxford University Press. New York: 357–83.
Kim L (1997). Imitation to Innovation: The Dynamics of Korea’s Technological Learning. Harvard Business School Press. Boston.
Kim, L, and Nelson, RR (2000). Technology, Learning and Innovation: Experiences of Newly Industrializing Economies. Cambridge University Press. Cambridge, UK.
King RG, and Levine R (1993a). Finance and growth Schumpeter might be right. Quarterly Journal of Economics 108(3): 717–37.
King RG, and Levine R (1993b). Finance, entrepreneurship, and growth: Theory and evidence. Journal of Monetary Economics 32: 513–42.
Korhonen P (1994). The theory of the flying geese pattern of development and its interpretations. Journal of Peace Research 31(1): 93–108.
Kosacoff B, and Ramos A (1999). The industrial policy debate. CEPAL Review 68(8): 35–60.
Kozul-Wright R, and Fortunato P (2012). International trade and carbon emissions. The European Journal of Development Research 24(4): 509–29.
Kozul-Wright R, and Rayment PBW (2007). The Resistible Rise of Market Fundamentalism: Rethinking Development Policy in an Unbalanced World. Zed Books and Third World Network. London and Penang, Malaysia.
Krueger AO (1974). The political economy of the rent-seeking society. American Economic Review 64(3): 291–03.
Krueger AO (1978). Foreign Trade Regimes and Economic Development: Liberalisation Attempts and Consequences. Ballinger. Lexington, MA.
Krueger AO (1984). Trade policies in developing countries. In: Handbook of International Economics, Volume 1, Jones RW, and Kenen P, eds. Elsevier: 519–69.
185
Krueger AO (1990a). Asian trade and growth lessons. The American Economic Review 80(2): 108–12.
Krueger AO (1990b). Government failures in development. Journal of Economic Perspectives 4(3): 9–23.
Kumar N (1996). Foreign direct investments and technology transfers in development: A perspective on recent literature. UNU-INTECH Discussion Paper Series 06. United Nations University/Institute for New Technologies. Maastricht.
Lall S (1996). Learning from the Asian Tigers: Studies in Technology and Industrial Policy. MacMillan Press. London.
Lall S (2000). FDI and development: Policy and research issues in the emerging context. Queen Elisabeth House Working Paper No. 43. Available at: http://www3.qeh.ox.ac.uk/RePEc/qeh/qehwps/qehwps43.pdf .
Lall S (2004). Reinventing industrial strategy: The role of government policy in building industrial competitiveness. Research Paper No. 28 for the Intergovernmental Group of Twenty-Four on International Monetary Affairs. United Nations Conference on Trade and Development. Geneva.
Lall S (2006). Industrial policy in developing countries: what can we learn from East Asia? In: International Handbook on Industrial Policy, Bianchi P, and Labory S, eds. Edward-Elgar. Cheltenham, UK: 79–97.
Lall S, and Albaladejo M (2004). China’s competitive performance: A threat to East Asian manufactured exports? World Development 32(9): 1441–466.
Lall S, and Narula R (2004). Foreign direct investment and its role in economic development: Do we need a new agenda? The European Journal of Development Research 16(3): 447–64. Available at: http://law.wisc.edu/gls/documents/foreign_investment3.pdf
Lall S, and Teubal M (1998). “Market-stimulating” technology policies in developing countries: A framework with examples from East Asia. World Development 26(8): 1369–385.
Lall S, and Weiss J (2005). China’s competitive threat to Latin America; An analysis for 1990–2002. Oxford Development Studies 33(2), 163–94.
Landesmann M (1992). Industrial policies and social corporatism. In: Social Corporatism: A Superior Economic System? Pekkarinen J, Pohjola MA, and Rowthorn B, eds. Clarendon Press. Oxford, UK: 242–79.
Langlois R, and Mowery DC (1996). The federal role in the development of the American computer software industry: An assessment. In: The International Computer Software Industry, Mowery DC, ed. Oxford University Press. New York.
186
Lazonick W (2008). Entrepreneurial ventures and the developmental state: Lessons from the advanced economies. UNU-WIDER Working Paper 1/2008. United Nations University/World Institute for Development Economics Research. Helsinki.
Lee K (2015). Industrial policies for upper-middle-income countries. E15Initiative. International Centre for Trade and Sustainable Development (ICTSD) and World Economic Forum. Geneva. Available at: http://e15initiative.org/publications/industrial-policies-for-upper-middle-income-countries/ .
Lee K, and Lim C (2001). Technological regimes, catching-up and leapfrogging: Findings from the Korean industries. Research Policy 30: 459–83.
Lenhardt A, Rogerson A, Guadagno F, Berliner T, Gebreeyesus M, and Bayru A (2015). One foot on the ground, one foot in the air: Ethiopia’s delivery on an ambitious development agenda. Development Progress Case Study Report.
Levin RC (1982). The semiconductor industry. In: Government and Technical Progress: A Cross-industry Analysis, Nelson RR, ed. Pergamon Press. New York: 9–100.
Lin JF (2011). From flying geese to leading dragons: New opportunities and strategies for structural transformation in developing countries. Policy Research Working Paper No. 5702. World Bank. Washington, DC.
Lin JF, and Chang HJ (2009). Should industrial policy in developing countries conform to comparative advantage or defy it? A debate between Justin Lin and Ha-Joon Chang. Development Policy Review 27(5): 483–502.
Lin JY, and Treichel V (2014). Making industrial policy work for development. In: Transforming Economies: Making Industrial Policy Work for Growth, Jobs and Development, Salazar-Xirinachs JM, Nübler I, and Kozul-Wright R, eds. International Labour Organization. Geneva: 65–78.
Lipsey RE (2002). Home and host effects of FDI. NBER Working Paper No. 9293. National Bureau of Economic Research. Cambridge, MA.
List F (1841). National System of Political Economy. Longmans, Green and Co. New York.
Little I, Scitovsky T, and Scott M (1970). Industry and Trade in Some Developing Countries. Oxford University Press. London.
Lo D, and Wu M (2014). The state and industrial policy in Chinese economic development. In: Transforming Economies: Making Industrial Policy Work for Growth, Jobs and Development, Salazar-Xirinachs JM, Nübler I, and Kozul-Wright R, eds. International Labour Organization. Geneva: 307–26.
187
Lundvall BA, and Borras S (2006). Science, technology, and innovation policy. In: The Oxford Handbook of Innovation, Fagerberg J, Mowery DC, and Nelson RR, eds. Oxford University Press. Oxford, UK: 599–631.
Mairesse J, and Mohnen P (2010). Using innovations surveys for econometric analysis. In: Handbook of the Economics of Innovation, Volume 2, Hall BH, and Rosenberg N, eds. Amsterdam: Elsevier/North-Holland: 1129–1155.
Malerba F, and Nelson RR (2012). Economic Development as a Learning Process: Variation across Sectoral Systems. Edward Elgar. Cheltenham, UK.
Mani S (2010). The flight from defence to civilian space: Evolution of the sectoral system of innovation of India’s aerospace industry. CDS Working Paper No. 428. Centre for Development Studies.
Markusen JR, and Venables AJ (1999). Foreign direct investment as a catalyst for industrial development. European Economic Review 43(2): 335–56.
Marshall A (1890). Principles of Economics. Macmillan. London.
Maskus K (2015). Research and development subsidies: A need for WTO disciplines? E15Initiative. International Centre for Trade and Sustainable Development (ICTSD) and World Economic Forum. Geneva.
Mathews JA (2002). The origins and dynamics of Taiwan’s R&D consortia. Research Policy 31(4): 633–51.
Maxfield S, and Schneider BR (eds.) (1997). Business and the state in developing countries. Cornell University Press. Ithaca, NY.
Mayer J (2003). The fallacy of composition: A review of the literature. UNCTAD Discussion Paper No. 166. United Nations Conference on Trade and Development. Geneva.
Mazzucato M (2013). The Entrepreneurial State: Debunking Public vs. Private Sector Myths. Anthem Press. London.
Mazzucato M (2015). Which industrial policy does Europe need? Intereconomics 3: 120–25.
Mazzucato M, and Penna C (2014). Beyond market failures. The market creating and shaping roles of state investment banks. SPRU Working Paper 2014-21. Science Policy Research Unit, University of Sussex, UK.
Mbayi L (2011). Linkages in Botswana’s diamond cutting and polishing industry. MMCP Discussion Paper No 6. University of Cape Town, and Milton Keynes, the Open University.
188
McDonald D, and Ruiters G (2012). Alternatives to Privatisation: Public Options for Essential Services in the Global South. Routledge. New York.
Meyanathan S (ed.) (1994). Industrial Structures and the Development of Small and Medium Enterprise Linkages: Examples from East Asia. World Bank. Washington, DC.
Meyer-Stamer J, and Wältring F (2000): Behind the Myth of the Mittelstand Economy. The Institutional Environment Supporting Small and Medium-Sized Enterprises in Germany. Institut für Entwicklung und Frieden. Duisburg.
Milberg W, and Winkler D (2013). Outsourcing Economics: Global Value Chains in Capitalist Development. Cambridge University Press. Cambridge, UK.
Milberg W, Jang X, and Gereffi G (2014). Industrial policy in the era of vertically specialized industrialization. In: Transforming Economies: Making Industrial Policy Work for Growth, Jobs and Development, Salazar-Xirinachs JM, Nübler I, and Kozul-Wright R, eds. International Labour Organization. Geneva: 151–78.
Mill J (1848). Principles of Political Economy with Some of Their Applications to Social Philosophy. George Routledge and Sons. Manchester, UK.
Milner C (2009). Constraining and enhancing policy space: The WTO and adjusting to globalisation. The Journal of International Trade and Diplomacy 3(1): 127–54.
MITI (1995) Outline of small and medium enterprises policies of the Japanese government. Japanese Small and Medium Enterprise Agency. Tokyo.
Moran TH (2011). Foreign Direct Investment and Development: Launching a Second Generation of Policy Research: Avoiding the Mistakes of the First, Reevaluating Policies for Developed and Developing Countries. Peterson Institute for International Economics. Washington, DC.
Moran TH (2015). Industrial policy as a tool of development strategy: Using FDI to upgrade and diversify the production and export base of host economies in the developing world. E15 Initiative. International Centre for Trade and Sustainable Development (ICTSD) and World Economic Forum. Geneva.
Mowery DC (2015). “Breakthrough innovations” in aircraft and the IP system, 1900-1975, WIPO Economic Research Working Paper No. 25. World Intellectual Property Organization. Geneva.
Mowery DC, and Nelson RR (1999). Sources of Industrial Leadership: Studies of Seven Industries. Cambridge University Press. Cambridge, UK.
189
Mowery DC, and Rosenberg N (1993). The U.S. national innovation system. In: National Innovation Systems: A Comparative Analysis, Nelson RR, ed. Oxford University Press. New York.
Murphy KM, Shleifer A, and Vishny RW (1989). Industrialization and the big push. Journal of Political Economy 97(5): 1003–026.
Naudé W (2010). New challenges for industrial policy. UNU-WIDER Working Paper 107. United Nations University/World Institute for Development Economics Research. Helsinki.
Nelson RR (1993). National Innovation Systems: A Comparative Analysis. Oxford University Press. New York.
Neven DJ, and Seabright P (1995). European industrial policy: The Airbus case. Economic Policy 21: 4.
Nightingale P, and Coad A (2014). Muppets and gazelles: political and methodological biases in entrepreneurship research. Industrial and Corporate Change 23(1): 113–43.
Nishiguchi T (1994). Strategic Industrial Sourcing. Oxford University Press. New York.
Niskanen WA (1971). Bureaucracy and Representative Government. Aldine-Atherton. Chicago.
Noland M, and Pack H (2002). Industrial policies and growth: Lessons from International Experience. In: Economic Growth: Sources, Trends, and Cycles, Loayza N and Soto R, eds. Central Bank of Chile. Santiago: 251–307.
Nübler I (2014). A theory of capabilities for productive transformation: Learning to catch up. In: Transforming Economies: Making Industrial Policy Work for Growth, Jobs and Development, Salazar-Xirinachs JM, Nübler I, and Kozul-Wright R, eds. International Labour Organization. Geneva: 113-149. Available at: http://www.ilo.org/wcmsp5/groups/public/---dgreports/---inst/documents/publication/wcms_315669.pdf
Nurkse R (1953). Problems of Capital Formation in Underdeveloped Countries. Oxford University Press. New York.
Ocampo JA (2011), Macroeconomy for development: Countercyclical policies and production sector transformation. CEPAL Review 104 (August).
Ocampo JA (2014). Latin American structuralism and production development strategies. In: Transforming Economies: Making Industrial Policy Work for Growth, Jobs and Development, Salazar-Xirinachs JM, Nübler I, and Kozul-Wright R, eds. International Labour Organization. Geneva: 79-111. Available at: http://www.ilo.org/wcmsp5/groups/public/---dgreports/---inst/documents/publication/wcms_315665.pdf
190

Ocampo JA, Rada C, and Taylor L (2009). Growth and Policy in Developing Countries: A Structuralist Approach. Columbia University Press. New York.
O’Connor D (1998). Rural industrial development in Vietnam and China: A study in contrasts. MOCT-MOST 8: 7–43.
OECD (2013a). Innovation in Southeast Asia. Organization for Economic Cooperation and Development. Paris.
OECD (2013b). Perspectives on Global Development 2013: Industrial Policies in a Changing World. Organization for Economic Cooperation and Development Centre. Paris.
Oi JC (1992). Fiscal reform and the economic foundations of local state corporatism in China. World Politics 45(3): 99–126.
Onis Z (1991). The logic of the developmental state. Comparative Politics 24(1): 109–26. Available at: http://www.rochelleterman.com/ComparativeExam/sites/default/files/Bibliography%20and%20Summaries/Onis%201991.pdf
Pack H, and Saggi K (2006). Is there a case for industrial policy? A critical survey. The World Bank Research Observer 21(2): 267–97.
Paus E (2014). Industrial development strategies in Costa Rica: When structural change and domestic capability accumulation diverge. In: Transforming Economies: Making Industrial Policy Work for Growth, Jobs and Development, Salazar-Xirinachs JM, Nübler I, and Kozul-Wright R, eds. International Labour Organization. Geneva: 181–211.
Peluffo P, and Giacchè V (1970). Storia del Mediocredito Centrale. Editori Laterza. Rome.
Peres W (2009). The (slow) return of industrial policy in Latin America and the Caribbean. In Industrial Policy and Development: The Political Economy of Capabilities Accumulation, Cimoli M, Dosi G, Stiglitz J, eds. Oxford University Press. New York: 175–200.
Peres W, and Primi A (2009). Theory and practice of industrial policy: Evidence from the Latin American experience. ECLAC Productive Development Series No. 187. Economic Commission for Latin America and the Caribbean. Santiago.
Perkins D, and Robbins G (2011). The contribution to local enterprise development of infrastructure for commodity extraction projects: Tanzania’s central corridor and Mozambique’s Zambezi Valley. MMCP Discussion Paper No 9. University of Cape Town, and Milton Keynes, the Open University.
Perry G (2006). Latin America and the Caribbean’s Response to the Growth of China and India: Overview of Research Findings and Policy Implications. World Bank. Washington, DC.
191
Porter ME (1990). The Competitive Advantage of Nations. Free Press. NewYork.
Portugal M (2013). O Brasil no Longo Prazo – Financiamento da infraestrutura e das empresas. Presentation at the Fórum Carta Capital, 7 May. Available at: http://www.cartacapital.com.br/economia/veja-e-baixe-as-apresentacoes-do-forum-de-economia/apresentacao-murilo-portugal-pdf
Prebisch R (1950). The economic development of Latin America and its principal problems. Reprinted in Economic Bulletin for Latin America 7(1): 1–22.
Priewe J (2015). Seven strategies for development in comparison. In: Rethinking Development Strategies after the Financial Crisis, Volume 1, Calcagno A, Dullien S, Márquez-Velázquez A, Maystre N, and Priewe J, eds. United Nations Conference on Trade and Development and Fachhochschule für Technik und Wirtschaft Berlin.
Qian Y (2000). The process of China’s market transition (1978–98): The evolutionary, historical, and comparative perspectives. Journal of Institutional and Theoretical Economics 156(1): 151–71.
Ramdoo I (2015). Industrial policies in a changing world: What prospects for low-income countries? E15 Initiative. International Centre for Trade and Sustainable Development (ICTSD) and World Economic Forum. Geneva. Available at: http://e15initiative.org/publications/industrial-policies-in-a-changing-world-what-prospects-for-low-income-countries/
Ravallion M (2010). Mashup indices of development. Policy Research Working Paper 5432. World Bank. Washington, DC.
Reich RB (1982). Making industrial policy. Foreign Affairs 60(4): 852–81.
Reiner C, and Staritz C (2013). Private sector development and industrial policy: Why, how and for whom? ÖFSE Österreichische Entwicklungspolitik. Vienna: 53–61.
Robinson M, and White G (eds.) (1998). The Democratic Developmental State: Political and Institutional Design. Oxford Studies in Democratization. Oxford University Press. Oxford, UK.
Rodrik D (2004). Industrial policy for the twenty-first century. CEPR Discussion Paper 4767. Centre for Economic Policy Research. London.
Rodrik D (2008). Normalizing industrial policy. Commission on Growth and Development Working Paper No. 3. World Bank. Washington, DC.
Rodrik D, and Subramanian A (2005). From “Hindu growth” to productivity surge: The mystery of the Indian growth transition. IMF Working Paper 04/77. International Monetary Fund. Washington, DC.
192

Roll M (ed.) (2014). The Politics of Public Sector Performance: Pockets of Effectiveness in Developing Countries. Routledge. London.
Rosenstein-Rodan P (1943). Problems of industrialisation of Eastern and South-eastern Europe. Economic Journal 53: 202–11.
Sachs JD, McArthur JW, Schmidt-Traub G, Kruk M, Bahadur C, Faye M, and McCord G (2004). Ending Africa’s poverty trap. Brookings Papers on Economic Activity 1: 117–216.
Salazar-Xirinachs JM, Nübler I, and Kozul-Wright R (eds.) (2014). Industrial Policy, Productive Transformation and Jobs: Theory, History and Practice. International Labour Organization and United Nations Conference on Trade and Development. Geneva.
Sanderson H, and Forsythe M (2013). China’s Superbank: Debt, Oil and Influence: How China Development Bank Is Rewriting the Rules of Finance. Bloomberg Press. Hoboken, NJ.
Schneider BR (1999). The desarrollista state in Brazil and Mexico. In: The Developmental State, Woo-Cummings, M, ed. Cornell University Press. Ithaca, NY.
Schneider BR (2013). Institutions for effective business-government collaboration: Micro mechanisms and macro politics in Latin America. IDB Working Paper No. 418. Inter-American Development Bank. Washington, DC.
Schneider BR (2015). Designing Industrial Policy in Latin America: Business-State Relations and the New Developmentalism. Palgrave Macmillan. New York.
Schneider BR, and Maxfield S (1997). Business, the state, and economic performance in developing countries. In: Business and the State in Developing Countries, Maxfield S, and Schneider BR, eds. Cornell University Press. Ithaca, NY.
Schumpeter JA (1942). Capitalism, Socialism, and Democracy. Harper & Brothers. New York and London.
Shafaeddin SM (2000). What Did Frederick List Actually Say? Some Clarifications on the Infant Industry Argument. United Nations Conference on Trade and Development. Geneva.
Shapiro H (2007). Industrial policy and growth. UN-DESA Working Paper No. 53. United Nations Department of Economic and Social Affairs. New York.
Shirley M (1999). Bureaucrats in business: The roles of privatisations versus corporatization in state-owned enterprise reform. World Development 27(1): 115–36.
Shleifer A (1998). State versus private ownership. Journal of Economic Perspectives 12(4): 133–50.
193
Shleifer A, and Vishny RW (1994). Politicians and firms. Quarterly Journal of Economics 109(4): 995–1025.
Soete L (2007). From industrial to innovation policy. Journal of Industry, Competition and Trade 7(3-4): 273–84.
Sohal AS, and Ferme B (1996). An analysis of the South Korean automotive, shipbuilding and steel industries. Benchmarking: An International Journal 3(2): 15–30.
Stiglitz JE (1994). The role of the state in financial markets. In: Proceedings of the World Bank Conference on Development Economics, Bruno M, and Pleskovic B, eds. World Bank. Washington, DC.
Storey DJ (1994). Understanding the Small Business Sector. Routledge. London.Studwell J (2014). How Asia Works: Success and Failure in the World’s Most Dynamic Region. Grove Press. New York.
Szirmai A, Gebreeyesus M, Guadagno F, and Verspagen B (2013). Promoting productive employment in Sub-Saharan Africa: A review of the literature. UNU-MERIT Working Paper 2013-062. United Nations University/ Maastricht Economic and Social Research Institute.
Taylor I (2008). New labour and the enabling state. Health and Social Care in the Community 8(6): 372–79.
Thun E (2006). Changing lanes in China: Foreign direct investment, local government, and auto sector development. Cambridge University Press, Cambridge.
Torvik R (2009). Why do some resource-abundant countries succeed while others do not? Oxford Review of Economic Policy 25(2): 241–56.
Ulltveit-Moe K (2008). Live and let die: Industrial policy in a globalized world. Sweden’s Globalization Council Expert Report 22. Ministry of Education and Research. Stockholm
UNCTAD (1994). Trade and Development Report 1994. United Nations. Geneva and New York.
UNCTAD (1995). World Investment Report 1995: Transnational Corporations and Competitiveness. United Nations. Geneva and New York.
UNCTAD (1996). Trade and Development Report 1996. United Nations. Geneva and New York.
UNCTAD (1997). Trade and Development Report 1997. United Nations. Geneva and New York.
UNCTAD (1999). World Investment Report 1999: Foreign Direct Investment and the Challenge of Development. United Nations. Geneva and New York.
194
UNCTAD (2000). World Investment Report 2000: Crossborder Mergers and Acquisitions and Development. United Nations. Geneva and New York.
UNCTAD (2001). Growing micro and small enterprises in LDCs: The “missing middle” in LDCs: Why micro and small enterprises are not growing? Enterprise Development Series UNCTAD/ITE/TEB/5/. United Nations Conference on Trade and Development. Geneva.
UNCTAD (2002). Trade and Development Report 2002: Global Trends and Prospects, Developing Countries in World Trade. United Nations. Geneva and New York.
UNCTAD (2003). Trade and Development Report 2003: Capital Accumulation, Growth, and Structural Change. United Nations. Geneva and New York.
UNCTAD (2005a). Economic Development in Africa Report 2005. Rethinking the Role of Foreign Direct Investment. United Nations. Geneva and New York.
UNCTAD (2005b). Trade and Development Report 2005: New Features of Global Interdependence. United Nations. Geneva and New York.
UNCTAD (2006a). Least Developed Countries Report 2006: Developing Productive Capacities. United Nations, New York and Geneva.
UNCTAD (2006b). World Investment Report 2006: FDI from Developing and Transition Economies: Implications for Development. United Nations. New York and Geneva.
UNCTAD (2006c). Trade and Development Report 2006: Global Partnership and National Policies for Development. United Nations. Geneva and New York.
UNCTAD (2006d). A case study of the salmon industry in Chile. United Nations. New York and Geneva.
UNCTAD (2007a). Trade and Development Report 2007: Regional Cooperation for Development. United Nations. Geneva and New York.
UNCTAD (2007b). Economic Development in Africa Report 2007. Reclaiming Policy Space: Domestic Resource Mobilization and Developmental States. United Nations. Geneva and New York.
UNCTAD (2007c). Least Developed Countries Report 2007: Knowledge, Technological Learning and Innovation for Development. United Nations. Geneva and New York.
UNCTAD (2009). Least Developed Countries Report 2009: The State and Development Governance. United Nations. Geneva and New York.
UNCTAD (2011a). Trade and Development Report 2011: Post-crisis Policy Challenges in the World Economy. United Nations. Geneva and New York.
195
UNCTAD (2011b). Development-led globalization: Towards sustainable and inclusive development paths. Report of the Secretary-General of UNCTAD to UNCTAD XIII. Document UNCTAD (XIII)/1. United Nations. New York and Geneva.
UNCTAD (2011c). World Investment Report 2011: Non-Equity Modes of International Production and Development. United Nations. New York and Geneva.
UNCTAD (2011d). Least Developed Countries Report 2011: The Potential Role of South-South Cooperation for Inclusive and Sustainable Development. United Nations. Geneva and New York.
UNCTAD (2012). Trade and Development Report 2012: Policies for Inclusive and Balanced Growth. United Nations. Geneva and New York.
UNCTAD (2013a). Trade and Development Report 2013: Adjusting to the Changing Dynamics of the World Economy. United Nations. Geneva and New York.
UNCTAD (2013b). World Investment Report 2013: Global Value Chains: Investment and Trade for Development. United Nations. Geneva and New York.
UNCTAD (2014a). Trade and Development Report 2014: Global Governance and Policy Space for Development. United Nations. Geneva and New York.
UNCTAD (2014b). Economic Development in Africa Report 2014: Catalysing Investment for Transformative Growth in Africa. United Nations. Geneva and New York.
UNCTAD (2015a). Least Developed Countries Report 2015: Transforming Rural Economies. United Nations. Geneva and New York.
UNCTAD (2015b). Technology and Innovation Report 2015. Fostering Innovation Policies for Industrial Development. United Nations. Geneva and New York.
UNCTAD (2015c). Trade and Development Report 2015: Making the International Financial Architecture Work for Development. United Nations. Geneva and New York.
UNCTAD (2015d). Global Value Chains and South-South Trade: Economic Cooperation and Integration among Developing Countries. United Nations. Geneva and New York.
UNCTAD and UNIDO (2011). Economic Development in Africa Report 2011: Fostering Industrial Development in Africa in the New Global Environment. United Nations. Geneva and New York.
UNIDO (2013). Industrial Development Report 2013: Sustaining Employment Growth: The Role of Manufacturing and Structural Change. United Nations. Geneva and New York.
196
Vartiainen J (1999). The economics of successful state intervention in industrial transformation.In: The Developmental State, Woo-Cummings M, ed. Cornell University Press. Ithaca, NY.
Vrolijk K (Forthcoming). Essay on technology: Second order constraints in underdeveloped economies. PhD thesis. School of Oriental and African Studies, University of London.
Wade R (1990). Governing the Market. Economic Theory and the Role of Government in East Asian Industrialisation. Princeton University Press. Princeton, NJ.
Wade R (2010). After the crisis: industrial policy and the developmental state in low income countries. Global Policy 1(2):150–61.
Wade R (2014). The mystery of U.S. industrial policy: The developmental state in disguise. In: Transforming Economies: Making Industrial Policy Work for Growth, Jobs and Development, Salazar-Xirinachs JM, Nübler I, and Kozul-Wright R, eds. International Labour Organization and United Nations Conference on Trade and Development. Geneva: 379–400.
Wade R (2015). The role of industrial policy in developing countries. In: Rethinking Development Strategies after the Financial Crisis, Volume 2, Calcagno A, Dullien S, Márquez-Velázquez A, Maystre N, and Priewe J, eds. United Nations Conference on Trade and Development and Fachhochschule für Technik und Wirtschaft. Berlin.
Warwick K (2013). Beyond industrial policy: Emerging issues and new trends. OECD Science, Technology and Industry Policy Paper No. 2. Organization for Economic Cooperation and Development. Paris.
Weiss J (2013). Industrial policy in the twenty-first century: Challenges for the future. In: Pathways to Industrialisation in the Twenty-First Century, New Challenges and Emerging Paradigms, Szirmai A, Naudé W, and Alcorta L, eds. Oxford University Press. Oxford, UK: 393–412.
Weiss J (2015). Taxonomy of industrial policy. UNIDO Inclusive and Sustainable Industrial Development Working Paper No. 08/2015. United Nations Industrial Development Organization. Vienna.
Weiss L (1988). Creating Capitalism: The State and Small Business since 1945. Blackwell. Oxford, UK.
Weiss L (1998). The Myth of the Powerless State: Governing the Economy in the Global Era. Polity Press. Cambridge, UK.
Williamson J (1990). What Washington means by policy reforms. In: Latin American Adjustment: How Much Has Happened? Williamson J, ed. Institute for International Economics. Washington, DC.
197
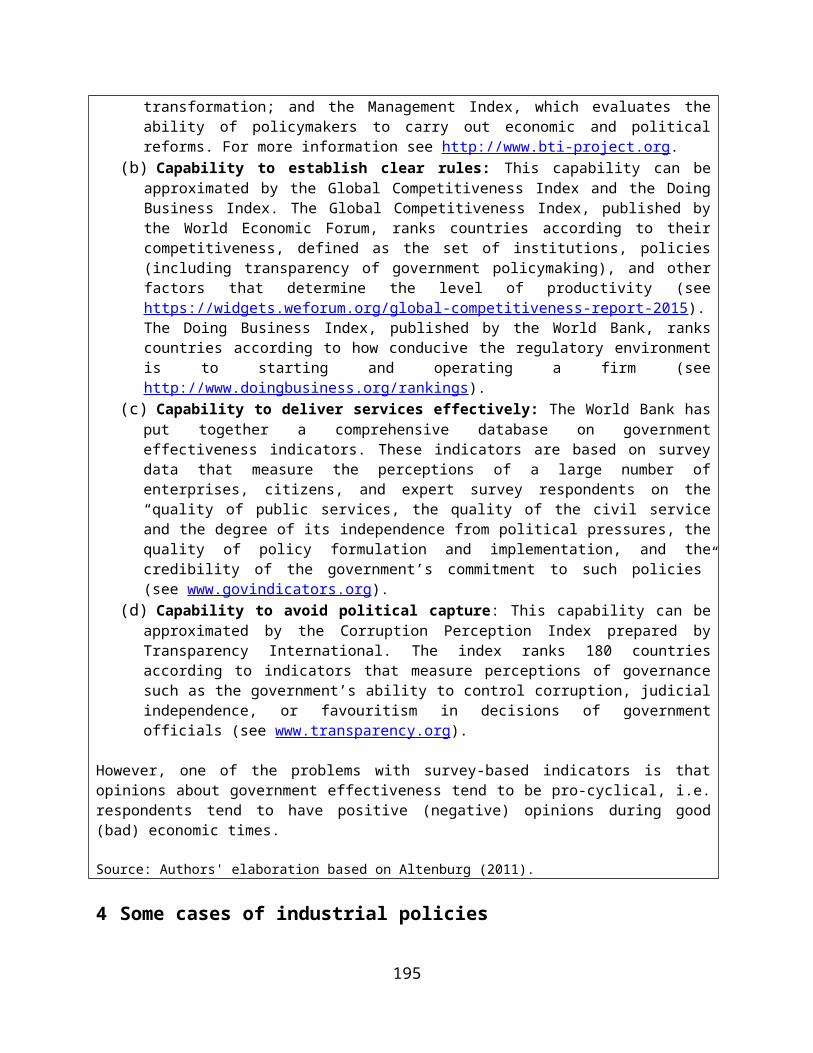
Williamson OE (1981). The economics of organization: The transaction cost approach. American Journal of Sociology 87(3): 548–77.
WIPO (2015). World Intellectual Property Report: Breakthrough Innovation and Economic Growth. World Intellectual Property Organization. Geneva.
Wolf C (1988). Markets or Governments: Choosing between Imperfect Alternatives. MIT Press. Cambridge, MA.
Womack, JP, Jones DT, and Roos D (1990). The Machine that Changed the World. Rawson Associates. New York.
Woo-Cumings M (ed.) (1999). The Developmental State. Cornell University Press. Ithaca, NY.
World Bank (1987). World Development Report 1987. Oxford University Press. New York.
World Bank (1993). The East Asian Miracle: Economic Growth and Public Policy. Oxford University Press. New York.
World Bank (1995). Bureaucrats in Business: The Economics and Politics of Government Ownership. Oxford University Press. Oxford, UK.
World Bank (2015). SME finance in Ethiopia: Addressing the missing middle challenge. Working Paper 94365. World Bank. Washington, DC: Available at: http://documents.worldbank.org/curated/en/2015/02/24011867/sme-finance-ethiopia-addressing-missing-middle-challenge.
World Bank (n.d.). Investment generation toolkit, Module 1. Available at: https://www.wbginvestmentclimate.org/toolkits/.
Zamagni S, and Zamagni V (2010). Cooperative Enterprise: Facing the Challenge of Globalization. Edward Elgar. Cheltenham, UK.
Zúñiga-Vicente J, Alonso-Borrego C, Forcadell F, and Galán J (2014). Assessing the effect of public subsidies on firm R&D investment: A survey. Journal of Economic Surveys 28(1): 36–67.
198