Embed Size (px)
Citation preview

by Akuma99 | www.beginnertrader.com1
Not So Squeezy
Not so squeezyNot so squeezyNot so squeezyNot so squeezyThe markets are not a gathering of lines and arrows, it is a gathering of emotional people feeding of each other.
Let’s look at discovering the emotion of the markets.
BY AKUMA99
Using the Bollinger Squeeze to time your entry in today's
markets is one thing, but how do you know the direction in
those quiet times, let's have at how I use some indicators to
help?
Background
Before I get into what I do to try to take advantage of the
insight into market timing that the Bollinger Squeeze
indicator can provide, first I thought it best to explain where
this system came from in the first place.
When first trading the Forex markets, I did so with very little
indicators, as, not coming from a mathematical, economical
or trading background, the different coloured lines,
histograms and arrows meant very little to me. I spent the
first six months trading, what I learnt later was to be called,
“naked”, i.e. without indicators. During these first six
months I was at times disheartened, discouraging and
disillusioned as I had nothing to put the blame on, no
indicator to tweak thinking it was it's fault, but in hindsight
it was the best thing I could have done to get started on the
right foot.
What this did, was made sure, that I added indicators to aid
me in identifying the different components of the market
that I was trying to interpret through price action alone,
rather than add indicators for the sake of adding indicators.
Each indicator in this system is there to help to quickly
identify a market component in an easy, visually pleasing
way. I make no apologies for the fact the charts that come
with this system, are colourful and elaborate, they are this
way to make it easy on the eye, and more inviting for the
brain to process.
“To view a chart as just a series of lines and colours is to not recognize what underlies all the marketplaces
in the world ... “
The Market Is Alive
Anyone who has watched Big Brother, one, has little taste
in television :), and two, will understand what it feels like to
be on the outside looking in. The charts we look at every day

by Akuma99 | www.beginnertrader.com2
Not So Squeezy
is essentially a small window into the large universe that is
the economic market place.
To view a chart as just a series of lines and colours is to not
recognize what underlies all the marketplaces in the world is
one thing, people.
From shopping markets to economic markets, it is still the
same thing, people exchanging one item they have for
another item another person has. Without this, a
marketplace does not exist.
Anyone who is in a relationship will understand that a person
can be an emotional being; fear, anger, elation, depression,
sadness, they are all what make us uniquely us. It is because
of this that I view reading emotion to be a vital component
of trading successfully. If you can get a sense of the emotion
of the market, then you can devise an appropriate trading
strategy to take advantage of that emotion.
There is no better time to ask my wife to watch a football
game than when I can read that she is happy, predictable
and calm. I take the same techniques I use to read my wife's
mood into the marketplace, if my system is going to hold it's
own, it needs to be able to tell me what the market mood is,
what it’s excitement level is, and what it is thinking.
“The trend can be your friend ... if your friend is the trend ...”
So with this on board, there are three things I look at to
determine the mood of the market; Trend, Acceleration and
Volatility. Let's look at these one at a time.
Market Mood: Trending or Ranging
If you have trader for longer than five minutes, chances are
you have heard the phrase “The trend is your friend”. If you
have traded longer than 5 weeks, you are more than likely
sick and tired of hearing that exact same phrase.
It is a phrase however that has a sound financial basis, and
should be noted, however I think should be expanded
slightly to; “The trend is your friend ... if your friend is the
trend”.
What I mean but that is the trend is only your friend, if the
trading system you employ is set-up to take advantage of
these trends. A trend useless to you if your method is looking
changes of emotion in the market. Some examples of this are
breakout strategies, price exhaustion strategies and reversal
trading.
A strong trend is like a strong current in the ocean, it is
something that should not be swum against, as all you will
do is tire yourself physically, emotionally and mentally, so
that you will be to exhausted to take advantage of things
when the current subsides, or changes.
If a current (trend) is weak however, you may be able to get
a head start on the other swimmers, if the target (shore) is
near. A calm ocean, with no current, i.e. a market with no
trend, should be the easiest swimming conditions of them all,
yet continually many flounder under those conditions as they
try to swim with a current that is no longer there. These
three trending conditions need to be identified, and the
trading strategy adjusted accordingly.
I may have lost some with the whole ocean analogy but the
point is, how the market is feeling needs to be identified. If
the market is comfortable, happy and emotionless this is
when you will see consistent trending conditions where
straight trend lines and fibonacci levels are honoured.
If the market is moody, depressed or angry, this is where you
will see ranging, whipsaw action that will leave traders still
trying to trade a trend (swim with a current that isn’t there)
beating their heads against a wall wondering why their
system is broken. It isn’t broken of course, the market just
isn’t in the mood for a trending system. It is out of energy,
frustrated and indecisive, best to just tread lightly and let the
market rest.

by Akuma99 | www.beginnertrader.com3
Not So Squeezy
Market Excitement: Acceleration
Most of the time, this would be the area that we talk about
Momentum rather than Acceleration. Momentum is
something that is mentioned in most trading systems.
However the scientific definition of momentum is “The mass
of an object multiplied by it's velocity”. For me this doesn’t
really fit in a trading context, especially in the currency
market as the mass of the market, i.e how many traders are
on board, can’t really be measured due to the lack of
accurate volume information.
Instead, I would suggest we are not looking at momentum
at all, but rather Acceleration, which is defined as “the rate
of change of velocity of an object with respect to time”. The
object of course is price, and price can certainly be measure
against time in the trading environment. The quicker price
moves up or down, the great the acceleration of price, it is
perhaps a small thing, but it can help to know what we are
really looking at.
Acceleration is a sign of the excitement levels of the market.
Think of a 5 year old, tell that 5 year old that over on the
desk is a piece of broccoli, can they please go over and eat
it. What do you think that child would do (after the tantrum)?
Most likely walk slowly at best, there is no reason to rush as
there is nothing exciting to be found.
Tell that same child that their is a bag of lollies however, and
most likely they would be in a full sprint before you can finish
the sentence, why? Because they are excited of course, is so
the speed they travel to their destination is quicker.
An accelerating market is the same, it is buzzing with
excitement, something is going to happen, or has happened
that has excited the market so much that price is racing
along at breakneck speed. If this happens out of a period of
congestion, we may be seeing the start of a new trend, if we
are at the end of a prolonged trend, we need to be wary this
could be the last exhaustive run before the market collapses
in a heap and sleeps, lollies in hand.
Market Thinking: Volatility
Volatility is something that can easily be overlooked as a
random phenomenon in trading, however it is the core of this
system and I think something you overlook at your own peril.
I always bring up this example when explaining volatility that
helped convince me that it is something worth including.
Think about a time when there was an important decision to
be made in your life, be it marriage, children, choice of high
school subjects, girlfriend, prom date, etc. etc. What do you
do before making that decision?, my guess would be you
“stop and think”. If something is viewed as being important,
you usually don't want to rush in and make a decision on that
issue until you are sure you have all the facts.
It is no different in trading, you see it almost every week, a
period of relative quiet, before an explosive move in a
particular direction. For those that follow fundamentals, this
is almost always seen in the day(s) leading up to a major
economic news announcement, such as inflation figures and
interest rate announcements, but is also seen at other times,
where there doesn't seem to be any other reason other than
the market is resting, or stopping to think.
For the technically minded you will see this phenomenon on
an intra day basis around important support and resistance
areas, such as round numbers, trend lines and pivots, and
quite often form the well known technical patterns of double
tops and bottoms, head and shoulder formations, triangles
and changes in polarity.
“The quiet before the storm has never held truer than in the trading
environment.”
Summary
So that's it, we want a system to be able to tell us what mood
the market is is, if it is excited or depressed and what it is
thinking. The market is a moody beast that is impossible to
tame in truth, but knowing it's mood will get you trading a
market during the least dangerous times, when the odds are
stacked in your favour to come out the other side relatively
unscathed.
The following pages will list some indicators the “Not So
Squeezy” method uses and why they are used, it is not a
hard and fast rule that you have to use each indicator
suggested, you may find a different indicator serves you
better, but remember what the indicator is measuring in the
first place.

by Akuma99 | www.beginnertrader.com4
Not So Squeezy
Indicator 1: Bollinger Squeeze
Settings: 20,2,20,1.5
Download: -
Measures: Volatility
I won't go into the nuts and bolts of what the Bollinger
Bands are here, if you really want to know, the best place
to look is http://www.bollingerbands.com where you will
find a great explanation on where they originated from. The
main thing to realize is that Bollinger Bands provide a
relative definition of high and low, and they can be used to
measure the relative volatility of an instrument.
The Bollinger Squeeze indicator is a combination of the
Bollinger Bands, and another envelope indicator called the
Keltner channels (more information can be found here).
The premise is, when market activity quietens enough for
the Bollinger Bands to move inside the Keltner channels,
the time is ripe a big move.
This is the scenario I mentioned early, when I talked about
big decisions and the tendency for people to “stop and
think”. It is a sign that something major is on the horizon,
whether it be through a news release, approaching major
support or resistance levels, or at times more commonly,
simply a change in market sentiment.
Have a look at Illustration 1 above, on the main chart
are the Bollinger Bands and Keltner channels on a chart
together. You can see the yellow highlighted areas are
where the Bollinger Bands have moved inside the Keltner
channels, and a subsequent move has followed.
Below the main chart is a version of the Bollinger Squeeze
indicator that is most commonly seen around the trading
world. In this chart, the blue dots correspond to when the
Bollinger Bands are inside the Keltner Channels, where the
red dots are when the Bollinger Bands are outside the
Keltner Channels.
Now you may think I have done the usual authoring thing,
and carefully chosen an appropriate chart from some time
in history to demonstrate my point, but this is an extremely
common looking chart, I could have chosen any of the
majors and showed you a chart that looked very similar.
Pull up any chart you wish you will see the same patterns
just about every day, go on try it :)
Illustration 1: Bollinger Bands with Keltner Channels

by Akuma99 | www.beginnertrader.com5
Not So Squeezy
I have previously testing this on things like the NASDAQ,
SP500, Gold and various other commodity charts, and the
patterns are the same. As a demonstration, Illustration 2
is the SP500 chart as I write this manual, marked in yellow
are areas where moves were predicted.
Why are they the same in all markets?, because the
squeeze is a measure of emotion, of when people have
“stopped to think” and all markets are driven by the
ultimate in emotional beings, us.
The Bollinger Squeeze is far from a new concept, indeed it is
as old as the Bollinger Bands themselves, combining them
with the Keltner channels is a slightly newer concept, but
again not something that isn't widely used, we are not trying
to break new ground, we are just trying to find something
that will tell us when the market has stopped to think, and I
have found nothing better.
Now before you all go off excitedly, there is one major flaw
in the Bollinger Squeeze, Keltner Channel method, while it
provides excellent timing, it doesn’t indicate the most
important factor, that being direction. Times when volatility
is so low give little to indicate which way the market will go.
The reason why is the very reason the squeeze is in place
in the first place. It is because everyone has stopped to
think, as they try to figure out which way the next strong
push should go. The decision may be that change needs to
be made, or it may be that things were fine the way they
were, it is something we will explore a little later.
Illustration 2: Bollinger Bands with Keltner Channels on the SP500

by Akuma99 | www.beginnertrader.com6
Not So Squeezy
Indicator 2: Rainbow Multiple Moving
Average (RMMA)
Settings: N/A
Measures: Trending vs Ranging conditions
The next indicator used is something I call the Rainbow
Multiple Moving Average (RMMA). It is, essentially not really
an indicator in the traditional sense, it is actually just eighty
eight Exponential Moving Averages (EMA's), all on the same
chart coloured like a rainbow, hence the name.
An Australian stock trader named Daryl Guppy introduced a
now very popular method of trading called the Guppy
Multiple Moving Average (GMMA) technique, and with this
introduced the concept of using the appearance of these
moving averages, and how they are spread, compressed or
overlapping to measure the long and short term sentiment
of the market, the speculators and the investors as he
called them. His book “Trend Trading”, goes into this
further and is well worth a read.
I use the same concepts from the GMMA to trade the RMMA,
I only use the RMMA to make my charts look more pleasing
to the eye. I make no apologies for this, if I am going to stare
at a chart for a couple of hours, it might as well be pleasing
to the eye.
The basic idea of the RMMA is to identify if there is a trend,
and if so, in what direction and how strong. Those that
consider themselves as trend traders, do so on the idea
that they should only be wrong once, i.e. when the trend
changes, so if a trend can be identified, or lack there-of,
then an appropriate trading plan can be put in place.
Have a look at Illustration 3 above, this is the same
EURUSD chart from Illustration 1, this time with the RMMA.
You can see that the slope of the RMMA tells us the
direction, in this case an uptrend. How spread out the
averages are from each other tells us if the trend has some
strength to it, and areas where the averages compress, fold
over or get jumbled together indicate a possible weakening
trend, or upcoming ranging conditions.
The RMMA is a clear visual indication of the trend.
Illustration 3: The Rainbow Multiple Moving Averages (RMMA)

by Akuma99 | www.beginnertrader.com7
Not So Squeezy
Indicator 3: Simple Moving Average (SMA)
Settings: 100SMA and 200SMA on Close
Measures: Support, Resistance and Barriers
Moving averages are very commonly seen in most systems,
usually either as an indication of trend, or used as an entry
signal when one moving average crosses over another. The
RMMA above of course takes this to the extreme, using 88
different averages to paint a picture of the trend, however
using moving averages as crossover entry signals alone has
been proven time and time again to be slow and clumsy,
especially in ranging conditions.
Another use however is to use these averages as dynamic
support and resistance areas. You may be familiar with
straight line trend lines acting as support and resistance
areas, but Moving Averages work just as well, if not better
sometimes.
Illustration 4 is an example of the different picture you
get when using a moving average as your trend line for
support, resistance and target setting, rather than the
traditional straight trend line (which has it’s own merit mind
you). A case in point is area C, where it appears we have a
trend line break, and could very well have triggered a short
trade, expecting a trend reversal. If however, you knew
there was the 200SMA below offering another area of
support, you may have waited for a close below that before
entering short. Of course you can see what happened when
it hit the 200SMA.
Areas A and B are examples of the 100SMA acting as a
support area, and in this case, they corresponded to a
signal or two from the Bollinger Squeeze indicator. For
those wanting to trade against the trend, these longer term
SMA’s can act as a nice guide to profit taking areas also, as
shown below on the 10th of May, where a Squeeze signal
trigger a sharp drop. Hindsight is the clearest sight of all of
course, but the 100SMA might have been a nice area to
close half a position, with the 200SMA the final target.
Just a quick note as to why the 100SMA and 200SMA, these
are used purely because they are used by others. They are
watched in most analyst reports you find on the net, and so
get quite a following. If you know what everyone is
watching, then you know the areas that may be defended.
Illustration 4: Traditional trend lines vs Moving Averages trend lines.

by Akuma99 | www.beginnertrader.com8
Not So Squeezy
Indicator 4: Bollinger Bands
Settings: 20,2,Close
Measures: Overbought, oversold conditions
It may seem odd that we are essentially, using the Bollinger
Bands twice in the system, once with the Keltner Channels
to define the squeeze and again here. However they have
two distinct uses.
Anyone who has used oscillators know the concept of
overbought and oversold conditions. Oscillators attempt to
tell us when price is relatively oversold or overbought
compared to recent history. Once these conditions are met,
then we are taught to look for a reversal in price.
It is my view however, and the view of other well known
traders, that these signals are no better than a 50/50 bet,
through back testing has proven this time and time again.
Like I read the other day, even a broken clock is right twice
a day. All is not lost however with this mode of trading, it is
acknowledged that oscillators work better in ranging
conditions, and they also work better if you only take the
signals in relation to the trend, for example only trade
oversold signals in an up trend.
We can tell when the market is in ranging conditions
through our use of the RMMA as mentioned earlier, but I
have found oscillators struggle to provide overbought
signals in a strong down trend, and oversold signals in a
strong up trending market.
So instead I like to use the Bollinger Bands, overlayed
directly onto price to find those overbought and oversold
areas. Illustration 5 shows the correlation between the
Bollinger Bands and a default Stochastic Oscillator. At times
they give you a little extra, such as on the 9th of May below
where the Stochastic is showing oversold conditions but we
are not at the upper Bollinger Band.
Once the trend direction is established via the RMMA, we
can look for signs of reversals at the appropriate Bollinger
Band, if the trend is up, we look for long triggers at the
bottom Bollinger Band and vise versa. If the market is
ranging, or directionless, we can think about trading both
sides of the Bollinger Bands until a sign of a trend is
evident.
Illustration 5: Using the Bollinger Bands to show overbought and oversold areas.

by Akuma99 | www.beginnertrader.com9
Not So Squeezy
Putting it All Together
Now that we know all the components, let’s put them all
together on the one chart and see what we can find out.
Illustration 6 shows the same charts as before, but with
all the indicators together.
I have marked all the different components that make up
the Not So Squeezy trading system, remember there is a
reason for each indicator on this chart, see if you can
remember what component of the market each is
attempting to measure.
It so happened that while writing the manual, the market
happened to be in a nice up trend, you can see through the
separation of the rainbow how easy this is to see, the
longer term moving averages (in purple) are clearly sloping
up and well separated, as are the middle averages in red,
showing the underlying strength of the trend. This is a
classic example of a current not worth swimming against.
There are four clear trading opportunities in the above
chart, all of which would have turned a nice little profit with
some very basic money management rules. See if you can
find them, look for trending conditions, oversold areas and
areas where the market has stopped to think and you will
find all four opportunities.
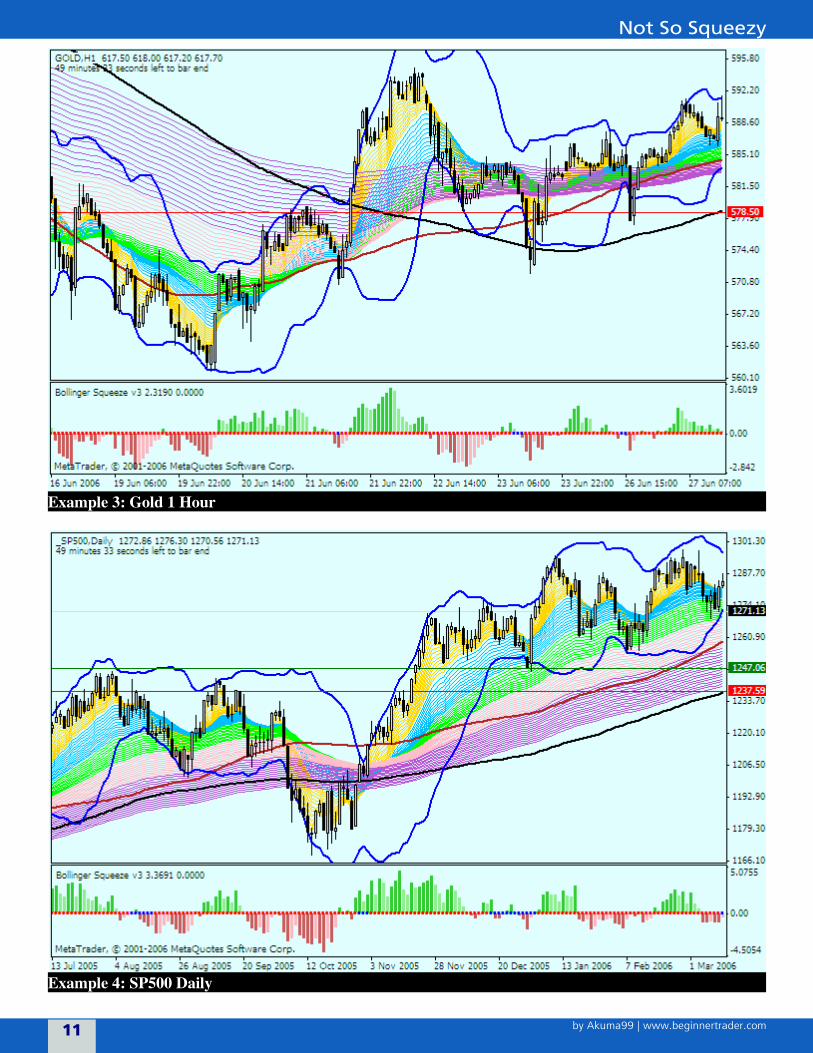
The following pages contain various charts of different
markets and time frames and conditions, see if you can find
the trading opportunities in these charts. At the end of the
document are the same charts with what I consider to be
good trades, importantly this does not mean they are
always successful trades, but rather trades that have sound
logic behind them.
Some may want to take these principals and extend them
to different trading conditions, such as counter-trend
trading for example. I have one condition if this is done, let
me know because it is doing my head in! :)
A link to where you can find the indicators for this system
for Metatrader 4 (http://www.metaquotes.net) is at the
end of this document.
Illustration 6: Putting it all together, the Not So Squeezy method.

by Akuma99 | www.beginnertrader.com10
Not So Squeezy
Example 1: EUR/USD 1 Hour
Example 2: CFD: IBM 1 Hour
by Akuma99 | www.beginnertrader.com11
Not So Squeezy
Example 3: Gold 1 Hour
Example 4: SP500 Daily
by Akuma99 | www.beginnertrader.com12
Not So Squeezy
Example 5: USD/JPY 15 Minute
Example 6: EUR/JPY 4 Hour

by Akuma99 | www.beginnertrader.com13
Not So Squeezy
Triggers / Entries
Now that we have the framework for knowing when a good
trade is approaching, how do we know when to pull the
trigger. When do we enter a trade long or short, what gives
us the reason to push that buy or sell button?
Hindsight is a wonderful thing, and looking at historical
charts, such as the those on the previous few pages, is a
great way to help your brain process the various repeatable
patterns that form each day in the marketplace. However
what it also does is trick you into thinking you will be able
to spot those turning points in real time, when trading off
the right edge of the screen instead of from the middle,
and it isn’t until live trading that you realise, just like a
sporting event, that things look much different live.
Unless you have an established criteria for actually pulling
the trigger, the pressure of time will become to great and
you will make hasty trading decisions that, on balance will
most likely prove disastrous.
There are many different ways of identifying when to enter
and exit a trade, and the Not So Squeezy framework can let
you know when the time is approaching to enter a trade,
but we need to know when to actually hit that magic
button. I will put forward a couple of techniques that I have
used with this system, but really the trigger you choose
should be the one you are most comfortable with.
Trigger Type 1: 50CCI
The Commodity Channel Index (CCI) indicator is probably
made famous most by a chap named Woodie, who trades
without any price bars, using only a combination of three
different CCI indicators (http://
www.woodiescciclub.com).
In essence the CCI is simply a representation of price in
relation to the moving average specified in the CCI settings.
A cross of the zero line corresponds to price crossing the
50EMA, a move to the 200 line show price has burst away
from the moving average a long way and is perhaps due for
a correction. I would recommend having a look at woodies
site and others for all the different trigger types.
Illustration 7 again is the same chart from before, this
time with the 50CCI shown and triggers labelled. You can
Illustration 7: Using a 50 CCI trigger

by Akuma99 | www.beginnertrader.com14
Not So Squeezy
see where the triggers and moves correspond. The 50CCI
can provide some reliable signals, however in a fast moving
market, it can lag behind price a fair way such as the zero
line cross at the end of the below chart.
If you want an indicator to tell you when to pull the trigger,
the CCI can be a handy tool. Whether you use the 50CCI or
another setting is up to you, Woodie uses a 14 and a 6 I
believe, so see which one gives you the best results.
Trigger Type 2: Candlestick Formations
The most basic of triggers, and perhaps the most reliable
when learnt properly is price itself. In recent times the most
popular way to read price action is through candlestick
charts.
Candlesticks charts are essentially no different to traditional
bar charts, other than the fact that each period of time is
shown in a different, easier to read format. No new
information is presented through a candlestick chart, but
the idea is that it is quicker and easier to read that
information. From my experience I cannot argue against
that idea.
There are a multitude of different candlestick formations
out there that are supposed to give a bullish or bearish
signal when completed. A nice basic rundown of
candlesticks can be found at http://
www.hotcandlestick.com/ while a list of different
formation can be found at http://www.litwick.com/
glossary.html
Let’s look at Illustration 8, yep the same chart again
(sorry if you are sick of it!), but instead of taking the CCI as
our trigger, let’s look for some candlestick formations
instead. These are but only a small sample of the different
formations that exist, but it should give you an idea.
The first long signal marked is a bullish engulfing candle.
This is where the body of the bull candle is somewhat
larger, and more than covers that of the preceding bear
candle. The fact this happened at the same time as a
squeeze signal, at the lower Bollinger Band and it closed
above the 100SMA, is a very strong trigger signal to go long
with the prevailing trend.
Illustration 8: Using a 50 CCI trigger

by Akuma99 | www.beginnertrader.com15
Not So Squeezy
The second is a more advanced formation call the Bullish 3
inside up formation, where we have two inside days (where
the entire candle is contained within the preceding candle)
right above the 200SMA and at the lower Bollinger Band
(remember it is an indication of oversold conditions).
The third is a basic single candle formation called a bullish
hammer, where the body is very small, with a long lower
wick. This shows there was an attempt to push prices
lower, but they were quickly rejected. Again this is at the
lower Bollinger Band, and we have a squeeze signal, so
time to go long.
These are only three of the many other formations out
there, for the astute reader, you would notice that there
are a fair few counter trend formations that form at the
upper Bollinger Band as well, this is a more advanced
method of trading this system that I myself don’t feel
comfortable with, but explore it at your leisure.
These are just two trigger methods, try to find yours.
Exits
Entries are so often the focus of most traders systems, with
the assumption that as long as there is an opportunity to
make a profit (i.e. as long as the trade goes my way), then
all will be ok. Unfortunately in practice this is often not the
case, knowing when to exit is harder than knowing when to
enter as greed can be a more powerful force than anything
the market can throw at you. Bad exits can be the cause of
most frustration for beginners especially when closing a
trade with a small profit only to see it take off straight after
that.
Having set exit rules, with the discipline to stick to it, as
well as the knowledge that you may give up some potential
profits to protect yourself against much larger losses is one
of the greatest trading challenges for the early trader.
Remember, you can lose money from a profitable trade as
well.
“Exits should be the most pleasurable part of your trading, it is after all when you make your money ...”
Illustration 9: Red circles show exit points
by Akuma99 | www.beginnertrader.com16
Not So Squeezy
The Not So Squeezy method has only one hard and fast
rule for exits, and one optional exit strategy. The hard and
fast rule is to close at least half of your position at the
opposite Bollinger Band. In Illustration 9, these exits are
marked with red cicles, and as the trend is shown to be up,
these are all long positions.
The optional exit rule is to let half of your position run for
the 161.8 fibonacci extension level. This is especially
relevant if the move from one Bollinger Band to the next
has high acceleration (excitement).
The main thing is to stick to your exit strategy as closely as
your entry strategy, you should not let elation, greed or ego
let you forget that the market can turn on you just as
quickly as it is currently rewarding you.
For those not familiar with fibonacci extensions it is simply
the height of the correction, or the swing into the main
move, multiplied by a derivative of the golden ratio (0.618).
So in Illustration 9, we have a swing down, before the
major move up as shown by the red diagonal line. That
swing down multiplied by 1.618 results in the line that
corresponds to the blue circle (exit level). (more info at
http://www.investopedia.com/articles/trading/05/
AdvFibonacci.asp)
If this optional strategy is employed, be sure to lock in at
least +1 (might as well make something) with that last half
lot you have open, we don’t want to make an otherwise
winning trade a losing one.
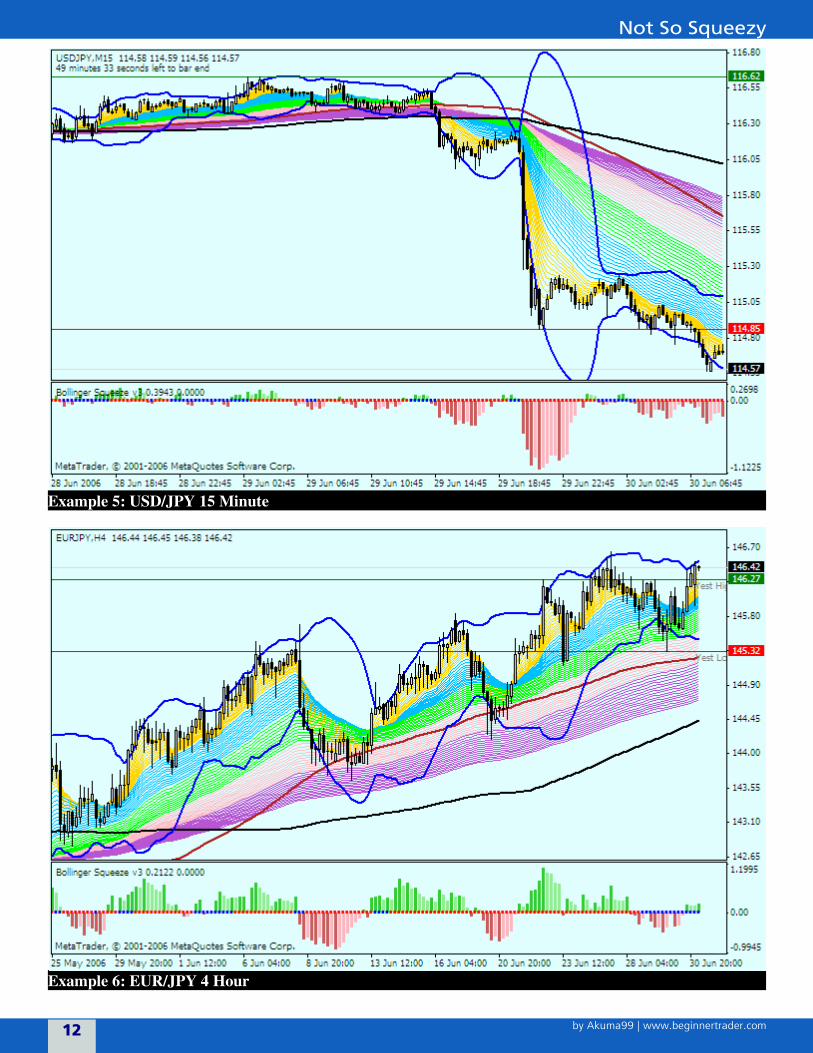
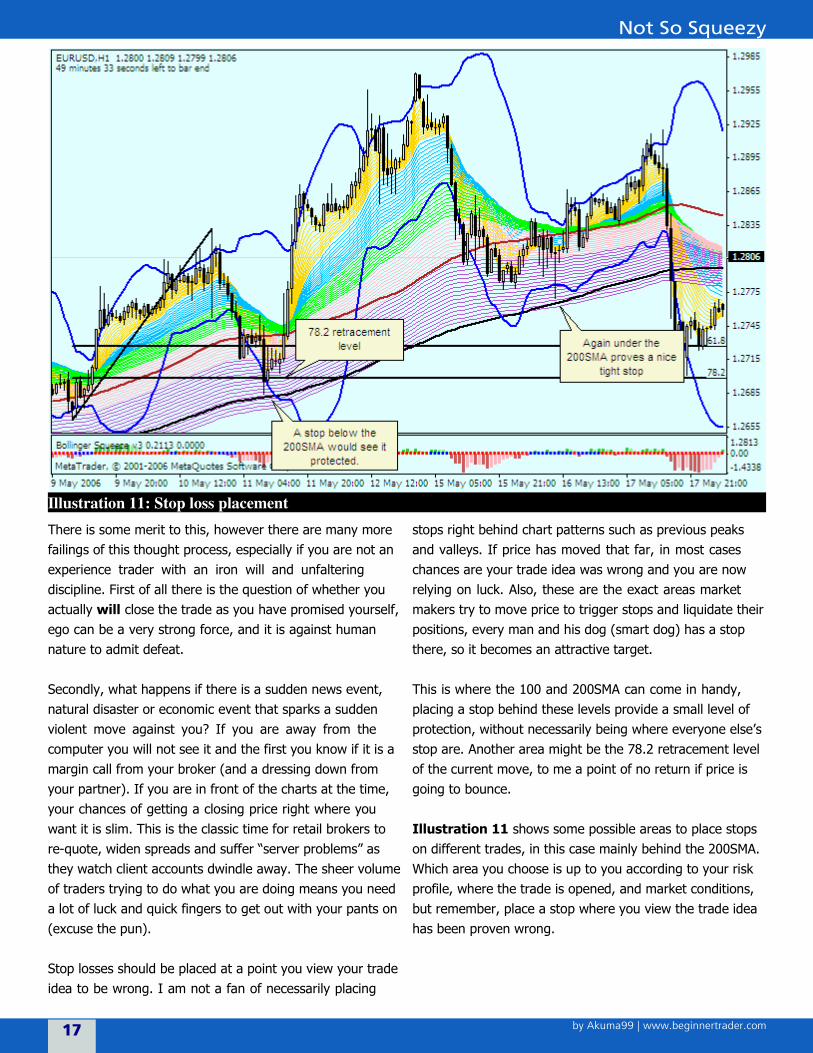
Stop Loss Placement
Stop loss placement is one of the most widely disputed
aspects of trading. Where to place stop losses? Should we
place stop losses? Do people hunt stop losses? etc. etc.
First of all, stop losses are hunted, especially in the Retail
Forex world, there is no hiding that fact, and no use
winging about it either, as it has been going on as long as
Adam was a boy. Illustration 10 shows areas where stops
runs occurred. This fact makes some believe then that it is
best not to place a stop at all, but instead place a mental
stop so they brokerage houses don’t know where your stop
is sitting.
Illustration 10: Stop running
by Akuma99 | www.beginnertrader.com17
Not So Squeezy
There is some merit to this, however there are many more
failings of this thought process, especially if you are not an
experience trader with an iron will and unfaltering
discipline. First of all there is the question of whether you
actually will close the trade as you have promised yourself,
ego can be a very strong force, and it is against human
nature to admit defeat.
Secondly, what happens if there is a sudden news event,
natural disaster or economic event that sparks a sudden
violent move against you? If you are away from the
computer you will not see it and the first you know if it is a
margin call from your broker (and a dressing down from
your partner). If you are in front of the charts at the time,
your chances of getting a closing price right where you
want it is slim. This is the classic time for retail brokers to
re-quote, widen spreads and suffer “server problems” as
they watch client accounts dwindle away. The sheer volume
of traders trying to do what you are doing means you need
a lot of luck and quick fingers to get out with your pants on
(excuse the pun).
Stop losses should be placed at a point you view your trade
idea to be wrong. I am not a fan of necessarily placing
stops right behind chart patterns such as previous peaks
and valleys. If price has moved that far, in most cases
chances are your trade idea was wrong and you are now
relying on luck. Also, these are the exact areas market
makers try to move price to trigger stops and liquidate their
positions, every man and his dog (smart dog) has a stop
there, so it becomes an attractive target.
This is where the 100 and 200SMA can come in handy,
placing a stop behind these levels provide a small level of
protection, without necessarily being where everyone else’s
stop are. Another area might be the 78.2 retracement level
of the current move, to me a point of no return if price is
going to bounce.
Illustration 11 shows some possible areas to place stops
on different trades, in this case mainly behind the 200SMA.
Which area you choose is up to you according to your risk
profile, where the trade is opened, and market conditions,
but remember, place a stop where you view the trade idea
has been proven wrong.
Illustration 11: Stop loss placement
by Akuma99 | www.beginnertrader.com18
Not So Squeezy
Conclusion
What is contained in this document is the very basics of the
Not So Squeezy system. I have not touched on Money
Management, Risk/Reward or Trade Management, however
below are some links that should help you in those areas.
I make no claims that it is the blueprint for your road to
riches, but I hope it gives you an insight into how I think
when placing a trade. Feel free to add, take away and hack
this system to death, until you feel ownership of a system,
you won’t truly be able to trade it with the confidence that
is needed to be successful in this business.
I do not view this as being complete, my research
continues on different ways to get the edge we are looking
for in the markets. This system does not break new ground,
but it tries to utilise the known factors of human behaviour,
that ultimately, runs all marketplaces around the world.
In coming months, I will look at extending this document to
incorporate one main factor I feel is ignored in mainstream
trading systems, that being time. The markets move to a
beat, that much is clear to me, but utilising that to trade
profitably is a challenge I am yet to conquer.
I wish you all luck in your trading expeditions, remember
you do not need to be smart to be successful in trading,
you do not need a PHD in mathematics, to pay for
expensive courses or mentorship. What you need is
determination, discipline and an undying faith that you will
succeed.
All comments, suggestions, ideas and corrections can be
either sent to me at [email protected] or
shoot over to Forex Factory where a trading diary and
discussion is already underway at http://
www.forexfactory.com/forexforum/
showthread.php?t=5174.
Happy trading!
Akuma99
http://www.beginnertrader.com
http://akuma99.blogspot.com
Links
Not So Squeezy Indicatorshttp://www.forexfactory.com/forexforum/
showthread.php?t=5174.
Money Managementhttp://www.trader-soft.com/money-management/
index.html
http://daytrading.about.com/od/educationtraining/a/
moneymanagement.htm
http://daytrading.about.com/cs/educationtraining/l/
aa092799.htm
http://www.babypips.com/forex-school/money-
management.html
Forex Basicshttp://www.babypips.com/
http://www.beginnertrader.com
http://www.babypips.com/forex-school/market-
hours.html
http://www.refcofx.com/education/what-moves-
rates.html
Calendarhttp://www.forexfactory.com
Newshttp://www.actionforex.com/
http://www.fxstreet.com/
http://wn.com/s/forexcapitalnews/index.html
http://www.forexcentral.net/
Forumshttp://www.trade2win.com/
http://www.forexfactory.com/
http://www.tacticaltrader.com/
http://www.strategybuilderfx.com/
http://www.forex-tsd.com/
Trading Blogshttp://tradermike.net/
http://www.thinkingstuff.com/blog/
http://www.dismally.com/
http://globetrader.blogspot.com/
http://www.dopeness.org/

by Akuma99 | www.beginnertrader.com19
Not So Squeezy
Example 1 Answer
Example 2 Answer
by Akuma99 | www.beginnertrader.com20
Not So Squeezy
Example 3 Answer
Example 4 Answer

by Akuma99 | www.beginnertrader.com21
Not So Squeezy
Example 5 Answer
Example 6 Answer