Embed Size (px)
Citation preview

Norwegian Maritime equipment suppliers 2018KEY PERFORMANCE INDICATORS AND FUTURE EXPECTATIONS
OCTOBER 2018BY ANDERS HELSETH, CHRISTIAN SVANE MELLBYE AND ERIK W. JAKOBSEN


3NORWEGIAN MARITIME EQUIPMENT SUPPLIERS 2018
Preface
2018 has been another challenging year for the Norwegian maritime industry, although with clear signs of improvement from one year ago. We have asked Menon Economics to review the current situation and get their predictions and view on the future, based on results reported by the companies after year-end 2017 and extensive surveying among maritime equipment suppliers.
This publication is the fifth in its series ordered by the Federation of Norwegian Industries and paints a brighter view of the short-term prospects in the industry than last year’s publication. The industry has been successful in reorienting itself towards new markets as a response to lower demand from the offshore oil and gas segment.
The report describes changes that have occurred in the market and gives interesting insight into how the companies have adapted in challenging markets. We believe the toughest years of the recent downturn are behind us and we trust the industry is well positioned for the upturn we think is coming.
Interesting times lie ahead with increased focus on environmentally friendly solutions. The Norwegian maritime industry is among the world leaders in several exciting market-segments, giving reason to believe in long-term growth for the industry.
We thank all the respondents in our companies that have taken the time to respond to our call for data, we thank Menon Business Economics for a thorough and well analysed report, and trust that the findings will be well received in the industry.
Oslo, October 20, 2018
Lars Gørvell-DahllDirector, Maritime Branch, Federation of Norwegian Industries

COVERPHOTO: KONGSBERG

5NORWEGIAN MARITIME EQUIPMENT SUPPLIERS 2018
Summary Norwegian ship equipment producers are known for quality and innovative solutions. A successful reorientation towards new markets in the last few years has again shown the industry’s capacity to adapt as the demand for ships and equipment change.
Increased pressure to develop environmentally friendly solutions and the effects of digitalisation will also challenge the industry to continue reinventing itself. Norwegian ship equipment producers have taken leading positions in markets that could prove vital in reaching the world’s climate goals. Norway is developing into a stronghold for production of battery-driven ships equipment, and Norwegian equipment suppliers are well positioned for the boom in LNG-driven ships and other alternative fuels.
Preliminary results and estimates for 2018 and 2019 show that the Norwegian maritime equipment industry is set for growth. Revenues will increase in 2018 for the first time in four years, while employment remains stable compared to 2017-levels. Strong growth in new market segments, especially deliveries to exploration cruises and fishing ships, contributes to increasing revenues in 2018. Growth is expected to accelerate in 2019 with an estimated 13 per cent increase in revenue and a three per cent increase in employment.
The industry is once again profitable, and operating margins are expected to increase further. However, profitability levels are low compared to the period pre-2014. Two key factors will decide profitability in coming years: the industry’s ability to be profitable also in new key markets with new products, and a comeback in the offshore oil and gas markets.
The Norwegian maritime equipment industry is still a key Norwegian industry. Production of ship equipment employs 18 000 highly productive workers, each worker contributing close to NOK 1 million in value added to the economy. 94 per cent of the equipment suppliers are small and medium-sized companies and employ half of the 18 000 workers. The industry’s export share is stable, proving its competitiveness against countries with significantly lower wage rates. Two-thirds of ship equipment is exported directly abroad, while another 25 per cent is exported indirectly through sales from Norwegian yards and other services supplied abroad.
NORWEGIAN MARITIME EQUIPMENT SUPPLIERS 20186
Contents
Preface ................................................................................................................... 3
1. Summary ........................................................................................................... 5
2. Focus on production and sales of ship equipment ........................................9
3. The tide is turning ...........................................................................................113.1. Increased activity in 2018, strong growth expected in 2019 ........................................................................... 11
3.2. Deliveries towards exploration cruises, fishery- and offshore ships will be crucial for growth over the next years ............................................................................................................................12
3.2.1. Increasing number of new orders for exploration cruises and ferries .............................................................12
3.2.2. Promising but somewhat uncertain future in fisheries and aquaculture ........................................................12
3.2.3. Offshore oil and gas markets flatten out – slow rebound expected ..............................................................13
3.3. Profitability is expected to rise in 2018 and 2019 ..............................................................................................14
3.4. Acquisitions create larger units ...........................................................................................................................15
4. Environmental focus and digitalisation will be essential for future development ..................................................................................16
4.1.1. Increased pressure on developing environmentally friendly solutions ............................................................16
4.1.2. The LNG-driven fleet will increase substantially .............................................................................................16
4.1.3. Norway is at the forefront for battery-driven vessels .....................................................................................16
4.1.4. Strong growth potential in offshore wind .....................................................................................................17
4.1.5. Digitalisation and automation will grow exponentially ..................................................................................19

7NORWEGIAN MARITIME EQUIPMENT SUPPLIERS 2018
5. Ship equipment – a key norwegian industry ...............................................205.1. Production of ship equipment employs 18 000 highly productive workers ...................................................20
5.2. SMEs employ half of the workers and performed better during the recession .............................................21
5.3. Two-thirds of ship equipment is exported directly – another 25 per cent through indirect exports ..........21
5.4. Production of mechanical and electronic equipment accounts for 70 per cent of value added ..................21
5.5. Maritime focus varies among companies ...........................................................................................................23
6. Appendix ........................................................................................................ 246.1. Data registry and survey data ..............................................................................................................................24
6.2. Delimiting the maritime industry ........................................................................................................................24
7. Geographical footprint .................................................................................. 257.1. Employment and value added by county in 2017 ............................................................................................. 25
8. Historical results – ship equipment .............................................................. 26
9. Historical results by types of ship equipment ............................................. 279.1. Mechanical equipment ........................................................................................................................................ 27
9.2. Electrical and electronic equipment .................................................................................................................. 28
9.3. Other operating equipment ............................................................................................................................... 29
9.4. Trade ..................................................................................................................................................................... 30
9.5. Design .................................................................................................................................................................... 31


9NORWEGIAN MARITIME EQUIPMENT SUPPLIERS 2018
2. Focus on production and sales of ship equipment
The numbers presented and discussed here will be those related to the maritime part of operations excluding drilling equipment, in this report called ship equipment. It is clearly stated where numbers presented or discussed deviate from this narrower division of operations. Ship equipment represents about 50 per cent of
revenues for the companies included1, and the shares vary from a sole focus on ship equipment to companies primarily operating in other markets.
1 See “Delimiting the maritime industry” in the appendix for delimitation of the companies included.
Ship equipment 53 %
Non-‐mari4me equipment
39 %
Drilling equipment 8 %
FIGURE 1: Distribution of revenues for ship equipment producers separated into ship equipment, drilling equipment and non-maritime equipment, 2017. SOURCE: MENON ECONOMICS

NORWEGIAN MARITIME EQUIPMENT SUPPLIERS 201810
Ship equipment is broken down into five categories based on the type of product being supplied:
• Mechanical equipment refers to the production of equipment for carrying out mechanical operations such as lifting or propelling ships forward. The group is exten-sive, including suppliers of cranes, winches, propellers, and engines.
• Electrical and electronic equipment refers to the production of equipment focusing on electrical and electronic components, inclu-ding specialist hardware, software, electrical propulsion systems, bridge equipment or DP systems2.
• The group dealing with design typically includes ship design companies such as Møre Maritime. The group also includes com-panies with a somewhat broader focus such as LMG Marin, which offers design packages for both ships and rigs.
• Other operating equipment involves manufacturers of equipment necessary for everyday ship operations, including suppliers of items such as marine paint, lubricants, cables, chains, and lifeboats.
• Trade consists of companies that buy and sell goods for operating and maintaining ships, or act as dealers for equipment to other players such as shipyards in Norway and abroad.
Mechanical equipment• Cranes, winches, propellers, engines etc
Electrical and electronic equipment• DP, software, specialised hardware, bridge equipment,
sensors etc
Design• Ship design
Other operating equipment• Paint, lubricant, cables, chains, life-boats etc
Trade
• Agents, wholesalers and distributors
2 Dynamic positioning (abbreviated “DP”) systems are systems for keeping ships or other vessels such as rigs or FPSOs in the same position above the seabed without the use of anchors, utilizing propellers and thrusters instead.

11NORWEGIAN MARITIME EQUIPMENT SUPPLIERS 2018
3. The tide is turning
3.1. Increased activity in 2018, strong growth expected in 2019Strong growth in new market segments contributes to increasing revenues in 2018. Sales of equipment to exploration cruises and ferries are estimated to rise by 50 per cent in 2018. Norwegian yards have taken strong positions in the ferry and exploration cruise markets, and equipment suppliers are increasingly shifting their focus towards deliveries to this market. A reorientation towards equipment for fisher-ies and aquaculture is proving profitable as well, with sales towards this market segment estimated to increase by more than 20 per cent in 2018. Despite growth in new market seg-ments, sales to offshore oil and gas and shipping markets still make up close to three-quarters of revenues. Continued weak offshore oil and gas markets and stable revenue from the shipping segment are expected to dampen overall growth in 2018.
The companies surveyed believe growth is set to accelerate in 2019. 85 per cent of the companies believe revenues will increase in 2019, and more than 60 per cent believe in an increase of 10 per cent or more. Combined revenue is estimated to rise by 13 per cent in 2019, more than doubling the speed of growth in 2018 (6 per cent). Larger orderbooks back the expected turnaround in activity among ship equipment producers. Order reserves are up 4 per cent in 20183 (year-over-year) and now secure ten months of operations.
Companies with a relatively high orientation towards deliveries for exploration cruises and ferries, on average, expect the largest increase in revenues for 2019. Fisheries and aquaculture-oriented producers also expect increasing revenues, while companies mainly directed towards the oil and gas markets expect growing income as well, but expectations fluctuate more than for producers less directed towards this
Offshore O&G 39 %
Shipping 30 %
Fisheries and aquaculture
15 %
Cruise/ferries 12 %
Offshore wind 4 %
Offshore O&G
Shipping Fisheries and aquaculture
Cruise/ferries
Offshore wind Change 2018
FIGURE 2: Right: Market segmentation of revenues for ship equipment suppliers in 2018. Left: Each market segment’s contribution to growth in revenue from 2017 to 2018. SOURCE: MENON ECONOMICS
3 As of September 2018

NORWEGIAN MARITIME EQUIPMENT SUPPLIERS 201812
market. Expectations among highly shipping-oriented producers vary with the average outlook indicating moderate growth.
3.2. Deliveries towards exploration cruises, fishery- and offshore ships will be crucial for growth over the next yearsNorwegian producers’ ability to capitalise in new market segments and the magnitude of growth in the offshore oil and gas markets will likely be crucial for revenue and profitability over the next years. Deliveries to exploration cruises and fishing ships look particularly promising, while demand from oil and gas markets will rise, but the exact timing and size of the comeback is hard to predict.
3.2.1. Increasing number of new orders for exploration cruises and ferries
The prospects for further deliveries in the exploration cruise and ferry markets are promising. Annual investment in cruise vessels
has more than doubled globally since 20154, and the orderbooks at the larger Norwegian yards are filling up with new orders in the segment. New contracts for passenger and cruise ships contributed strongly to a 70 per cent increase in backlog order value at Norwegian yards in the past year5, and now constitute close to half the value of agreed future deliveries. New orders for ferries continue to tick in as well. These contracts, however, have less impact on the value of orderbooks, the average deal for newbuilds being four times less than for explora-tion cruises. Still, ferries now account for close to 10 per cent of backlog order value at Norwegian yards, rising from next to nothing a few years ago.
3.2.2. Promising but somewhat uncertain future in fisheries and aquaculture
In recent years, the market for fisheries and aquaculture has experienced exponential growth in revenues and profitability, driven by low bunker prices, high commodity prices and a
-‐20 %
-‐15 %
-‐10 %
-‐5 %
0 %
5 %
10 %
15 %
-‐20 %
-‐15 %
-‐10 %
-‐5 %
0 %
5 %
10 %
15 %
2015 2016 2017 2018E 2019E
Grow
th, y
ear-‐ov
er-‐y
ear
Revenue Employment
FIGURE 3: Yearly change in revenue and employment for ship equipment suppliers, 2015-2019. Revenue and employment are estimated for 2018 and 2019. SOURCE: MENON ECONOMICS
4 Clarkson Shipyard Monitor5 Year-over-year growth, August 2017 to August 2018
13NORWEGIAN MARITIME EQUIPMENT SUPPLIERS 2018
healthy and favourable quota-situation. The big question now is where this segment is heading. Many factors will determine its development:
Future quota-situation: There is an ongoing discussion on the size of the quotas for many types of fish, most notably for cod (ref. International Council for the Exploration of the Sea).
Increasing interest rates: Many of the fishery shipping companies6 have invested heavily in new vessels and are heavily indebted. With pos-sibly increasing interest rates, some companies could find themselves in a difficult situation.
Exchange rates: Exchange rates are particularly important within fisheries and aquaculture as they receive most of their income in foreign currency. A weak NOK has been favourable for the export industry, but with expected
increasing interest rates we might see a subsequent strengthening of the NOK.
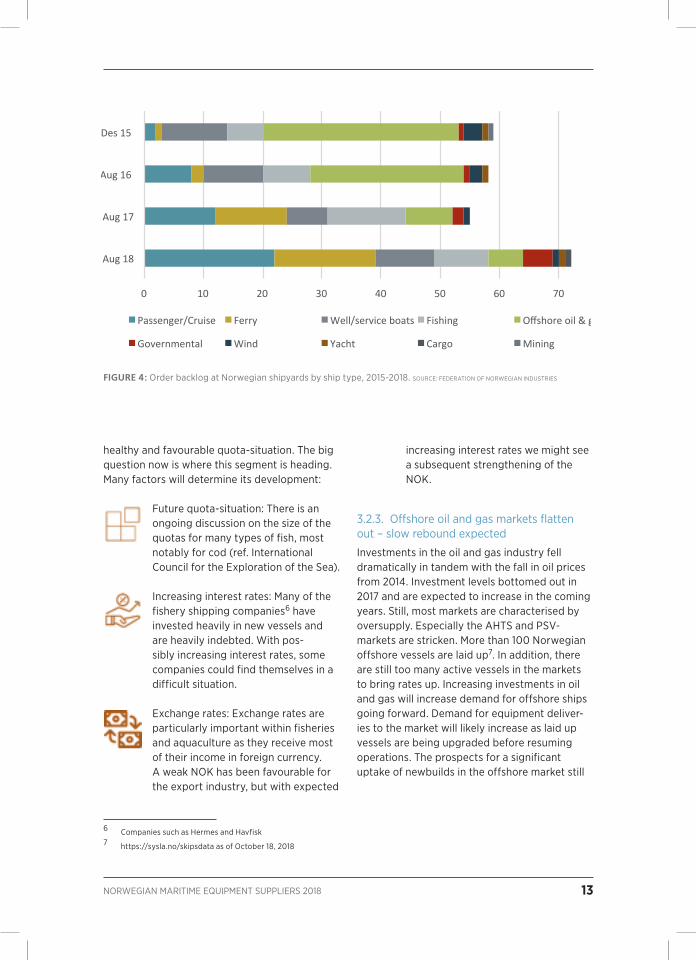
3.2.3. Offshore oil and gas markets flatten out – slow rebound expected
Investments in the oil and gas industry fell dramatically in tandem with the fall in oil prices from 2014. Investment levels bottomed out in 2017 and are expected to increase in the coming years. Still, most markets are characterised by oversupply. Especially the AHTS and PSV-markets are stricken. More than 100 Norwegian offshore vessels are laid up7. In addition, there are still too many active vessels in the markets to bring rates up. Increasing investments in oil and gas will increase demand for offshore ships going forward. Demand for equipment deliver-ies to the market will likely increase as laid up vessels are being upgraded before resuming operations. The prospects for a significant uptake of newbuilds in the offshore market still
0 10 20 30 40 50 60 70 80
Aug 18
Aug 17
Aug 16
Des 15
Passenger/Cruise Ferry Well/service boats Fishing Offshore oil & gas
Governmental Wind Yacht Cargo Mining
FIGURE 4: Order backlog at Norwegian shipyards by ship type, 2015-2018. SOURCE: FEDERATION OF NORWEGIAN INDUSTRIES
6 Companies such as Hermes and Havfisk7 https://sysla.no/skipsdata as of October 18, 2018

NORWEGIAN MARITIME EQUIPMENT SUPPLIERS 201814
look bleak with the number of new contracts falling in 2018 compared to 20178.
3.3. Profitability is expected to rise in 2018 and 2019Ship equipment suppliers are operating in a global market and face competition from coun-tries with lower costs. To be competitive, the companies must deliver goods and services that have a higher correlation between quality and cost than their competitors can provide. Profit margins can be interpreted as an indicator of the equipment suppliers’ ability to leverage their capabilities and deliver goods that are valued higher than their input factors.
The ship equipment suppliers have in recent years been forced to cut profit margins to be competitive. Operating margins were negative in 2016 and 2017 but are estimated to be positive again in 2018, and expected to grow further in 2019. In tandem with increased activity, ship equipment suppliers will have to improve profitability in the coming years to keep investors from moving their assets into other more profitable markets. The companies seem well positioned to capitalise on growing markets, having taken the bulk of restructuring costs in previous years, as well as being well set for eventual growth in the offshore oil and gas markets.
-‐
50
100
150
200
250
2013 2014 2015 2016 2017 2018 2019
Billion
NOK
FIGURE 5: Investments in oil and gas industry in Norway 2013-2018. Expected numbers for 2019. SOURCE: SSB
8 2017: 48, 2018: 24 (Q1-Q3). Source: Clarkson/Menon9 Larger than normal impairment costs impacted operating margins negatively in 2016. Still, operating margins would have been
negative with impairment costs equal to previous years.
2015 2016 2017 2018 est. 2019 outlook
Operating margin 3.6% -1.7%9 -0.3% 1.8% Strong growth in operating profits (EBIT)
TABLE 1: Operating margins for ship equipment suppliers, 2015-2019. SOURCE: MENON ECONOMICS

15NORWEGIAN MARITIME EQUIPMENT SUPPLIERS 2018
3.4. Acquisitions create larger units Mergers and acquisitions have consolidated the ownership among ship equipment suppliers and created larger and more competitive units. Most notably, Kongsberg Maritime has entered into an agreement to acquire Rolls-Royce Marine for a reported NOK 5.3 billion, to be effectu-ated in 2019. Foreign investors found lucrative investments in the Norwegian market as well.
In February 2018, MacGregor, part of Finnish Cargotec, announced an agreement to acquire TTS Group’s marine and offshore divisions for a reported EUR 87 million, expanding the company’s consolidated unit in Norway. In addition, Norsafe, Norway’s largest producer of lifeboats, was acquired by Danish Viking in September 2018.
FIGURE 6: Distribution of survey respondents’ take on the following statements. Left: Restructuring has increased investment costs in my company in the past years. Right: Restructuring will reduce my company’s profitability in the coming years.
PH
OTO
: AB
B

NORWEGIAN MARITIME EQUIPMENT SUPPLIERS 201816
4. Environmental focus and digitalisation will be essential for future development
Increased pressure on developing environ-mentally friendly solutions and the effects of digitalisation will play a vital role in the future of ship equipment suppliers.
4.1.1. Increased pressure on developing environmentally friendly solutions
The Intergovernmental Panel on Climate Change (IPCC) shows swift action must be taken to satisfy the 1.5°C target for global temperature increase. Maritime transport emits around 1000 million tons of CO2 annually and is responsible for about 2.5 per cent of global greenhouse gas emissions10. Shipping emissions are predicted to increase between 50 and 250 per cent by 2050, depending on future economic and energy developments in the “business as usual”-scenario (ibid).
The International Maritime Organization (IMO) has a stated policy to reduce CO2-emissions from shipping by 50 per cent within 2050. Escalating focus on climate change will put pres-sure on authorities to introduce more environ-mentally friendly rules and regulations.
The Norwegian Shipowners’ Association vision of zero harmful emissions from Norwegian-controlled vessels is a prime example of industry players trying to reduce the emissions from maritime activities.
4.1.2. The LNG-driven fleet will increase substantiallyGas is predicted to overtake oil as the world’s primary energy source in 2026 (Energy Transformation Outlook, DNV GL). Part of the increased demand will come from a larger share of the world fleet expected to be powered by natural gas. As of today, 30 per cent of LNG-driven ships are operating in Norway, and Norwegian producers have taken a strong posi-tion in the market for gas engines. Most notable among Norwegian producers is Rolls-Royce who is supplying both national and international customers with motors built in Norway.
4.1.3. Norway is at the forefront for battery-driven vessels
Norwegian suppliers and yards have taken a lead role in developing environmentally friendly solu-tions. Over a third of the world’s battery-driven ships are operating in Norway11, and about an equal share has been built at Norwegian yards12. As a result, both Norwegian yards and equip-ment suppliers have developed competence in a market with substantial growth prospects. The market is growing rapidly, exemplified by Havila Kystruten newly ordering battery packs for their four new ships. Norwegian Electrics and Norwegian Electric Control Systems will deliver the hybrid-electric propulsion systems, and the ship equipment will be designed and delivered by Havyard13.
10 Third IMO Greenhouse Gas Study 2014, International Maritime Organization11 DNV GL – Alternative Fuels Insight12 29 percent – Clarkson World Fleet Register13 https://sysla.no/maritim/nye-kystruten-skip-far-verdens-storste-batteripakker/

17NORWEGIAN MARITIME EQUIPMENT SUPPLIERS 2018
The Norwegian-Canadian provider of energy storage solutions, Corvus Energy, is one of the world’s dominant suppliers of maritime bat-teries. It is now looking to strengthen its position in Norway and has announced plans to build a battery factory in the Bergen area.
The new ferry tenders along with the increasing demand for environmentally friendly energy systems in the offshore and shipping sectors have led to strong growth in the Norwegian market, making Norway an attractive location for a battery factory.
The battery factory will depend on automated production to ensure more efficient production and make Corvus Energy more competitive compared to low-cost countries. The factory will make it easier to test and develop new systems that can meet the future needs of the industry.
4.1.4. Strong growth potential in offshore wind
Investments in the offshore wind market are expected to increase in the coming five years.
14 https://corvusenergy.com/corvus-energy-to-expand-production-in-response-to-high-demand-for-energy-storage/, https://corvusenergy.com/corvus-energy-recognized-as-global-leader-in-clean-technology/
Corvus Energy establishing a new factory in Norway
The Norwegian-Canadian provider of energy storage
solutions, Corvus Energy, is one of the world’s
dominant suppliers of maritime batteries. It is now
looking to strengthen its position in Norway and has
announced plans to build a battery factory in the
Bergen area.
The new ferry tenders along with the increasing de-
mand for environmentally friendly energy systems in
the offshore and shipping sectors have led to strong
growth in the Norwegian market, making Norway an
attractive location for a battery factory.
The battery factory will depend on automated
production to ensure more efficient production and
make Corvus Energy more competitive compared
to low-cost countries. The factory will make it easier
to test and develop new systems that can meet the
future needs of the industry.
SOURCE: CORVUS ENERGY14
PH
OTO
: RO
LLS-
RO
YCE
PH
OTO
: CO
RV
US
ENER
GY

NORWEGIAN MARITIME EQUIPMENT SUPPLIERS 201818
Cumulative installed generator capacity is expected to grow by almost 19 per cent per year (CAGR) between 2019-2023, albeit from a low base compared to the oil and gas industry.
The industry is developing quickly. In 2002, the first utility-scale offshore wind farm with a capacity of 160 MW was connected to the grid in Denmark. Since then the average project has mo-
FIGURE 7: Forecast for the global installed capacity in offshore wind 2019-2023. SOURCE: BVG ASSOCIATES
PH
OTO
: KO
NG
SBR
G
19NORWEGIAN MARITIME EQUIPMENT SUPPLIERS 2018
ved to sites further from shore, in deeper waters, with higher wind speeds and ever-increasing generator capacities. The cost of offshore wind is falling, and in 2017 the first contract without any subsidies was awarded in Germany. If costs keep falling, the offshore wind market could grow even faster in the coming years.
4.1.5. Digitalisation and automation will grow exponentially
“Vastly improved maritime connectivity, the advance of cyber-physical systems and ‘digital’ twins will dominate the digital side of shipping in the coming decade, as vessels increasingly resemble floating computers” – DNV GL.
The Norwegian equipment suppliers are recog-nised for their high level of competence and technical know-how and are hence well positio-ned to adapt and excel in new technologies. The high salary levels in Norway are likely to push firms and employees even further in their quest for high productivity. For continued relevance in the global maritime markets, firms need to seek market opportunities where technology and innovation are central.
Norwegian suppliers continue to prove they are capable of being world-leading in the develop-ment of new technologies. As an example, the world’s first autonomous, zero emissions con-tainer ship will be ready for operations in 2020. The ship is constructed at the Vard Group’s yard in Brevik, and the Kongsberg Group is respon-sible for development and delivery of critical technologies onboard.
Kongsberg Digital predicts that 30 to 40 per cent of the total world fleet will be digitalised within five years, making digitalisation at sea a billion-dollar market in the years to come.
Today, ships all around the world generate data. The data comes from motors, generators, sensors and other equipment. This data can give valuable information that can lead to better operational choices being made, and hence significant savings in operating costs.
From the digitalisation of the maritime sector arises the challenge to protect the systems against cyber-attacks. Last year Maersk lost an estimated turnover of NOK 2.5 billion due to a data attack, and this summer, the US offices of the Chinese container shipping company Cosco Shipping were hit by a cyber-attack.
Cybersecurity at sea is receiving increased attention. Positioning itself in the market is Kongsberg Digital, now also collaborating with the auditing company KPMG to raise awareness of cyber knowledge and safety in the shipping industry.
Increased digitalisation creates new dangers - A potential gold mine in cybersecurity
Kongsberg Digital predicts that 30 to 40 per
cent of the total world fleet will be digitalised
within five years, making digitalisation at sea a
billion-dollar market in the years to come.
Today, ships all around the world generate
data. The data comes from motors, generators,
sensors and other equipment. This data can
give valuable information that can lead to better
operational choices being made, and hence
significant savings in operating costs.
From the digitalisation of the maritime sector
arises the challenge to protect the systems
against cyber-attacks. Last year Maersk lost an
estimated turnover of NOK 2.5 billion due to a
data attack, and this summer, the US offices of
the Chinese container shipping company Cosco
Shipping were hit by a cyber-attack.
Cybersecurity at sea is receiving increased
attention. Positioning itself in the market is
Kongsberg Digital, now also collaborating with
the auditing company KPMG to raise awareness
of cyber knowledge and safety in the shipping
industry.
NORWEGIAN MARITIME EQUIPMENT SUPPLIERS 201820
5. Ship equipment – A key Norwegian industry
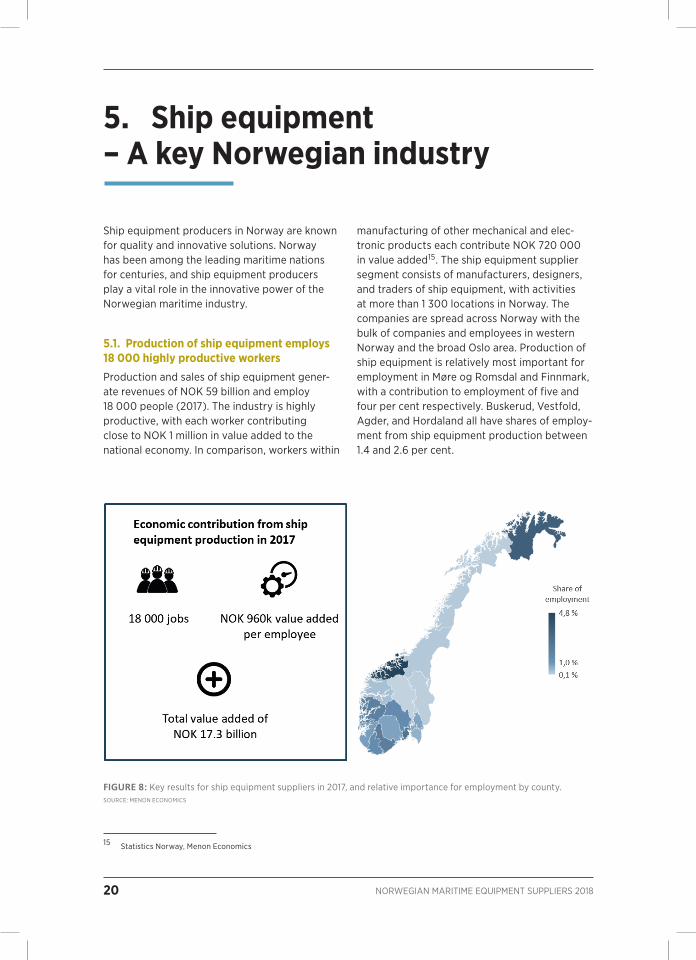
Ship equipment producers in Norway are known for quality and innovative solutions. Norway has been among the leading maritime nations for centuries, and ship equipment producers play a vital role in the innovative power of the Norwegian maritime industry.
5.1. Production of ship equipment employs 18 000 highly productive workersProduction and sales of ship equipment gener-ate revenues of NOK 59 billion and employ 18 000 people (2017). The industry is highly productive, with each worker contributing close to NOK 1 million in value added to the national economy. In comparison, workers within
manufacturing of other mechanical and elec-tronic products each contribute NOK 720 000 in value added15. The ship equipment supplier segment consists of manufacturers, designers, and traders of ship equipment, with activities at more than 1 300 locations in Norway. The companies are spread across Norway with the bulk of companies and employees in western Norway and the broad Oslo area. Production of ship equipment is relatively most important for employment in Møre og Romsdal and Finnmark, with a contribution to employment of five and four per cent respectively. Buskerud, Vestfold, Agder, and Hordaland all have shares of employ-ment from ship equipment production between 1.4 and 2.6 per cent.
15 Statistics Norway, Menon Economics
FIGURE 8: Key results for ship equipment suppliers in 2017, and relative importance for employment by county. SOURCE: MENON ECONOMICS

21NORWEGIAN MARITIME EQUIPMENT SUPPLIERS 2018
5.2. SMEs employ half of the workers and performed better during the recessionSMEs account for 94 per cent of companies pro-ducing ship equipment and employ half of the 18 000 workers. Productivity at SMEs is close to that of big companies, each worker creating a value added of NOK 950 000 in 2017. During the recession, SMEs have outperformed the big companies in terms of growth and profitability.
An explanation could be that smaller companies have been less directed towards the oil and gas market, and smaller companies tend traditionally to be more agile and are therefore able to take early advantage of opportunities in new markets.
5.3. Two-thirds of ship equipment is exported directly – another 25 per cent through indirect exportsThe market for ship equipment is international. Two-thirds of the equipment (equating NOK 32.5 billion) is sold directly to foreign yards, ship-ping companies or other maritime companies.
In addition, a large share of equipment sold to Norwegian yards and shipping companies is used to produce exports, either through foreign orders at Norwegian yards or as equipment for Norwegian shipping companies supply-ing services abroad. The high export rate has been quite stable for several years, showing Norwegian equipment suppliers maintaining their competitiveness in the world market.
5.4. Production of mechanical and electronic equipment accounts for 70 per cent of value addedProduction of mechanical and electronic compo-nents gave a total value added of NOK 12 billion in 2017. Retailers of ship equipment (traders of equipment) rank third regarding value added, contributing with a value added of NOK 2.5 bil-lion. Other operating equipment, such as marine coatings and lifeboats, creates a value added of NOK 2 billion, while design of ship equipment contributed a value added of NOK 800 million. Productivity is highest among producers of elec-tronic equipment, each worker creating a value
14 %
67 %
Direct exports to companies abroad
Norwegian ship equipment48.3 bn NOK
Shipyards in Norway
Foreign shipping companies
Norwegian shipping companies
Activity in Norway
Activity abroad
Indirect exports via shipyard deliveries/other deliveries
Indirect exports via services supplied abroad
NOK 32.5 bn NOK 4.0 bn NOK 7.6 bn
45 %19 %
35 %
55 %65
%
FIGURE 9: The value chains of the ship equipment industry – with direct and indirect exports16, 2017. SOURCE: MENON ECONOMICS
16 The data is based on the survey conducted in conjunction with this report. The split between Norwegian and foreign shipping companies is based on an earlier survey conducted with yards in the Møre-region. There is some uncertainty around this spilt, as the Møre yards might not be representative of all yards in Norway.
NORWEGIAN MARITIME EQUIPMENT SUPPLIERS 201822
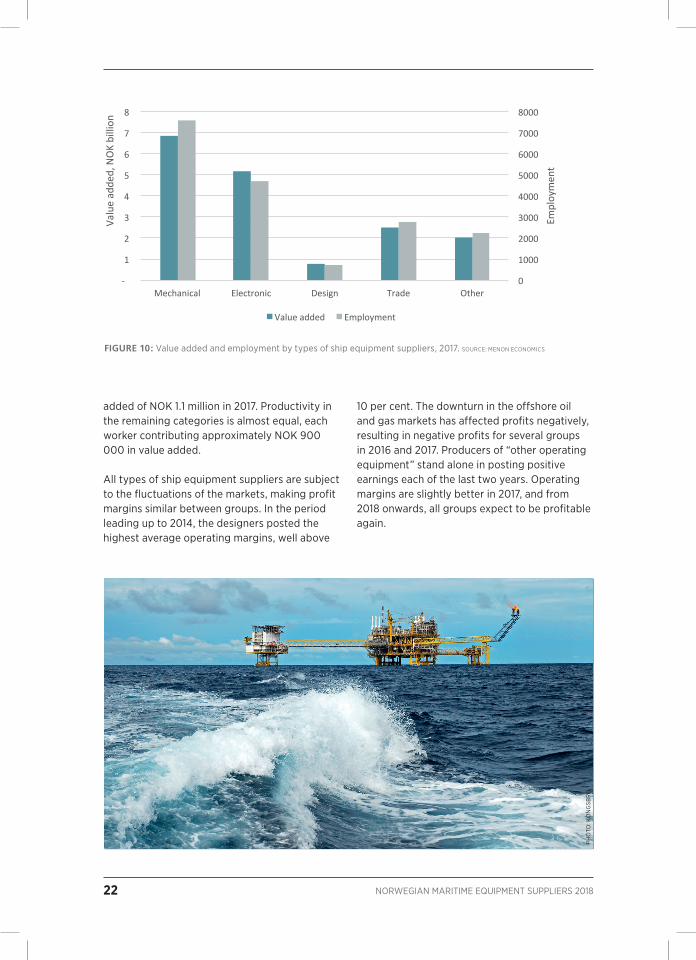
added of NOK 1.1 million in 2017. Productivity in the remaining categories is almost equal, each worker contributing approximately NOK 900 000 in value added.
All types of ship equipment suppliers are subject to the fluctuations of the markets, making profit margins similar between groups. In the period leading up to 2014, the designers posted the highest average operating margins, well above
10 per cent. The downturn in the offshore oil and gas markets has affected profits negatively, resulting in negative profits for several groups in 2016 and 2017. Producers of “other operating equipment” stand alone in posting positive earnings each of the last two years. Operating margins are slightly better in 2017, and from 2018 onwards, all groups expect to be profitable again.
0
1000
2000
3000
4000
5000
6000
7000
8000
-‐
1
2
3
4
5
6
7
8
Mechanical Electronic Design Trade Other
Employmen
t
Value adde
d, NOK billion
Value added Employment
FIGURE 10: Value added and employment by types of ship equipment suppliers, 2017. SOURCE: MENON ECONOMICS
PH
OTO
: KO
NG
SBR
G

23NORWEGIAN MARITIME EQUIPMENT SUPPLIERS 2018
5.5. Maritime focus varies among companiesThe maritime dependency varies between companies. Some companies focus solely on the maritime market, while others deliver products to a wide range of markets. Operations directed towards ship equipment production made up 53 per cent of total revenues for companies supply-ing ship equipment in 2017. Non-ship equipment contributes 39 per cent of income while drilling equipment contributes the remaining 8 per cent.
Sales of drilling equipment have been hardest hit by the downturn in the offshore markets, shedding 80 per cent of revenues from the peak in 2014. Revenue from ship equipment has proven much more stable than revenue from drilling equipment. The ratio of ship equipment to non-maritime equipment has gone down marginally over the last years, showing that other markets become more important for several of the com-panies when the maritime markets are tough.
-‐4 %
-‐2 %
0 %
2 %
4 %
6 %
8 %
10 %
12 %
14 %
16 %
2004-‐2010 2011-‐2014 2015 2016 2017
Ope
ra1n
g margin (EBIT)
Mechanical Electronic Design Trade Other
FIGURE 11: Operating margins by types of ship equipment, 2004-2017. SOURCE: MENON ECONOMICS
0 %
10 %
20 %
30 %
40 %
50 %
60 %
70 %
80 %
90 %
100 %
2004 2005 2006 2007 2008 2009 2010 2011 2012 2013 2014 2015 2016 2017
Ship equipment Non-‐mari<me equipment Drilling equipment
FIGURE 12: Distribution of revenues for ship equipment producers separated into ship equipment, drilling equipment and non-maritime equipment, 2004-2017. SOURCE: MENON ECONOMICS

NORWEGIAN MARITIME EQUIPMENT SUPPLIERS 201824
6. Appendix
6.1. Data registry and survey dataThe report is based on a registry of all Norwegian entities that deliver accounting information to the national Brønnøysund Register Centre. Changes from previous editions are related to changes in companies that are included or excluded. Minor changes in the numbers can occur due to updated financial information for historical data. Changes may also occur as some historical maritime shares have been updated based on new information. Official registries changed the way they counted an employee in 2015. As a result, employment numbers in 2014 and 2015 are not directly comparable. However, employment from 2015 and onwards is directly comparable.
The survey was sent out in September 2018 to about 400 respondents and received a total of 66 responses. In addition to responses gathered in this project, Menon has collected information from a large number of the GCE Blue Maritime Cluster through a similar survey in relation to another project. These survey responses are used for this project as well, bringing the total number of respondents to 87.
To assure ourselves that the survey was repre-sentative for the whole ship equipment industry, we focused on obtaining responses from all of the largest companies, since these dominate overall activity in the industry. We were mostly successful in doing so. For non-responders information has been gathered from alternative sources.
The subdivision into the various categories of ship equipment is made by the companies’ valuation (from the questionnaire), or, if this was not available, by industry codes and our knowledge of the companies.
Export data is mainly gathered through the survey but also combined with information from earlier studies Menon has completed.
6.2. Delimiting the maritime industryThe size and significance of any industry are determined by how it is defined, and a clear and concise definition which puts definite limits on what is to be included and what is to be excluded is of the essence. Menon developed the following definition of the maritime industry as part of the research project “A Knowledge-Based Maritime Industry” from 2011:
– All businesses that own, operate, design, build, supply equipment or specialist services to all types of ships and other floating entities
The report focuses on companies which satisfy the above definition and excludes producers of drilling equipment from the main population17. The remaining companies are in the report referred to as producers or suppliers of ship equipment.
17 Statistics Norway (SSB) includes drilling equipment in their definition of maritime equipment.

25NORWEGIAN MARITIME EQUIPMENT SUPPLIERS 2018
7. Geographical footprint
7.1. Employment and value added by county in 2017
-‐2
-‐1
-‐
1
2
3
4
Hordaland
Møre og Romsdal
Ves6old
Akershus
Buskerud
Rogaland
Oslo
Finnmark
Vest-‐Agder
Øs6old
Aust-‐Agder
Telemark
Rest of Norway
Value added, NOK billion
2017 10-‐year change FIGURE 14: Value added by county in 2017 and 10-year nominal change in value added. SOURCE: MENON ECONOMICS
County Employment 2017
Møre og Romsdal 4 000
Hordaland 3 300
Vestfold 1 800
Rogaland 1 500
Akershus 1 400
Buskerud 1 200
Oslo 900
Finnmark 800
Vest-Agder 800
County Employment 2017
Aust-Agder 600
Østfold 500
Telemark 400
Trøndelag 400
Nordland 200
Sogn og Fjordane 100
Troms 100
Hedmark 100
Oppland 100
FIGURE 13: Employment by county in 2017, rounded to the nearest 100. SOURCE: MENON ECONOMICS

NORWEGIAN MARITIME EQUIPMENT SUPPLIERS 201826
8. Historical results – Ship equipment
-‐4 %
-‐2 %
0 %
2 %
4 %
6 %
8 %
10 %
-‐40
-‐20
-‐
20
40
60
80
100
2004 2005 2006 2007 2008 2009 2010 2011 2012 2013 2014 2015 2016 2017
Reve
nue,
NO
K bi
llion
Revenue EBIT
-‐
5
10
15
20
25
30
2004 2005 2006 2007 2008 2009 2010 2011 2012 2013 2014 2015 2016 2017
Value adde
d, NOK billion
Wage EBITDA
FIGURE 15: - Revenue and operating margins for ship equipment producers, 2004-2017. SOURCE: MENON ECONOMICS
FIGURE 16: - Value added, divided into wage cost and EBITDA for ship equipment producers, 2004-2017. SOURCE: MENON ECONOMICS

27NORWEGIAN MARITIME EQUIPMENT SUPPLIERS 2018
9. Historical results by types of ship equipment
9.1. Mechanical equipment
-‐4 %
-‐2 %
0 %
2 %
4 %
6 %
8 %
10 %
-‐20
-‐10
0
10
20
30
40
2004 2006 2008 2010 2012 2014 2016
Oera/
ng m
argin (EBIT)
Value adde
d, NOK billion
Revenue EBIT
FIGURE 18: - Revenue and operating margins for producers of mechanical equipment, 2004-2017. SOURCE: MENON ECONOMICS
Subgroup Revenue Value added Operating margin Employment
Design 1,8 0,8 -0,9% 735
Other 10,6 2,0 1,3% 2 231
Trade 8,7 2,5 -2,2% 2 735
Electronic 14,6 5,2 0,4% 4 717
Mechanical 23,2 6,9 -0,6% 7 595
Ship equipment 58,9 17,3 -0,3% 18 013
FIGURE 17: Key numbers by types of ship equipment in 2017. SOURCE: MENON ECONOMICS

NORWEGIAN MARITIME EQUIPMENT SUPPLIERS 201828
9.2. Electrical and electronic equipment
0
2
4
6
8
10
12
2004 2005 2006 2007 2008 2009 2010 2011 2012 2013 2014 2015 2016 2017
Value adde
d, NOK billion
Wage cost EBITDA
-‐4 %
-‐2 %
0 %
2 %
4 %
6 %
8 %
10 %
-‐8
-‐4
0
4
8
12
16
20
2004 2006 2008 2010 2012 2014 2016 Ope
ra/n
g margin (EBIT)
Value adde
d, NOK billion
Revenue EBIT
FIGURE 19: Value added, divided into wage cost and EBITDA for producers of mechanical equipment, 2004-2017. SOURCE: MENON ECONOMICS
FIGURE 20: Revenue and operating margins for producers of electrical and electronic equipment, 2004-2017. SOURCE: MENON ECONOMICS

29NORWEGIAN MARITIME EQUIPMENT SUPPLIERS 2018
9.3. Other operating equipment
0
1
2
3
4
5
6
7
2004 2005 2006 2007 2008 2009 2010 2011 2012 2013 2014 2015 2016 2017
Value adde
d, NOK billion
Wage cost EBITDA
0 %
1 %
2 %
3 %
4 %
5 %
6 %
7 %
0
2
4
6
8
10
12
14
2004 2006 2008 2010 2012 2014 2016 Ope
ra1n
g margin (EBIT)
Value adde
d, NOK billion
Revenue EBIT
FIGURE 21: Value added, divided into wage cost and EBITDA for producers of electrical and electronic equipment, 2004-2017. SOURCE: MENON ECONOMICS
FIGURE 23: Value added, divided into wage cost and EBITDA for producers of other operating equipment, 2004-2017. SOURCE: MENON ECONOMICS
0,0
0,5
1,0
1,5
2,0
2,5
3,0
2004 2005 2006 2007 2008 2009 2010 2011 2012 2013 2014 2015 2016 2017
Value adde
d, NOK billion
Wage cost EBITDA
FIGURE 22: Revenue and operating margins for producers of other operating equipment, 2004-2017. SOURCE: MENON ECONOMICS

NORWEGIAN MARITIME EQUIPMENT SUPPLIERS 201830
9.4. Trade
-‐5 %
0 %
5 %
10 %
15 %
20 %
25 %
-‐3
0
3
6
9
12
15
2004 2006 2008 2010 2012 2014 2016 Ope
ra2n
g margin (EBIT)
Value adde
d, NOK billion
Revenue EBIT
0
1
2
3
4
5
6
2004 2005 2006 2007 2008 2009 2010 2011 2012 2013 2014 2015 2016 2017
Value adde
d, NOK billion
Wage cost EBITDA
FIGURE 24: Revenue and operating margins for traders of ship equipment, 2004-2017. SOURCE: MENON ECONOMICS
FIGURE 25: - Value added, divided into wage cost and EBITDA for traders of ship equipment, 2004-2017. SOURCE: MENON ECONOMICS
31NORWEGIAN MARITIME EQUIPMENT SUPPLIERS 2018
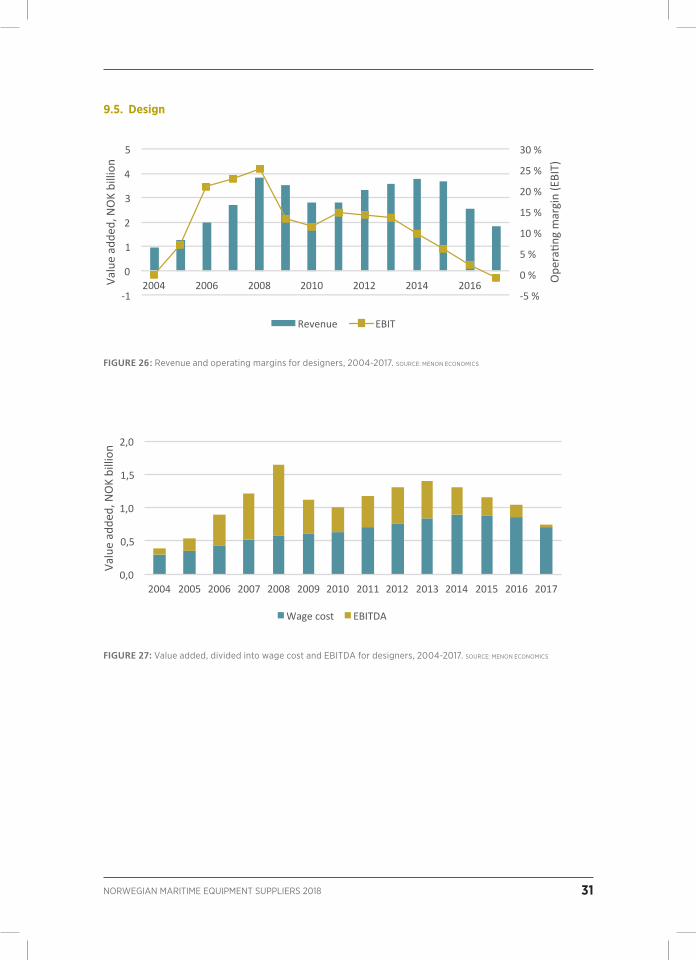
9.5. Design
-‐5 %
0 %
5 %
10 %
15 %
20 %
25 %
30 %
-‐1
0
1
2
3
4
5
2004 2006 2008 2010 2012 2014 2016 Ope
ra1n
g margin (EBIT)
Value adde
d, NOK billion
Revenue EBIT
0,0
0,5
1,0
1,5
2,0
2004 2005 2006 2007 2008 2009 2010 2011 2012 2013 2014 2015 2016 2017
Value adde
d, NOK billion
Wage cost EBITDA
FIGURE 26: Revenue and operating margins for designers, 2004-2017. SOURCE: MENON ECONOMICS
FIGURE 27: Value added, divided into wage cost and EBITDA for designers, 2004-2017. SOURCE: MENON ECONOMICS
NORSK INDUSTRI
FEDERATION OF NORWEGIAN INDUSTRIESNæringslivets Hus, Middelthuns gate 27P.O. Box 7072 Majorstuen, 0306 OsloNorwayTel. +47 23 08 88 [email protected]/NorskIndustri