Embed Size (px)
Citation preview
Europe’s best low-cost airline
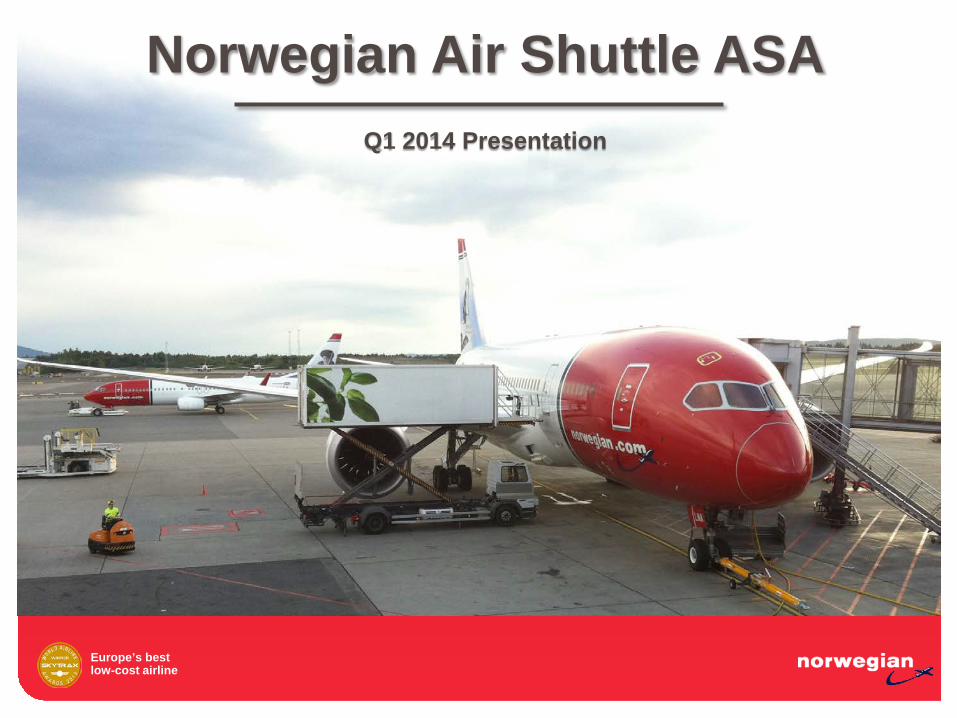
Norwegian Air Shuttle ASA Q1 2014 Presentation

Europe’s best low-cost airline
• Group revenues of MNOK 3,551 in Q1 2014
Double digit revenue growth in Q1
Revenues 1 895 2 360 2 904 3 551Domestic revenue 780 872 1 043 1 032% y.o.y. chg 10 % 12 % 20 % -1 %International revenue 1 115 1 488 1 861 2 519% y.o.y. chg 26 % 33 % 25 % 35 %
0
500
1 000
1 500
2 000
2 500
3 000
3 500
Q1 11 Q1 12 Q1 13 Q1 14
MN
OK
Domestic Revenue (MNOK)
International Revenue (MNOK
Total Revenues (MNOK)
+ 22 %
2

Europe’s best low-cost airline
Q1 14 Q1 13
EBITDAR MNOK -215 438
EBITDA MNOK -615 189
EBIT MNOK -777 69
Pre-tax profit (EBT) MNOK -813 -160
Net profit MNOK -595 -117
Seasonally weak Q1 influenced by capacity investment
Q1 11 Q1 12 Q1 13 Q1 14 Q1 11 Q1 12 Q1 13 Q1 14EBITDAR margin -12 % -11 % 15 % -6 % EBT margin -21 % -17 % -6 % -23 %
-230-252
438
-215
-350
-250
-150
-50
50
150
250
350
450
MN
OK
-406-398
-160
-813
-900
-800
-700
-600
-500
-400
-300
-200
-100
0
MN
OK
EBT development Q1 EBITDAR development Q1
3

Europe’s best low-cost airline
• Wet-lease on long-haul – Delayed delivery of Dreamliner #4
– Slow DOT approval process causes suboptimal scheduling
• Weak NOK vs. USD, EUR, GBP and SEK
• Unit revenue – Own capacity investment
– Competitive pressure to/from/within Norway
Operational and currency headwinds in Q1

Europe’s best low-cost airline Ancillary revenue remains a significant contributor
• Ancillary revenue comprises 15% of Q1 revenues
• NOK 110 per scheduled passenger (an increase of 25% from last year)
5

Europe’s best low-cost airline
● Cash flows from operations in Q1 14
● Cash flows from investing activities in Q1 14
● Cash flows from financing activities in Q1 14
● Cash and cash equivalents at period-end MNOK 3 160
MNOK 927
MNOK -1 034
MNOK 1 102 (MNOK 962)
(MNOK 158)
(MNOK -407)
(MNOK 2445)
CONDENSED CONSOLIDATED STATEMENT OF CASH FLOWUnaudited
Q1 Q1 YTD YTD Full Year Full Year(Amounts in NOK million ) 2014 2013 2014 2013 2013 2012
Net cash flows from operating activities 1 102 962 1 102 962 2 377 2 022
Net cash flows from investing activities -1 034 158 -1 034 158 -2 126 -2 766
Net cash flows from financial activities 927 -407 927 -407 184 1 369
Foreign exchange effect on cash -1 1 -1 1 0 0
Net change in cash and cash equivalents 994 714 994 714 435 626Cash and cash equivalents in beginning of period 2 166 1 731 2 166 1 731 1 731 1 105
Cash and cash equivalents in end of period 3 160 2 445 3 160 2 445 2 166 1 731
Net positive cash flow of one billion in Q1
6

Europe’s best low-cost airline
● Total balance of NOK 17.3 billion
● Net interest bearing debt NOK 4.2 billion
● Equity of NOK 2.1 billion at the end of Q1 14
● Group equity ratio of 12% (17%)
Five on-B/S aircraft delivered in seasonally weak Q1: Equity ratio affected by NOK 2.9 billion increase in non-current assets
2 445Cash3 160
1 952
Receivables2 448
8 814
Non-current assets
11 690
0
2 000
4 000
6 000
8 000
10 000
12 000
14 000
16 000
18 000
Q1 13 Q1 14
MN
OK
Equity2 119
2 304
Pre-sold tickets4 695 3 269
Othercurrent
liabilities3 049 2 904
Long term liabilities
7 434
4 736
Q1 14 Q1 13
7

Europe’s best low-cost airline Higher load in spite of 48% capacity increase
• 50% traffic growth
• Average flying distance up 15%
ASK 569 933 1 342 2 183 2 674 3 507 4 498 5 266 6 378 9 421
Load Factor 68.0 % 76.8 % 74.8 % 77.2 % 74.8 % 75.1 % 74.3 % 77.2 % 76.1 % 77.3 %
68.0 %
76.8 %74.8 %
77.2 %74.8 % 75.1 % 74.3 %
77.2 % 76.1 % 77.3 %
0
0.2
0.4
0.6
0.8
1
0
1 000
2 000
3 000
4 000
5 000
6 000
7 000
8 000
9 000
Q1 05 Q1 06 Q1 07 Q1 08 Q1 09 Q1 10 Q1 11 Q1 12 Q1 13 Q1 14
Load
Fact
or
Avai
labl
e Se
at K
M (A
SK)
ASK Load Factor+ 48 %
8
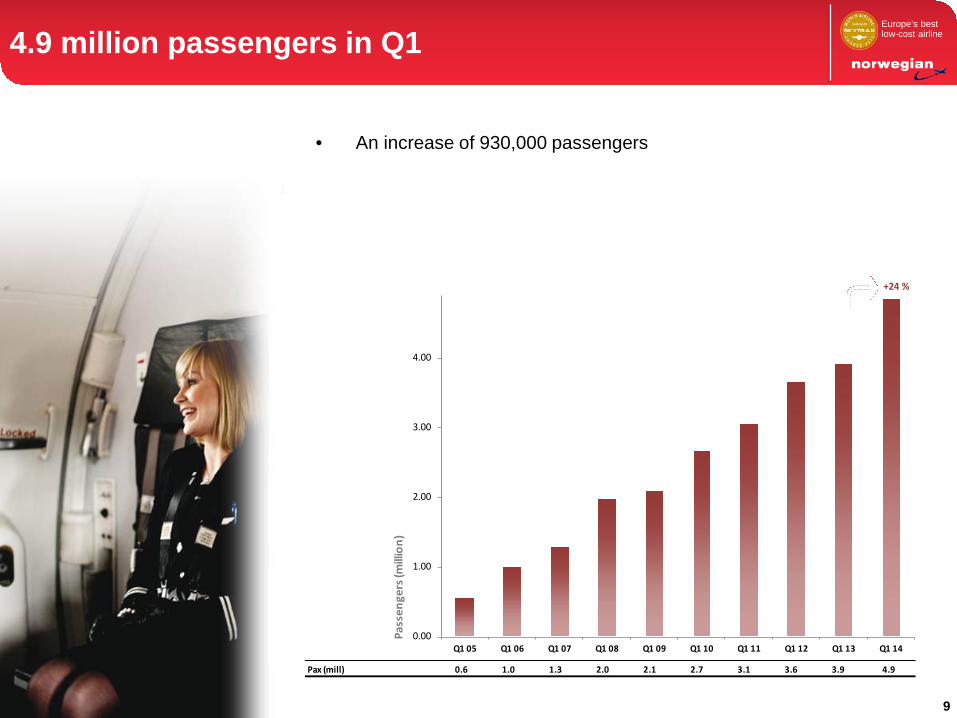
Europe’s best low-cost airline 4.9 million passengers in Q1
• An increase of 930,000 passengers
Pax (mill) 0.6 1.0 1.3 2.0 2.1 2.7 3.1 3.6 3.9 4.9
0.00
1.00
2.00
3.00
4.00
Q1 05 Q1 06 Q1 07 Q1 08 Q1 09 Q1 10 Q1 11 Q1 12 Q1 13 Q1 14
Pass
enge
rs (m
illio
n)
+24 %
9

Europe’s best low-cost airline
• Business model works – lower costs and prices attract volume
Strong demand: Growing market share in all markets
MarketshareOslo Airport
(OSL)
MarketshareStockholm Airport
(ARN)
MarketshareCopenhagen Airport
(CPH)
MarketshareHelsinki Airport
(HEL)
Marketshare Int'lGatwick Airport
(LGW)
Marketshare Int'lSpanish bases
(AGP, LPA, ALC, TFS)Q1 09 33 % 10 % 5 % 0 % 1 % 2 %Q1 10 37 % 11 % 10 % 0 % 4 % 3 %Q1 11 37 % 14 % 11 % 2 % 5 % 4 %Q1 12 36 % 18 % 12 % 8 % 6 % 6 %Q1 13 36 % 18 % 14 % 9 % 6 % 8 %Q1 14 39 % 23 % 15 % 12 % 10 % 11 %
0 %
5 %
10 %
15 %
20 %
25 %
30 %
35 %
40 %
+ 238,000 pax 91% of mkt growth
+ 291,000 pax69% of mkt growth
+ 109,000 pax50% of mkt growth
+ 98,000 pax59% of mkt growth
+ 227,000 pax52% of mkt growth
+ 236,000 pax41% of mkt growth
10

Europe’s best low-cost airline Norwegian’s short-haul seat growth in Scandinavia prudent
• Summer season 2014 seat growth in line with market
• Superior unit cost at primary airports allows larger than average growth
Source: OAG Aviation Worldwide Schedules Analyser. The graph depicts change in departing intra-Europe seat capacity from Scandinavian airports April 2014 – September 2014 as per April 30 2014.

Europe’s best low-cost airline
• Highest growth in departing capacity (ASK) from the USA
• Total growth high - but subtle share in all markets
Norwegian’s S14 capacity growth evenly distributed
Nor
weg
ian
ASK
Apr -
Sep

Europe’s best low-cost airline Lowest cost always wins
13
• Cost per available seat kilometer is an industry-wide cost level indicator often referred to as “CASK”. Usually represented as operating expenses before depreciation and amortization (EBITDA level) over produced seat kilometers (ASK). • Foreign exchange rates used are equivalent to the daily average rates corresponding to the reporting periods and as stated by the Central Bank of Norway • Note: For some carriers the available financial data represents Group level data which may include cost items from activities that are unrelated to airline operations. • Other losses / (gains) is not included in the CASK concept as it primarily contains hedge gains/losses offset under financial items* as well as other non-operational income and/or cost items such as gains on the sale of spare part inventory and unrealized foreign currency effects on receivables/payables and (hedges of operational expenses).
*Norwegian hedges USD/NOK to counter foreign currency risk exposure on USD denominated borrowings translated to the prevailing currency rate at each balance sheet date. Hedge gains and losses are according to IFRS recognized under operating expenses (other losses/ (gains) while foreign currency gains and losses from translation of USD denominated borrowings are recognized under financial items.
Sources: Norwegian Q1 2014 report (period displayed April 2013 – March 2014), SAS Interim Report November 2013 – January 2014, Scandinavian Airlines (SK) only from February 2013 – October 2013, SAS Group figures from November 2013 – January 2014 after divestment of Widerøe. Finnair Plc. Annual Report 2012 and Finnair Group Financial Statements Bulletin 2013 (period displayed January 2013 – December 2013), Ryanair Annual Report 2013 (period displayed April 2012 – March 2013), easyJet 2013 full year results statement and Annual Report 2013 (period displayed October 2012 – September 2013), Air Berlin Annual Report 2013, IAG Annual Report 2013 (period displayed for Vueling from April 26th 2013 to through December 2013) and Norwegian’s estimations.

Europe’s best low-cost airline
Cost per ASK (CASK) (NOK)CASK ex. fuel 0.37
0.50 0.450.32
0.470.360.50
0.33
0.370.36
0.330.32
0.12 0.15
0.15 0.14
0.25
0.30
0.35
0.40
0.45
0.50
Q1 11 Q1 12 Q1 13 Q1 14
Ope
ratin
g co
st E
BITD
A le
vel p
er A
SK (C
ASK)
Fuel share of CASK
CASK excl fuel
-4%
-3%
Unit cost at constant ccy and excl one-off down 9%
• Unit cost ex fuel down 4% - hampered by weak NOK & Long-Haul wet lease
• Unit cost including fuel down 3% - hampered by weak NOK & Long-Haul we tlease
Other losses / (gains) is not included in the CASK concept as it primarily contains hedge gains/losses offset under financial items* as well as other non-operational income and/or cost items such as gains on the sale of spare part inventory amd unrealized foreign currency effects on receivables/payables and (hedges of operational expenses). *Norwegian hedges USD/NOK to counter foreign currency risk exposure on USD denominated borrowings translated to the prevailing currency rate at each balance sheet date. Hedge gains and losses are according to IFRS recognized under operating expenses (other losses/ (gains) while foreign currency gains and losses from translation of USD denominated borrowings are recognized under financial items.
14

Europe’s best low-cost airline
• Uniform fleet of Boeing 737-800s • Overheads • 5 new 737-800 delivered in Q1 (13 y.o.y.)
Aiming for FY CASK NOK 0.25 excluding fuel
• Flying cost of 737-800 lower than 737-300 • 737-800 has 38 “free” seats • 0.3% lower unit fuel consumption in Q4
Scale economies New more efficient aircraft Growth adapted to int’l markets
Crew and aircraft utilization Optimized average stage length Automation
• Fixed costs divided by more ASKs • Frequency based costs divided by more ASKs • Q1 sector length up by 15 %
• Cost level adapted to local markets • Outsourcing/ Off-shoring
• Rostering and aircraft slings optimized • Q4 utilization of 10.9 BLH pr a/c (+0.4 BLH)
• Self check-in/ bag drop • Automated charter & group bookings • Streamlined operative systems & processes
15

Europe’s best low-cost airline Unit cost under control – further upside
– Phase-out 737-300 (Fuel, Tech, Handling, Airport/ATC & Personell)
– Phase-in Max / Neo / Dreamliner (Fuel & Tech)
– Larger scale (Overhead, Sales & distrib., Personell)
– Further automation (Overhead, Personell, Handling, Sales & distrib)
– Higher short-haul utilization (Leasing, Depreciation)
– Global operations (Personell, Handling, Airport, Overhead)
Cost
per
seat
per
KM
(NO
K)

Europe’s best low-cost airline Three additional aircraft:
A fleet of 17 Dreamliners by 2018
Three 787-8 on firm order Five 787-8 in operation Nine 787-9 on firm order
2014
2016
2015
2017
20
18

Europe’s best low-cost airline
2014:Re-deliveries 737-300
-740 seatsRe-deliveries 737-800
-558 seatsDeliveries 737-800
+2,604 seatsDeliveries 787-8
+1,164 seats
Current committed fleet plan
18

Europe’s best low-cost airline
• Business environment – Economic uncertainty in parts of Europe
– Seasonal fluctuations
– Yield pressure from capacity investment
– Increased competitive pressure in the Nordic region
• Production
– The company expects a production growth (ASK) of 40% (unchanged)
• Increasing the fleet by adding 737-800’s and 787-8’s
• Utilization and distance increase short-haul driven by UK and Spanish bases
• Expanding long-haul operations
– Capacity deployment depending on development in the overall economy and marketplace
• Cost development
– Unit cost expected in the area of 0.40 (unchanged)
• Excluding hedged volumes
• Fuel price dependent – USD 950 pr. ton
• Currency dependent ● USD/NOK 6.00 ● EUR/NOK 7.75 ●
• Production dependent
• Based on the currently planned route portfolio
Expectations for 2014 (Group)
19

From bases in NORWAY From bases in SWEDEN DENMARK
FINLAND
From the UK base From bases in SPAIN
From bases in the USA & THAILAND
Norwegian offers 417 scheduled routes to 126 destinations in
39 countries


![Annual Report 2004 - Norwegian · 2015-06-29 · Annual report 2004 [Translation from the original Norwegian version] Norwegian Air Shuttle ASA 3 Norwegian’s strategy is to establish](https://img.dokumen.tips/doc/110x75/5f4ad0df100ba36d2251b0c7/annual-report-2004-norwegian-2015-06-29-annual-report-2004-translation-from.jpg)