Embed Size (px)
Citation preview

NORTHWESTERN UNIVERSITY
An Examination of the Relationship Between Speech Perception and Production
A DISSERTATION
SUBMITTED TO THE GRADUATE SCHOOL IN PARTIAL FULFILLMENT OF THE REQUIREMENTS
for the degree
DOCTOR OF PHILOSOPHY
Field of Linguistics
By
Melissa Michaud Baese-Berk
EVANSTON, ILLINOIS
December 2010

2
© Copyright by Melissa Michaud Baese-Berk 2010
All Rights Reserved
3
ABSTRACT
An Examination of the Relationship Between Speech Perception and Production
Melissa Michaud Baese-Berk
In order to successfully learn a language, people must master aspects of both speech
perception and speech production. However, the nature of the relationship between these two
modalities is not clear. There are a wide range of possibilities regarding the nature of this
relationship. These range on a continuum ranging from a single, tightly coupled system for both
modalities to a system in which the modalities are strictly separate in terms of representations
and processes. Previous research has examined this topic with mixed results. Some evidence
demonstrating that transfer across the two modalities is very fast suggests that the systems are
tightly coupled, if not identical (e.g., Goldinger, 1998). Other studies demonstrate dissociations
between the two modalities, which suggest that the systems do not share representations (e.g.,
Warker et al. 2008). My dissertation aims to address the question of how the two modalities are
related to one another during early stages of learning a new sound contrast.
To address the relationship between speech perception and production during the earliest stages
of learning, I examine learning of new sound categories after a brief training paradigm. I
manipulated training modality and examined how training modality affects learning in each
modality in a series of three experiments. Participants who were trained in perception only
demonstrate robust perceptual learning, and small, but significant changes in production.
Participants who were trained in perception and production demonstrate no changes in
perception after two days of training; however, they demonstrate robust learning in production.
Differences between the two types of training in perceptual learning were alleviated by a third
day of training; however, differences in production learning persisted. These results suggest that

4
the relationship between the two modalities is complicated, and that neither extreme of the
continuum discussed above can account for the wide range of results.

5
ACKNOWLEDGMENTS I can’t imagine having completed this dissertation without massive amounts of support from the
people listed below.
Matt Goldrick taught me everything I know about speech production and most things that
I know about research in general. Anything that is good about this dissertation is because of
him. He has taught me how to do research, how to write, how to advise students, and how to
apply for grants, among other things. When I entered graduate school, I was a violinist, and
thanks to Matt’s superb mentoring, I’m leaving graduate school a scientist. Thank you, Matt, for
your patience, intelligence, and all of your assistance for the past few years.
Ann Bradlow and Jessica Maye are the other two members of my committee, and both
have provided invaluable support for me. Ann showed me how to do speech perception
research, and Jessica’s work inspired large portions of this dissertation. Great thanks go to both
of them.
Many other members of the linguistics and cognitive science community at Northwestern
have made graduate school an incredibly rewarding experience for me, including: Rachel Baker,
Susanne Brouwer, Marc Ettlinger, Jordana Heller, Tyler Kendall, Nattalia Paterson, Charlotte
Vaughn, Kristin Van Engen (my department big sister). Many ideas in this thesis come from
long hours of discussion with these people who I am happy to call my friends. Several
undergraduate research assistants supported this work, and earlier projects, including Tim
Poepsel and Amanda Murphy. I have huge amounts of gratitude for Sarah Gregory who helped
run subjects and measure voice onset time – all without complaint. Thanks to the 108
participants who completed this (really boring) experiment.

6
My family and friends outside the department have always supported me, even when they
have no idea what I’m doing with my time. Thanks to my extended family, the Michauds and
the Baeses. Thanks especially to my grandparents, Terry and Doris Michaud and Eldon and Jean
Baese for their support. Thanks to my friends from BU for talking to me about baseball, hockey,
and musical theater, the choir at Our Lady of Mount Carmel and the Old Town School of Folk
Music for giving me a place to sing, and my friends in Chicago for reminding me that there is
life outside of my dissertation. Thank you to my mother- and father-in-law, Ken and Laura Berk
– I am so lucky to have in-laws who understand academia and support me in all of my
adventures.
Special thanks go to my parents, Mary and Dennis Baese. They supported me when I
was a violin major in college, and when I announced I would be double majoring in violin and
linguistics they (unlike the rest of the world) never once asked “what are you going to do that?”
They have been unendingly supportive of me. I cannot thank them enough.
Finally, thanks to Peter, who has been nothing short of perfect. You have been the best
support and the best friend I could have ever dreamed of. Thanks.
7
CONTENTS Abstract ......................................................................................................................................3 Acknowledgements.....................................................................................................................5 Table of Contents........................................................................................................................7 List of Figures .......................................................................................................................... 11 List of Tables............................................................................................................................ 15
Chapter 1 .................................................................................................................................. 16
1.1 Introduction .................................................................................................................... 16 1.2 Perceptual Learning ........................................................................................................ 23 1.3 Production learning......................................................................................................... 28 1.4 The relationship of perception and production................................................................. 32
1.4.1 The influence of perception on production in shadowing and imitation tasks ............ 33 1.4.2 The influence of perception on production: Training studies..................................... 36 1.4.3 The relationship of perception and production of non-native contrasts...................... 37 1.4.4 Relationship of perception and production in aphasic patients .................................. 38 1.4.5 The influence of production on perception during learning ....................................... 39 1.4.6 Interim summary ...................................................................................................... 41
1.5 Statistical Learning ......................................................................................................... 41 1.6 Rationale Behind Experiments ........................................................................................ 43 1.7 Overview ........................................................................................................................ 44
Chapter 2 .................................................................................................................................. 46
2.1 Introduction .................................................................................................................... 46 2.2 Methods – Perception-Only Training............................................................................... 47
2.2.1 Participants............................................................................................................... 47 2.2.2 Stimuli ..................................................................................................................... 48
2.2.2.1 Synthesis of Stimuli........................................................................................... 48 2.3 Procedure........................................................................................................................ 51
2.3.1 Training ................................................................................................................... 52 2.3.2 Testing ..................................................................................................................... 57
2.3.2.1 Discrimination Test ........................................................................................... 57 2.3.2.2 Categorization test ............................................................................................. 59 2.3.2.3 Repetition Test .................................................................................................. 60 2.3.2.4 Naming Test ...................................................................................................... 61 2.3.2.5 Training and Testing regimen ............................................................................ 63
2.4 Results ............................................................................................................................ 64 2.4.1 Discrimination Test .................................................................................................. 64
2.4.1.1 Predictions......................................................................................................... 64 2.4.1.2 Analysis............................................................................................................. 64 2.4.1.3 Sensitivity.......................................................................................................... 65 2.4.1.4 Interim Discrimination Sensitivity ..................................................................... 70

8
2.4.2 Categorization .......................................................................................................... 73 2.4.2.1 Predictions......................................................................................................... 73 2.4.2.2 Analysis............................................................................................................. 74 2.4.2.3 Accuracy ........................................................................................................... 75 2.4.2.4 Reaction Times.................................................................................................. 77
2.4.3 Repetition................................................................................................................. 80 2.4.3.1 Predictions......................................................................................................... 80 2.4.3.2 Analysis............................................................................................................. 80 2.4.3.3 Repetition.......................................................................................................... 81
2.4.4 Naming .................................................................................................................... 89 2.4.4.1 Predictions......................................................................................................... 89 2.4.4.2 Analysis............................................................................................................. 89 2.4.4.3 Naming results................................................................................................... 90
2.5 Conclusions .................................................................................................................... 90 Chapter 3 .................................................................................................................................. 92
3.1 Introduction .................................................................................................................... 92 3.2 Methods: Perception + Production training and testing................................................... 93
3.2.1 Participants............................................................................................................... 94 3.2.2 Stimuli ..................................................................................................................... 94
3.3 Procedure........................................................................................................................ 95 3.3.1 Training ................................................................................................................... 95 3.3.2 Testing ..................................................................................................................... 96 3.3.3 Training and Testing regimen................................................................................... 96
3.4 Results ............................................................................................................................ 97 3.4.1 Discrimination Test .................................................................................................. 97
3.4.1.1 Predictions......................................................................................................... 97 3.4.1.2 Analysis............................................................................................................. 97 3.4.1.3 Sensitivity.......................................................................................................... 98 3.4.1.4 Comparison of Sensitivity in Experiment 1 and Experiment 2.......................... 102 3.4.1.5 Interim Discrimination Sensitivity ................................................................... 105
3.4.2 Categorization ........................................................................................................ 110 3.4.2.1 Predictions....................................................................................................... 110 3.4.2.2 Analysis........................................................................................................... 111 3.4.2.3 Accuracy ......................................................................................................... 111 3.4.2.4 Reaction Time ................................................................................................. 113 3.4.2.4 Comparison of Categorization in Experiments 1 and 2..................................... 116
3.4.3 Repetition............................................................................................................... 117 3.4.3.1 Predictions....................................................................................................... 117 3.4.3.2 Analysis........................................................................................................... 118 3.4.3.3 Repetition........................................................................................................ 119 3.4.3.4 Comparison of repetition performance in Experiments 1 and 2 ........................ 127 3.4.3.5 Mixed tokens and tokens with pauses .............................................................. 128
....................................................................................................................................... 129

9
3.4.4 Naming .................................................................................................................. 129 3.4.4.1 Predictions....................................................................................................... 129 3.4.4.2 Analysis........................................................................................................... 130 3.4.4.3 Naming results................................................................................................. 130
3.5 Conclusions .................................................................................................................. 131 Chapter 4 ................................................................................................................................ 133
4.1 Introduction .................................................................................................................. 133 4.2 Methods: Three day training.......................................................................................... 134
4.2.1 Participants............................................................................................................. 134 4.2.2 Stimuli ................................................................................................................... 135
4.3 Procedure...................................................................................................................... 135 4.3.1 Training ................................................................................................................. 136 4.3.2 Testing ................................................................................................................... 136 4.3.3 Training and Testing regimen................................................................................. 137
4.4 Results .......................................................................................................................... 137 4.4.1 Discrimination Test ................................................................................................ 137
4.4.1.1 Predictions....................................................................................................... 137 4.4.1.2 Analysis........................................................................................................... 138 4.4.1.3 Sensitivity........................................................................................................ 138 4.4.1.4 Interim Training Discrimination ...................................................................... 144
4.4.2 Categorization ........................................................................................................ 146 4.4.2.1 Predictions....................................................................................................... 146 4.4.2.2 Analysis........................................................................................................... 147 4.4.2.3 Accuracy ......................................................................................................... 147 4.4.2.4 Reaction Time ................................................................................................. 149
4.4.3 Repetition............................................................................................................... 150 4.4.3.1 Predictions....................................................................................................... 150 4.4.3.2 Analysis........................................................................................................... 151 4.4.3.3 Repetition........................................................................................................ 152
4.4.4 Naming .................................................................................................................. 155 4.4.4.1 Predictions....................................................................................................... 155 4.4.4.2 Analysis........................................................................................................... 155 4.4.4.3 Naming results................................................................................................. 156
4.5 Conclusions .................................................................................................................. 156 Chapter 5 ................................................................................................................................ 158
5.1 Introduction .................................................................................................................. 158 5.2 Summary....................................................................................................................... 158 5.3 Discussion..................................................................................................................... 161
5.3.1 Perceptual Learning................................................................................................ 161 5.3.2 Production Learning............................................................................................... 166 5.3.3 The relationship of perception and production ........................................................ 167

10
5.3.4 A possible account of the data ................................................................................ 171 5.4 Future Research ............................................................................................................ 173
5.4.1 Why does production disrupt perceptual learning?.................................................. 173 5.4.2 Emergence of learning............................................................................................ 174 5.4.3 The relationship of perception and production at later stages of learning................. 176 5.4.4 Perception and production in ecologically valid situations ...................................... 177
5.5 Summary....................................................................................................................... 178 REFERENCES....................................................................................................................... 180 APPENDICES........................................................................................................................ 189 APPENDIX A: Picture sets for training and breakdown of picture assignments ..................... 189
Picture Set A:.................................................................................................................. 190 Picture Set B: .................................................................................................................. 190 Picture assignment chart for six subjects in unimodal and bimodal training groups ......... 190 Notes regarding picture assignment................................................................................. 191
APPENDIX B: Instructions for Training................................................................................ 192
Perception Only .............................................................................................................. 192 Perception+Production.................................................................................................... 192
APPENDIX C: Instructions for Tests..................................................................................... 194
Discrimination ................................................................................................................ 194 Repetition ....................................................................................................................... 194 Categorization................................................................................................................. 194 Naming ........................................................................................................................... 195 Multiple Talker Training with Speaker Identification ...................................................... 196 Single Talker Training (No target task) ........................................................................... 199 Single Talker Training with the Addition of Visual Stimuli............................................. 200

11
LIST OF FIGURES
Figure 2.1: An example distribution of tokens per block for the bimodal group. The x-axis shows each point on the continuum, and the y-axis represents the number of presentations per-block. Ovals are used to show comparisons that are used in the discrimination test. The pictures above tokens 2 and 7 are example pictures used for a particular continuum. The dotted line down the center of the graph (between tokens 4 and 5) demonstrates where the continuum was divided for the pictures. ............................................................................ 54
Figure 2.2 An example distribution of tokens per block for the bimodal group. The x-axis shows
each point on the continuum, and the y-axis represents the number of presentations per-block. Ovals are used to show comparisons that are used in the discrimination test. The picture above tokens 4 and 5 are example pictures used for a particular continuum. .......... 55
Figure 2.3 d' scores for participants before training. Error bars represent standard error. ......... 66 Figure 2.4 Participants’ d' scores after two days of training. Error bars represent standard error.
......................................................................................................................................... 67 Figure 2.5 Individual performance on across-category comparisons for bimodal training
participants. ...................................................................................................................... 69 Figure 2.6. Across category discrimination for participants in the bimodal perception-only
training group at pre- and post-test on both training days................................................... 72 Figure 2.7 Unimodal perception-only training discrimination at pre- and post-tests on each day73 Figure 2.8 Proportion of tokens that were scored as correct for the bimodal and unimodal
training groups for near and far tokens (error bars denote standard error). ......................... 76 Figure 2.9 Average reaction times for each training group on correct responses to far and near
tokens (error bars denote standard error). .......................................................................... 78 Figure 2.10 Correlation between categorization and discrimination performance. Bimodal
training group participants’ categorization performance is shown on the x-axis and their discrimination performance (at Day 2 post-test) is shown on the y-axis. ............................ 79
Figure 2.11 Average voice onset time for short lag tokens produced by the unimodal training
group before and after training (error bars denote standard error). No differences are significant. ........................................................................................................................ 82
Figure 2.12 Average voice onset time for short lag tokens produced by the bimodal training
group before and after training (error bars denote standard error). ..................................... 82

12
Figure 2.13 Vowel duration for short lag tokens produced by the unimodal training group before and after training............................................................................................................... 84
Figure 2.14 Vowel duration for short lag tokens produced by the bimodal training group before
and after training............................................................................................................... 84 Figure 2.15 Ratio of VOT and vowel duration for short lag tokens produced by the unimodal
training group before and after training. ............................................................................ 85 Figure 2.16 Ratio of VOT and vowel duration for short lag produced by the bimodal training
group before and after training. ......................................................................................... 85 Figure 2.17 Proportion of tokens that were produced with prevoicing for the unimodal training
group before and after training. ......................................................................................... 86 Figure 2.18 Proportion of tokens that were produced with prevoicing for the bimodal training
group before and after training. ......................................................................................... 87 Figure 2.19 Day 2 Discrimination and the amount of difference between tokens 1 and 8 in
production. Discrimination is shown in d' and the production data is shown in VOT (seconds)........................................................................................................................... 88
Figure 3.1 d' scores for participants before training. Error bars represent standard error. .......... 98 Figure 3.2 Participants’ d' scores after two days of training. Error bars represent standard error.
......................................................................................................................................... 99 Figure 3.3: Individual performance on across-category comparisons for bimodal training
participants. .................................................................................................................... 101 Figure 3.4 Individual performance on across-category comparisons for the unimodal training
participants. .................................................................................................................... 101 Figure 3.6. Bimodal perception-only training group discrimination at pre- and post-tests on each
day. ................................................................................................................................. 107 Figure 3.7 Unimodal perception-only training discrimination at pre- and post-tests on each day
....................................................................................................................................... 108 Figure 3.8. Bimodal perception+production training group discrimination at pre- and post-test
on each day. .................................................................................................................... 109 Figure 3.9. Unimodal perception+production training group discrimination at pre- and post-test
on each day. .................................................................................................................... 110
13
Figure 3.10 Proportion correct scores for the bimodal and unimodal training groups for near and far tokens. ....................................................................................................................... 112
Figure 3.11 Average reaction times for each training group on correct responses to far and near
tokens. ............................................................................................................................ 114 Figure 3.12 Correlation between performance in discrimination and categorization. Participants
categorization performance is shown on the x-axis and their discrimination performance (at Day 2 post-test) is shown on the y-axis............................................................................ 115
Figure 3.13 Average voice onset time for the unimodal training group before and after training.
....................................................................................................................................... 119 Figure 3.14 Average voice onset time for the bimodal training group before and after training.
....................................................................................................................................... 120 Figure 3.15 Vowel duration for short lag tokens produced by the bimodal training group before
and after training............................................................................................................. 121 Figure 3.16 Vowel duration for short lag tokens produced by the unimodal training group before
and after training............................................................................................................. 122 Figure 3.17 Proportion of VOT and vowel duration for short lag tokens produced by the
unimodal training group before and after training............................................................ 122 Figure 3.18 Proportion of VOT and vowel duration for short lag tokens produced by the
unimodal training group before and after training............................................................ 123 Figure 3.19 Proportion of tokens that were produced with prevoicing for the unimodal training
group before and after training. ....................................................................................... 124 Figure 3.20 Proportion of tokens that were produced with prevoicing for the bimodal training
group before and after training. ....................................................................................... 124 Figure 3.21 Discrimination Day 2 performance and Difference between tokens 8 and 1 on Day 2
....................................................................................................................................... 126 Figure 3.22 Proportion of tokens produced with correct prevoicing or mixed prevoicing and
aspiration for participants on day 1 and day 2. Figure collapses across training group (i.e., bimodal and unimodal) and all test tokens (i.e., tokens 1, 3, 6, and 8).............................. 129
Figure 4.1 d' scores for participants before training. Error bars represent standard error. ....... 139 Figure 4.2 Participants’ d' scores after two and three days of training. Error bars represent
standard error. ................................................................................................................. 139

14
Figure 4.3 Individual performance on across-category comparisons for bimodal perception-only
training participants......................................................................................................... 142 Figure 4.4 Individual performance on across-category comparisons for bimodal
perception+production training participants. Note: ‘*’ indicates participants who fail to discriminate across-category tokens after 3 days of training. ........................................... 142
Figure 4.5 Discrimination sensitivity at pre- and post-test across all three days of training for the
perception-only training group. ....................................................................................... 145 Figure 4.6 Discrimination sensitivity at pre- and post-test across all three days of training for the
perception+production training group.............................................................................. 146 Figure 4.7 Percent correct scores for the bimodal perception-only training group and the bimodal
perception+production training group for near and far tokens. Error bars represent standard error. ............................................................................................................................... 148
Figure 4.8 Average reaction times for each training group on correct responses to far and near
tokens. ............................................................................................................................ 149 Figure 4.9 Average voice onset times for the bimodal perception-only training group and the
bimodal perception+production training group. No differences are significant. .............. 152 Figure 4.10 Proportion of tokens that were produced with prevoicing for the bimodal training
group before and after training. ....................................................................................... 153

15
LIST OF TABLES
Table 2.1: Beginning and ending formant values for each of the end point tokens..................... 50 Table 2.2 Average step size for first and second formants for each continuum ......................... 50 Table 2.3 The order of testing and training blocks for each day................................................ 63 Table 3.1 Model comparison statistics for categorization accuracy as a function of discrimination
performance.................................................................................................................... 115 Table A.1 d' values for pilot subjects when visual stimuli are added to reinforce training
distributions .................................................................................................................... 201

16
CHAPTER 1
1.1 Introduction
In order to successfully learn a particular language, a learner must be able to discover
what the sound categories of that language are. A learner must determine what variation in the
acoustic stream is meaningful and what is not. Typically, variation within a single sound
category is not informative in determining which sound contrasts are used in a language.
Alternately, variation between categories is informative and must be learned in order to
successfully learn the target language. For instance, variation between /r/ and /l/ is informative
to English speakers, but the variation found in English is within a single category for native
speakers of Japanese (Goto, 1971). The same amount of variation is across-category and
meaningful in one language and within-category and not meaningful in another.
Much is known about category formation in both first and second languages. For
example, several researchers have demonstrated that in the laboratory listeners are able to form
novel perceptual categories after a relatively short period of exposure (e.g., Bradlow, Akahane-
Yamada, Pisoni, & Tohkura, 1999; Bradlow, Pisoni, Akahane-Yamada & Tohkura, 1997; Hayes,
2003; Maye & Gerken, 2000, 2001). In contrast to this extensive work in category formation in
perception, little research has examined the relationship of this learning to learning in speech
production.
When the question of learning in speech production has been examined, it has often been
looked at from the direction of perceptual training. These studies have asked how, after listeners
are trained in perception, their productions of the trained material are affected (e.g., Bradlow et
al., 1999; Bradlow et al., 1997; Jamieson & Rvachew, 1992, 1994; Rochet, 1995; Rvachew,

17
1994; Rvachew, Nowak, & Cloutier, 2004). While these studies often control for within-
experiment exposure to stimuli, they often test and train subjects on stimuli that they already
have some familiarity with. Furthermore, they fail to examine how production experience
impacts learning in either modality. Other studies have examined both perception and
production of non-native contrasts by second language learners who do not receive any explicit
training as part of the experiment (e.g., Flege, 1993; Flege & Davidian, 1984; Flege &
Hillenbrand, 1984). However, these studies lack control for participants’ exposure to the tokens
before they are tested on their perception and production abilities, and often examine
participants’ abilities in each modality after they have had significant experience with the target
language (i.e., participants have often had several years of experience speaking their second
language when they participate in these studies).
This dissertation aims to address several of the open questions remaining in how novel
sound categories are formed and accessed in both perception and production after a brief period
of implicit training. Specifically, I focus on the roles of training modality (i.e., speech perception
or speech production) and sensitivity to input statistics (i.e., sensitivity to the properties of the
input which follow specific distributional patterns) in the formation of novel phonological
categories. Previous work has shown that input statistics play a critical role in the formation of
perceptual categories in both adults and infants (Jusczyk & Luce, 1994; Maye & Gerken, 2000;
Saffran, Aslin, & Newport, 1996). This project examines interaction between production and
perception during learning of a novel contrast by manipulating training modality and testing in
each modality after a very brief period of exposure to the novel contrast.
A variety of theories have predicted how second language learning should proceed,
including the Perceptual Assimilation Model (PAM) (Best, 1994, 1995; Best & McRoberts,

18
2003), the Speech Learning Model (SLM) (Flege, 1995, 2003), and the Native Language Magnet
Model (Iverson & Kuhl, 1995, 1996; Kuhl 2000). Each of these theories makes unique
predictions about how non-natives will learn novel contrasts. One commonality among these
theories is that they predict that languages will be learned through the lens of the learner's first
language. That is, our ability to learn a new contrast is shaped by the contrasts we already know.
The Perceptual Assimilation Model (PAM) suggests that new contrasts are directly
compared to existing contrasts and the ease (or difficulty) with which we learn these contrasts is
directly shaped by the similarity of these contrasts to our current contrasts. Specifically, PAM
makes very strong predictions regarding discrimination across novel categories. PAM predicts
that contrasts are processed based on their relationship to contrasts in the listener's native
language. For instance, sounds that are assimilated into two separate native categories should be
discriminated rather well, even if one of the sounds is a relatively poor exemplar of that category.
On the other hand, sounds that are assimilated to a single category, or sounds that are not
assimilated into a native category at all may be more difficult to discriminate between. PAM is
also driven by the hypothesis of direct realism (Best, 1995; Fowler, 1986). This theory suggests
that listeners use gestures as the basis of speech perception. While PAM itself does not make
strong claims regarding production of novel contrasts, it does posit that speech perception and
production share representations. Because of this general claim, one is able to infer that learning
in one modality should be strongly correlated to learning in the other modality. Because PAM
posits a very close relationship between the two modalities, it must be the case that learning in
each modality will be correlated under this model.
Like PAM, Flege's Speech Learning Model (SLM) predicts that listeners will learn a
novel language through the lens of their first language. Specifically, SLM predicts that similar

19
phonemes will be assimilated into a "composite category." A process of assimilation and
dissimilation over the course of learning results in learning of non-native categories. SLM also
makes very strong claims about the relationship of perception and production during learning.
Specifically, it is claimed that perception leads production (always occurring first in terms of
learning), and that perception and production become closer to one another over the course of
learning.
The Native Language Magnet Model (NLM) focuses primarily on the perception within
categories. This theory operates within an audio acoustic theory of speech perception (e.g.,
Diehl & Kluender, 1989; Stevens & Blumstein, 1981) which suggest that speech perception does
not involve perception of speech gestures, but rather of acoustics, contrary to the claims of direct
realism. These theories require that perception and production be linked at another level of
representation, since articulatory and acoustic codes used during the latest stages of production
and earliest stages of perception are distinct from each other. The Native Language Magnet
model largely addresses how experience with a novel category alters the perceptual space in
which we classify sounds. As learners are exposed to a novel contrast that is within a current
contrast in their native language, the "prototype" within this category shifts, resulting in
improved discrimination. As in PAM, NLM makes no explicit claims regarding production and
its relationship to perception. However, one can assume that because of the foundation of this
theory in audio-acoustic theories of speech perception, it is likely that this theory could account
for data showing dissociations in learning between perception and production.
There are several cognitive mechanisms that could underlie the relationship between
speech perception and production and result in the types of systems like those proposed above.
Martin & Saffran (2002) suggest several types of theories that could be appealed to in an attempt

20
to understand the relationship between perception and production that could be translated to
learning of novel categories. They propose theories at either end of a continuum, which ranges
from a single, strongly coupled system to separate, independent representations in perception and
production. On one end of the continuum is a theory in which perception and production are part
of a strongly coupled system, such as the direct realist theory and PAM. In this type of system,
the modalities would share representations, processes, and/or resources; this type of theory is
strongly compatible with direct realist theoretic views of speech perception and production.
Under this hypothesis, both modalities should be strongly coupled, with learning that occurs in
one modality also occurring in the other.
In the case of totally separate and independent representations in perception and
production, aspects of language that affect both modalities in the same way would be mediated
by higher levels of representations, rather than sharing of representations, processes or resources,
and could encompass audio-acoustic theories of perception and production.
Of course, a wide range of possibilities lay along the continuum between these two
endpoints, and within each of the perspectives laid out above the relationship between the two
modalites could take several forms in terms of learning novel categories. If the two modalities
have separate representations, but share processes or resources, this relationship may result in
several different types of patterns, particularly with regard to learning in the two modalities. It is
possible that perceptual category formation must always precede category formation in
production, as suggested by Flege's SLM. This would suggest that production is relies on
perception; that is, the relationship is parasitic between the two modalities. Second, it is possible
that the two modalities develop categories in parallel. This would suggest that production and
perception have a non-parasitic relationship. Either the two modalities help each other during

21
learning, which would suggest a great benefit of training in the opposite modality, or they are
independent, not directly influencing the other modality during learning. The first approach in
which the two modalities help each other during learning is appropriate for PAM, since the two
modalities are assumed to be very tightly coupled in this theory. Both of these types of
relationships can be accommodated by models like NLM, since these theories make no direct
claims about how the two modalities are related. SLM could also account for this type of pattern
since it is possible perceptual representations were formed before production representations;
they are just being tested after the two modalities become more closely linked.
An outcome not directly predicted by any of the above models would be an antagonistic
relationship between the two modalities, in which training in one modality could actually hinder
development in the opposite modality. This relationship would pose the largest challenge for
PAM, since it predicts productions are the basis for perception. Producing tokens should not
hinder perceptual learning, for example, under those theories. This type of theory could be
accounted for by both SLM and NLM, however. Each of these hypotheses make different
predictions for how category formation during the initial stages of learning in one modality will
be influenced not only by the trained modality, but also by training in the other modality.
The primary question in this dissertation is: how do perception and production interact
during the initial phases of phonetic category formation after implicit training? A series of three
experiments address this question, and related questions including: how does short-term implicit
training affect category formation, how does training modality influence learning in each
modality on the short term, and what is the time course of learning and transfer in the two
modalities during the initial phases of learning.
22
The questions addressed in this dissertation are of critical importance for several reasons.
This examination will aid in understanding the mechanisms of interaction between perception
and production during the earliest stages learning of novel sound categories. By understanding
how training in one modality affects learning in the opposite modality, we not only gain insight
into how these novel categories are formed in each modality, but also have a better
understanding of how speech perception and speech production are connected at the earliest
stages of learning novel sound categories.
These findings will be significant in both theoretical and applied domains. Having a
better understanding of how categories are formed will help inform theories of learning for both
first- and second-language learners. Understanding how speech perception and production are
related during learning will be informative in the development of models of speech processing in
both modalities. In the applied domain, understanding how perception and production interface
in the initial stages of category learning, may be beneficial for second-language teachers.
Teachers may be able to fine-tune their pedagogy to take advantage of any links between the two
modalities. Furthermore, clinicians and speech-language pathologists would benefit from a
better understanding of how the two modalities interact when learning (or re-learning) novel
categories. For instance, if patients have an impairment in speech production, they may be able
to use their intact perceptual abilities to re-train the impaired modality.
In the sections that follow, I outline the current knowledge regarding perceptual learning
of novel sound categories. Following this, I address the question of learning in speech
production. Then, I discuss the relationship between perception and production, not only in
terms of learning novel sound categories but also what is known about the relationship of the two

23
modalities more generally. Finally, I discuss how input statistics affect category learning in
speech.
1.2 Perceptual Learning
One of the hallmarks in the perception of sounds in one’s native language is categorical
perception. An example of categorical perception occurs with voice onset time (VOT), which is
the amount of time between the release of a stop consonant and the onset of periodic voicing of
the vowel. This contrast differentiates /t/ from /d/ in English (Lisker and Abramson, 1964). In
English, this difference is meaningful. That is, there are English words that are only
distinguished by containing one of these two sounds (e.g., "tab" and "dab" are different words in
English). Along this acoustic-phonetic continuum speakers show good discrimination when
contrasting sounds belonging to two categories in their language, but reduced discrimination
when the sounds are within a single category (Liberman, Harris, Hoffman, & Griffith, 1957;
Studdert-Kennedy, Liberman, Harris, & Cooper, 1970). Additionally, speakers of a language are
also typically consistent when categorizing consonants from their native language along a
continuum, with a sharp boundary dividing their categorizations on one side of the continuum
from the other. Liberman et al. (1957) examine participants abilities to discriminate and
categorize voiced stop consonants /b/, /d/, and /g/ in English. Their findings demonstrate that,
relative to a participant’s categorization boundary, discrimination ability is good across this
boundary, but relatively poor within a category. Although discrimination and categorization are
thought to tap into different levels of processing (a phonetic, fine grained level and a
phonological, more abstract level, respectively; e.g., Liberman et al., 1957), behavior on these
24
tasks is complementary (see, however, Schouten, Gerrits, & van Hessen, 2003, for a discussion
of the limitations on the coupling of discrimination and categorization performance).
Categorization and discrimination of sounds that are not contrastive in a listener’s native
language mirrors that of perception in a participants native language. For example, native
English listeners are able to categorize and discriminate tokens from an /r/ - /l/ continuum, a
contrast which is meaningful in their native language. However, Japanese listeners demonstrate
poor discrimination between those same sounds, since the distinction is not meaningful in their
native language (e.g., Goto, 1971). That is, their perception is reliant on the category structure of
their language (e.g., Best, McRoberts, & Sithole, 1988; Kuhl, Williams, Lacerda, Stevens, &
Lindblom, 1992; Liberman et al., 1957; Pegg, Werker, Ferguson, Menn, & Stoel-Gammon,
1992; Werker & Tees, 1984; Werker, Gilbert, Humphrey, & Tees, 1981).
A large number of studies over the past twenty years have sought to examine how
flexible a listener’s ability to discriminate and categorize is, both within their native language
and with regard to non-native contrasts. It is well known that languages do not place category
boundaries in the same place, even for phonemically similar contrasts (Lisker & Abramson,
1964). Across individual speakers within a single language, category boundaries may not be
identical (Repp & Liberman, 1987). Because perceptual category boundaries are not necessarily
identical across or within a language, it may be possible that the category boundary can be
moved after a period of exposure to a shifted category boundary. This raises the question, can
perceptual learning occur in speech? Studies in perceptual learning of speech have branched in
two directions: the first examines the flexibility of category boundaries within a listener’s native
language, and the second investigates the ability to gain (or re-gain) perceptual discrimination

25
ability for a non-native contrast (see Samuel & Kraljic, 2009 for a recent review of both types of
perceptual learning).
With regard to flexibility within a listener’s native language, many studies have focused
on “perceptual retuning.” Several studies have demonstrated that listener’s perceptual category
boundaries can shift after exposure that includes a different distribution, or implies a different
category boundary, than the listener uses in a pre-test. Techniques for inducing a perceptual shift
include presenting ambiguous items within unambiguous lexical contexts (e.g., Norris,
McQueen, & Cutler, 2003; Leach & Samuel, 2007) and presenting ambiguous auditory
information with disambiguating visual information (e.g., Bertelson, Vroomen, & de Gelder,
2003). Subsequent studies have shown that this perceptual retuning tends to generalize to novel
words (e.g., Leach & Samuel, 2007; but see VanDam, 2007, for a counter-example with voice
onset time) and seem to be relatively long-lasting (e.g., Kraljic & Samuel, 2005; Kraljic &
Samuel, 2007). However, it is unclear whether this learning is speaker specific (Kraljic &
Samuel, 2007) and if learning is affected by context (e.g., part of a speakers dialect, Kraljic,
Brennan, & Samuel, 2008). Most of the work on these shifts has examined consonants.
However, Maye, Aslin, & Tanenhaus (2008) examined shifts in vowel perception. They
demonstrated that participants shifted their perception specifically toward the tokens they were
exposed to, rather than just increasing the size of the category they were willing to accept as a
specific vowel.
Clarke-Davidson, Luce, & Sawusch (2008) examine whether this type of perceptual
learning is truly a perceptual change, or merely a shift in decision bias (which may occur after
perceptual processes). Using both discrimination and categorization processes, rather than only a
categorization task as in many of the aforementioned studies, they found complementary results

26
in both tasks, suggesting that perceptual learning is truly perceptual, possibly implying a shift in
representations.
The aforementioned work suggests that category structure for sounds a listener already
perceives as different is flexible. There is also a significant body of literature suggesting that
influence of the category structure of a listener’s first language seems to be rather flexible
throughout life, with listener’s first losing the ability to distinguish between non-native contrasts,
and later after training possibly being able to regain this ability. At a very early age, infants are
able to discriminate relatively well between a wide variety of phonetic contrasts, both native and
non-native. During the first year of life infants begin to perceive native language phonemic
contrasts more categorically and become less sensitive to those contrasts in other languages.
Werker & Tees (1984) examined perception of native and non-native contrasts in Hindi and
Thompson by native, English infants at various ages. They demonstrated that while infants
between 6-8 months of age were able to equally discriminate between native and non-native
contrasts, infants between 10-12 months of age were unable to discriminate between the non-
native contrast, but were still consistently discriminating the native contrast. An examination of
infants whose native languages were either Hindi or Thompson (an Interior Salish language)
demonstrates that the decline in performance was not due to a general decline in perceptual
ability, but more likely a function of the native language. By adulthood, listeners are typically
insensitive to most contrasts not found in their native language MacKain, Best, & Strange
(1981).
A recent body of work by Kuhl and colleagues demonstrate that this pattern of
development is not followed for all contrasts within a language. Infants are unable to
discriminate some very difficult contrasts at early ages, but develop the ability to discriminate

27
between these contrasts as they get older (Tsao, Liu, & Kuhl, 2006). This suggests that in
addition to "tuning out" irrelevant dimensions during learning, infants also "tune in" to relevant
(and difficult) dimensions during learning.
Furthermore, with training, listeners are able to increase their sensitivity to contrasts that
are not found in their native language (Strange & Dittman, 1984; Werker & Tees, 1984). In the
laboratory, various methods have been used to train non-native listeners on the perception of
novel phonetic contrasts (for a recent review, see Iverson, Hazan, & Bannister, 2005). These
investigations have looked at a variety of segments: Japanese listeners’ perception of English /r/
and /l/ (e.g., Logan, Lively, & Pisoni, 1991), English listeners’ perception of a three-way voicing
contrast (e.g., McClaskey, Pisoni, & Carrell, 1983; Tremblay, Kraus, Carrell, & McGee, 1997),
English listeners’ perception of German vowels (e.g., Kingston, 2003), Spanish and German
listeners’ perception of English vowels (e.g., Iverson & Evans, 2009), and English listeners’
perception of Mandarin tones (e.g., Wang, Spence, Jongman, & Sereno, 1999).
However, for many of the contrasts studied, similarity of the contrasting sounds to sounds
in the native language is not controlled. Best et al. (1988) demonstrate that native English
listeners are actually quite good at discriminating between Zulu clicks, and suggest that
similarity to sounds in a native language could affect ability to discriminate. Pegg & Werker
(1997) control for this factor by presenting participants with a continuum of tokens ranging from
a voiced, unaspirated stop to a voiceless, unaspirated stop, the endpoints of which were both
judged by native English speakers as equally good tokens of a voiced alveolar stop in English.
Additionally, both of these stops occur in naturally, though not contrastively, in English.
Therefore, native English listeners actually have significant experience with both sounds. They
demonstrated that 6-8 month old infants were able to discriminate this contrast, but 10-12 month
28
old infants were unable to discriminate these sounds. Additionally, native English adult listeners
also demonstrated poor discrimination ability, in spite of having significant experience with the
sounds in their native language. This suggests that a contrast between sounds may be necessary
to maintain discrimination abilities.
Additionally, researchers have examined the perception of second language phonemes by
non-native speakers who were exposed to another language outside of the laboratory (e.g., Flege,
1993). These studies have demonstrated that adults are able to learn novel distinctions that do
not exist in their native language. However, most of the aforementioned studies have used
feedback to explicitly instruct participants with regard to the number of categories they should be
forming, and even what those categories are. Additionally, all but a few of these studies (e.g.,
Bradlow et al., 1997; Bradlow et al., 1999; Flege, 1993) have not examined changes in
production in any way.
Taken together, studies of perceptual learning demonstrate that the perceptual abilities of
listeners are rather flexible. A listener’s category boundaries within their native language can be
shifted. Additionally, listeners are able to learn how to discriminate between new contrasts after
a relatively short amount of explicit training or after longer, naturalistic exposure to stimuli.
1.3 Production learning
Work in perceptual learning has a relatively robust history, which has resulted in a much
larger body of literature than that regarding learning in speech production. However, some work
has demonstrated that changes in production are possible. I will review three types of studies
that demonstrate that production learning exists: production of non-native speech contrasts,

29
phonotactic learning studies, and expressive word learning. In all of these studies the findings
suggest that the production system is flexible enough to result in rather robust learning after a
relatively short period of exposure.
Several studies have examined learning in production of novel sound categories. Some
studies have examined the affect of perceptual training on production changes (e.g., (Bradlow et
al., 1997; Bradlow et al., 1999). Others have examined a speaker’s production abilities in their
second language (L2) not after training, but after an extended period of experience with their
second language (e.g., Birdsong, 2007; Bongaerts, 1999; Flege, 1993; Flege & Davidian, 1984;
Flege & Hillenbrand, 1984).
Bradlow et al. (1997) examine productions of /r/ and /l/ by Japanese speakers who
underwent a perceptual training regimen. Not only did participants demonstrate improvement in
perception, but their productions of the novel tokens improved significantly from pre- to post-
test, even though no overt productions were included in the training regimen. They take this as
evidence for transfer from perception to production, although the correlation between perceptual
learning and production learning for individual subjects is not strong. These results, and their
implications for the relationship between perception and production will be discussed in the
section below.
Bongaerts (1999) and Birdsong (2007) both examine French pronunciation by late
learners of French (Dutch and English native speakers, respectively). Both studies demonstrate
that speakers are able to achieve a relatively high level of native-like pronunciation, as
determined by native judges or acoustic measures. Flege (1993) demonstrates that native
Chinese speakers who learned English during childhood did not differ significantly from native
speakers in their productions of word-final /t/ and /d/. While late learners showed the correct

30
pattern in differences between the two consonants, their differences were not as large as those of
native speakers, suggesting that they have not fully learned to produce the contrast. Flege &
Hillenbrand (1984) demonstrate that English learners of French are able to successfully produce
some phonemes, but not others. They interpret this as evidence that the structure of the native
language (and how perception of L2 maps onto the L1) influences learning in production.
When speaking a language, speakers adhere to the phonotactic constraints (i.e.,
constraints on the order and placement sounds within words and syllables) of that language.
Several recent studies have demonstrated that participants are able to acquire novel phonotactic
constraints after a brief period of exposure. It has been demonstrated that speech errors typically
adhere to phonotactic constraints in a language. Dell, Reed, Adams, & Meyer (2000)
demonstrate that after a brief exposure to a new set of phonotactic constraints (e.g., /f/ always
occurs in coda position), participant’s speech errors adhered to these new constraints. This
occurred regardless of whether participants were explicitly instructed about these new
constraints, suggesting that participants were able to implicitly learn novel phonotactic
constraints.
Goldrick (2004) examined categorical segmental constraints (e.g., /f/ always occurs in
coda position) and gradient featural constraints (e.g., labiodental fricatives occur in coda 75% of
the time and in onset 25% of the time). Participant’s speech errors reflected both types of
constraints. Goldrick & Larson (2008) found that participants could acquire gradient segmental
constraints as well. Warker & Dell (2006) demonstrate that listeners are not only able to learn
first-order constraints (such as those discussed above), but also second-order constraints (e.g., /k/
can only occur in onset position when the vowel is /i/). Onishi, Chambers, & Fisher (2002) also
demonstrate the ability to learn second-order phonotactic constraints; however, they
31
demonstrated that the ability to learn second-order constraints is restricted. Participants could
learn second-order constraints when the regularity was contingent on another segment, but not
when they were contingent on a specific speaker’s voice. These studies demonstrate that
speaker’s productions reflect newly learned phonotactic constraints, ranging from relatively
simple constraints to much more complex constraints, and from categorical constraints to more
gradient constraints. These findings suggest that phonotactic learning is possible after a
relatively short period of exposure.
In another line of research, several studies have examined word learning. Participants are
trained on novel words, and then tested on some factor of the new word, often being able to use
the word in production, but also in terms of how that word affects the representations of existing
words. Of particular interest in this study is participants' ability to produce the novel words after
training. Researchers have demonstrated that a wide variety of factors influence expressive word
learning.
It is well known that verbal working memory influences word learning (Baddeley,
Gathercole, & Papagno, 1998). Papagno, Valentine, & Baddeley (1991) demonstrate that when
verbal working memory is increased via articulatory suppression (i.e., repeating unrelated words
out loud during word learning), expressive word learning is disrupted. However, Duyck,
Szmalec, Kemps, & Vandierendonck (2003) suggest that this effect is mediated when visual
information is presented with the novel word. That is, even after articulatory suppression,
expressive word learning is robust if the target words are paired with pictures.
In addition to working memory, expressive word learning is sensitive to linguistic factors.
Storkel, Armbrüster, & Hogan (2006) examine whether lexical and phonological processing
influence expressive word learning in different ways. They specifically examine the roles of

32
phonotactic probability (e.g., how likely a particular phoneme is to occur in a specific position or
next to another phoneme) and neighborhood density (e.g., how many words are phonetically
similar to a target word by the addition, deletion or substitution of a single phoneme) on new
word learning. They demonstrate that participants show sensitivity to both types of information
during word learning at different points during the process. They suggest that early learning may
be particularly sensitive to phonotactic probability, a phonological process. On the other hand,
later learning (including integrating the new representation with existing representations) is
sensitive to neighborhood density, a lexical process.
Abbs, Gupta, & Khetarpal (2008) address whether participants must overtly repeat words
in order to learn them. They demonstrate that overt repetition does not seem necessary for
expressive word learning. Not only does this appear to be true for expressive word learning
broadly (i.e., participants learn target-referent pairings), but also in terms of the phonological
form of the word (i.e., participants learn sequences of phonemes in the absence of a target-
referent pairing). This suggests that production per se may not be necessary for learning in
production to occur.
Between the phonotactic learning studies, expressive word learning study, and non-native
production studies, it is clear that the production system is flexible enough to result in changes
after learning. However, there are restrictions in terms of what speakers can learn to produce.
1.4 The relationship of perception and production
Until this point, I have examined perceptual learning and production learning in relative
isolation of the opposite modality. However, it is clear that at some point in the cognitive
33
system, speech perception and speech production are linked, since speakers can produce and
comprehend the speech in their native language. However, it is not clear how or where these
systems are linked. This is particularly true when examining the initial stages of learning novel
phonological categories. Understanding the nature of this connection is integral to the
understanding of category formation since successful category learning in real world language
use involves both modalities. Furthermore, understanding this connection is vital to creation of
models to explain language production and comprehension more broadly.
Previous results from work specifically examining the relationship between perception
and production, specifically regarding their interaction during learning, have been mixed. Some
work has shown transfer between the two modalities on relatively short time scales, while longer
training studies have often demonstrated asymmetries between learning in perception and
production.
1.4.1 The influence of perception on production in shadowing and imitation tasks
In order for training in one modality to have a rapid effect on learning in the other
modality, there must be robust, on-line mechanisms that link processing in these two modalities
in some way. Using imitation and shadowing (i.e., direct repetition without instruction for
imitation), Goldinger (1998) and Goldinger, Cutler, McQueen, & Zondervan (2000)
demonstrated that tokens produced after exposure to a perceptual target are judged to be
perceptually more similar to the target word than baseline productions (i.e., productions made
before any exposure to the target speaker). This is relevant to the relationship between perception
and production, as it shows that phonetic properties that are perceived can affect phonetic

34
properties that are produced on a very short time-scale. Goldinger & Azuma (2004)
demonstrated that productions six days after initial exposures are also judged to be more similar
to the target than baseline productions; however, this longer term shadowing effect was only
statistically significant for low-frequency words.
Shockley, Sabadini, & Fowler (2004) demonstrated that not only are shadowed words
judged to be more perceptually similar to target words, but that specific acoustic properties of
speakers’ shadowed tokens actually shift toward shadowed targets. When shadowing words with
lengthened voice onset times (VOTs), speakers produce tokens with lengthened VOTs compared
to their baseline productions. This also suggests that on a fairly short time scale, fine-grained
properties of perception can be transferred to production. Several other studies (e.g., Nye &
Fowler, 2003; Vallabha & Tuller, 2004, Submitted) have further examined the acoustic
properties of shadowed speech, demonstrating that in shadowed speech some properties of the
perceptual tokens can transfer to production.
In an examination of what types of phonetic properties are imitated during shadowing,
Mitterer & Ernestus (2008) suggest that only ‘phonologically relevant’ properties are shadowed,
and ‘phonologically irrelevant’ properties are not. Specifically, they suggest that pre-voicing is
shadowed generally (compared to short-lag voicing), but the amount of pre-voicing is not
shadowed. However, using a combination of shadowing and short-term training, Nielsen (In
Preparation) demonstrates that individuals shift their productions of VOT (a ‘phonetically
irrelevant’ contrast under Mitterer & Ernestus’s definition) to be closer to that of a target voice
without any explicit instruction.
Furthermore, shadowing seems to be dependent on other factors. Babel (2009, Under
Review) demonstrates that participants’ willingness to shadow vowels spoken by a target speaker
35
varies as a function of the vowel, and also were affected by social measures, including how the
speaker felt about the target talker. Brouwer, Mitterer, & Huetting (2010) examine shadowing of
canonical and reduced tokens and find that participants’ shadow both types of tokens, but do not
shadow the magnitude of difference between canonical and reduced tokens. Both of these
studies suggest that shadowing and accommodation may be limited and may depend on any
number of factors.
In a more naturalistic task, Pardo (2006) examined the relationship between speech
perception and speech production via phonetic convergence during conversations. Using
perceptual similarity ratings by naïve listeners, she has demonstrated that during a dialogue
speakers change their speech to be more similar to that of their partner.
These studies provide evidence that speakers are able to modify their own productions
based on the perceptual properties of incoming speech, which could be interpreted as evidence
that perceptual category learning precedes production learning. This evidence is also consistent
with a synergistic relationship between the two modalities. That is, when something is learned in
one modality, it may help learning in the other modality. However, there are methodological and
theoretical issues in interpreting these findings. Only some of the studies assess similarity of the
produced and perceived tokens based on acoustic measurements (Mitterer & Ernestus, 2008;
Nielsen, In Preparation; Shockley et al., 2004; Vallabha & Tuller, 2004, Submitted); the rest rely
instead on listeners’ perceptual similarity judgments. While this sort of judgment implies that
there are changes in production, it is not the case that any acoustic property has been measured to
demonstrate that productions are actually closer to the target tokens. More critically, although
these studies demonstrate that there are links that result in robust transfer between perception and
production, it is still unclear if these links influence learning.

36
1.4.2 The influence of perception on production: Training studies.
Training studies move beyond simple imitation of phonetic properties of perceptually
presented targets to examine the retention and generalization of perceptual experience on
production. One set of such studies has examined short-term learning of novel phonotactic
constraints, such as those discussed above in Section 1.3. It has been demonstrated that
production latency can be affected by novel phonotactic constraints learned during perception
(Onishi et al., 2002). However, it is unclear whether this effect is truly production-internal since
repetition necessarily involves perceptual processes. Furthermore, transfer of phonotactic
constraints does not always occur and learning of these constraints in perception can be disrupted
by production of a conflicting set of phonotactic constraints (Warker, Dell, Whalen, & Gereg,
2008; Warker, Xu, Dell, & Fisher, 2009).
In studies examining long-term learning of novel categories, modality specific effects
also emerge. For example, Bradlow et al. (1997) demonstrated that, overall, native Japanese
speakers’ ability to produce a novel phonemic contrast (i.e., English /r/ and /l/) did improve after
perceptual training of the contrast. However, the improvement in the two modalities for
individual subjects was not highly correlated. That is, improvement in the perception of the
contrast did not correlate with improvement in the production of the contrast (though overall
group ability in both modalities improved). Additionally, initial ability in either modality did not
correlate with the amount of improvement seen in the opposite modality. Studies such as these
are discussed in more detail in section 1.4.3.

37
In the clinical domain, there is some evidence that perception training can affect
production. Rvachew (1994) and Rvachew et al. (2004) demonstrated that training in the
perceptual modality can enhance production abilities of impaired children. The suggestion in
this work is that some speech production problems can be attributed to weak representations of
perceptual categories. By strengthening those perceptual representations, productions of tokens
can also benefit. However, these changes in production were judged using an extremely small
sample and several changes were not statistically significant. Additionally, the improvement in
production is only for isolated productions and does not generalize to production more generally
(e.g., during conversation).
1.4.3 The relationship of perception and production of non-native contrasts
Studies of non-native contrasts have shown mixed results. Bent (2005) examined
perception and production of Mandarin tones by naïve, native English listeners. She found that
participants’ abilities to perceive and produce the tone distinctions were not correlated. This
finding contrasts with that of Wang, Jongman, & Sereno (2003) who demonstrate a correlation
between participants’ perception and production of Mandarin tones. However, the listeners in
the Wang et al. study were trained on the contrast and had experience with the contrast before
training as well, and the listeners in Bent (2005) were not trained.
When examining learning in perception and production, Sheldon & Strange (1982)
examined Japanese learners of English and found that their productions of /r/ and /l/ were
occasionally significantly better than their ability to perceive those differences, suggesting that
production can occasionally precede perception. Flege (1993) found similar results in his

38
examination of Mandarin learners of English. He failed to find a correlation between individual
participants’ perception and production abilities. However, he still interprets his data as
supporting a hypothesis in which perceptual acuity must precede changes in production, since
group performance did demonstrate better perception than production abilities. Flege, Bohn and
Jang (1997) demonstrates a very small, but significant correlation between perception and
production of English vowels by several groups of non-native speakers; however, this study
examined speakers who had significant previous exposure to English.
In more recent work, De Jong, Hao, & Park (2009) examine Korean learners of English.
They also failed to find strong correlations between participants’ perception and production
abilities, and suggest that the units of acquisition of perception and production may be different.
DeKeyser & Sokalski (2001) arrive at a similar conclusion after observing a lack of correlation
between perception and production abilities of Spanish clitics and conditionals. Rochet (1995)
also demonstrates a lack of correlation between perception and production abilities of French
voice-onset times by native Mandarin speakers.
1.4.4 Relationship of perception and production in aphasic patients
While not directly related to learning, several studies have examined the relationship of
input and output phonology in aphasic patients. These studies are important to consider here
because they suggest that there are links between the two modalities which can result in transfer.
However, they also suggest that the two modalities can function in relative isolation, with
dissociations occurring between the two modalties. Some have demonstrated dissociations
between the input and output buffer (e.g., Martin, Lesch, & Bartha, 1999; Nickels & Howard,
1995; Romani, 1992), since they find patients with deficits in perception who do not have

39
deficits in production and vice-versa. Martin & Saffran (2002), on the other hand, find
associative patterns between input and output. While these opposing findings seem problematic
for any discussion of how speech perception are related, Martin and Saffran suggest that several
types of theories (ranging from separate, independent processing and representations in
perception and production, to a single or strongly coupled system) can account for this data by
attributing the dissociative and associative patterns to different levels of representation or
locations of processing.
1.4.5 The influence of production on perception during learning
As reviewed above, the bulk of existing studies have examined the influence of
perception on production. The likely cause of this is that it is impossible to completely isolate
speech production. Speech production necessarily contains a perceptual component as well; that
is, you perceive your own speech when you are producing it. Additionally, it is difficult to
imagine production training without a perception component. Asking a participant to imitate a
novel contrast without hearing any tokens of the contrast would also be nearly impossible. Two
studies have directly assessed the effect of production training on perception.
Hattori (2009) examines the perception and production of /r/ and /l/ by native Japanese
speakers. He found that the baseline abilities in perception and production of the contrast was
not highly correlated. He then trained listeners using articulatory, production-oriented training.
He found that speakers’ productions of the contrast improved significantly according to a variety
of measures. However, their perception was unchanged after this training. This finding
contrasts with that of Leather (1990), who trained Dutch participants on the production of four

40
Mandarin words differing in tone. After training in production, he found that participants
generalized this learning to perception. However, the author concedes that this result is not
conclusive as only one syllable was used during training and testing. Furthermore, it is unclear
whether the participants were able to perceive this contrast before training.
Other studies have addressed this question by comparing perception training alone to
training of perception combined with production training. Some of these studies have reported
that adding speech production to training can enhance learning in perception. Leach & Samuel
(2007) showed that adding a production task to an existing perceptual training task changed
participants’ ability to perceive the contrast relative to perceptual training alone. Their
experiments test both lexical configuration and lexical engagement. They define lexical
configuration as knowing the facts about a word (e.g., how it is pronounced). Lexical
engagement, on the other hand, is knowing how the word interacts with other words in the
lexicon. It is well-known that words interact with other words in the lexicon in both perception
(Luce & Pisoni, 1998; Marslen-Wilson , 1987) and production (Vitevitch, 2002). This property
of words is dynamic; as new words enter the lexicon, they impact processing of related forms
(Gaskell & Dumay, 2003). They found that perception in lexical configuration tasks (e.g.,
identification of words in noise) was enhanced by production training. However, Leach &
Samuel also found that perception in lexical engagement tasks (e.g., lexically-driven perceptual
learning, testing how an ambiguous token is perceived) was hindered by production training.
Furthermore, Kraljic et al. (2008a); Kraljic & Samuel (Under Review) and Kraljic, Samuel, &
Brennan (2008b) demonstrate that perceptual learning does not directly transfer to production,
and that productions can disrupt perceptual learning.
41
1.4.6 Interim summary
Shadowing and imitation studies show clear evidence of interaction between perception
and production, suggesting that perception and production have fast-acting links between them
that can result in transfer. However, it is clear that modality-specific effects do occur at the
phonetic level in training tasks, in second language learning more broadly, and in data from
aphasic patients. In such tasks, transfer between the two modalities is inconsistent and training
in one modality can interfere, rather than bolster, training in the opposite modality. This
suggests the relationship between perception and production learning is not necessarily helpful
all the time. That is, learning in one modality does not always help learning in the other
modality. Overall, the inconclusive findings of previous studies makes it clear that a further
examination of how speech perception and production are related during the learning of novel
phonetic categories is necessary. In the next section, I will discuss the tool used in the present
study to examine the relationship between perception and production: statistical learning.
1.5 Statistical Learning
Statistical learning studies have provided a means to examine novel category formation
under slightly more naturalistic, though still controlled, laboratory training studies. Saffran et al.
(1996) and Saffran, Johnson, Aslin, & Newport (1999) have demonstrated that infants and adults
are sensitive to, and able to learn from, the distributions of word boundaries presented to them in
a language. Specifically, using only the statistical properties of the input, listeners are able to
learn word segmentation in a novel pseudo-language.

42
Maye & Gerken (2000, 2001) extended these findings to a phonetic training paradigm
with adults, which examines the listener’s ability to learn novel phonetic categories from the
distribution properties of the input. To investigate the formation of novel categories, they tested
participants’ categorical perception of new sounds to determine whether new categories could be
learned based only on the distribution of those categories, without any specific instruction with
regard to the number or types of categories to be formed. Participants were exposed to nine
minutes of syllables in a new pseudo-language. Stimuli were created along a phonetic
continuum and then presented in either a unimodal or a bimodal distribution, such that
participants were either exposed to one category (unimodal distribution) or to two categories
(bimodal) from the same continuum during training. At the end of the training period, they were
tested with a discrimination task. Participants in the bimodal group were able to better
discriminate the trained contrast than participants in the unimodal group. That is, the participants
in the bimodal group demonstrated categorical perception of two new categories.
This finding suggests that listeners are sensitive to distributional information in the input,
which can help them form novel categories in perception. Maye, Werker, & Gerken (2002)
demonstrate that infants are also able to perform this task, suggesting that such a mechanism may
be used to learn novel categories in both first and second language acquisition.
Further examinations of statistical learning have demonstrated that a variety of
information interacts with perceptual learning using distributional information. Hayes-Harb,
2007 and Hayes (2003) demonstrate that statistical information in the input interacts with lexical-
information during learning. By adding pictures to a continuum that either reinforced or
disrupted the distributional information, learning patterns were changed. Similarly, Thiessen
(2010) examines the relationship between auditory statistical information and visual information.

43
He found that visual information aided in the processing of the auditory information. Toro,
Sinnet, & Soto-Faraco (2005) demonstrate that statistical learning is disrupted when attentional
load is increased. Fernandes & Kolinsky (2010) also demonstrate that an increased attentional
load disrupts segmentation of speech via statistical learning, but another type of learning
(segmentation via co-articulation) is not.
Statistical and distributional information is a means of achieving implicit perceptual
learning. It is also an ideal tool for examining the relationship between perception and
production for several reasons. First, because participants are trained implicitly, no explicit
instruction about the sound categories is needed during training. This allows us to better equate
for training in perception and production. Second, thus far, no one has looked at the effect of
distributional information on speech production (regardless of training modality); thus, this
paradigm allows us to address that question as well.
1.6 Rationale Behind Experiments
In this dissertation, I use insights from statistical learning paradigms to examine the links
between perception and production during category formation. Statistical learning provides a
unique lens to view this problem. Although it is possible that explicitly defining categories for
participants would yield the same results, using an implicit learning paradigm allows for
examination of more naturalistic learning, even in a laboratory setting. Furthermore, much less
is known about short-term implicit training than short-term explicit training. This will allow
closer approximations of what the early stages of learning new sound categories might look like
outside of the lab.

44
To examine the bidirectional influence of production and perception on each other during
training, I compare the performance of individuals that receive perception only training to those
receiving both perception and production training. This research will help disentangle the
possible relationships between perception and production during early stages of implicit category
learning. If the relationship between perception and production is parasitic, category formation
should always occur in perception before any learning in production occurs. If perception and
production are independent or help each other during learning, categories ought to develop in
tandem in both modalities. Finally, if the relationship between the modalities is antagonistic,
training in the opposite modality may hinder development of learning in the target modality.
1.7 Overview
Three experiments examining the relationship between perception and production are
presented in this dissertation. Participants were tested in both perception and production, while
training focused either on perception or production. Experiment 1 examines perception and
production of a novel contrast after training in perception only. Participants were trained over
the course of two consecutive days with either a unimodal or a bimodal distribution of stimuli
along a continuum and tested at the beginning and end of each day in discrimination,
categorization, repetition and naming. This experiment was designed to examine implicit
category learning in perception and production after two days of implicit training in perception
alone. Experiment 2 examines perception and production of the same novel contrast after
training in both perception and production. Participants were trained and tested as in Experiment
1; however, they explicitly produced training tokens during training. This experiment was

45
designed to examine what influence the addition of production training had on perceptual
learning and to examine whether production changes occurred after training in production in
order to further elucidate how the two modalities interact during the earliest stages of novel
category formation. Experiment 3 increases the amount of training in Experiments 1 and 2 from
two days to three. Participants were trained and tested identically to those in Experiments 1 and
2, with some participants being trained in perception only and some in perception and
production. This experiment was to examine whether further changes occurred in perceptual and
production learning after an additional day of training. The results from each of the four types of
tests (discrimination, categorization, repetition, and naming) are reported. These results are used
to examine how speech perception and production interact during the earliest stages of category
learning after implicit learning. Finally, I will discuss the relationship between the results
reported here and other relevant literature on perception, production, learning, and attention and
will suggest directions for future research in this area.
46
CHAPTER 2
2.1 Introduction
Previous research has demonstrated that listeners are able to improve performance on
perception of a new sound category after a relatively brief training in perception. Specifically,
several researchers (e.g., Hayes, 2003; Hayes-Harb, 2007; Maye & Gerken, 2000; Maye &
Gerken, 2001) have demonstrated that even without explicit instructions regarding the type or
number of categories they should learn, participants are able to implicitly learn new categories.
This experiment seeks to extend these findings in several ways.
This experiment examines learning in perception and production after training in
perception only. That is, participants in this experiment were never asked to explicitly repeat
tokens as part of their training regimen. This experiment helps address several issues central to
this thesis. First, by examining perceptual learning after training in perception only, I will be
able to ascertain whether the findings of Maye and Gerken are also applicable to this training
regimen. Second, I will be able to examine categorization performance after an implicit learning
paradigm. Because Maye and Gerken did not explicitly instruct participants with regard to the
type or number of categories they were supposed to be learning, they were unable to test
participants’ categorization abilities. In this study, the addition of pictures to training allows us
to examine categorization in addition to discrimination, which will further our understanding of
perceptual learning after an implicit training paradigm. Beyond these more methodological
points, I will be able to address two issues relating to the relationship of perception and
production. By examining performance on two production tasks, I will ask whether perceptual

47
training influences production performance and whether perceptual learning generalizes to
production in the absence of any explicit training in production. If participants in either training
group change their productions to reflect the properties of their input, it is possible that
perceptual training in this case may directly influence production. Additionally, if participants’
perceptual learning correlates with any change from pre- to post-test, this will suggest that
learning in the two modalities is strongly correlated. However, if no change from pre- to post-
test is found in production, this would be evidence for a weak link between the two modalities,
and would possibly suggest that production practice is necessary for production changes to
occur.
Finally, by comparing the results of this study with the results of Experiments 2 and 3, I
will be able to explicitly test how training modality influences learning in both perception and
production. This comparison will be discussed in more detail in Experiments 2 and 3.
2.2 Methods – Perception-Only Training
2.2.1 Participants
Forty Northwestern University undergraduates (18 males, 22 females) participated in this
experiment. Participants who had significant experience with other languages or who had known
speech or hearing deficits were excluded. Eight participants either did not complete both days of
the experiment or were excluded because they did not meet inclusion criteria, leaving a total of
thirty-two participants for analysis. All included participants were native, monolingual English
speakers. All participants were either paid for their participation or received course credit.

48
Participants were divided into two training groups: a unimodal exposure group and a bimodal
exposure group.
2.2.2 Stimuli
Stimuli are modeled on those used in Maye & Gerken (2000, 2001). These stimuli are syllables
along an 8-point continuum (Figure 2.1). The syllables are resynthesized from naturally
produced tokens of a contrast that English listeners are able to produce but that English does not
use contrastively: pre-voiced /d/ (e.g., the initial consonant in ‘day’) and a short-lag /t/ (e.g., the
second consonant in ‘stay’). To produce a pre-voiced stop, a speaker’s vocal folds are vibrating
during the closure for the stop; critically, voicing begins before the release of the consonant.
There is usually no disruption in vocal fold vibration following the stop release, unlike an
aspirated stop. A short-lag stop has a brief period of aspiration after the stop release, and no
voicing during the closure of the stop. For more discussion of the contrast, see Pegg et al.
(1992). Following Maye and Gerken, I transcribe the two ends of the continuum as /d/
(prevoiced) and /D/ (short-lag). Two phonetic cues are used to signal this contrast. The first is
VOT (prevoiced vs. short lag); the second is the formant transitions from the stop consonant to
the vowel (steeper for /d/, shallower for /D/).
2.2.2.1 Synthesis of Stimuli
In order to create the synthetic continuum, the voicing and formant transitions of several
naturally produced tokens (e.g., ‘day’ and ‘stay’ with /s/ excised) were co-varied using Praat
(Boersma & Weenink, 2009) for the synthesis of vowel formants and voice onset time. The first

49
two formants were resynthesized for each continuum. The tokens were synthesized using /d/ as a
base, so that each subsequent step had a smaller amount of prevoicing and less steep formant
transitions.
Specifically, for each sound, I manipulated the stimuli in two ways. The first
manipulation was to voice onset time. Using the amount of prevoicing on token 1 from Maye
and Gerken as a guide, I included approximately 78 msec of naturally occurring prevoicing on
token 1. The speaker of the tokens naturally produced a slightly longer period of prevoicing,
which I shortened by removing several periods of voicing from the middle of the token in order
to maintain the natural onset and offset of voicing. The result had no clipping and looked and
sounded natural. I gradually decreased the amount of pre-voicing for each token increased at a
step size of approximately 13 msec by removing periods from the middle of the token, so that
stimulus 8 ended with a positive voice onset time of approximately13 msec. Step size and the
VOT of each token were identical for all three continua.
The second manipulation involved altering formant transitions. I used Praat’s LPC
algorithm to separate the source information of each token I recorded (e.g., the fundamental
frequency) from the filter information (e.g., formant values). Tokens were also normalized for
intensity during this process. The same procedure was used for the endpoint stimuli from Maye
and Gerken. The formants Maye and Gerken were used as a filter for the stimuli. Each vowel
was approximately 330 msec long. Formants were automatically extracted using Praat’s LPC
algorithm every 1.75 msec, which reflects the default sampling rate and window size used for
this LPC algorithm. At each step, the first 4 formants were extracted. The steady state of the

50
vowel was reached at approximately 60 msec into the vowel (about 32 steps into the vowel).
These 32 steps were used to manipulate the formant transitions out of the consonant1.
In order to determine the amount of change needed to form a continuum from token 1 to
token 8, I determined the amount of change from token 1 to token 8 at each point in time for the
32 points in the vowel for each continuum. Then I determined the step size need for each of
those 32 points to create a continuum of 8 equal steps2. I repeated this procedure for each of the
three continua. Because each point in each vowel required its own step size, it is impossible to
report a single value for step-size for each continuum. However, I report the starting and ending
values for the formant transitions and the average step size for the formant transitions for each
continuum in Tables 2.1 and 2.2 below.
Stimulus F1-Point1 F1-Point32 F2-Point1 F2-Point32 DA1 471 800 1832 1561 DA8 719 800 1709 1561 DAE1 433 736 2063 1964 DAE8 551 736 1959 1964 DR1 407 559 1993 1624 DR8 424 559 1584 1624 Table 2.1: Beginning and ending formant values for each of the end point tokens
Stimulus Step Size (F1) Step Size (F2) DA 20 -11 DAE 13 -28 DR 1 -56
Table 2.2 Average step size for first and second formants for each continuum
1 Any obvious errors in formant tracking made by Praat (e.g., a formant dropping dozens of Hz between two time points which were otherwise similar, or F1 being found higher than F2 at a particular time point) were hand corrected to avoid clipping during resynthesis. 2 It should be noted that because of the process by which Praat extracts formant values, the steps between points 1 and 32 were linear in time, but not necessarily in Hz values. Manipulating each formant so that it would be a linear relationship both in time and in Hz values resulted in unnatural sounding stimuli. Furthermore, Maye and Gerken did not manipulate the formant transitions so that they were linear in both time and Hz.
51
Once step size was determined for each of the 32 points, a Praat script was written that
manipulated the original formant object (for token 1 of each continuum), resulting in 8 formant
objects for each continuum. These formant objects were then used to manipulate the source for
token 1. That is, token 1 was used as the base “source” for each of the 8 formant “filters” using
LPC analysis in Praat.
A female native English speaker (not the experimenter who administered these studies)
produced the base tokens for the stimuli. Three separate synthetic continua were formed,
following Maye and Gerken, each with the stop consonant in a different vowel environment (i.e.,
before /a/, /æ/ and /әr/). Across continua, voice onset time and steepness of formant transitions
remained the same. Vowel durations were equated within and across continua.
2.3 Procedure
All training and testing took place in a large, single-walled sound booth. Visual stimuli were
presented on a computer screen. Audio stimuli were presented over speakers at a comfortable
volume for the participant. All tasks were self-paced. Production responses were made using a
head-mounted microphone. All recordings were made at 22.05 kHz. Responses in perception
tasks were made using a button box, which was also used to advance to the next trial in
production tasks. Training and testing took place over two consecutive days. Any participant
who did not fully complete all training and testing tasks on both days of training was excluded
from participating.
Training and testing were interleaved throughout each day. The purpose of this was to
ensure that training distributions (and hence the implicit learning of participants) were not

52
disrupted by periods of testing occurring in large blocks. The exact order of training and testing
is discussed in further detail below. Before the current methods were decided upon a number of
other methods were attempted, but failed to result in robust perceptual learning. These various
methods are discussed in Appendix D.
2.3.1 Training
The training procedure was an implicit learning paradigm which used pictures to reinforce
statistical distributional information given to participants. The procedure for training largely
followed Maye and Gerken, with deviations including an increased amount of testing and
training, inclusion of visual stimuli to reinforce the training distributions (see also Hayes, 2003),
and the inclusion of a response during training. Training occurred over two consecutive days.
Each day, training was broken into several blocks, with sixteen repetitions of the target stimuli.
The number of times any particular target stimuli appeared within a training block will depend
on the group of the participant. Participants in the unimodal training group received more
repetitions of stimuli in the middle of the continuum (i.e., stimuli at points 4 and 5 on the
continuum) and fewer repetitions of those stimuli near the ends of the continuum (i.e., stimuli 2
and 7), which created a single distribution on the continuum. (See Figure 2.1.) Bimodal group
participants, on the other hand, received more repetitions of stimuli at two points along the
continuum (i.e., stimuli at points 2 and 7 on the continuum) and fewer repetitions of the stimuli
at the middle of the continuum (i.e., stimuli 4 and 5), which creates two equal distributions on
the continuum. (See Figures 2.1 & 2.2 for examples of these distributions.) Participants in the
bimodal training group should infer two novel categories and participants in the unimodal group

53
should only infer one category. Each participant heard 16 experimental tokens from each
continuum, for a total of 48 tokens per block. Each training section during the experiment
contains two blocks of training, for a total of 96 tokens per section. Participants had four
training sections per day for a total of 384 training tokens each day.
All tokens were presented with a picture. Pictures were paired with tokens along the
continua. There was one picture per continuum for the unimodal training group. The continuum
for the bimodal group was divided in half, with one picture per half. These pictures reinforced
the distributional information given to participants in their respective training groups. See
Figures 2.1 and 2.2 for examples of the pictures.

54
Figure 2.1: An example distribution of tokens per block for the bimodal group. The x-axis
shows each point on the continuum, and the y-axis represents the number of presentations per-
block. Ovals are used to show comparisons that are used in the discrimination test. The pictures
above tokens 2 and 7 are example pictures used for a particular continuum. The dotted line
down the center of the graph (between tokens 4 and 5) demonstrates where the continuum was
divided for the pictures.
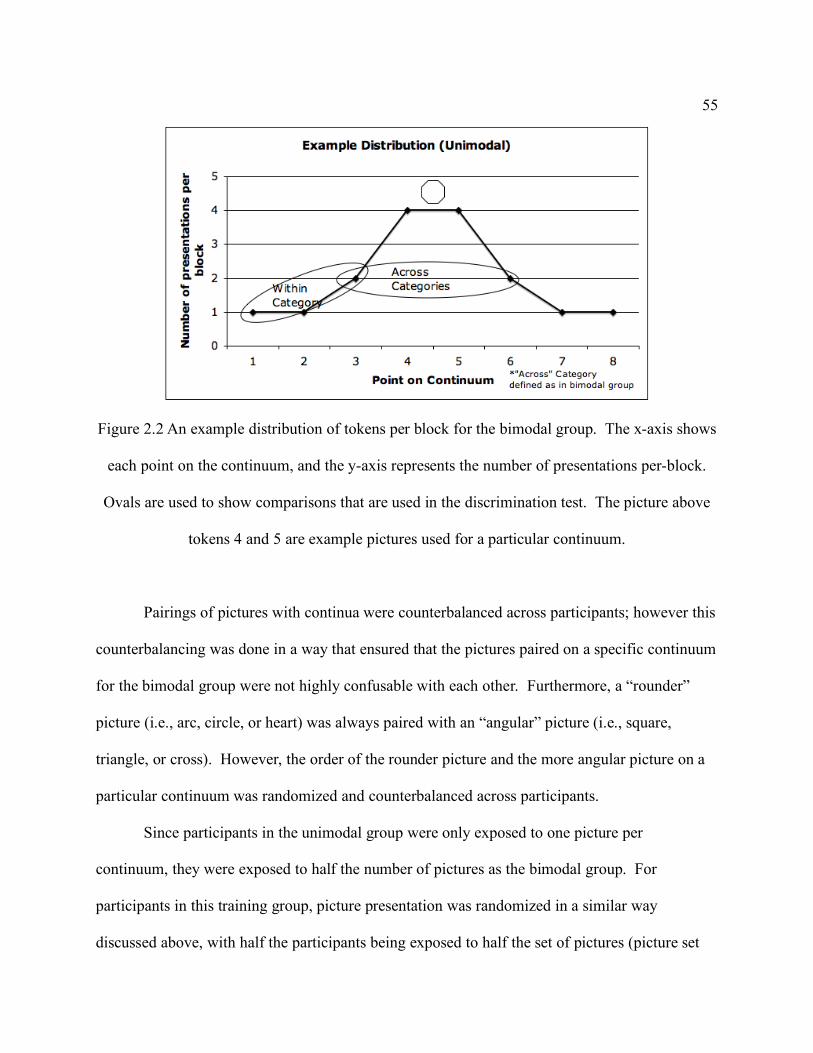
55
Figure 2.2 An example distribution of tokens per block for the bimodal group. The x-axis shows
each point on the continuum, and the y-axis represents the number of presentations per-block.
Ovals are used to show comparisons that are used in the discrimination test. The picture above
tokens 4 and 5 are example pictures used for a particular continuum.
Pairings of pictures with continua were counterbalanced across participants; however this
counterbalancing was done in a way that ensured that the pictures paired on a specific continuum
for the bimodal group were not highly confusable with each other. Furthermore, a “rounder”
picture (i.e., arc, circle, or heart) was always paired with an “angular” picture (i.e., square,
triangle, or cross). However, the order of the rounder picture and the more angular picture on a
particular continuum was randomized and counterbalanced across participants.
Since participants in the unimodal group were only exposed to one picture per
continuum, they were exposed to half the number of pictures as the bimodal group. For
participants in this training group, picture presentation was randomized in a similar way
discussed above, with half the participants being exposed to half the set of pictures (picture set

56
A) and the other half of participants being exposed to the opposite set of pictures (picture set B).
Participants in the bimodal group were exposed to both picture sets A and B (see Appendix A for
picture sets).
Participants were told that they should listen to the syllables they heard and pay attention
to the pictures they were paired with. Other than this, participants were not told anything about
the ‘language’ they were listening to. Exact instructions for training are included in Appendix B.
Diverging from Maye and Gerken, training took place over two days to allow for an
examination of the time course of learning. Additionally, this allowed for the inclusion of more
testing without disrupting the training distributions presented to the participants. A second
difference between the Maye and Gerken training paradigm and the training presented here is in
the task required during training. Perception-only training in the Maye and Gerken study did not
require participants to respond to the stimuli. However, in order to more closely equate the
perception-only vs. perception + production conditions in subsequent experiments, participants
in this condition will be required to respond to the stimuli during training (by pushing any button
on the button box to advance to the next trial). This is intended to partially equate for potential
differences in attention during the two experiments, since perception + production training
requires attention be paid to the stimulus in order to repeat it. Because naturalistic learning can
be achieved without feedback (e.g., Maye & Gerken 2000, 2001), participants did not receive
feedback in any training situation reported here.

57
2.3.2 Testing
During the testing phase, participants performed four tests, two focusing on perception and two
focusing on production. The two perception tests were discrimination and categorization. The
two production tests were repetition and naming. With the exception of picture naming, testing
was identical for all subjects regardless of training group.
Discrimination and repetition pre-tests occurred before training on each day of the
experiment. At the end of each day, participants also performed discrimination, categorization,
repetition and naming post-tests with the final post-test occurring on the last day of training.
Training and testing were interleaved throughout the experimental session. Training and testing
took approximately one hour each day.
2.3.2.1 Discrimination Test
The discrimination test was very similar to the test used by Maye and Gerken. Participants were
be presented with pairs of syllables and asked whether they are the same or different “words” in
the language they heard during training. They indicated their response using one of two side-by-
side buttons at the bottom a button box. By indicating their response, participants were
automatically advanced to the next trial. Feedback was not provided between trials or at the end
of the test. As argued by Maye and Gerken, because the words in the training have identical
vowels following the varied formant transitions, which occurred very early in the vowel,
participants should be making decisions based on their learning of the new phonemic contrast,
cues to which were carried in the voicing of the initial stop and in formant transitions.

58
Participants in Maye and Gerken heard only end-point stimuli during the test trials. Here,
participants were asked to discriminate between stimuli 1, 3, 6, and 8. These stimuli were
chosen because their distributions across the two training groups (i.e., unimodal and bimodal) are
the same. Therefore, any differences in discrimination should be due to only differences in how
those tokens fell in the category or categories participants were exposed to, and, critically, not to
how often they heard that particular token. This also allowed me to examine both within-
category discrimination for both groups (i.e., comparing stimuli 1 and 3 or 6 and 8), as well as
across-category learning (i.e., comparing stimuli 3 and 6 or stimuli 1 and 8).
The discrimination test contained three types of comparisons: same, within-category, and
“across-category”. On each trial, participants heard a pair of tokens over the speakers that fell
into one of these types of comparisons. For same comparisons, participants heard one of four
acoustically identical pair types: 1-1, 3-3, 6-6, or 8-8. Within-category comparisons were either
tokens 1-3 or tokens 6-8. These comparisons fall within a single category in the unimodal and
within a single category as defined by the bimodal distribution. “Across-category” comparison
contained pairs 3-6 or 1-8. These comparisons are of tokens which fall across categories as
defined by the bimodal distribution, but of tokens which fall within a single category as defined
by the unimodal distribution.
Pairs of tokens were presented in a fully counterbalanced design for all participants, so
that each participant heard not only the pair 1-8 for the /da/ continuum but also the pair 8-1 for
the same continuum. This resulted in 48 comparisons per test (3 continua, 8 comparisons per
continuum, 2 orders for each comparison). Each participant was presented with the test pairs in a
different random order.

59
Participants heard each pair, and advancement to the next pair was self-paced. Within a
pair of stimuli, there was a 500 msec inter-stimulus interval, following Maye and Gerken.
2.3.2.2 Categorization test
The second perception test focused on categorization rather than discrimination. Discrimination
is thought to tap into a lower level of sound processing (e.g., the phonetic level), and
categorization is thought to tap into a higher level of sound processing (e.g., the phonological
level) (see Liberman et al., 1957). Traditionally, these two types of tests are taken together as
evidence for categorical perception (however, this view has come into question; see Schouten et
al., 2003 for a discussion). Regardless, these two tests together will give us a broader picture of
how perceptual learning is occurring.
This test took advantage of the pictures that were paired with the training words.
Participants were presented with a six alternative forced choice test. During this test, participants
were presented with a row of six pictures on a computer screen. They heard a single token over
speakers and were instructed to choose the picture that matched the word that they heard.
Participants indicated their response using one of 6 buttons arranged horizontally across the top
of the button box. Once again, participants' response resulted in automatic advancement to the
next trial. Participants did not receive any feedback. In addition to collecting participants’
responses, their reaction times were also recorded.
It is important to note that each participant in the unimodal group was exposed to only
half of the set of pictures (either picture set A or B). Therefore, half of the pictures presented in
the six alternative forced choice task, which included both picture sets A and B, were novel to

60
any particular participant. Though there were still technically six alternatives, only three of those
alternatives were familiar for the unimodal group.
As in the discrimination test, participants were presented with token 1, 3, 6, or 8 from
each continuum. Differences in performance should only be due to differences in learning, not
in how frequently a particular participant heard a particular test token. Participants were
presented with a total of 48 tokens during this test (3 continua, 4 points per continuum, 4
repetitions of each point).
2.3.2.3 Repetition Test
The first production test participants were presented with was a repetition task. Participants were
asked to repeat stimuli from the three continua. Participants heard a single token over speakers.
They were instructed to try to repeat the token so that it was as close as possible to the token they
heard. Furthermore, they were instructed to repeat the token only after the target token was
finished presenting. After participants produced a token, they pressed a button to advance to the
next token. They were instructed not to press the button until after they completed their
production of the word.
Again, the test tokens were tokens 1, 3, 6, and 8 along the continuum. Four tokens of
each of these four points along the continuum were presented, in order to better understand the
variance within and across tokens on the continuum. Stimuli in this test were fully randomized.
Participants were presented with a total of 48 tokens during this test, resulting in 48 repetitions (3
continua, 4 points per continuum, and 4 repetitions per point).

61
Voice onset time was measured for each token by two trained coders. Each coder marked
burst onset, voicing onset, and end of vowel. If any amount of prevoicing was present before the
burst onset, the onset of this prevoicing was also marked. Furthermore, if there were breaks
between the prevoicing, and the onset of the burst, the offset of prevoicing was also marked.
This allowed three measures to be calculated from each response each participant produced: one,
the presence or absence of prevoicing; two, breaks in voicing during prevoiced tokens, and three,
voice onset time (VOT; if positive, the duration between the burst onset or voicing onset; if
negative, the duration between the onset of prevoicing and the onset of the burst). To assess
reliability, both coders measured 200 tokens from 6 speakers. The average absolute deviation on
voice onset time between the two coders was 0.8 msec and 95% of the deviations were less than
2 msec.
2.3.2.4 Naming Test
The second production test participants were presented with was a naming task. Naming was
used in addition to repetition in order to examine production abilities at two different levels of
processing. Goldrick & Rapp (2007) suggest that repetition and naming differentially recruit
distinct production processes (and demonstrate that patients can have impairments at one level
and not the other). They distinguish lexical phonological processes that recover relatively
arbitrary aspects of word forms from long-term memory from post-lexical phonological
processes that specify the predictable aspects of phonological representations. They suggest that
while both naming and repetition can be performed using lexical processes, repetition does not
require them; it can be accomplished relying solely on post-lexical production processes.

62
Examining this task in conjunction with repetition will allow us to examine production tasks that
differentially emphasize the role of lexical knowledge. Contrasts between these tasks may reveal
if different learning patterns hold at these two levels of processing.
In this task, participants were presented with a picture on the screen. They were asked to
name the picture with the “word” they learned during training. They were instructed to press any
button on the button box once they named the word.
This is the only test that differed for the bimodal and unimodal training groups. The
bimodal training group was presented with each of six pictures they were exposed to during
training. Each picture was presented four times. The unimodal training group was only
presented with the three pictures they were exposed to during training (either picture set A or
picture set B). This resulted in two types of tests: a single test for the bimodal training group vs.
Test A or Test B only for the unimodal group (depending on which set of three pictures the
unimodal participants were exposed to). For both unimodal tests, the three pictures were
presented four times to the participants. In this test, the bimodal group produced a total of 24
tokens (six pictures, four times each), and the unimodal group produced a total of 12 tokens
(three pictures, four times each). Presentations of pictures were fully randomized for all
participants. Participants were not exposed to any pre-recorded auditory stimuli during this test.
For both production tasks, any tokens which were repeated more than one time in
response to a single target, were clear errors, or were self-corrections or interrupted part-way
through the token were excluded from analysis, as were any tokens that were incomprehensible
due to non-speech noise (e.g., sneezing). One of the two trained coders that analyzed the data
from the repetition task measured all of the data for this task.

63
2.3.2.5 Training and Testing regimen
As mentioned above, training and testing were interleaved each day to ensure that long testing
blocks did not disrupt learning. Training and testing order is presented below in Table 2.3.
Order Training Testing
1 Discrimination Pre-Test
2 Repetition Pre-Test
3 Training Block 1
4 Discrimination Post-Test 1
5 Training Block 2
6 Discrimination Post Test 2
7 Training Block 3
8 Repetition Post Test
9 Training Block 4
10 Categorization Test
11 Naming Test
Table 2.3 The order of testing and training blocks for each day.
Scores for the two discrimination post-tests were combined to result in a single
discrimination post-test score. Because the discrimination post-test was longer than the other
tests, the test was split into two portions with an additional training set in between the two blocks
of discrimination testing. This interleaved design ensured that for every 48 test tokens,
participants were exposed to 96 training tokens. The exception to this is in the two final post-
tests. Participants were exposed to 48 categorization test tokens and moved directly into naming

64
without another training session intervening. Each section of this regimen took no more than 5
minutes at a time. Participants were allowed to take breaks between sections of the training
regimen.
2.4 Results
2.4.1 Discrimination Test
2.4.1.1 Predictions
If participants in the bimodal training group successfully learn two novel categories after
training, we expect their sensitivity to across-category comparisons should significantly increase
from day 1 pre-test to day 2 post-test. However, their sensitivity to within-category comparisons
should remain stable, or decrease if they have a very high baseline sensitivity to the contrasts.
The unimodal group should not become more sensitive to either type of contrast, if they only
learn to infer one novel category after training. Their performance on these tasks should remain
stable or decrease.
2.4.1.2 Analysis
Participants’ responses (i.e., “same” or “different”) were converted into d' scores for each
participant in order to assess listeners’ discrimination abilities. Each participant has two d'
scores, one for across category comparisons and one for within category comparisons. The
calculation for d' was done by converting the percentage of “hits” (i.e., when participants stated
stimuli were different and they were physically different) and the percentage of “false alarms”

65
(i.e., when participants stated stimuli were different and they were physically the same) into Z-
scores under a normal distribution. Then the false alarm rate was subtracted from the hit rate
(Macmillan & Creelman, 1991). The resulting number was the d' value used in all subsequent
analyses for the discrimination test.
Participant’s d' scores statistically assessed using linear mixed effects regressions
(Baayen, Davidson, & Bates, 2008) including random intercepts for participants, implemented
with R package lme4 (Bates & Macheler, 2009). Significance of each predictor was assessed
using a Markov Chain Monte Carlo procedure (Baayen, 2008).
In these regressions, I examine differences in participants’ sensitivity across the bimodal and
unimodal training groups to across-category comparisons before and after training, it will be
clear whether this training paradigm lead to perceptual learning.
2.4.1.3 Sensitivity
Before training, participants in neither training group are particularly sensitive to within-
or across- category performance. Figure 2.3 shows the d' scores for participants at pre-test.

66
Figure 2.3 d' scores for participants before training. Error bars represent standard error.
The lack of significant baseline differences was confirmed using a mixed effects
regression including training group and comparison type as fixed effects and participants as a
random intercept. The main effect of training was not significant (t<1), which suggests that the
two groups are not significantly different from one another in terms of their baseline abilities to
perform this type of discrimination task. Furthermore, the main effect of comparison type
(within vs. across category) is also not significant (t<1). This suggests that there are not baseline
differences between comparison types.
Learning was assessed by examining post-test performance on Day 2. Figure 2.4 shows
the mean d' scores for the unimodal and bimodal training groups after training for both within
and across category comparisons.

67
Figure 2.4 Participants’ d' scores after two days of training. Error bars represent standard error.
To assess perceptual learning, a mixed effects regression was performed on
discrimination data from Day 1 pre-test vs. Day 2 post-test. The regression model included the
main effects of training day, comparison type, and training group, all of their interactions, and a
random intercept for participant. The main effect of training day is significant (β=0.54, s.e=0.26,
t=2.1, p=0.04). Overall, sensitivity is higher on Day 2 at the post-test than on Day 1 in the pre-
test. There is also a significant interaction between day and comparison type (β=-0.76, s.e=0.37,
t=-2.1, p=0.04), suggesting that the two comparison types are differentially affected by training.
Examining performance, it is clear that sensitivity to across-category comparisons is increased
from day 1 to day 2, but sensitivity to within-category comparisons remains stable.
Furthermore, the three-way interaction between training group, training day, and
comparison type is significant (β=1.1, s.e=0.53, t=2.12, p=0.03). Examining performance, this
interaction reflects the fact that participants in the bimodal training group show a greater increase

68
in their sensitivity to across-category comparisons after two days of training than the unimodal
group. However, the two groups remain equally sensitive to within-category comparisons both
before and after training. Follow-up regressions which examine the bimodal and the unimodal
training groups separately confirm these results. Specifically, training day, comparison type and
the interaction between training day and comparison type are all not significant for the unimodal
training group (ts < 1). In contrast, the bimodal training group shows a significant increase in
discrimination for the across-category items alone . Specifically, there is a significant main
affect of training day (β=0.54, s.e=0.15, t=3.7, p<0.001) and a significant interaction between
training day and comparison type (β=-0.76, s.e=0.21, t=-3.66, p<0.0001). (The main effect of
comparison type is not significant; t<1).
Before continuing, it should be noted that as a group, the bimodal training group becomes
much more accurate at the across category comparison from pre- to post-test. This is true for
individual subjects within the training group (see Figure 2.5 below for individual pre- and post-
test performance on across category comparisons). However, it is also clear that there is
substantial across-subject variability on this task. This variability is useful for examining how
categorization performance and performance on various production measures correlates with
discrimination abilities.

69
Figure 2.5 Individual performance on across-category comparisons for bimodal training
participants.
Through comparing several regression models, it was determined that the fit was not
significantly improved by adding a number of additional predictors to the regression model
specified above. There were no significant differences when adding location on the continuum
to the regression, as assessed by examining the changes in log likelihood. That is, participants’
abilities to discriminate between tokens at the edges of the category boundary (i.e., the 1-8
comparison) and tokens near the center of the category boundary (i.e., the 3-6 comparison) did
not affect the regression results. Furthermore, there were no significant differences when adding
the order in which stimuli were presented to the regressions. Specifically, participants’
sensitivity to contrasts was not dependent on the order the stimuli were presented (e.g., when
stimulus 1 was presented before stimulus 8, participants were no better or worse than when
stimulus 8 was presented before stimulus 1 in a particular discrimination trial). Finally,

70
continuum (e.g., da vs. dae) did not significantly improve model fit; participants were no better
or worse at discrimination on any particular continuum (χ2<1 for all comparisons).
In sum, at pre-test participants in the bimodal and unimodal groups are equally poor at
discriminating across- and within-category comparisons. However, after two days of training,
participants in the bimodal training group show increased sensitivity to across-category contrasts,
but not within-category contrasts. Participants in the unimodal training group do not show
significant improvement from day 1 to day 2 on either type of contrast.
2.4.1.4 Interim Discrimination Sensitivity
By assessing sensitivity at a variety of points during training (i.e., at the beginning and
end of each training day), it is possible to begin to examine the timeline of perceptual learning.
Once again, learning was assessed using linear mixed effects regressions. The regression model
included the main effects of training day, test number (pre vs. post), comparison type, and
training group, all of their interactions, and a random intercept for participant.
As in the results above, the main effect of training group is significant (β=-1.26, s.e=0.3,
t=-4.23, p<0.001). The bimodal training group is more sensitive than the unimodal training
group. The main effect of test (pre vs. post) is significant (β=-0.63, s.e=0.26, t=-2.45, p=0.02).
Overall, sensitivity is higher at post-test (on either day) than at pre-test that day. There is also a
significant main effect of comparison type type (β=-1.19, s.e=0.26, t=-4.65, p=0.001).
Sensitivity is higher on across category comparisons than on within category comparisons.
Several interactions are also significant. Inspection of the figures shows that the
unimodal group shows essentially no change across days. In contrast, bimodal participants show
increased discrimination abilities for the across-category contrasts alone. This difference is

71
revealed by interactions involving training group and comparison type (β=1.89, s.e=0.4, t=4.7,
p=0.001), and one with training g group and test number (β=1.89, s.e=0.4, t=4.7, p=0.001).
Furthermore the bimodal group's improvement in across-category discrimination is much larger
on the first day than the second. The larger improvement on the first day yields a significant
interaction of training day and test number (β=1.13, s.e=0.37, t=3.1, p=0.006); the fact that it is
limited to the bimodal group yields a three-way interaction of training group, day and test
number (β=-1.09, s.e=0.57, t=1.91, p=0.05). Finally, because this improvement is limited to the
across-category discrimination, there is a significant four-way interaction of training group,
training day, test number, and comparison type (β=1.83, s.e=0.8, t=2.27, p=0.022). These results
are discussed further in section 3.4.1.5 in conjunction with similar results from Experiment 2.
Figure 2.6 shows across category discrimination across training days for participants in
the bimodal training group. The participants in the unimodal group do not modulate their
sensitivity over the course of days.

72
Figure 2.6. Across category discrimination for participants in the bimodal perception-only
training group at pre- and post-test on both training days.

73
Figure 2.7 Unimodal perception-only training discrimination at pre- and post-tests on each day
2.4.2 Categorization
2.4.2.1 Predictions
If participants in the bimodal group have learned to infer two new categories after
training, and this learning is not only applicable to the very fine-grained level of phonetic
representations but also to higher levels of lexical-phonological processing, we would expect
their performance on the categorization of these new picture-“word” pairings to be quite
accurate. That is, participants should be able to correctly categorize tokens as corresponding to
one picture label or another. Furthermore, we expect this categorization ability to correlate
roughly with their discrimination ability. Finally, unimodal participants should also be quite

74
accurate at this task, since they only learn three new picture-“word” pairings during training.
They should have a fairly low level of confusability between tokens they hear during this test.
2.4.2.2 Analysis
In contrast to some categorization tests, which seek to identify a listener’s boundary
between two sound categories, the responses in the categorization test in this study can be
classified as “correct” and “incorrect.” This is because listeners were trained on a specific
categorization scheme. The analyses below therefore examine an individuals’ accuracy in
categorization, rather than their category boundary. Additionally, reaction times were collected
for this data, which allows for an examination of a participants’ speed in addition to accuracy.
Furthermore, we are able to divide participants responses to stimuli far from the experiment
imposed category boundary to those stimuli near to the category boundary. This is an important
distinction to be able to draw because we may expect results to vary depending on the location of
the stimulus. Specifically, Pisoni & Tash (1974) demonstrate that listeners in a same/different
task respond more quickly to different stimuli that are far from the category boundary of a
contrast than they do to stimuli that are close to that boundary. Furthermore, McMurray,
Tanenhaus, & Aslin (2002) demonstrate that listeners show a gradient sensitivity in their eye-
movements to within-category information, even though they perform categorically on a
behavioral task. By dividing the stimuli into “near” and “far” tokens we will be able to further
examine perceptual learning of the new sound categories. If participants show differences in

75
accuracy or reaction times to near or far tokens, this would suggest that participants have learned
where the category boundary has been imposed and are sensitive to this distinction.
Before examining performance on this task, it should be noted that it is difficult to
compare overall accuracy across the unimodal and bimodal training groups; their tasks are rather
different. During training the unimodal group only learns three new picture-word pairs, whereas
participants in the bimodal group learn six. This makes the categorization task simpler for the
unimodal group in two ways. First, the range of actual possibilities for responses is reduced
compared to the bimodal group. Second, the confusability of the tokens is much reduced
compared to the bimodal group. Therefore, the performance of the two groups will only be
compared in some of the analyses, which address performance relatively independently of these
factors.
Once again, data were assessed using linear mixed affect regressions. Participants'
categorization ability was assessed using linear mixed effects logistic regressions (Jaeger, 2008).
Reaction times were analyzed using linear mixed effects regressions, as in the case of the
discrimination tests.
2.4.2.3 Accuracy
Participants in the unimodal group were extremely accurate at this task. Overall accuracy
was 98.15% correct; median performance was 100% correct. Because of the nature of this task,
all errors were across continuum errors for the unimodal group. The unimodal group did not
perform differently on the “near” stimuli or the “far” stimuli (average accuracy: 98.15% for both
groups, median performance: 100% for both groups).
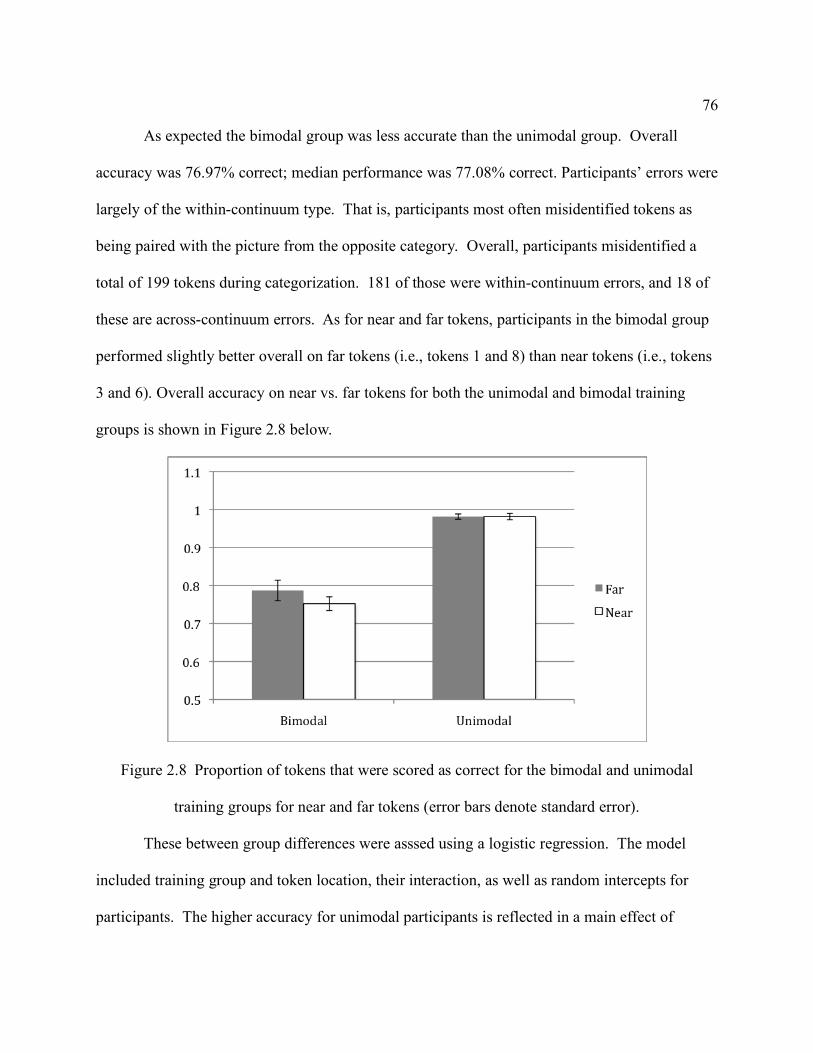
76
As expected the bimodal group was less accurate than the unimodal group. Overall
accuracy was 76.97% correct; median performance was 77.08% correct. Participants’ errors were
largely of the within-continuum type. That is, participants most often misidentified tokens as
being paired with the picture from the opposite category. Overall, participants misidentified a
total of 199 tokens during categorization. 181 of those were within-continuum errors, and 18 of
these are across-continuum errors. As for near and far tokens, participants in the bimodal group
performed slightly better overall on far tokens (i.e., tokens 1 and 8) than near tokens (i.e., tokens
3 and 6). Overall accuracy on near vs. far tokens for both the unimodal and bimodal training
groups is shown in Figure 2.8 below.
Figure 2.8 Proportion of tokens that were scored as correct for the bimodal and unimodal
training groups for near and far tokens (error bars denote standard error).
These between group differences were asssed using a logistic regression. The model
included training group and token location, their interaction, as well as random intercepts for
participants. The higher accuracy for unimodal participants is reflected in a main effect of

77
training group (β=0.18, s.e=0.02, t=7.5, p<0.0001). There was no main effect of token location
(i.e., far vs. near; t<1). A significant interaction between training group and token location
(β=0.06, s.e=0.03, t=2.1, p<0.04) suggests that the location of the token on the continuum
significantly affects accuracy for participants in the bimodal training group, but not in the
unimodal training group.
2.4.2.4 Reaction Times
A similar regression analysis was performed on reaction times for correct categorization
responses. Participants in the unimodal group respond significantly more quickly overall than
participants in the bimodal training group (β=-721.24, s.e=203.5, t=-3.5, p<0.0005). No other
factors reach significance as main effects or interactions in the regression examining reaction
time. Average reaction times for correct responses to near and far tokens for each group are
shown in Figure 2.9 below.
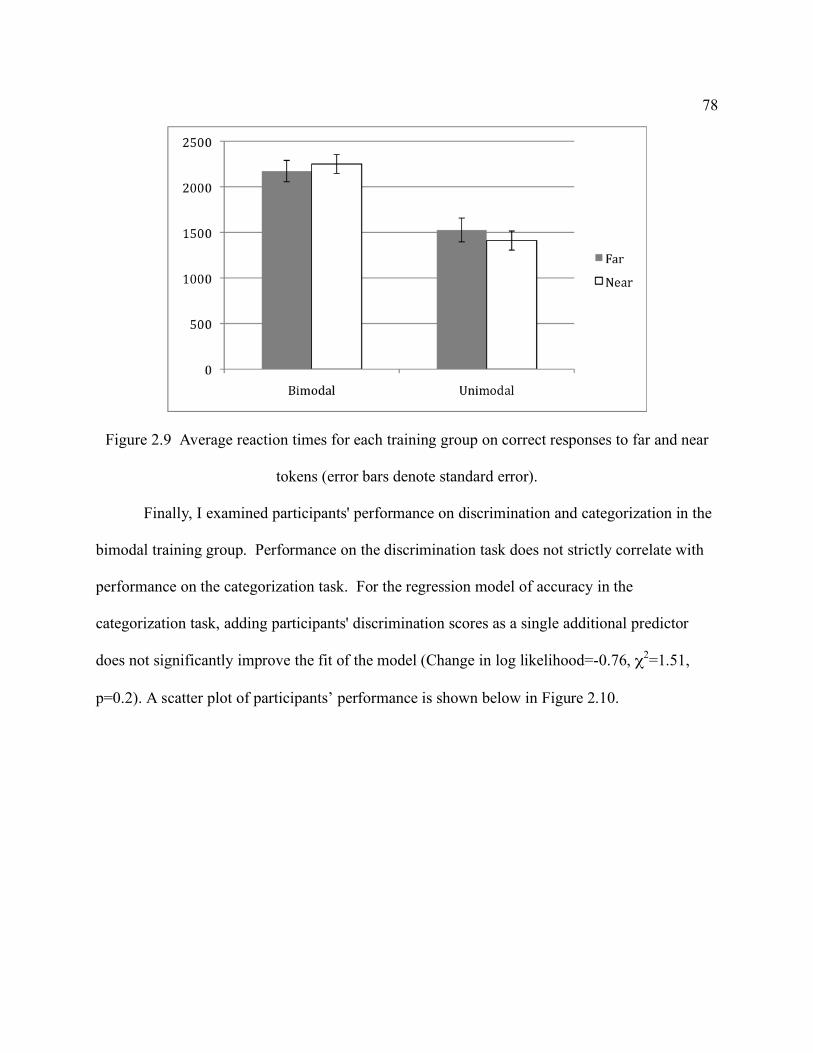
78
Figure 2.9 Average reaction times for each training group on correct responses to far and near
tokens (error bars denote standard error).
Finally, I examined participants' performance on discrimination and categorization in the
bimodal training group. Performance on the discrimination task does not strictly correlate with
performance on the categorization task. For the regression model of accuracy in the
categorization task, adding participants' discrimination scores as a single additional predictor
does not significantly improve the fit of the model (Change in log likelihood=-0.76, χ2=1.51,
p=0.2). A scatter plot of participants’ performance is shown below in Figure 2.10.

79
Figure 2.10 Correlation between categorization and discrimination performance. Bimodal
training group participants’ categorization performance is shown on the x-axis and their
discrimination performance (at Day 2 post-test) is shown on the y-axis.
In summary, the categorization test provides another piece of the picture as to how
perceptual learning was affected by perceptual training in this experiment. Participants in the
bimodal group respond less accurately to stimuli near the category boundary than at the edges of
it. However, their performance in this task is not correlated with their performance on the
discrimination task. This suggests that perceptual learning may be occurring at multiple levels of
representation.

80
2.4.3 Repetition
2.4.3.1 Predictions
Because participants in the bimodal group have demonstrated perceptual learning that
reflects the structure of their input, it is now possible to examine whether their perceptual
learning extends to learning in production. If so, we may expect to see participants in the
bimodal group make a bigger difference in their repetitions of endpoint tokens at the end of two
days of training than they do at the beginning of training. Specifically, we should expect to see
participants producing longer voice onset times for token 8 than token 1. Furthermore, token 1
should be pre-voiced more often than token 8. These differences ought to increase from pre- to
post-test if participants are learning to change their productions as a result of perceptual training.
It is also possible that the unimodal group will collapse any distinction they make
between the two types of tokens. Furthermore, it is possible that if participants in the bimodal
group do make a bigger difference between endpoint tokens, the amount of change will correlate
roughly with the amount of change they make in the discrimination task from pre- to post-test.
2.4.3.2 Analysis
Participants’ productions were classified into one of four groups: short-lag tokens, pre-
voiced tokens, mixed tokens (with substantial periods of pre-voicing and aspiration), and mixed
tokens with a pause (with a substantial period of prevoicing, a period of silence, and a period of
aspiration). Only “correctly” produced tokens (i.e., short-lag and prevoiced tokens) were used
for the analyses reported here.

81
Because short-lag and prevoiced tokens are bimodally distributed, voiced onset times for
each token type should be analyzed separately. Furthermore, because relatively few prevoiced
tokens were produced (see Figures 2.11 and 2.12 below), I analyzed participants’ voice onset
times for short-lag tokens only. Only the endpoint tokens (tokens 1 and 8) were compared, since
this is where participants are expected to make the largest differences in production. For these
short-lag tokens, I also analyzed and report the vowel duration for endpoint tokens.
Furthermore, I analyzed and report the ratio of VOT and vowel duration. This was calculated by
dividing the VOT by the vowel duration for each token. Additionally, the proportion of tokens
which were prevoiced is also reported for tokens 1 and 8. Because there were no significant
differences across continua, all continua are collapsed together in the analyses reported here.
Short lag voice onset times were log-transformed to help control for the skewed distribution of
VOTs in the production data.
Once again the data were analyzed using linear mixed effects regressions (for short-lag
voice onset time) and linear mixed effects logistic regressions (for proportion of tokens that were
prevoiced). Regressions included random intercepts for participants.
2.4.3.3 Repetition
Figures 2.11 and 2.12 show the average voice onset time at pre- and post-test for short lag
tokens for the unimodal and bimodal training groups.

82
Figure 2.11 Average voice onset time for short lag tokens produced by the unimodal training
group before and after training (error bars denote standard error). No differences are significant.
Figure 2.12 Average voice onset time for short lag tokens produced by the bimodal training
group before and after training (error bars denote standard error).

83
There were no significant main effects of training day (β=-0.021, s.e=0.018, t=-1.22,
p=0.22), token number (β=0.007, s.e=0.005, t=1.57, p=0.12), or training group (β=0.065,
s.e=0.066, t=-1, p=0.32) in the regressions. However, there is a significant three-way interaction
between training group, day, and number (β=0.015, s.e=0.008, t=1.95, p=0.05). Examining
performance it is clear that participants in both groups make small differences between tokens 1
and 8 on Day 1. However, participants in the bimodal training group make a larger distinction
between tokens 1 and 8 on day 2 than they do on day 1 (difference in mean VOT on Day 1: 2.3
msec; difference in mean VOT on Day 2: 3.8 msec). The unimodal training group does not
make a change in the difference between tokens 1 and 8 after training.
There were no significant main effects or interactions in terms of vowel duration. The
main effects and interactions in terms of proportional relationship of VOT and vowel duration
are identical to those in raw voice onset time. Figures 2.13 and 2.14 below show the vowel
duration at pre- and post-test for the unimodal and bimodal training groups.

84
Figure 2.13 Vowel duration for short lag tokens produced by the unimodal training group before
and after training
Figure 2.14 Vowel duration for short lag tokens produced by the bimodal training group before
and after training.
Figures 2.15 and 2.16 below show the ratio of VOT and vowel duration at pre- and post-
test for the unimodal and bimodal training groups.

85
Figure 2.15 Ratio of VOT and vowel duration for short lag tokens produced by the unimodal
training group before and after training.
Figure 2.16 Ratio of VOT and vowel duration for short lag produced by the bimodal training
group before and after training.
Figures 2.17 and 2.18 below show the proportion of tokens that were pre-voiced at pre-
and post-test for the unimodal and bimodal training groups.

86
Figure 2.17 Proportion of tokens that were produced with prevoicing for the unimodal training
group before and after training.

87
Figure 2.18 Proportion of tokens that were produced with prevoicing for the bimodal training
group before and after training.
When examining the proportion of tokens that are prevoiced, the only significant main
effect was training day (β=1.08, s.e.=0.4, z=2.68, p<0.008; other zs < 1); participants prevoice
more often on day 2 than day 1. Although participants are making some changes in their
productions, these changes are not dependent on training modality or on which token they are
trying to shadow. Furthermore, participants in both groups pre-voice token 1 more often than
token 8 on both day 1 and day 2. However, this difference is also not significant; participants
appear to be shadowing some of the properties of the tokens they are repeating, though these
differences are non-significant. Because participants in the bimodal training group learn to
change not only their perception but also their productions, one might expect that those
participants who learn the most in perception may also change their productions the most.

88
To examine the correlation in learning across modalities, I compared two regressions for
the bimodal perception-only training group. One model included training day and token number
as predictors. The second model included training day, token number, and day 2 discrimination
performance. The model that included day 2 discrimination was a significantly better fit than the
model which did not include that comparison (β=0.13, change in log likelihood=5.79, χ2=11.6,
p<0.03). This suggests that performance in the two modalities is related. Figure 2.19 shows day
2 discrimination performance and the amount of difference made between tokens 1 and 8 in
production.
Figure 2.19 Day 2 Discrimination and the amount of difference between tokens 1 and 8 in
production. Discrimination is shown in d' and the production data is shown in VOT (seconds).
Participants in the bimodal perception-only training group not only learn how to
discriminate and categorize a new sound contrast in perception, they also learn to make larger
distinctions in production. Participants in the unimodal group do not make such changes in their

89
productions. Furthermore, participants in the bimodal training group demonstrate that their final
performance in the two modalities is strongly correlated.
2.4.4 Naming
2.4.4.1 Predictions
Because participants in the bimodal training group learn to make distinctions between
tokens during repetition, it is possible that changes may also be occurring at a higher level of
representation. Therefore, it is possible that word naming may reflect differences between the
tokens as well for the bimodal training group.
2.4.4.2 Analysis
As for the repetition task, participants’ productions were classified into one of four
groups: short-lag tokens, pre-voiced tokens, mixed tokens (with substantial periods of pre-
voicing and aspiration), and mixed tokens with a pause (with a substantial period of prevoicing, a
period of silence, and a period of aspiration). Only “correctly” produced tokens (i.e., short-lag
and prevoiced tokens) were used for the analyses reported here.
Participants voice onset times, vowel durations, and ratio of voice onset time and vowel
duration for short-lag tokens were compared using linear mixed effects regressions. These
productions were classified as being intended as being from the left or right end of the
continuum.

90
Once again the data were analyzed using linear mixed effects regressions (for short-lag
voice onset time) and linear mixed effects logistic regressions (for proportion of tokens that were
prevoiced). These regressions included token location (left or right edge of the continuum) and
training group.
2.4.4.3 Naming results
There were no significant main effects of training group (unimodal vs. bimodal) or token
(right or left side of the continuum; ts and zs < 1), nor are there any significant interactions
between these tokens (ts and zs < 1).
2.5 Conclusions
This experiment provides a first step in this examination into the relationship between
perception and production. Specifically, the discrimination test demonstrates that in this
paradigm participants are sensitive to distributional information. Participants' performance in
discrimination does not correlate with their performance on a categorization task. The exact
nature of this performance is dependent on the distributional information provided in the input.
Participants in the bimodal group learned to discriminate between two novel categories, whereas
participants in the unimodal training group do not. Their performance in categorization also
reflects the structure of their input.
Robust perceptual learning is demonstrated for these participants. Furthermore, this
learning generalized to productions. This suggests that statistical learning in perception can
generalize to productions even without any explicit production practice during training.

91
Experiment 2 (Chapter 3) examines learning in production after implicit training in more detail.
An open question is whether the type of learning seen here in production is very robust.
Furthermore, this experiment demonstrated that perceptual learning and production
learning are coupled after perception only training. Participants who did learn to make a
difference in their productions between endpoint tokens also performed the best in terms of their
perception at the end of training. Experiments 2 and 3 will also allow for a further examination
of this question, by looking at perceptual learning after training in production.
Finally, we also see that perceptual learning emerges at several time points during
training. Not only do participants begin to show learning in perception after one day of training,
this learning continues even when the participants are not being explicitly trained. Furthermore,
participants continue to learn on the second day of training as well.

92
CHAPTER 3
3.1 Introduction
In Experiment 1, participants were exposed to perception-only training; participants did
not explicitly repeat tokens during training. Experiment 2 examines how adding production to a
perceptual training regimen affects learning in both perception and production.
Several questions can be addressed in this experiment. First, by examining perceptual
learning in discrimination and categorization, we can determine whether production training can,
in concert with perceptual training, result in perceptual learning. If participants in the bimodal
group are better able to discriminate and categorize the new sound contrast than the unimodal
group, this will be evidence that perceptual learning is possible after training that incorporates
both perception and production, and that this learning is sensitive to distributional information in
the input.
In Experiment 1, changes were found in production abilities after training in perception
only. However, one might ask if this change may increase in a different training modality.
Experiment 2 will allow us to differentiate between these possibilities by examining whether
production changes occur after training in production. If participants change their productions of
tokens before and after training, this would be evidence for learning in production.
Additionally, other issues surrounding the relationship between perception and
production can be examined. By examining participants’ performance on the perceptual and
production tests, I will ask whether perceptual change and production change are correlated after
training in production. Even though learning in the two modalities was correlated in Experiment
1, it is possible that learning will be more closely correlated in this experiment, since participants

93
will have substantial exposure to the tokens in both perception and production. However, if no
significant correlation is found this can be taken as evidence for a relatively weak link between
perception and production at early stages of learning, specifically when learning novel sound
categories.
The relationship of perception and production will be examined further by comparing the
results of perceptual and production learning in Experiment 1 and Experiment 2. First, I will
address whether perceptual learning is influenced by training modality. Even if learning occurs
in both of the bimodal groups in the two experiments in terms of their discrimination and
categorization abilities, it is possible that these discrimination abilities will be different across
groups.
Furthermore, by comparing production performance across the two experiments, it will
be possible to examine whether production learning is affected by training modality. Although
production changes were not observed in Experiment 1, any increased changes in Experiment 2
as compared to Experiment 1 will be suggestive of the influence of training modality on
production learning. However, an explicit comparison across the two modalities will further
investigate this relationship.
3.2 Methods: Perception + Production training and testing
This experiment examines changes in perception and production after training in both modalities.
Because production necessarily contains a perceptual component (i.e., auditory and/or
somatosensory feedback, in addition to hearing the target to be produced), production was not

94
isolated. Instead, production training was added to the perceptual training paradigm from
Experiment 1 in order to examine changes in both modalities after training that emphasizes
production.
3.2.1 Participants
Forty-one Northwestern University undergraduates (8 males, 33 females) participated in this
experiment. Nine participants did not complete training or meet the acceptance criterion as
defined in Section 2.2.1 and were excluded from analysis, leaving a total of 32 participants. All
included participants were native, monolingual English speakers. All participants were either
paid for their participation or received course credit. As in Experiment 1, each training group in
Experiment 2 contained 16 participants. Participants were divided into two training groups: a
unimodal exposure group and a bimodal exposure group.
3.2.2 Stimuli
The stimuli in Experiment 2 are identical to those in Experiment 1. Test and training stimuli are
drawn from the same continua formed for Experiment 1. The bimodal exposure group in
perception+production training was exposed to the same distribution as the bimodal exposure
group in perception-only training in Experiment 1 during the perception portion of their training.
The same is true for the unimodal exposure groups in the two Experiments.

95
3.3 Procedure
As in Experiment 1, all training and testing took place in a large, single-walled sound booth.
Visual stimuli were presented on a computer screen. Audio stimuli were presented over speakers
at a comfortable volume for the participant. All tasks were self-paced. Production responses
were made using a head-mounted microphone. All productions by the participants were
recorded. All recordings were made at 22.05 kHz. Responses in perception tasks were made
using a button box, which was also used to advance to the next trial in production tasks. Training
and testing took place over two consecutive days.
All training and testing occurred in the same order as in Experiment 1. Participants in
this study trained for two consecutive days.
3.3.1 Training
As in Experiment 1, the distribution of stimuli given to a particular participant depended on
which training group the participants are assigned to (i.e., unimodal or bimodal). However,
unlike Experiment 1, rather than responding to the perception stimulus with a button-press,
participants in this group heard a stimulus, saw the paired picture, and then imitated it.
Productions were recorded throughout the training sessions.
The instructions for the production task were essentially the same as in the repetition test.
Participants were instructed to produce their response as closely as they could to the target token
they heard. As in Experiment 1, participants were instructed to pay close attention to the words
they heard, and to pay attention the matching pictures. Furthermore, participants were told that
repeating the words was a way of ensuring that they were paying attention to the tokens during

96
training. Training was entirely self-paced, though participants could only hear each token one
time before they were instructed to repeat it. They were instructed to repeat each token only one
time before pressing a button to advance to the next trial. Any tokens that were repeated more
than once, were clear errors, or self-corrections were excluded from analysis.
Picture pairing occurred as described for Experiment 1, with pictures being pseudo-
randomized in their pairing with continua. As in Experiment 1, participants in the unimodal
group were exposed to either picture set A, or picture set B.
3.3.2 Testing
Testing in Experiment 2 was identical to that in Experiment 1. Participants completed
discrimination and repetition tests at the beginning and end of each training day, and naming and
categorization tests at the end of each day. The actual content of each test was identical to that in
Experiment 1.
It should be noted that for participants in Experiment 2, the repetition test was nearly
identical to their training task. The major difference is that during training, tokens were paired
with pictures before the participant was to repeat them. The repetition task lacked any visual
stimulus.
3.3.3 Training and Testing regimen
Training and testing were interleaved in an identical way to Experiment 1, with each block of
training containing significantly more repetitions of the training tokens than any block of testing.

97
On average, the training regimen in Experiment 2 took slightly longer each day than in
Experiment 1, due to the added number of productions in the task. This increase was not very
large, as training and testing still took around one hour to complete each day.
3.4 Results
3.4.1 Discrimination Test
3.4.1.1 Predictions
As in Experiment 1, if participants in the bimodal training group successfully learn two
novel categories after training, I expect their sensitivity to across-category comparisons should
significantly increase from day 1 pre-test to day 2 post-test. However, their sensitivity to within-
category comparisons should remain stable, or decrease if they have a very high baseline
sensitivity to the contrasts. If they only learn to infer one novel category after training, the
unimodal group should not become more sensitive to either type of contrast. Their performance
on these tasks should remain stable or decrease.
3.4.1.2 Analysis
Analysis of discrimination data was performed in the same manner as in Experiment 1.
Participants’ responses (i.e., “same” or “different”) were converted into d' scores for each
participant in order to assess listeners’ discrimination abilities. Each participant has two d'
scores, one for across category comparisons and one for within category comparisons.

98
Linear mixed effects regressions were used to analyze the data, with significance for each
predictor being determined using Markov Chain Monte Carlo procedures.
3.4.1.3 Sensitivity
As in Experiment 1, participants in neither training group demonstrate sensitivity to the
within- or across-category comparisons at pre-test, and the groups do not perform differently
from each other at pre-test. Figure 3.1 shows the d' scores for participants at pre-test.
Figure 3.1 d' scores for participants before training. Error bars represent standard error.
The lack of significant baseline differences was confirmed using a mixed effects
regression including training group and comparison type as fixed effects and participants as a
random intercept. The main effect of training was not significant (t<1), which suggests that the
two groups were not different from one another in terms of baseline discrimination abilities.
Furthermore, the main effect of comparison type (i.e., within- and across-category) is not

99
significant (t<1). This also suggests that there are not significant differences between
comparison types at baseline.
Learning was assessed by examining performance on the post-test on Day 2. Figure 3.2
shows the mean d' scores for the unimodal and bimodal training groups after training for both
within and across category comparisons.
Figure 3.2 Participants’ d' scores after two days of training. Error bars represent standard error.
To assess perceptual learning, a mixed effects regression was performed on
discrimination data from Day 1 pre test and Day 2 post-test. The regression model included
main effects of training day, comparison type, and training group, all of their interactions, and a
random intercept for participant. None of the main effects are significant (t<1). Furthermore,
none of the interactions between training group, training day, and comparison type reach

100
significance (t<1). This suggests that participants in neither group significantly improve from
pre- to post-test on either type of comparison.
While there are no main effects or interactions, it does appear as if the bimodal training
group shows a very small change in their sensitivity to across-category contrasts but not to
within-category contrasts. This resembles the change demonstrated by the bimodal training
group in Experiment 1. Further examination of individual performance reveals that some
participants resemble those in the bimodal training group in Experiment 1. That is, they have a
fairly high sensitivity to across-category comparisons. However, more than half of the subjects
are performing at chance on this task, demonstrating a very different pattern of learning from
Experiment 1. The unimodal group shows no such variation. Figures 3.3 and 3.4 below show
individual performance on across-category comparisons after training for the bimodal and
unimodal training group. Differences between the training groups in Experiments 1 and 2 will
be discussed further below.

101
Figure 3.3: Individual performance on across-category comparisons for bimodal training
participants.
Figure 3.4 Individual performance on across-category comparisons for the unimodal training
participants.

102
Adding location on the continuum, order of presentation, and continuum as predictors to
the regression did not improve the fit of the model. Therefore, it is clear that there were no
significant differences in participants’ abilities to discriminate between tokens at the edges of the
category boundary (i.e., the 1-8 comparison) and tokens near the center of the category boundary
(i.e., the 3-6 comparison). Furthermore, there were no significant differences in participants’
sensitivity to contrasts that were dependent on the order the stimuli were presented (e.g., when
stimulus 1 was presented before stimulus 8, participants were no better or worse than when
stimulus 8 was presented before stimulus 1 in a particular discrimination trial). Finally,
participants were no better or worse at discrimination on any particular continuum (χ2<1 for all
comparisons).
In sum, participants in the bimodal and unimodal groups did not perform significantly
differently on this discrimination task before or after training. That is, as a group, participants in
the bimodal training group failed to successfully learn to discriminate two novel categories
during training. This pattern is different than that shown by the two training groups in the
perception-only training in Experiment 1.
3.4.1.4 Comparison of Sensitivity in Experiment 1 and Experiment 2
To compare perception-only training and perception+production, regressions were run
that used modality, training group, training day, and contrast type as predictors. The regression
also included all the interactions between these factors and random intercepts for participants.
There was a significant main effect of day (β=0.54, s.e=0.2, t=2.73, p<0.01), suggesting that
overall participants performed differently on day 1 than day 2. There were also several

103
significant interactions. The first was between training modality (perception-only or
perception+production) and training day (β=0.55, s.e=0.29, t=-1.94, p<0.05). This suggests that
the differences in performance across days are dependent on the training modality. There is also
an interaction between training day and comparison type (β=-0.76, s.e=0.28, t=-2.69, p<0.01).
This suggests that participants perform differently on across and within category comparisons on
day 1 and day 2. Finally, there is three-way interaction between training group (bimodal vs.
unimodal), training day, and comparison type (β=1.11, s.e=0.4, t=2.76, p<0.006), consistent with
learning occurring in the bimodal groups. Although the four-way interaction between training
group, training modality, training day, and comparison type did not reach significance (β=-0.78,
s.e=0.57, t=-1.36, p=0.18), the interaction between training modality and training day suggests
that there is a difference in how training modality influences perceptual learning. This is
bolstered by the fact that the bimodal and unimodal training groups are significantly different
from one another in Experiment 1 but not significantly different from one another in Experiment
2. These facts suggest that adding production to a perceptual training regimen negatively
influences perceptual learning. For the purpose of comparison, post-test performance for the
four training groups in Experiments 1 and 2 is shown in Figure 3.5 below.

104
Figure 3.5 Post-test performance for the four training groups in Experiment 1 and 2. Bimodal
and unimodal perception participants perform significantly differently from one another.
Participants in the bimodal and unimodal perception+production training groups do not.
However, as mentioned before, it is not the case that perceptual learning is depressed for
all subjects. Several participants in the bimodal perception+production training group do show
robust perceptual learning. A number of factors were examined as potential predictors for
perceptual learning for participants in the bimodal training. Baseline perception abilities did not
significantly improve the fit of the regression. It is also possible that because participants in the
perception+production training group have larger demands on their attention (and because they
do show learning in production), their perceptual learning may simply be slowed down. Perhaps
with additional training time, participants in the perception+production training group would be
able to learn to discriminate between the two new sound categories. This possibility is
examined in Experiment 3.

105
3.4.1.5 Interim Discrimination Sensitivity
As discussed in section 2.4.1.4, sensitivity was also assessed at a variety of points during
training (i.e., at the beginning and end of each training day). Through examination of this data, it
is possible to begin to examine the timeline of perceptual learning. Once again, learning was
assessed using linear mixed effects regressions. The regression model included the main effects
of training day, test (pre vs. post), comparison type, and training group, all of their interactions,
and a random intercept for participant. Like the overall analysis, these regressions failed to show
evidence of learning. There was no interaction of training group with either test number or test
day (ts<1).
Bimodal training groups from Experiment 1 and Experiment 2 were also compared using
linear mixed effect regressions. The regression model included the main effects of training day,
test, comparison type, and training modality, all of their interactions, and a random intercept for
participant. Inspection of the figures below show that both of the bimodal training groups show
increased discrimination abilities across days. However, this difference is greater for the
perception-only training group. This difference is revealed first by a main effect of training
modality (β=-0.49, s.e=0.24, t=-2.02, p=0.03), and by a two-way interaction between training
modality and training day (β=0.65, s.e=0.27, t=2.46, p=0.02). Furthermore, the bimodal
perception-only training group's improvement is limited to the across category distinctions,
which yields a significant three-way interaction between training modality, training day, and
contrast type (β=-0.79, s.e=0.38, t=-2.13, p=0.03).
The main effect of training modality was significant for follow-up regressions examining
Day 1 pre-test vs Day 1 post-test (β=-0.49, s.e=0.24, t=-2.02, p=0.05) and Day 1 post-test vs.

106
Day 2 pre-test (β=-0.49, s.e=0.26, t=-1.87, p=0.05), showing overall greater discrimination for
the bimodal perception group. In all regressions there were significant interactions of training
modality and comparison type (Day 1 pre-test vs. Day 1 post-test: β=0.53, s.e=0.26, t=2, p=0.04;
Day 1 post-test vs. Day 2 pre-test: β=-1.2, s.e=0.2, t=-5.9, p=0.001; Day 2 pre-test vs. Day 2
post-test: β=-0.72, s.e=0.3, t=-2.43, p=0.03), revealing the difference between the perception and
perception+production training groups is concentrated in the across-category comparison.
Figures 3.6, 3.7, 3.8, and 3.9 show the across category discrimination for the bimodal perception-
only training group, the unimodal perception-only training group, the bimodal
perception+production training group and the unimodal perception+production training group.
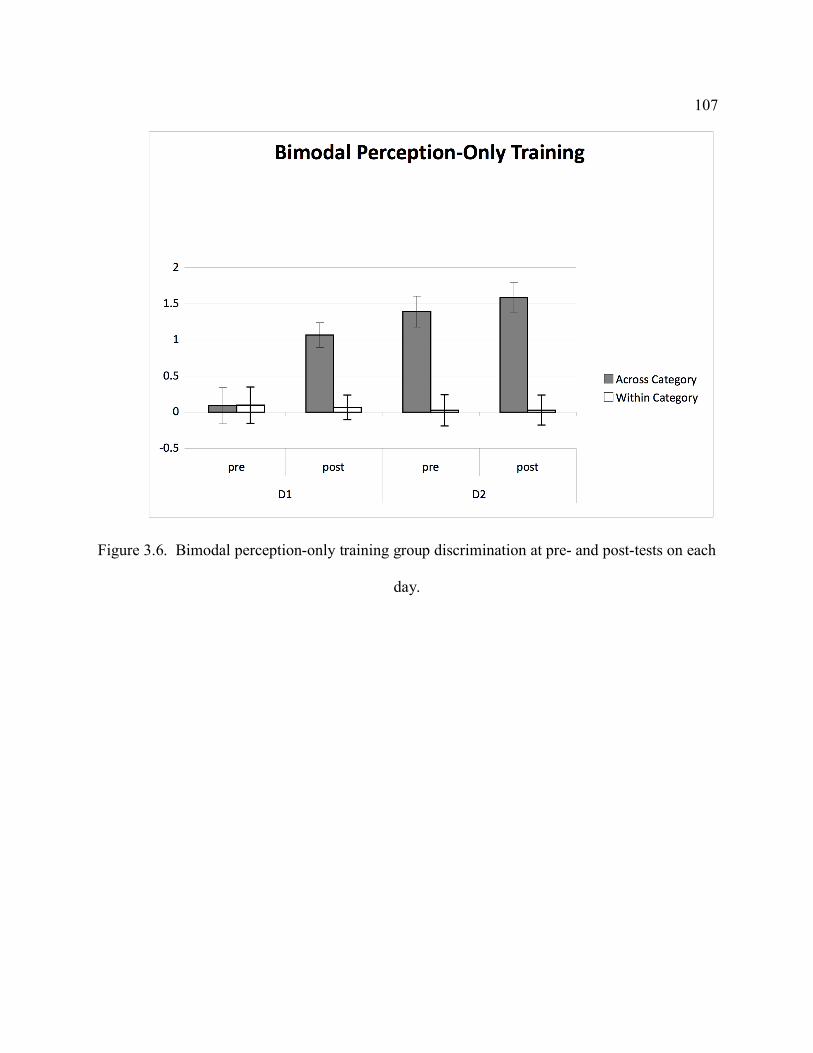
107
Figure 3.6. Bimodal perception-only training group discrimination at pre- and post-tests on each
day.

108
Figure 3.7 Unimodal perception-only training discrimination at pre- and post-tests on each day

109
Figure 3.8. Bimodal perception+production training group discrimination at pre- and post-test
on each day.

110
Figure 3.9. Unimodal perception+production training group discrimination at pre- and post-test
on each day.
3.4.2 Categorization
3.4.2.1 Predictions
As in Experiment 1, if participants in the bimodal group have learned to infer two new
categories after training, and this learning is not only applicable to the very fine-grained level of
phonetic representations but also to higher levels of lexical-phonological processing, we would
expect their performance on the categorization of these new picture-“word” pairings to be quite
accurate. That is, participants should be able to correctly categorize tokens as corresponding to
one picture label or another. Furthermore, we expect this categorization ability to correlate

111
roughly with their discrimination ability. Finally, unimodal participants should also be quite
accurate at this task, since they only learn three new picture-“word” pairings during training.
They should have a fairly low level of confusability between tokens they hear during this test.
3.4.2.2 Analysis
Analysis proceeded as in Experiment 1. Participants’ responses were scored as “correct”
or “incorrect” and reaction times were recorded. Furthermore, stimuli were divided into those
which wear near to the experiment imposed category boundary and those which were far from it.
As in Experiment 1, it is difficult to compare overall accuracy across the unimodal and
bimodal training groups. Because the bimodal group learned more new picture-word pairs
(many of which had a highly confusable similar word learned during training), their task was
more difficult than the unimodal group. Therefore, the performance of the two groups will only
be compared in some of the analyses which address performance relatively independently of
these factors.
3.4.2.3 Accuracy
As in Experiment 1, participants in the unimodal training group were very accurate at this
task. Overall accuracy was 97.78% correct; median performance was 100% correct. Because of
the nature of this task, all errors were across continuum errors for the unimodal group. The
unimodal group did not perform significantly differently on the “near” stimuli or the “far”
stimuli (average accuracy: 97.22% correct for far tokens, 98.33% correct for near tokens,
median performance: 100% for both groups).

112
As expected the bimodal group was much less accurate than the unimodal group. Overall
accuracy was 64.09% correct; median performance was 62.5% correct. Most of the errors
participants made were within-continuum. That is, participants most often misidentified tokens
as being paired with the picture from the opposite category. However, participants also made a
relatively large number of across-continuum errors. Overall, participants misidentified a total of
288 tokens during categorization. 251 of those were within-continuum errors, and 37 of these
were across-continuum errors. Overall accuracy on near vs. far tokens for both the unimodal and
bimodal training groups is shown in Figure 3.10 below.
Figure 3.10 Proportion correct scores for the bimodal and unimodal training groups for near and
far tokens.
These between group differences were assessed using a logistic regression. The model
included training group and token location, their interaction, and random intercepts for
participants. Higher accuracy for unimodal participants is reflected in a main effect of training
group (β=2.9, s.e=0.41, z=7.1, p<0.001). There was no main effect of token location (i.e., far vs.

113
near; z<1). A significant effect interaction between training group and token location (i.e., near
vs. far; β=1.08, s.e=0.57, z=1.9, p<0.05) suggests that the location of the token on the
continuum significantly affects accuracy for participants in the bimodal training group, but not in
the unimodal training group.
3.4.2.4 Reaction Time
A similar regression was performed on reaction times for correct tokens including
training group, token location, their interactions and a random intercepts for participants.
Participants in the unimodal group respond significantly more quickly overall than participants in
the bimodal training group (β=-360.6, s.e=87.87, t=-4.1, p<0.0001). The main effect of token
location is not significant (β=53.6, s.e=38.9, t=1.38, p=0.17). Numerically, participants in the
bimodal group are slower at responding to tokens that are near the category boundary than far
from the category boundary; however, this interaction does not reach significance, however
(β=71.56, s.e=50.95, t=-1.4, p<0.16). Average reaction times for correct responses to near and
far tokens for each group are shown in Figure 3.11 below.
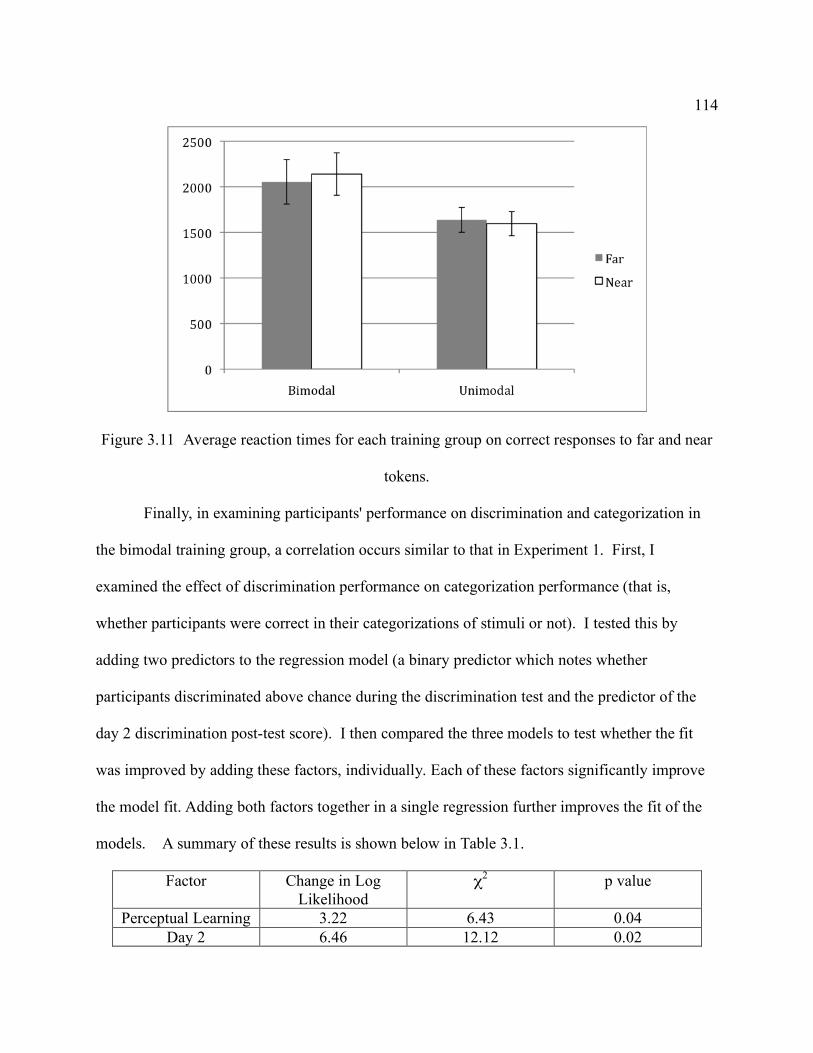
114
Figure 3.11 Average reaction times for each training group on correct responses to far and near
tokens.
Finally, in examining participants' performance on discrimination and categorization in
the bimodal training group, a correlation occurs similar to that in Experiment 1. First, I
examined the effect of discrimination performance on categorization performance (that is,
whether participants were correct in their categorizations of stimuli or not). I tested this by
adding two predictors to the regression model (a binary predictor which notes whether
participants discriminated above chance during the discrimination test and the predictor of the
day 2 discrimination post-test score). I then compared the three models to test whether the fit
was improved by adding these factors, individually. Each of these factors significantly improve
the model fit. Adding both factors together in a single regression further improves the fit of the
models. A summary of these results is shown below in Table 3.1.
Factor Change in Log Likelihood
χ2 p value
Perceptual Learning 3.22 6.43 0.04 Day 2 6.46 12.12 0.02

115
Discrimination Test Day 2
Discrimination Test and Perceptual
Learning
40.98 100.04 0.0001
Table 3.1 Model comparison statistics for categorization accuracy as a function of discrimination
performance
A scatter plot of categorization and discrimination performance is shown below in Figure
3.12 This suggests that participants' performance in categorization is significantly correlated with
their performance abilities in categorization. The model fit is still improved by day 2
discrimination test score even if the participant with the best performance in discrimination is
removed from the regression.
Figure 3.12 Correlation between performance in discrimination and categorization. Participants
categorization performance is shown on the x-axis and their discrimination performance (at Day
2 post-test) is shown on the y-axis.

116
The fit of reaction time regressions for correct productions was not significantly affected
by participants' performance during discrimination or the more gross measure of whether they
learned in discrimination (ps>0.5).
In summary, categorization perfomance demonstrates that participants in the bimodal
training group as a whole failed to learn two novel categories in perception. However, those who
were able to learn to discriminate to categories also demonstrated increased performance in
categorization. This suggests that for those participants who did learn during training, the
learning was robust and may have occurred at multiple levels of representation.
3.4.2.4 Comparison of Categorization in Experiments 1 and 2
To compare perception-only training and perception+production training, regressions
were run that included modality, training group, training day, token location, and their
interactions as factors and random intercepts for participants. Categorization accuracy shows
slightly less robust differences in terms of interactions between training modality and
performance. In categorization accuracy, there are main effects of training modality (β=-0.55,
s.e=0.22, z=-2.5, p<0.02) and training group (β=2.7, s.e=0.41, z=6.5, p<0.001). This
demonstrates that the unimodal groups are more accurate than the bimodal groups regardless of
training modality. Furthermore, the perception-only training groups are also more accurate than
the perception+production training groups. Similar regressions were run for reaction time using
the same factors as the regression for accuracy. The only main effect for reaction time is training
group (β=-493.2, s.e=260, t=-1.9, p<0.05). Participants in the unimodal training groups

117
responded more quickly to the task regardless of training modality. There were no significant
interactions for any predictors in either regression (t<1).
3.4.3 Repetition
3.4.3.1 Predictions
Although, as a group, participants in the two training groups did not demonstrate
perceptual learning that reflects the structure of their input, they were asked to explicitly repeat
tokens during training. Therefore, it is possible to now examine whether changes in production
occur, even in the absence of robust perceptual learning. If these changes do occur, it should be
expected that participants in the bimodal group will make a bigger difference in their repetitions
of endpoint tokens at the end of two days of training than they do at the beginning of training.
Specifically, we should expect to see participants producing longer voice onset times for token 8
than token 1. Furthermore, token 1 should be pre-voiced more often than token 8. These
differences ought to increase from pre- to post-test if participants are learning to change their
productions.
It is also possible that the unimodal group will collapse any distinction they make
between the two types of tokens. Furthermore, it is possible that if participants in the bimodal
group do make a bigger difference between endpoint tokens, the amount of change will correlate
roughly with the amount of change they make in the discrimination task from pre- to post-test.

118
3.4.3.2 Analysis
Participants’ productions were classified into one of four groups: short-lag tokens, pre-
voiced tokens, mixed tokens (with substantial periods of pre-voicing and aspiration), and mixed
tokens with a pause (with a substantial period of prevoicing, a period of silence, and a period of
aspiration). Only “correctly” produced tokens (i.e., short-lag and prevoiced tokens) were used
for the analyses reported here. Proportion of tokens that were mixed are reported below in
Section 3.4.3.5.
Participants voice onset times were compared. Only the endpoint tokens (tokens 1 and 8)
were compared, since this is where participants are expected to make the largest differences in
production. I also report vowel durations and the ratio of VOT and vowel duration for short-lag,
endpoint tokens. Additionally, the proportion of tokens which were prevoiced are also reported
for tokens 1 and 8. Because there were no significant differences across continua, all continua
are collapsed together in the analyses reported here.
Once again the data were analyzed using linear mixed effects regressions (for short-lag
voice onset time due to the low rate of pre-voiced productions in Figures 3.13 and 3.14 below;
see Experiment 1 for an explanation of analysis of only short lag tokens) and linear mixed effects
logistic regressions (for proportion of tokens that were prevoiced). Regressions included main
effects for training group, training day, token number, their interactions and a random intercept
for participants.

119
3.4.3.3 Repetition
Figures 3.13 and 3.14 show the average voice onset time at pre- and post-test for short lag
tokens for the unimodal and bimodal training groups.
Figure 3.13 Average voice onset time for the unimodal training group before and after training.

120
Figure 3.14 Average voice onset time for the bimodal training group before and after training.
The main effect of training day was significant (β=-0.07, s.e=0.018, t=-3.6, p<0.0004),
which suggests that voice onset time changed from day 1 to day 2. Main effects of training
group and number were not significant (t<1). There was a significant three-way interaction
between training group, day and number (β=0.09, s.e=0.03, t=2.9, p<0.004). Examining
performance it is clear that participants in both groups make small differences between tokens 1
and 8 on day 1. However, participants in the bimodal training group make a larger difference
between tokens 1 and 8 on day 2 than on day 1. The unimodal training group does not make a
larger difference between these tokens; in fact, they decrease the difference between the tokens
from day 1 to day 2.

121
Figures 3.15 and 3.16 below show the vowel duration for tokens. There were no
significant main effects or interactions in the examination of vowel duration. Figures 3.17 and
3.18 show the proportion of voice onset time and vowel duration. Those effects that are
significant for raw VOT are also significant for the proportion of VOT and vowel duration.
Figure 3.15 Vowel duration for short lag tokens produced by the bimodal training group before
and after training

122
Figure 3.16 Vowel duration for short lag tokens produced by the unimodal training group before
and after training
Figure 3.17 Proportion of VOT and vowel duration for short lag tokens produced by the
unimodal training group before and after training

123
Figure 3.18 Proportion of VOT and vowel duration for short lag tokens produced by the
unimodal training group before and after training
Figures 3.19 and 3.20 below show the proportion of tokens that were pre-voiced at pre-
and post-test for the unimodal and bimodal training groups.

124
Figure 3.19 Proportion of tokens that were produced with prevoicing for the unimodal training
group before and after training.
Figure 3.20 Proportion of tokens that were produced with prevoicing for the bimodal training
group before and after training.

125
When examining the proportion of tokens that are prevoiced, the only significant main
effect was training day (β=0.92, s.e=0.4, z=2.1, p<0.04). This suggests that participants overall
prevoice more often on day 2 than day 1. Although participants are making some changes in
their productions in terms of prevoicing, these changes are not dependent on training modality.
Furthermore, there is an interaction between training day and number. That is, participants
prevoice token 1 more often than token 8 and this difference is larger on day 2 than on day 1.
Although the three way interaction between training group, day and number is not significant
(z<1), follow-up regressions examining only the bimodal and unimodal training groups suggest
that this difference in tokens across days is driven by the bimodal training group. For the
bimodal training group, there is a main effect of day (β=0.92, s.e=0.5, z=2.2, p<0.04) and an
interaction between day and token number (β=-.24, s.e=0.11, z=-2, p<0.04). For the unimodal
training group there are no significant main effects or interactions (zs < 1).
This suggests that participants in the bimodal training group make a bigger difference
between token 1 and token 8 at post-test than at pre-test, but the unimodal group does not make
this difference.
Since the perception+production training resulted in learning in production for the
bimodal training group, it is possible to examine whether those participants' change in
production was related to any amount of change in perceptual learning. To examine this, I
compared two regressions for the bimodal perception+production training group. One model
included training day and token number as predictors. The second model included training day,
token number, and day 2 discrimination performance. The model that included day 2
discrimination was not a significantly better fit than the model which did not include that factor
(Change in log likelihood=16.25, χ2=8.1, p=0.09). This suggests that for the

126
perception+production participants, performance in production is not related to performance in
perception. Figure 3.21 below shows day 2 discrimination and day 2 repetition performance.
Figure 3.21 Discrimination Day 2 performance and Difference between tokens 8 and 1 on Day 2
Although participants in the perception+production training group do not change their
perceptual patterns to reflect the input of their training on a novel sound category, they do make
changes in their productions. Participants in the bimodal training group, begin to produce tokens
1 and 8 with greater differences after training than before, even though they are unable to
discriminate or categorize differences. However, participants in the unimodal group do not
increase differences between tokens 1 and 8. This demonstrates that production change is
dependent not on perceptual learning, but rather on the distribution of the input during
production practice.
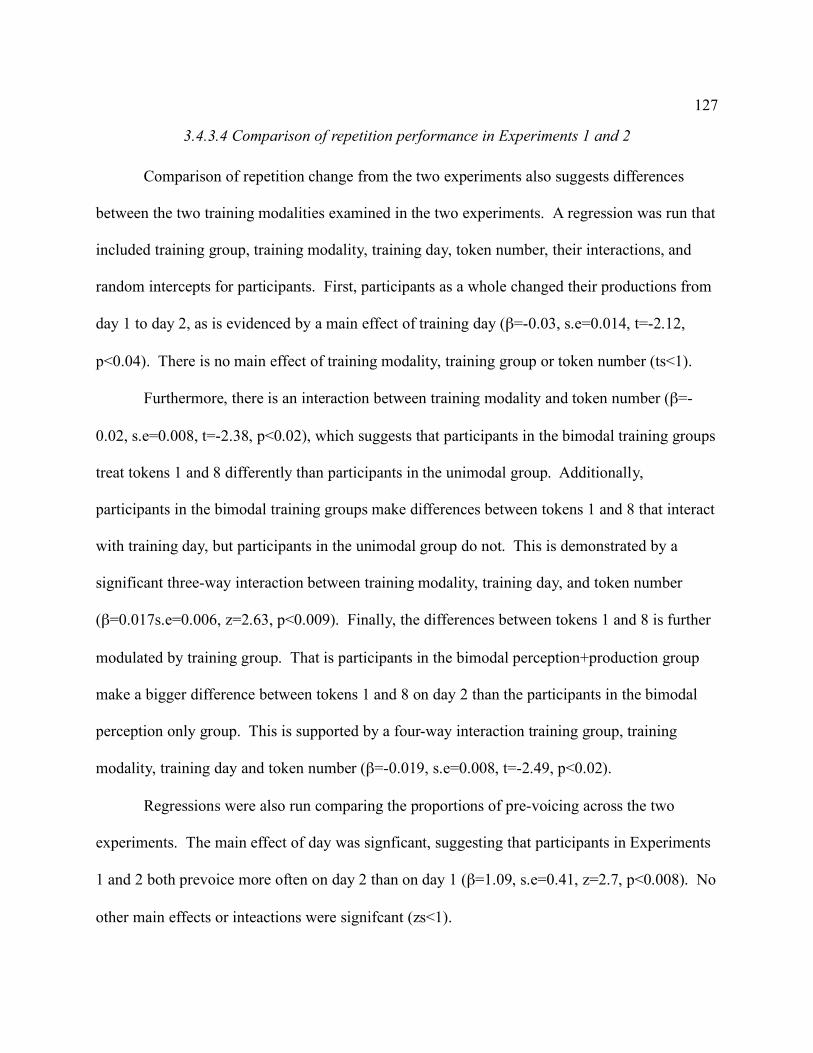
127
3.4.3.4 Comparison of repetition performance in Experiments 1 and 2
Comparison of repetition change from the two experiments also suggests differences
between the two training modalities examined in the two experiments. A regression was run that
included training group, training modality, training day, token number, their interactions, and
random intercepts for participants. First, participants as a whole changed their productions from
day 1 to day 2, as is evidenced by a main effect of training day (β=-0.03, s.e=0.014, t=-2.12,
p<0.04). There is no main effect of training modality, training group or token number (ts<1).
Furthermore, there is an interaction between training modality and token number (β=-
0.02, s.e=0.008, t=-2.38, p<0.02), which suggests that participants in the bimodal training groups
treat tokens 1 and 8 differently than participants in the unimodal group. Additionally,
participants in the bimodal training groups make differences between tokens 1 and 8 that interact
with training day, but participants in the unimodal group do not. This is demonstrated by a
significant three-way interaction between training modality, training day, and token number
(β=0.017s.e=0.006, z=2.63, p<0.009). Finally, the differences between tokens 1 and 8 is further
modulated by training group. That is participants in the bimodal perception+production group
make a bigger difference between tokens 1 and 8 on day 2 than the participants in the bimodal
perception only group. This is supported by a four-way interaction training group, training
modality, training day and token number (β=-0.019, s.e=0.008, t=-2.49, p<0.02).
Regressions were also run comparing the proportions of pre-voicing across the two
experiments. The main effect of day was signficant, suggesting that participants in Experiments
1 and 2 both prevoice more often on day 2 than on day 1 (β=1.09, s.e=0.41, z=2.7, p<0.008). No
other main effects or inteactions were signifcant (zs<1).

128
These results suggest that although participants in the bimodal perception-only training
group demonstrate some changes in production, the changes are not nearly as robust as the
bimodal perception+production training group. Although perceptual training can result in
production learning, more robust production learning results from training that includes
production.
3.4.3.5 Mixed tokens and tokens with pauses
A brief examination of the number of tokens that are produced as mixed or mixed with
pauses, demonstrates slightly different patterns across the two types of training. These tokens
were produced with gestural mistiming that results in a period of prevoicing, occasionally a
small pause, and a period of short-lag aspiration.
On day 1, participants in the bimodal training groups in perception-only training and
perception+production training show the same relative number of tokens that are prevoiced
correctly and these mixed tokens, collapsed across tokens (χ2=0.068, df=1, p=0.79). However,
on day 2, the participants in the perception+production group prevoice correctly much more
often than the participants in the perception-only training group. The number of mixed tokens
they produce is also much less than those participants in the perception-only training group
(χ2=6.035, df=1, p=0.014). Overall, the proportion of tokens with some prevoicing (correct or
incorrect) is not different across the two types of groups. Furthermore, there are no differences
between the unimodal and bimodal training groups with regard to this prevoicing. Figure 3.22
demonstrates this pattern.

129
Figure 3.22 Proportion of tokens produced with correct prevoicing or mixed prevoicing and
aspiration for participants on day 1 and day 2. Figure collapses across training group (i.e.,
bimodal and unimodal) and all test tokens (i.e., tokens 1, 3, 6, and 8).
3.4.4 Naming
3.4.4.1 Predictions
Because participants do show some changes in terms of their repetition abilities as a
function of training, it is possible that these changes occur not only at a level reflecting fine-
grained phonetic detail, but also at the lexical level of repetition. Naming requires lexical access.
Therefore, if participants' production learning generalizes to the lexical level, participants in the

130
bimodal group may make differences between tokens from the left and right sides of the
continuum.
3.4.4.2 Analysis
As in the repetition task, participants’ productions were classified into one of four groups:
short-lag tokens, pre-voiced tokens, mixed tokens (with substantial periods of pre-voicing and
aspiration), and mixed tokens with a pause (with a substantial period of prevoicing, a period of
silence, and a period of aspiration). Only “correctly” produced tokens (i.e., short-lag and
prevoiced tokens) were used for the analyses reported here.
Participants voice onset times for short-lag tokens were compared. These productions
were classified as being intended as being from the left or right end of the continuum.
Once again the data were analyzed using linear mixed effects regressions (for short-lag
voice onset time) and linear mixed effects logistic regressions (for proportion of tokens that were
prevoiced).
3.4.4.3 Naming results
There are no significant main effects of training group or token, nor are there any
interactions. That is, participants in the bimodal training group do not differentiate between
"words" from the right or left side of the continuum in naming, even though they do make some
differences during repetition (all ts and zs<1 for main effects and interactions).

131
3.5 Conclusions
This experiment provides a further examination of the relationship between perception
and production. Participants in this experiment did not demonstrate significant perceptual
learning that reflected the distributional information of the input they were provided during
training. They did not demonstrate this learning in categorization or discrimination. It appears
that simply adding production to an existing perceptual training regimen disrupts perceptual
learning for many participants.
Furthermore, participants demonstrate a different pattern of learning over the course of
the two days of training. Specifically, participants in the bimodal perception+production group
do not demonstrate any changes overnight, while the bimodal perception-only training group
does demonstrate small changes overnight.
However, it is not the case that all participants experience similarly depressed
performance. Therefore, it is important to ask why adding production to a perceptual training
regimen results in less learning for some participants, but not for others. Several possibilities
were excluded in regressions that did not find significant correlations. Other possibilities will be
addressed in Experiment 3 (Chapter 4) and in the General Discussion (Chapter 5).
Although these participants do not learn in perception, they do show fairly robust changes
in production. Specifically, participants in the bimodal training group make a bigger difference
between endpoint tokens 1 and 8 after training than they do before training. This is particularly
interesting because even participants who are unable to reliably perceive this distinction
demonstrate changes in production. This suggests that participants are sensitive to distributional
information in the input during production learning, but that they are unable to exploit this
information during perceptual discrimination or categorization.

132
This study demonstrates that perceptual learning and production learning are not strongly
coupled. Participants who learn in production do not necessarily show robust learning in
perception. If perception and production were tightly coupled, this result would be unexpected.
Comparison of the two experiments provides further indication that perceptual learning and
production learning are more dependent on training modality than they are on learning occurring
in the opposite modality. Perceptual training results in more robust perceptual learning than
training that includes production. Furthermore, production learning can occur in the absence of
perceptual learning. If production learning were parasitic on perceptual learning, this finding
would also be unexpected.

133
CHAPTER 4
4.1 Introduction
In Experiments 1 and 2 participants were trained for two consecutive days in either
perception-only or perception+production. While some changes were observed in the bimodal
training groups, these changes were reflected most strongly in the primary training modality of
the participants. That is, participants who were trained in perception-only demonstrated
increased sensitivity to the new sound contrast in perception, in contrast, participants who were
trained in perception and production did not demonstrate such change, even though they received
the same amount of perception exposure as participants in the perception only training group.
While both bimodal training groups demonstrated changes in production after training, these
changes were greater for the bimodal perception+production training group than for the
perception-only training group.
Experiment 3 examines the possibility that the less robust learning that occurs in each of
the training groups is caused by the relatively short training time. If participants receive an
additional day of training, could learning from one modality transfer to the other modality? That
is, is learning being delayed or is the cause of the disruption deeper than a simple delay?
This experiment will allow for a deeper investigation of the relationship of perception
and production. For instance, if perceptual learning emerges for the perception+production
training group, this would that learning can occur in both modalities after training. Learning in
perception is simply delayed compared to participants in the perception only training. An
increase in learning in production for the perception-only training group would also demonstrate
this. This would suggest that even though the two training modalities are not strongly connected

134
at early stages of learning, there is a link between the two modalities that allows transfer of
learning in one modality to the other modality.
However, if learning does not occur, or does not occur with the same strength as learning
in the trained modality, the relationship between the two modalities during category formation
must be slightly more complex. That is, if learning in perception is not robust, even after three
days of training of perception+production, alternate explanations must be explored for how the
two modalities are connected. By exploring the relationship of learning in perception and
production when training focuses on one of these two modalities, the relationship between these
two modalities will become more clear.
4.2 Methods: Three day training
4.2.1 Participants
Forty-five Northwestern University undergraduates (19 males, 26 females) participated in this
experiment. Thirteen participants did not complete all three days of training and were excluded
from analysis, leaving a total of thirty-two participants. All participants were native,
monolingual English speakers. All participants were paid for their participation. As in
Experiments 1 and 2, each training group in Experiment 3 contained 16 participants. Participants
were divided into two training groups: a bimodal perception-only training group and a bimodal
perception+production training group. Because robust differences were seen between the
bimodal and unimodal groups in Experiments 1 and 2, using the bimodal training groups only
allowed for a closer examination of modality effects. That is, when learning of two new sound

135
categories is expected to occur, how does training modality affect performance in each tested
modality after three days of training.
4.2.2 Stimuli
The stimuli in Experiment 3 are identical to those in Experiments 1 and 2. Test and training
stimuli are drawn from the same continua formed for Experiment 1. Because both training
groups in Experiment 3 are bimodal exposure groups, there were no differences in the
distributions given to participants in this study.
4.3 Procedure
As in Experiments 1 and 2, all training and testing took place in a large, single-walled sound
booth. Visual stimuli were presented on a computer screen. Audio stimuli were presented over
speakers at a comfortable volume for the participant. All tasks were self-paced. Production
responses were made using a head-mounted microphone. All productions by the participants
were recorded. All recordings were made at 22.05 kHz. Responses in perception tasks were
made using a button box, which was also used to advance to the next trial in production tasks.
Training and testing took place over three consecutive days.
All training and testing occurred in the same order as in Experiments 1 and 2.
Participants in this study trained for three consecutive days. The testing and training order was
the same on all three days of the experiment.

136
4.3.1 Training
As in Experiments 1 and 2, the two bimodal training groups in this experiment were given a
bimodal distribution identical to that given to participants in the bimodal training groups in
Experiments 1 and 2. Participants in the perception-only training group in this experiment
responded to each perception stimulus with a button press, as in Experiment 1. Participants in
the perception+production training group responded to each perceptual stimulus in training by
repeating it, as in Experiment 2.
Instructions for the training task were the same as for Experiment 1 for the bimodal
perception-only training group and Experiment 2 for the bimodal perception+production training
group. For the perception+production training group, any tokens which were repeated more than
once, were clear errors (e.g., “der” was produced instead of “da”), or self-corrections were
excluded from analysis.
Picture pairing occurred as described for Experiments 1 and 2, with pictures being
pseudo-randomized in their pairing with continua. Participants in both training groups were
exposed to both picture set A and picture set B.
4.3.2 Testing
Testing in Experiment 3 was identical to that in Experiments 1 and 2. Participants completed
discrimination and repetition tests at the beginning and end of each training day, and naming and
categorization tests at the end of each day. The actual content of each test was identical to that in
previous experiments.

137
4.3.3 Training and Testing regimen
Training and testing were interleaved in an identical way to Experiments 1 and 2, with each
block of training containing significantly more repetitions of the training tokens than any block
of testing. The total number of training and testing trials in perception were the same across the
two training groups; however, as in Experiment 2, the perception+production training group
actually received twice the number of tokens, due to their own repetitions. Training and testing
took around one hour each day of the training regimen.
4.4 Results
4.4.1 Discrimination Test
4.4.1.1 Predictions
First, a replication of the results from the bimodal training group is expected in
examining participants' performance on day 2. That is, I expect participants in the bimodal
perception-only training to demonstrate robust learning after two days of learning. Additionally,
participants in the bimodal perception+production training group should not demonstrate
perceptual learning after two days. However, on the third day, there may be a performance
increase if learning in perception is simply slowed down for participants in the
perception+production training group. Furthermore, participants in the bimodal perception-only
training group may improve their performance as a function of an increased amount of training.
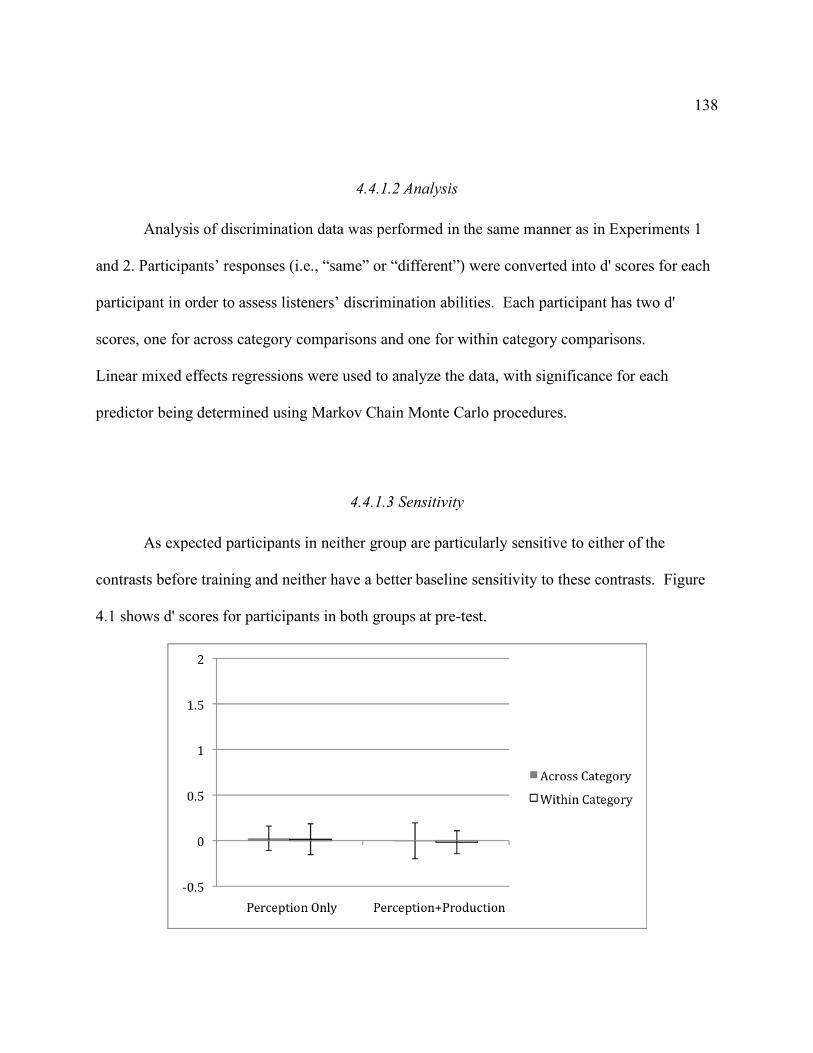
138
4.4.1.2 Analysis
Analysis of discrimination data was performed in the same manner as in Experiments 1
and 2. Participants’ responses (i.e., “same” or “different”) were converted into d' scores for each
participant in order to assess listeners’ discrimination abilities. Each participant has two d'
scores, one for across category comparisons and one for within category comparisons.
Linear mixed effects regressions were used to analyze the data, with significance for each
predictor being determined using Markov Chain Monte Carlo procedures.
4.4.1.3 Sensitivity
As expected participants in neither group are particularly sensitive to either of the
contrasts before training and neither have a better baseline sensitivity to these contrasts. Figure
4.1 shows d' scores for participants in both groups at pre-test.

139
Figure 4.1 d' scores for participants before training. Error bars represent standard error.
The lack of significant baseline differences was confirmed using a mixed effects
regression including training modality and comparison type as fixed effects and participants as a
random intercept. The main effect of comparison type (within- vs across-category) is not
significant (t<1). The main effect of training group verges on significance (β=-0.63, s.e=0.33,
t=-1.88, p=0.062), suggesting that the bimodal perception-only group may have slightly better
baseline discrimination. The interaction between training group and comparison type is not
significant (t<1).
Figure 4.2 shows the mean d' scores for the two bimodal training groups after training on
each of these days.
Figure 4.2 Participants’ d' scores after two and three days of training. Error bars represent
standard error.

140
To assess perceptual learning, a mixed effects regression was performed on
discrimination data from day 1 pre-test and post-tests on days 2 and 3. The regression model
included the main effects of training modality, training day, comparison type, all of their
interactions, and random intercepts for participants. There is a main effect of training day
(β=0.49, s.e=0.1, t=4.72, p<0.0001), which suggests that participants have an increased
sensitivity to the contrast over the course of the three days of training. The main effect of
training modality approaches significance (β=-0.63, s.e=0.33, t=-1.88, p<0.07). This suggests
that, overall, the two training groups perform differently on this task. This replicates what was
seen in Experiments 1 and 2.
There is a significant interaction between training day and comparison type (β=-0.75,
s.e=0.15, t=-5.07, p<0.0001). This suggests that within- and across-category comparisons are
differentially affected by training. Participants in both groups get better at discriminating across-
category comparisons than within-category comparisons. This was also demonstrated in the
comparison between Experiments 1 and 2, discussed in Chapter 3.
A different pattern is found here than in Experiments 1 and 2; none of the interactions
between training group, training modality, training day and contrast were significant in this
experiment (t<1 for all comparisons). This suggests that effect of training type is alleviated by a
third day of training.
To localize the difference between Experiment 3 and the preceding studies, follow up
regressions were performed on pre-test and day 2 post-test as well as on pre-test and day 3 post-
test. The interactions that were present in the comparison between Experiments 1 and 2 are also
present in the regression examining pre-test and day 2 post-test (Training Modality * Training
Day: β=-0.8, s.e=0.19, t=4.2, p<0.0001; Training Modality * Training Day * Comparison Type

141
(β=-0.86, s.e=0.27, t=-3.18, p<0.002). However, when comparing pre-test and day 3 post-test,
neither interaction is significant (ts<1). As shown in Figure 4.2 above, participants in the
perception+production training group demonstrate depressed sensitivity compared to the
perception-only training group after two days. However, this difference disappears by day 3 of
training.
In Experiments 1 and 2, participants demonstrated a wide range of variability in terms of
individual performance on this discrimination task. This was particularly true for the bimodal
perception+production training in which around half of the participants demonstrated some
sensitivity to the new contrast and half of the participants were performing at chance. Figures 4.3
and 4.4 below show individual performance on across-category comparisons after two and three
days of training for the bimodal perception-only training group and the bimodal
perception+production training group, respectively.

142
Figure 4.3 Individual performance on across-category comparisons for bimodal perception-only
training participants.
Figure 4.4 Individual performance on across-category comparisons for bimodal
perception+production training participants. Note: ‘*’ indicates participants who fail to
discriminate across-category tokens after 3 days of training.

143
After two days of training, similar patterns are seen for both training groups in this
experiment. However, after a third day of training, some participants who failed to learn after
two days do demonstrate learning after three days of training. Interestingly, very few
participants in the perception-only training demonstrate a large increase in their sensitivity to this
contrast, even though many of them are not performing at ceiling and receive a significant
amount of additional training in this experiment. It should also be noted that although as a whole
participants in the bimodal perception+production training improve after a third day of training,
there are still a few subjects (subjects 3-6, starred above) who do not show any sensitivity to the
new contrast. This is not seen for any of the participants in the bimodal perception-only training,
even after shorter periods of training. This suggests that even if learning is alleviated, the
addition of production to a perceptual training paradigm disrupts learning severely for some
individuals.
As in Experiments 1 and 2, adding location on the continuum, order of presentation, and
continuum as predictors to the regression did not improve the fit of the regression model.
Therefore, it is clear that there were no significant differences in participants’ abilities to
discriminate between tokens at the edges of the category boundary (i.e., the 1-8 comparison) and
tokens near the center of the category boundary (i.e., the 3-6 comparison). Furthermore, there
were no significant differences in participants’ sensitivity to contrasts that were dependent on the
order the stimuli were presented (e.g., when stimulus 1 was presented before stimulus 8,
participants were no better or worse than when stimulus 8 was presented before stimulus 1 in a
particular discrimination trial). Finally, participants were no better or worse at discrimination on
any particular continuum (χ2<1 for all comparisons).

144
In summary, participants in the two bimodal training groups significantly improve in
their ability to discriminate across categories after training. However, they do not perform
significantly differently from each other after three days of training. This suggests that the lack
of learning demonstrated by participants in Experiment 2 was alleviated after an extra period of
training.
4.4.1.4 Interim Training Discrimination
As in Experiments 1 and 2, discrimination was assessed at the beginning and end of each
training day. Once again, data was analyzed using a linear mixed effects regression. This
regression included main effects of training day, test (pre vs. post), contrast type, training
modality, their interactions, and a random intercept for participants. The main effect of day was
significant (β=.64, s.e=0.22, t=2.93, p=0.003). This suggests that performance overall improves
over days. The main effect of contrast is also significant (β=-0.4, s.e=0.22, t=-1.82, p=0.4),
suggesting that participants discriminate better across categries than within them. Furthermore,
there is a two-way interaction between contrast and day (β=-1.08, s.e=0.31, t=-3.5, p<0.001).
This suggests participants improve in their ability to discriminate across categories over the
course of two days. Finally, there is a three-way interaction between training day, test, and
contrast.
As in the comparison between Experiments 1 and 2, there is a significant three-way
interaction between training modality, test, and contrast when comparing only Day 1 post-test to
Day 2 pre-test suggesting that learning is emerging overnight for the perception-only training
group, but not for the perception+production training group. Interestingly, differences between
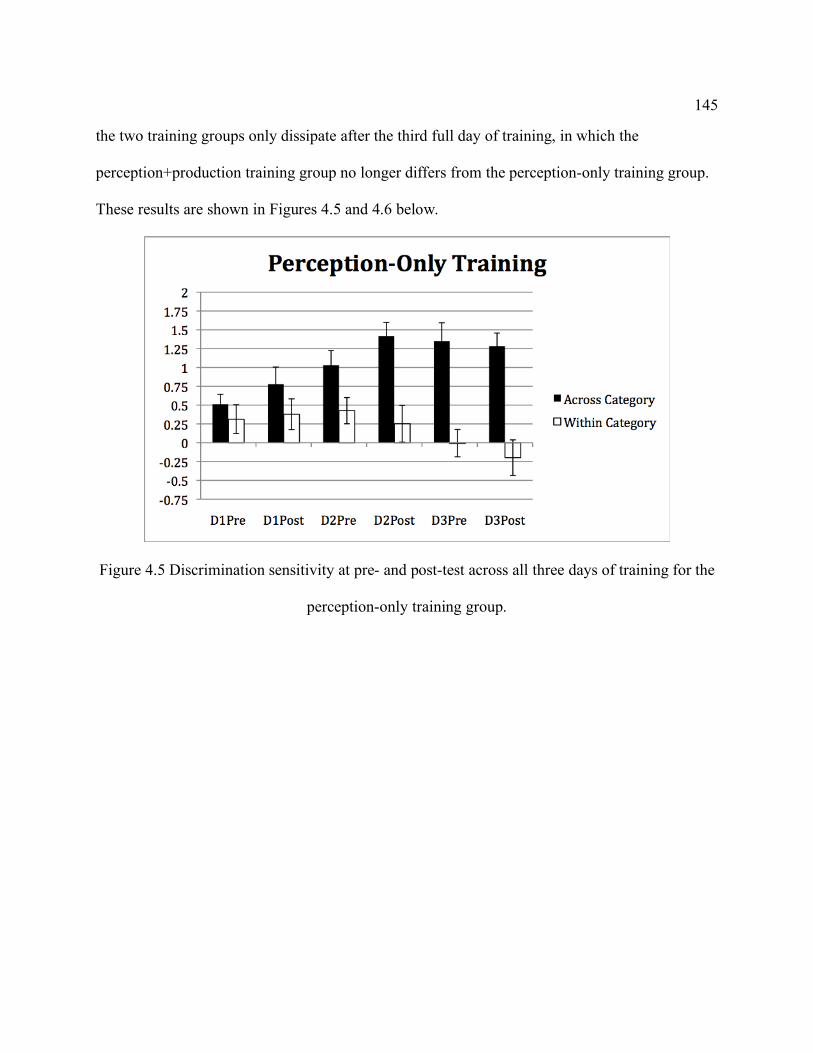
145
the two training groups only dissipate after the third full day of training, in which the
perception+production training group no longer differs from the perception-only training group.
These results are shown in Figures 4.5 and 4.6 below.
Figure 4.5 Discrimination sensitivity at pre- and post-test across all three days of training for the
perception-only training group.

146
Figure 4.6 Discrimination sensitivity at pre- and post-test across all three days of training for the
perception+production training group.
4.4.2 Categorization
4.4.2.1 Predictions
In Experiments 1 and 2, participants in the bimodal perception-only training
demonstrated good categorization performance, whereas participants in the bimodal
perception+production training group demonstrated rather poor performance. Since the
participants in the perception+production training group learned in discrimination after three
days of training, we may see their performance in categorization also improve after the third day
of training.

147
4.4.2.2 Analysis
Analysis proceeded as in Experiments 1 and 2. Participants’ responses were scored as
“correct” or “incorrect” and reaction times were recorded. Furthermore, stimuli were divided
into those that were near to the experiment imposed category boundary and those that were far
from it.
All comparisons are across training groups since, unlike the unimodal groups, the two
training groups in this experiment could be expected to learn the same number of word and
symbol pairings during training. Therefore, the task should be relatively equal for both training
groups.
4.4.2.3 Accuracy
Accuracy was assessed using a logistic regression. The model included training
modality, token location, their interaction, and random intercepts for participants. Participants in
both groups were significantly less accurate at tokens that were far from the category boundary
than those tokens that were close to the category boundary (β=-1.02, s.e=0.29, z=-3.6,
p<0.0001). This did not interact with training day (z< 1). Participants in the bimodal
perception-only training group were also significantly better at categorization than participants in
the bimodal perception+production group (β=-0.7, s.e=0.36, z=-1.97, p<0.05). Critically, the
effect of training group did not interact with day (z< 1; note that the three-way interaction of
group, location, and day was not significant as well z<1). This suggests that even though
participants in the bimodal perception+production training group achieve discrimination levels

148
similar to those participants in the perception-only training group, their categorization abilities
still lag behind the other training group.
However, in performing follow up regressions that examine day 2 post-test performance
and day 3 post-test performance separately from each other, the results suggest that the
differences between training group are driven by differences on day 2 which do not exist on day
3. On day 2, there is a significant main effect of training modality (β=-0.98, s.e=0.4, z=-2.44,
p<0.02), suggesting that participants in the perception-only training perform better on day 2 than
participants in the perception+production training. However, on day 3, this effect is not
significant (z<1).
Overall accuracy on near vs. far tokens for both training groups on day 2 and day 3 is
shown in Figure 4.7 below.
Figure 4.7 Percent correct scores for the bimodal perception-only training group and the bimodal
perception+production training group for near and far tokens. Error bars represent standard
error.

149
4.4.2.4 Reaction Time
A similar regresssion analysis was performed on reaction times for correct responses
These regressions included token location, training modality, training day, their interactions and
random intercepts for participants. No main effects or interactions reach significance (t<1 for all
comparisons). Figure 4.8 below shows average reaction times for far and near tokens for both
training groups on days 2 and 3.
Figure 4.8 Average reaction times for each training group on correct responses to far and near
tokens.
Finally, I examined the relationship between participants' performance on discrimination
and categorization. First, I examined whether performance on discrimination on day 2 or day 3
significantly correlated with accuracy on categorization. Adding day 2 discrimination
performance to the regression model did not significantly improve the fit of the model (χ2<1).
Although adding day 3 discrimination performance did improve model fit (change in log

150
likelihood=6.22, χ2<12.3, p<0.04), this effect seems to be driven by two outliers. The model
comparison does not show differences when these outliers are removed (change in log
likelihood=5, χ2<9, p=0.14).
In summary, categorization demonstrates a slightly different pattern for the two training
groups in this study than the discrimination test did. In discrimination, participants in both
training groups showed a similar degree of high sensitivity to the new contrast after three days.
However, in categorization, participants in the bimodal perception-only training were more
accurate than those in the perception+production training, even on the third day of training. This
suggests that that learning for the perception+production group is slower and may not as robust
in perception as for the perception-only training.
4.4.3 Repetition
4.4.3.1 Predictions
In the discrimination task, participants in the perception+production training demonstrate
an increased sensitivity to the novel sound category. That is, it appears that some learning occurs
in the modality that is not emphasized during training. In Experiment 1, participants in the
bimodal perception-only training group do not demonstrate learning in production. By
examining repetition after three days of training, it is possible that learning will emerge for
perception-only training in the non-trained modality of production. If these changes do occur, it
should be expected that participants in the both will make a bigger difference in their repetitions
of endpoint tokens at the end of three days of training than they do at the beginning of training.
Specifically, we should expect to see participants producing longer voice onset times for token 8

151
than token 1. Furthermore, token 1 should be pre-voiced more often than token 8. These
differences ought to increase from pre- to post-test if participants are learning to change their
productions.
4.4.3.2 Analysis
As in Experiments 1 and 2, participants’ productions were classified into one of four
groups: short-lag tokens, pre-voiced tokens, mixed tokens (with substantial periods of pre-
voicing and aspiration), and mixed tokens with a pause (with a substantial period of prevoicing, a
period of silence, and a period of aspiration). Only “correctly” produced tokens (i.e., short-lag
and prevoiced tokens) were used for the analyses reported here.
Participants voice onset times for short-lag tokens were analyzed, due to the relatively
small number of tokens that were prevoiced. Only the endpoint tokens (tokens 1 and 8) were
compared, since this is where participants are expected to make the largest differences in
production. I also report vowel duration and ratio of VOT and vowel duration for these tokens.
Additionally, the proportion of tokens which were prevoiced are also reported for tokens 1 and 8.
Because there were no significant differences across continua, all continua are collapsed together
in the analyses reported here.

152
4.4.3.3 Repetition
Figure 4.9 shows the average voice onset time at day 1 pre-test and day 2 and 3 post-tests
for short lag tokens for the two bimodal training groups.
Figure 4.9 Average voice onset times for the bimodal perception-only training group and the
bimodal perception+production training group. No differences are significant.
Once again, the data were analyzed using a linear mixed effects regression which
included training day, training modality, stimulus number, their interactions and random
intercepts for participants. There were no significant main effects or interactions (ts<1 for all
factors and interactions). As in Experiments 1 and 2, participants in both training groups make
numeric, but non-significant differences in short-lag VOT between tokens 1 and 8. Specifically,
token 1 is produced with a shorter VOT than token 8. Once again, participants appear to shadow
some properties of the tokens they are repeating. While this result is different than experiment 1
in which both groups showed some differences in voice onset time between tokens 1 and 8 after

153
training, this lack of differences is unsurprising when examining the data. The variance in this
population is very large and may mask some of the very small voice onset time differences.
Figure 4.10 below shows the proportion of tokens that were pre-voiced at pre- and post-
test for the two bimodal training groups.
Figure 4.10 Proportion of tokens that were produced with prevoicing for the bimodal training
group before and after training.
When examining the proportion of tokens that are prevoiced a logistic mixed effects
model was used, which included training modality, training day, token number, their interactions
and a random intercept for participants. Participants prevoiced more often after training than
before training regardless of token number; there was a main effect of training day (β=2.27,
s.e=0.34, z=3.5, p<0.0006). As with short-lag tokens, participants in both training groups do
pre-voice token 1 more often than token 8. However, the main effect of number is not

154
significant (z<1). There is a significant three-way interaction between training modality, training
day, and token number (β=-0.15, s.e=0.06, z=-2.17, p<0.04). Examining participants'
performance, it is clear that participants in the bimodal perception+production training prevoiced
token 1 more often than token 8 on day 3 of training. Participants in the bimodal perception-only
training do not make such a large distinction.
To examine this follow up regressions were run comparing day 1 pre-test to day 2 post-
test and, separately, day 1 pre-test to day 3 post-test. No main effects or interactions reached
signficance in the regression that compares day 1 pre-test to day 2 post-test (zs<1). However, in
the regression that compares day 1 pre-test to the day 3 post-test, there is a main effect of
training day (β=-3.8, s.e=1.6, z=-2.4, p<0.02) and a significant three-way interaction between
training modality, training day, and token number (β=-3.7, s.e=1.8, z=-2.02, p<0.04). This
supports the explanation above that the changes in productions emerge on day 3, but not yet on
day 2.
These results support findings in Experiments 1 and 2. Though participants in the
perception-only training do demonstrate small changes in production after training, this learning
is not nearly as robust as production learning after training in perception+production. Although
differences were not found in short lag voice onset time in this study is more variance in the
productions of the participants in this experiment, which may explain the lack of significance.
When examining the perception+production group independent of the perception-only group,
several significant differences emerge.
155
4.4.4 Naming
4.4.4.1 Predictions
Because participants do show some changes in their repetitions after three days of
training, they may demonstrate some changes in naming, which recruits from lexical processes.
4.4.4.2 Analysis
As in Experiments 1 and 2, participants’ productions were classified into one of four
groups: short-lag tokens, pre-voiced tokens, mixed tokens (with substantial periods of pre-
voicing and aspiration), and mixed tokens with a pause (with a substantial period of prevoicing, a
period of silence, and a period of aspiration). Only “correctly” produced tokens (i.e., short-lag
and prevoiced tokens) were used for the analyses reported here.
Participants voice onset times were compared. These productions were classified as
being intended as being from the left or right end of the continuum.
Once again the data were analyzed using linear mixed effects regressions (for short-lag
voice onset time) and linear mixed effects logistic regressions (for proportion of tokens that were
prevoiced).

156
4.4.4.3 Naming results
As in Experiments 1 and 2, participants failed to differentiate between words from the
ends of the continua in word naming. There were no significant main effects, nor any
interactions in the regressions (ts and zs <1 for all comparisons). That is, participants in the
bimodal training group do not differentiate between "words" from the right or left side of the
continuum in naming, even though they do produce differences during repetition.
4.5 Conclusions
This experiment provides an additional piece to the puzzle of how perception and
production are related to each other. By training participants for an additional day, additional
changes in learning patterns were observed. Specifically, participants in perception+production
demonstrated an increased sensitivity to discrimination between the new sounds they were
trained on. By the end of three days of training, they were able to discriminate between the two
categories, though their performance still slightly lagged behind the participants in the
perception-only training group.
Although participants did demonstrate some learning in perception, this learning was not
as robust as learning for the perception-only training group. Not only was performance on the
discrimination task slightly worse, but performance on the categorization test never reaches the
levels of performance of the participants in the perception-only training group. This suggests
that, although participants are able to make some gains, adding production to a perceptual
training regimen negatively impacts perceptual learning.

157
Investigations into changes in participants' productions demonstrated changes after three
days of training for the perception+production training, but not for the perception-only training.
Differences only emerged in the proportion of tokens which were produced with prevoicing. No
changes were found in voice onset time. This suggests that production learning is more difficult
to obtain, even after three days of training. There are several possible reasons for this. First,
there may be too much inter- and intra-subject variability to notice what are likely to be
relatively small changes in voice onset time. Second, it is possible that although participants
attempt to make changes in production, coordination of articulators hinders actual production
change. This is particularly possible since in all three experiments participants were observed
producing tokens that do not typically occur in fluent productions of prevoiced tokens. These
tokens had long periods of prevoicing and aspiration, often with a pause occurring in the middle
of the token. These tokens were excluded from analysis, but may provide an important window
into what is causing the lack of production change. Even without the changes in voice onset
time, it is clear that more robust learning in production occurs after training in
perception+production, but not after training in perception only.
As in Experiments 1 and 2, this study demonstrates that perceptual learning and
production learning are not strongly coupled. Participants in Experiments 1 and 3 demonstrated
perception change without production learning. In Experiment 2, participants learn in production
but do not show changes in perception. It is unlikely that perception and production are very
tightly coupled, since predictions of such a model would suggest that learning in one modality
must result in some learning in the other modality.

158
CHAPTER 5
5.1 Introduction
The three experiments presented in Chapters 2, 3, and 4 provide an investigation into the
relationship between speech perception and speech production. Native English listeners were
trained on a novel sound contrast in a training paradigm that consisted of either perception-only
training or perception+production training. Each training group was further subdivided into the
type of exposure they received (unimodal or bimodal). They were then tested on measures of
both perception (discrimination and categorization) and production (repetition and naming). The
results of these tests were compared across training modality (perception-only or
perception+production) and training group (unimodal and bimodal). Individual participants’
learning in perception and production was compared as well.
Below, I describe the main findings of the experiments. Following this description I
discuss these results in terms of how they relate to other results of perceptual and production
learning. Furthermore, I address the implications of these results for theories of how perception
and production are related to one another. Finally, I suggest directions for future work.
5.2 Summary
In Experiment 1, participants were trained in perception only. Participants in the bimodal
training group demonstrate an increased sensitivity to across-category contrasts in
discrimination. Participants in the unimodal training group do not. This suggests that the two
groups learned new categories that reflect the structure of their input. Participants in the bimodal

159
training group learn two new categories; participants in the unimodal training group learn one.
Furthermore, participants in the bimodal training group demonstrate relatively good
categorization performance after training. However, their accuracy is mediated by whether or
not the stimuli are close to the category boundary. Unimodal participants also show very good
categorization of the single new category they learn. Neither their accuracy, nor their reaction
times are influenced by where the tokens were located on the continuum.
In terms of production learning after perceptual training, participants in the bimodal
training group show a greater difference in their repetitions of end point tokens after training
than the unimodal group does. This suggests that, for the bimodal participants, and possibly also
for the unimodal participants, some learning occurs in production, even though participants never
explicitly produce tokens during training. Interestingly, production performance for participants
in the bimodal training group is predicted by their performance in perception.
In Experiment 2, participants were trained in perception and production. Participants in
neither training group showed an increased sensitivity in discriminating either type of contrast
during training. This suggests that bimodal participants, as a group, failed to learn the novel
sound categories well enough to be able to discriminate between them. However, some
participants did demonstrate quite good discrimination performance, suggesting that adding
production to a perceptual training regimen may not be detrimental for all learners. When
comparing discrimination performance to the training groups in Experiment 1, it is clear that
perceptual learning as measured by discrimination is not nearly as robust after training in
perception+production as it is after training in perception only.
Participants in the bimodal training group were also quite poor in terms of their accuracy
in the categorization task. They were also much less accurate on tokens close to the category

160
boundary than on tokens far from the category boundary. The unimodal group was quite
accurate, and showed no difference between near and far tokens. For participants in the bimodal
group, discrimination performance was found to be a good predictor of categorization
performance, suggesting that an increase in discrimination abilities was correlated with
categorization performance. Comparing performance to participants in Experiment 1, it is clear
that participants in the perception-only training group are more accurate than participants in
perception+production training. This suggests, once again, that perceptual learning is hindered
by the addition of production to the training regimen.
Participants in the perception+production training group change their productions
significantly from pre- to post-test. Furthermore, participants in the bimodal training group
change their productions to reflect the properties of the tokens in several ways. First, they make
a larger difference in the short lag voice onset times of endpoint tokens on Day 2 than on Day 1.
The unimodal group does not make such a distinction. Furthermore, participants in both training
groups prevoiced their own productions more often on Day 2 than on Day 1. This effect seems
to be driven more by the bimodal group, who prevoiced tokens more often on day 2 than on day
1, and also prevoiced token 1 more often than token 8. Unlike participants in Experiment 1, the
performance of the bimodal training group in production is not well predicted by their
performance on the discrimination task. These findings suggest that, even in the absence of
robust perceptual learning, participants learn to change their productions of tokens to reflect the
properties of the input they receive during training. Although participants in Experiment 1 also
demonstrate learning in production, the changes in their productions are not as great as those in
the perception+production training case. It is clear that production training results in more
robust production learning than perception-only training.

161
In Experiment 3, the relationship of perception and production was further investigated
by training participants for an additional day. After a third day of training, differences in
discrimination sensitivity between the bimodal perception-only training group and the bimodal
perception+production training group were alleviated. However, differences still persisted in the
categorization task. This suggests that while perceptual learning is not entirely disrupted after
training in production, the learning that does result is slow to emerge and less robust than the
learning after training in perception alone.
In terms of production, learning was not found for either training group in terms of short
lag voice onset time. However, participants in the bimodal perception+production training group
demonstrated substantial improvement in the number of tokens they prevoiced by Day 3,
particularly token 1. This suggests that learning in production may be susceptible to individual
variation, but is most likely to emerge after training in production.
5.3 Discussion
5.3.1 Perceptual Learning
By adding production to a perceptual training regimen, perceptual learning was disrupted
for learners. This is not the first time a disruption of perceptual learning after production training
has been demonstrated. Leach & Samuel (2007) demonstrate that production disrupts some
types of perceptual learning. Specifically, they demonstrate that adding production to a
perceptual training regimen hinders lexical engagement, the ways in which words in the lexicon

162
interact with other words in the lexicon (i.e., words with many neighbors behave differently than
words with few neighbors; beginning to be have like a word with many neighbors after learning
related words would be a form of lexical engagement).
Several interesting questions emerge from the disruption of perceptual learning in the
current study. The first question is whether learning is truly disrupted, or simply slowed down.
The results of Experiment 3 suggest that learning is both slowed down and disrupted. While
participants in the bimodal perception+production training achieve the same level of
performance as participants in the bimodal perception-only training group in discrimination after
three days of training, their performance lags on categorization. In fact, because there is a main
effect of training modality in categorization, we can say that participants who are trained in
production perform less well overall than participants in the perception-only training. While
some types of learning seem to be slowed down, other types of learning seem to be disrupted
more generally. Furthermore, several participants in the bimodal perception+production training
group fail to discriminate between across category distinctions at all, even after three days of
training. There are no such participants in the bimodal perception only training group.
The next question is why production disrupts perceptual learning, at least for some
participants. There are several possible alternatives. First, it is possible that participants’
productions are disrupting perceptual learning. Because participants are producing tokens
throughout training it is possible that those who are better at repeating these tokens at baseline
may also be better at perceptual learning. Alternately, participants could be altering the
distributional information given to them in perception by weighting their own tokens equally.
This seems to be unlikely though since Kraljic & Samuel (2005) demonstrate possible counter-
evidence to this hypothesis. Specifically, they examine perceptual learning after training on

163
experimenter-presented “good” tokens and and participant produced “bad” tokens. They find
that participants’ own bad productions do not disrupt perceptual learning. If their productions
are not identical to the trained tokens, it is possible that these tokens would be the cause of the
disruption of perceptual learning. This possibility seems rather unlikely since participants’
perceptual learning in the perception+production training group was not correlated with their
baseline production abilities or their production abilities after training (See sections 2.3.4.3,
3.3.4.3 and 4.3.4.3 for a discussion).
If it is not participants’ productions that are causing the disruption to learning, we are left
with the question of whether it is production per se that is causing the disruption. There are
several confounds in the current study. First, we ask participants to produce the target tokens
during training. It is possible that this disruption could be caused by the production of the targets
or by the simple act of producing something. Furthermore, participants are performing two tasks
which require linguistic engagement. It is possible that the disruption is caused by performing
two linguistically engaging tasks in alternation with each other, not necessarily by the act of
producing anything. Alternately, it could be that performing any two cognitively demanding
tasks could disrupt learning.
Obviously, this question cannot be answered by the current study (see below for further
discussion); however, it is possible to discuss the implications of each of these alternatives. If
perceptual learning were disrupted by any cognitively demanding task, this would suggest that
perceptual learning of this type requires undivided attention to the target and to the target task.
Production of the target would simply be a specific instance of a cognitively demanding task. If
this were the case, the relationship of perception and production would also have to be examined

164
not only in relation to each other, but also with regard to other cognitive factors, such as
attention.
If it were the case that the disruption in learning is caused only by linguistically engaging
tasks, this would predict that learning would also be disrupted not only if participants were
producing tokens but also in other linguistically demanding tasks. For example, asking
participants to engage multiple levels of linguistic representation in both perception and
production (as they are asked to do during this task) could create additional demands on the
processing system that may disrupt learning.
Alternatively rather than attributing these effects to the general cognitive or specific
linguistic demands associated with production, the disruption in learning could be caused by
production itself; specifically, production of the target tokens. Since it is unlikely that it is the
content of the productions that are causing the disruption, it is more likely that it is the act of
producing itself that is causing the disruption. The act of producing, specifically the act of
repeating a token, is quite complex. First, participants must process the sound they are trying to
repeat. They must then go through the process of producing the token, including generating a
motor plan to produce the word. All of these steps increase cognitive demands compared to
what participants are doing during the perception-only training, when participants are asked to
simply press a button to move on to the next token. While the case of production is certainly a
case of increased cognitive demands, it is a special instance, in which the similarity of the "target
task" of perceptual learning and the "distractor task" of producing the tokens are very highly
related. Furthermore, the task of producing tokens is a special instance of a demanding linguistic
task. Other linguistic tasks may engage lexical or semantic representations; however these
representations would not be as similar as they are in the tasks of perception and production of

165
the same target tokens. It is possible that the high degree of relation between the two tasks is
causing the disruption to learning, not necessarily the cognitive demands of the task.
Finally, it is possible that the disruption to learning reflects the decision processes of
participants. Individuals in the perception+production training group must commit to a
representation of a token in production that mismatches with the target, regardless of what the
output of their production is. That is, during production, participants have to make a number of
decisions in producing a token. During typical language production, this involves multiple steps
including at least choosing a semantic representation, a lexical representation, the post-lexical
phonological representation of the sounds of the word they are trying to produce, and the
phonetic detail of the word, as well as creating an articulatory plan. Often competition at one
level affects production at later stages (see Rapp & Goldrick, 2000 for a discussion of several
theories of production). If participants choose a representation at one level of processing (e.g., if
they chose the phonological representation from the other category), this commitment alone may
be sufficient to disrupt the learning process. In other words, making the wrong choice at higher
levels of representation may not affect the output much in a task where the representations are
designed to be very similar, but the choice of this representation may result in a mismatch
between the target token and the participants' production of that token. If this mismatch occurs
very often, this could disrupt perceptual learning. It is possible that having to make any explicit
decisions about the tokens during training could disrupt learning. It is possible that having to
explicitly categorize the tokens during training could similarly disrupt learning, since participants
would also have to explicitly commit to a representation.

166
More research is needed to determine the cause of the disruption of perceptual learning
by the inclusion of production in training. However, these findings provide an important first
step in examining how perceptual learning is affected by production training.
5.3.2 Production Learning
The experiments discussed here demonstrate that production learning is possible after an
implicit learning paradigm in either perception alone or in perception+production. Learning is
much more robust after training that involves a production component. The fact that production
training results in more learning in production than perception-only training is unsurprising.
Participants have more practice producing the tokens, and could be expected to learn more
because of this fact alone. However, the production learning in both types of training is sensitive
to the distributional properties of the stimuli heard during training. Participants don’t simply
learn to shadow tokens more closely regardless of their input. They learn to shadow properties
that are relevant in their input. This suggests that the learning observed here is not simply an
increased sensitivity to the very fine-grained phonetic properties of the stimuli, but a deeper
learning that permeates higher levels of cognitive processing. In fact, this finding echoes the
conclusions of Mitterer & Ernestus (2008) who suggest that participants shadow phonemically
relevant information. They demonstrate that participants shadow phonetic detail when it is part
of a phonemically relevant contrast (e.g., shadowing short-lag vs pre-voicing), but not when the
phonetic detail is not phonemically relevant (e.g., the amount of short-lag or prevoiced VOT).
Because it is clear that participants are not learning to shadow the fine-grained phonetic detail
regardless of any other information, it is possible to infer that they are actually learning novel

167
phonological categories. The information they are shadowing has become for them, in the term
of Mitterer and Ernestus “phonologically relevant.”
Another interesting factor of the production learning seen here is that for participants in
the bimodal perception-only training this learning is strongly related to their performance in
perception on the discrimination task. That is, participants who were better able to discriminate
across the new sound categories also produced a larger difference between tokens in the two
categories. However, performance on the two tasks was not related for participants in the
perception+production training. Therefore, it seems as if two different types of learning are
occurring, or at least that the learning in these two cases is motivated by different factors.
5.3.3 The relationship of perception and production
In Chapter 1, I addressed theories of second language learning and potential theories for
how perception and production are related to each other. These theories differ in terms of their
predictions for how learning will proceed in each modality. The Perceptual Assimilation Model
(PAM) posits that speech perception and production are identical. That is, they share
representations entirely and processes that affect one modality also affect the other modality,
therefore learning in one modality should correspond with learning in the other modality. On the
other hand, it is possible that speech perception and production are completely separate during
learning. They may share features at higher levels of representation, but at lower levels of
representation they are completely independent. This sort of theory is compatible with the

168
Native Language Magnet Model (NLM). Additionally, there are a wide-range of possibilities that
exist along the continuum between these two possibilities. This dissertation has implications for
how these possibilities must be constrained in order to account for this data, and a wide array of
other data that weigh on this topic as well.
It is unlikely that speech perception and production share all representations and
processes entirely. If this were the case, it would be expected that dissociations between the two
modalities, such as those seen in the current study and many other studies would not exist. If the
two modalities were identical in terms of representations, it would be expected that there would
be a correlation between changes in one modality and changes in the other modality. This was
not demonstrated for several of the tasks in the current studies. It is possible that a lack of
correlation between the two modalities could be explained away as poor control over the
articulators. The representations may be the same, but participants are unable to actual produce
the distinction because of articulatory constraints, and thus the correlation between the two
modalities does not emerge. However, this explanation fails to account for the fact that in
Experiment 2, participants demonstrate production learning without learning in perception.
Furthermore, this is also unlikely given the dissociations seen in other studies of learning in
perception and production (e.g., Bent, 2005; De Jong et al., 2009; DeKeyser & Sokalski, 2001;
Flege, 1993; Sheldon & Strange, 1982), in which learning in one modality does not correlate
with learning in the opposite modality. Therefore, this far extreme of the continuum ought not to
be considered as a valid option for explaining how perception and production are related.
Although these results are incompatible with some of the claims of PAM, it is not the
case that the model needs to be dismissed outright. The Perceptual Assimilation Model, as its
name implies, focuses its predictions on perception and in fact, no explicit claims are made about

169
how production learning ought to proceed. The claim that perception and production share
representations (through the mechanism of perceiving gestures rather than acoustics) implies
this, but the model does not make this explicit. Regardless, this is a challenge for PAM. These
results, however, can be accounted for in NLM or SLM.
At the other end of the continuum, it is also unlikely that production and perception are
entirely separate. It is possible that this account could explain the fact that after three days of
training, participants in perception+production training learn in perception. They are, after all,
trained in both perception and production. However, if the two modalities were completely
separate, it is unlikely that participants who are trained only in perception should show any
learning in production in the absence of any explicit practice in production. Furthermore, this
extreme end of the continuum is also unlikely in light of the shadowing studies in which many
researchers have demonstrated very fast, perceptually induced changes in production (e.g.,
Goldinger, 1998; Goldinger & Azuma, 2004; Goldinger et al., 2000; Pardo, 2006; Shockley et
al., 2004). A system in which the two representations are completely separated from one another
would have difficulty accounting for these data. Therefore, this extreme must also be discarded
as a way of explaining the relationship between the two modalities.
Thus, we are left with the wide array of options from the middle of the continuum of how
perception and production may be related during learning. However, the current data helps to
constrain some of these possibilities as well. In the introduction, I lay out several possibilities
for how the relationship between the two modalities may exist if the representations are separate
but linked in some way. I address the possibility that learning may be parasitic, synergistic,
antagonistic, or independent. The current results suggest that distinctions such as this may not be
fine grained enough to capture the true nature of the relationship between the two modalities.
170
Several researchers, have suggested that perceptual learning should constrain production
learning. That is, production learning should not occur in the absence of perceptual learning. In
fact, Flege’s Speech Learning Model makes this claim explict, stating that learning in perception
provides a basis for learning in production. More important than this, however, is the prediction
that learning in production should not proceed independently of learning in perception.
However, this is what is demonstrated by participants in Experiment 2—not only on an
individual level, but also as a group. This suggests that theories that posit a very strong parasitic
relationship between the two modalities should also not be considered good explanations for how
the two modalities are related. These data pose a challenge for SLM, which suggests that this
should never occur. However, these data are compatible with NLM, since it posits that
articulation and acoustics are not the same at the representational level. Therefore, learning in
production could occur before learning in perception.
Learning between the two modalities could also be antagonistic. A very strong version of
this hypothesis is logically unlikely, since at some point in learning, users of a language must
learn to both speak and understand their ambient language. However, on a smaller scale, such
antagonism is possible. The experiments reported above do show some evidence for antagonism
between the two modalities. Participants in the perception+production training group learn in
production, but simply adding production to a perceptual training regimen disrupts perceptual
learning. As discussed above, it is unclear what, exactly, is the cause of the observed
antagonism. However, it is clear that theories of the relationship between perception and
production must be able to account for such an antagonistic relationship.
Finally, it is possible that the relationship between the two modalities is at least partially
synergistic. The current data provide mixed results. Participants in the perception-only training
171
group do demonstrate a strong link between their learning in perception and production; learning
in one modality helps learning in the opposite modality. On the other hand, we do not see
perceptual sensitivity improve as a function of production learning, or vice versa for the
participants trained in perception+production.
Although each of the three theories are at least partially confirmed by these experiments,
the predictions of PAM and SLM are also contradicted by these data. Only SLM makes explicit
claims about how learning should proceed in each modality. Those claims are not supported by
the current data. Implicit claims by PAM regarding the relationship between perception and
production during learning are also challenged here. However, because PAM and NLM do not
make explicit claims regarding learning in production, it is difficult to say whether this data
differentiates between these theories. In the next section I propose an account of learning that
could account for the current data.
5.3.4 A possible account of the data
To help understand the observation of both antagonism and synergy between learning in
these two modalities, I will develop an account that appeals to shared resources across these
modalities. Ferreira & Pashler (2002) appeal to a central bottleneck theory to explain
interference during word production. They suggest that if two tasks share processing resources,
and a stage of the one task requires central processing resources, the second task will not also be
able to use those resources until the first task has completed it's process. Under this hypothesis,
if production and perception share resources, trying to perform both perception and production
simultaneously or in quick succession may result in a bottleneck of processing resources,

172
slowing down or hindering the task. Below, I outline a possible account for the relationship
between perception and production that appeals to a resource-sharing hypothesis.
The representations for perception and production at the phonetic level are separated.
Perceptual learning that is driven by perception training recruits processes used during
perception. Once new representations have been established in perception, this learning can
partially transfer to help form new representations in production. Learning during
perception+production training recruits from processes used during both perception and
production; essentially, it is a type of dual-task. In this dual task, learning in production occurs
by establishing new representations in production. However, because resources are divided
between perception and production, and because production is very resource demanding
compared to perception in this case, the formation of perceptual representations is slower than
after training in perception alone. This accounts for the antagonistic effects between learning in
the two modalities.
This account also allows us to understand both the dissociation and synergistic
interactions between learning in the two modalities. Because the representations in the two
modalities are formed by different processes within each modality during learning, there is a
dissociation between performance in each modality for the perception+production training
group. In contrast, during the perceptual training task, distinct production processes are not
recruited during learning. Because perception-only training is not as resource-demanding as
production, learning in one modality can transfer to the opposite modality. Resources that would
otherwise have to be split between perception and production can be used for perceptual learning
and transferring that learning to production. This accounts for the parasitic or synergistic
relationship between the two modalities after perception only training.

173
Unfortunately, this dissertation cannot offer a definitive explanation for how the two
modalities are related. However, it does provide a critical means for evaluating theories of how
speech perception and speech production are related. Furthermore, the current studies provide a
solid basis for future research into how the two modalities are related at all stages of learning and
during fluent speech processing.
5.4 Future Research
As stated above, there are several questions that are opened by this research. I will
discuss four directions that future research could take. First, I will discuss some ways to answer
the question of why production disrupts perceptual learning. Second, I will address the question
of the timeline of the emergence of learning in each modality. Third, I will discuss examining
this relationship at later stages of learning. Finally, I will discuss examining the relationship of
perception and production using more ecologically valid tasks.
5.4.1 Why does production disrupt perceptual learning?
It is unclear in the current why perceptual learning is disrupted by the inclusion of
production during training. One question that must be addressed in future research is whether
the disruption to perceptual learning occurs because of production per se, or whether some other
cognitive factors cause the disruption. As discussed above, several alternatives exist for this
along a continuum ranging from the specific production of the target tokens causing this
disruption to any attention-demanding task causing the disruption. These possibilities are
174
relatively easy to tease apart in a future training study. Rather than asking participants to
explicitly repeat training tokens, another task would be interleaved with training and compared to
the current perception+production training task. These tasks could include a range of options.
First, participants would be asked to produce another, unrelated item during training. This would
allow us to examine whether it is producing the training tokens or the act of production that
causes the disruption. Second, another set of participants would be asked to perform another
linguistic task that does not involve speech production or explicit production of the target tokens
between each perceptual presentation of the target tokens. This would allow us to examine
whether it is producing the training tokens or simply engaging linguistic representations that
disrupts learning. Third, participants would be asked to perform an unrelated, non-linguistic yet
still cognitively demanding task. This would allow us to examine whether the distractor task
must be linguistic or whether any cognitively demanding task would disrupt learning. Finally, as
a further control, participants in a separate training group would be asked to explicitly categorize
the tokens during training to examine how further engagement with the tokens when the
engagement does not involve explicitly producing tokens. By examining a wide variety of
distractor tasks, the issues posed in Experiment 2 could be deconfounded.
5.4.2 Emergence of learning
A large body of data was collected during this dissertation but is not reported here,
involving the emergence of learning over time. In addition to the pre-test before training occurs
and a post-test at the end of training, participants were tested at the beginning and ending of each
training day. The results for this interim testing were reported for discrimination in Sections

175
2.4.1.4, 3.4.1.5 and 4.4.1.4, and allow for a preliminary examination of the time course of
learning. The results demonstrate that not only do bimodal perception+production participants
learn less than the perception-only participants, they also demonstrate a different pattern of
learning over the course of training days. The results discussed here also suggest some evidence
for overnight consolidation of learning after sleep (i.e., there is an improvement in discrimination
performance for the perception-only training group between the Day 1 post-test and the Day 2
pre-test.
By examining the interim tests for repetition, the picture of the timecourse of learning
will become clearer. For instance, it is possible that perceptual learning begins to occur after one
day of perception only training, but production learning does not occur until participants have
trained for two days. There is already some evidence for this type of effect in Experiment 3,
however a more systematic investigation should be done to better understand how learning
proceeds in the two modalities.
Furthermore, the current testing regime would also allow for an examination of
consolidation of learning after sleep. Davis, Di Betta, Macdonald, & Gaskell (2009) and Davis
& Gaskell (2009) lay out hypotheses for which aspects of word learning may occur on different
time scales, some requiring the consolidation that occurs during sleep, and some occurring on a
more immediate time scale. It is possible that perception and production learning also occur on
different time scales or are differentially affected by consolidation. While a systematic
investigation keeping testing time stable across days is necessary to examine consolidation
closely, further examination of the other tests collected during the current studies will help begin
to address these questions as well.

176
5.4.3 The relationship of perception and production at later stages of learning
The current study examines perception and production at the very early stages of learning
a new contrast. However, it is possible that the relationship between the two modalities changes
over time. Knowing if, and how, this relationship changes as learning progresses is necessary for
understanding the full picture of how the two modalities are related. By examining learners who
have had longer periods of exposure (i.e., participants who have studied the language for several
months prior to study) to a particular contrast, will allow us to examine how learning in the two
modalities is related during later stages of learning.
Specifically, this type of investigation allows for an examination of many learners along a
continuum of levels of proficiency, ranging from relatively new learners to relatively fluent
bilinguals. Participants would be provided with a training regimen in either perception only or
perception+production as in the current study. However, the trained contrast would not be novel
for them. This would also allow for a different examination of categorization performance, in
which we could examine category boundaries and their shifts before and after training, as well as
discrimination, repetition, categorization and naming. Presumably, this type of study would also
allow for a wide range of contrasts (both phonemic and allophonic within a language).
Phonemic contrasts are those that result in a contrast of meaning in a language. For example, /f/
and /s/ is phonemically contrastive in English, since "fat" and "sat" are two different words.
Allophonic contrasts are contrasts that are consistently produced as different from one another,
even though they do not result in a contrast of meaning. They are often conditioned by location
in a word. For example the final consonant in the word "bed" and the middle consonant in the
word "better" are produced differently. However, this difference is allophonic in English – no
words in English are contrastive simply on the basis of this particular contrast. This population

177
would also allow for an examination of perception and production in more ecologically valid
situations.
5.4.4 Perception and production in ecologically valid situations
By using an ecologically valid, yet relatively well controlled task (e.g., the Map Task
(Anderson et al., 1991) or the Diapix Task (Van Engen et al., 2010), more advanced learners
could be exposed to the target contrast in a naturalistic setting. In the Map Task, pairs of
speakers are given maps. One of the maps has a path on it, which the "giver" in the task must
describe to the "receiver". This task allows for the placement of a variety of target words on the
map. If the "giver" was a confederate, and the "receiver" was a subject, target words could be
planted within the task to be produced by the confederate. On subsequent trials, participants
could be asked to produce the target contrast as the "giver".
The Diapix Task presents participants with two pictures, one for each participant. The
pictures have a number of differences. The task for participants is to identify the differences
without looking at the other picture. That is, participants must discuss the pictures. As in the
Map Task above, target items which use the to-be-learned contrast could be planted in the
pictures. Then, either a confederate or another participant could produce the tokens, depending
on the goal of the study and the proficiency of the participants. Either of these tasks would result
in data that are more comparable to real world learning scenarios. Furthermore, they would
allow for the examination of how other factors (e.g., interaction with other speakers) influence
changes in perception and production.

178
5.5 Summary
In conclusion, the experiments in this study were designed to examine the relationship of
perception and production. The primary objectives of this study were to examine the role of
training modality in learning and to examine whether learning in one modality is related to
learning in the other modality. A complicated picture emerged from the data. The relationship is
one in which learning can, but does not always transfer to the other modality. Furthermore,
learning in production is not dependent on perceptual learning occurring first. These results
suggest that theories explaining how perception and production are related must be constrained
in a variety of ways. It is likely that the representations are separate, but that some processes
allow for transfer of information and learning between the two modalities. It seems as if this
transfer process may be non-obligatory, and is at the very least not automatic in all cases of
learning. In some cases, however, it does appear that learning may transfer automatically.
Future studies of the relationship between perception and production should examine more
closely why the two modalities interact the way they do and should examine the learning process
at multiple points in time, from the early emergence of learning to the mastery of the contrast.

179
REFERENCES
Abbs, B., Gupta, P., & Khetarpal, N. (2008). Is overt repetition critical to expressive word
learning? The role of overt repetition in word learning with and without semantics. Applied Psycholinguistics, 29, 627-667.
Anderson, A. H., Bader, M., Bard, E. G., Boyle, E. H., Doherty, G. M., Garrod, S. C., et al.
(1991). The HCRC Map Task Corpus. Language and Speech, 34, 351-366. Baayen, R., Davidson, D., & Bates, D. (2008). Mixed-effects modeling with crossed random
effects for subjects and items. Journal of Memory and Language, 59, 390-412. Baayen, R. H. (2008). Analyzing linguistic data: A practical introduction to statistics using R.
Cambridge, England: Cambridge University Press. Babel, M. (2009). Vowel imitation in spontaneous phonetic imitation. Canadian Acoustics
Proceedings, 37, 140-141. Babel, M. (Under Review). Evidence for phonetic and social selectivity in spontaneous phonetic
imitation. Baddeley, A. D., Gathercole, S., & Papagno, C. (1998). The phonological loop as a language
learning device. Psychological Review, 105, 158-173. Bates, D. M., & Macheler, M. (2009). lme4: Linear mixed-effects models using S4 classes
(Version R package version 0.999375-32). Bent, T. (2005). Perception and production of non-native prosodic categories. Unpublished
doctoral dissertation. Northwestern University. Bertelson, P., Vroomen, J., & de Gelder, B. (2003). Visual recalibration of auditory speech
identification. Psychological Science, 14, 592-597. Best, C. T. (1994). “The emergence of native-language phonological influence in infants: a
perceptual assimilation hypothesis,” in The development of speech perception: the transition from speech sounds to spoken words, edited by J. C. Goodman & H. C. Nusbaum, (Cambridge, MA: MIT press), pp. 1676-224.
Best, C. T. (1995). A direct-realist view of cross-language speech perception. In W. Strange
(Ed.), Speech Perception and Linguistic Experience: Issues in Cross-Language Speech Research (pp. 171-206). York: Timonium.

180
Best, C.T., McRoberts, G., & Sithole, N. (1988). Examination of perceptual reorganization for nonnative speech contrasts: Zulu click discrimination by English-speaking adults and infants. Journal of Experimental Psychology, 14, 345-360.
Best, C. T., & McRoberts, G. W. (2003). “Infant perception of non-native consonant contrasts
that adults assimilate in different ways,” Language and Speech, 46, 183-216. Birdsong, D. (2007). Nativelike pronunciation among late learners of French as a second
language. In O. S. Bohn & M. J. Munro (Eds.), Language experience in second language learning: In honor of James Emil Flege Vol (pp. 99-116). Amsterdam: John Benjamins Publishing Company.
Boersma, P., & Weenink, D. (2009). Praat v. 5.1. A system for doing phonetics by computer. Bongaerts, T. (1999). Ultimate attainment in L2 pronunciation: The case of very advanced late
L2 learners. In D. Birdsong (Ed.), Second Language Acquisition and the Critical Period Hypothesis Vol. Mahwah: Lawrence Erbaum Associates.
Bradlow, A., Akahane-Yamada, R., Pisoni, D., & Tohkura, Y. (1999). Training Japanese
listeners to identify English/r/and/l: Long-term retention of learning in perception and production. Perception & psychophysics, 61, 977-985.
Bradlow, A., Pisoni, D., Akahane-Yamada, R., & Tohkura, Y. (1997). Training Japanese
listeners to identify English/r/and/l: IV, Some effects of perceptual learning on speech production. Journal of the Acoustical Society of America, 101, 2299-2310.
Brouwer, S., Mitterer, H., & Huetting, F. (2010). Shadowing reduced speech and alignment.
Journal of the Acoustical Society of America, 128, EL32-EL37. Clarke-Davidson, C., Luce, P., & Sawusch, J. (2008). Does perceptual learning in speech reflect
changes in phonetic category representation or decision bias? Perception & psychophysics, 70, 604.
Davis, M. H., Di Betta, A., Macdonald, M. J. E., & Gaskell, M. G. (2009). Learning and
consolidation of novel spoken words. Journal of Cognitive Neuroscience, 21, 803-820. Davis, M. H., & Gaskell, M. G. (2009). A complementary systems account of word learning:
neural and behavioural evidence. Philosophical Transactions of the Royal Society B: Biological Sciences, 364, 3773-3800.
De Jong, K., Hao, Y.-C., & Park, H. (2009). Evidence for featural units in the acquisition of
speech production skills Linguistic structure in foreign accent. Journal of Phonetics, 37, 357-373.

181
DeKeyser, R. M., & Sokalski, K. J. (2001). The differential role of comprehension and production practice. Language Learning, 51, 81-112.
Dell, G. S., Reed, K., Adams, D., & Meyer, A. (2000). Speech errors, phonotactic constraints,
and implicit learning: A study of the role of experience in language production. Journal of Experimental Psychology: Learning, Memory and Cognition, 26, 1355-1367.
Diehl, R. L., & Kluender, K. R. (1989). On the objects of speech perception. Ecological
Psychology, 1, 1-45. Duyck, W., Szmalec, A., Kemps, E., & Vandierendonck, A. (2003). Verbal working memory is
involved in associative word learning unless visual codes are available. Journal of Memory and Language, 48, 527-541.
Fernandes, T., & Kolinsky, R. (2010). The impact of attention load on the use of statistical
information and coarticulation as speech segmentation cues. Attention. Ferreira, V., & Pashler, H. (2002). Central bottleneck influences on the processing stages of
word production. Journal of Experimental Psychology: Learning, Memory, and Cognition, 28, 1187-1199.
Flege, J. E. (1993). Production and perception of a novel, second‐language phonetic contrast.
Journal of the Acoustical Society of America, 93, 1589. Flege, J. E. (1995). Second language speech learning: Theory, findings, and problems. In W.
Strange (Ed.), Speech Perception and Linguistic Experience: Issues in Cross-language Research (pp. 233-277). Baltimore: York.
Flege, J. E. (2003). “Assessing constraints on second-language segmental production and
perception,” Phonetics and Phonology in Language Comprehension and Production: Differences and Similarities, edited by A. Meyer and N. Schiller (Mouton de Gruyter, Berlin), pp. 319–355.
Flege, J. E., & Davidian, R. D. (1984). Transfer and developmental processes in adult foreign
language speech production. Applied Psycholinguistics, 5, 323-347. Flege, J.E., & Hillenbrand, J. (1984). Limits on phonetic accuracy in foreign language speech
production. Journal of the Acoustical Society of America, 76, 708-721. Fowler, C. (1986). An event approach to the study of speech perception from a direct-realist
perspective. Journal of Phonetics, 14, 3-28. Galantucci, B., Fowler, C., & Goldstein, L. (2009). Perceptuo-motor compatibility effects in
speech. Attention, Perception & Psychophysics.
182
Gaskell, M. G., & Dumay, N. (2003). Lexical competition and the acquisition of novel words. Cognition, 89, 105-132.
Goldinger, S. (1998). Echoes of echoes? An episodic theory of lexical access. Psychological
Review, 105, 251-278. Goldinger, S., & Azuma, T. (2004). Episodic memory reflected in printed word naming.
Psychonomic Bulletin & Review, 11, 716-722. Goldinger, S., Cutler, A., McQueen, J. M., & Zondervan, R. (2000). The role of perceptual
episodes in lexical processing. Paper presented at the SWAP Spoken Word Access Processes.
Goldrick, M. (2004). Phonological features and phonotactic constraints in speech production.
Journal of Memory and Language, 51, 586-603. Goldrick, M., & Larson, M. (2008). Phonotactic probability influences speech production.
Cognition, 107, 1155-1164. Goldrick, M., & Rapp, B. (2007). Lexical and post-lexical phonological representations in
spoken production. Cognition, 102, 219-260. Goto, H. (1971). Auditory perception by normal Japanese adults of the sounds 'l' and 'r'.
Neuropsychologia, 9, 317-323. Hattori, Kota (2010). Perception and production of English /r/-/l/ by adult Japanese speakers.
Unpublished doctoral dissertation. University College London. Hayes, R. L. (2003). How are second language phoneme contrasts learned? Unpublished doctoral
dissertation. University of Arizona. Hayes-Harb, R. (2007). Lexical and statistical evidence in the acquisition of second language
phonemes. Second Language Research, 23, 65-94. Iverson, P., & Evans, B. (2009). Learning English vowels with different first-language vowel
systems II: Auditory training for native Spanish and German Speakers. Journal of the Acoustical Society of America 126 (2), 866-877.
Iverson, P., Hazan, V., & Bannister, K. (2005). Phonetic training with acoustic cue
manipulations: A comparison of methods for teaching English/r/-/l/to Japanese adults. Journal of the Acoustical Society of America, 118, 3267.

183
Iverson, P. & Kuhl, P. (1995). Mapping the perceptual magnet effect for speech using signal detection theory and multidimensional scaling. Journal of the Acoustical Society of America, 97 (1), 553-562.
Iverson, P. & Kuhl, P. (1996). Influences of phonetic identification and category goodness on
American listeners' perception of /r/ and /l/. Journal of the Acoustical Society of America, 99 (2), 1130-1140.
Jamieson, D. G., & Rvachew, S. (1992). Remediating speech production errors with sound
identification training. Journal of Speech-Language Pathology and Audiology, 16, 201-210.
Jamieson, D. G., & Rvachew, S. (1994). Perception, production and training of new consonant
contrasts in children with articulation disorders. Proceedings of the International Conference on Spoken Language (Acoustical Society of Japan, Yokohama, 199-202.
Jusczyk, P. W., & Luce, P. A. (1994). Infants' sensitivity to phonotactic patterns in the native
language. Journal of Memory and Language, 33, 630-645. Kingston, J. (2003). Learning Foreign Vowels. Language and Speech, 46, 295-349. Kraljic, T., Brennan, S., & Samuel, A. G. (2008a). Accommodating variation: Dialects, idiolects,
and speech processing. Cognition, 107, 54-81. Kraljic, T., & Samuel, A. G. (2005). Perceptual learning for speech: Is there a return to normal?
Cognitive psychology, 51, 141-178. Kraljic, T., & Samuel, A. G. (2007). Perceptual adjustments to multiple speakers. Journal of
Memory and Language, 56, 1-15. Kraljic, T., & Samuel, A. G. (Under Review). Even the perceptual system falls for first
impressions and good excuses. Kraljic, T., Samuel, A. G., & Brennan, S. (2008b). First impressions and last resorts: How
listeners adjust to speaker variability. Psychological Science, 19, 332-338. Kuhl, P. K., Williams, K., Lacerda, F., Stevens, K., & Lindblom, B. (1992). Linguistic
experience alters phonetic perception in infants by 6 months of age. Science, 255, 606-608.
Kuhl, P. K. (2000). “Phonetic learning: a pathway to language,” Proceedings of the National
Academy of Sciences, 97, 11850-11857.

184
Leach, L., & Samuel, A. G. (2007). Lexical configuration and lexical engagement: When adults learn new words. Cognitive psychology, 55, 306-353.
Leather, J. (1990). Perceptual and productive learning of Chinese lexical tone by Dutch and
English speakers. In J. Leather & A. James (Eds.), New Sounds 90 (pp.72-97). University of Amsterdam.
Liberman, A., Harris, K., Hoffman, H., & Griffith, B. (1957). The discrimination of sounds
within and across phoneme boundaries. Journal of Experimental Psychology, 54, 358-368.
Liberman, A. M., Cooper, F. S., Shankweiler, D. P., & Studdert-Kennedy, M. (1967). Perception
of the speech code. Psychological Review, 74, 431-461. Liberman, A. M., & Mattingly, I. G. (1985). The motor theory of speech perception revised.
Cognition, 21, 1-36. Liberman, A. M., & Mattingly, I. G. (1989). A specialization for speech perception. Science,
245, 489-494. Lisker, L., & Abramson, A. (1964). Cross language study of voicing initial stops. Journal of the
Acoustical Society of America, 35, 384-422. Logan, J., Lively, S., & Pisoni, D. (1991). Training Japanese listeners to identify English /r/ and
/l/: A first report. Journal of the Acoustical Society of America, 89, 874-886. Luce, P. A. & Pisoni, D. B. (1998). Recognizing spoken words: the neighborhood activation
model. Ear and Hearing, 1–36. MacKain, K., Best, C., & Strange, W. (1981). Categorical perception of English /r/ and /l/ by
Japanese bilinguals. Applied Psycholinguistics, 2, 369-390. Macmillan, N. A., & Creelman, C. D. (1991). Detection theory: A user's guide. Cambridge,
England: Cambridge Univeristy Press. Marslen-Wilson, W. D. (1987). Functional parallelism in spoken word-recognition. Cognition 25,
71–102. Martin, N., & Saffran, E. (2002). The relationship of input and output phonological processing:
An evaluation of models and evidence to support them. Aphasiology, 16, 107-150. Martin, R. C., Lesch, M., & Bartha, M. (1999). Independence of Input and Output Phonology in
Word Processing and Short-Term Memory. Journal of Memory and Language, 41, 3-29.

185
Maye, J., Aslin, R. N., & Tanenhaus, M. K. (2008). The weckud wetch of the wast: Lexical adaptation to a novel accent. Cognitive Science, 32.
Maye, J., & Gerken, L. (2000). Learning phonemes without minimal pairs. Proceedings of the
24th Annual Boston University Conference on Language Development, 2, 522-533. Maye, J., & Gerken, L. (2001). Learning phonemes: How far can the input take us. Proceedings
of the 25th annual Boston University conference on language development, 480–490. Maye, J., Werker, J. F., & Gerken, L. (2002). Infant sensitivity to distributional information can
affect phonetic discrimination. Cognition, 82, 101-111. McClaskey, C., Pisoni, D., & Carrell, T. (1983). Transfer of training to a new linguistic contrast
in voicing. Perception & psychophysics, 34, 323-330. McMurray, B., Tanenhaus, M. K., & Aslin, R. N. (2009). Within-category VOT affects recovery
from “lexical” garden-paths: Evidence against phoneme-level inhibition. Journal of Memory and Language, 60, 65-91.
Mitterer, H., & Ernestus, M. (2008). The link between speech perception and production is
phonological and abstract: Evidence from the shadowing task. Cognition, 109, 168-173. Nickels, L., & Howard, D. (1995). Phonological errors in aphasic naming: Comprehension,
monitoring, and lexicality. Cortex, 31, 209-237. Nielsen, K. (In Preparation). Specificity and Abstractness of VOT Imitation. Norris, D., McQueen, J. M., & Cutler, A. (2003). Perceptual learning in speech. Cognitive
Psychology, 47, 204-238. Nye, P., & Fowler, C. (2003). Shadowing latency and imitation: the effect of familiarity with the
phonetic patterning of English. Journal of Phonetics, 31, 63-79. Onishi, K., Chambers, K., & Fisher, C. (2002). Learning phonotactic constraints from brief
auditory experience. Cognition, 83, 13-23. Papagno, C., Valentine, T., & Baddeley, A. D. (1991). Phonological short-term memory and
foreign-language learning. Journal of Memory and Language, 30, 331-347. Pardo, J. (2006). On phonetic convergence during conversational interaction. Journal of the
Acoustical Society of America, 119, 2382. Pegg, J., & Werker, J. (1997). Adult and infant perception of two English phones. Journal of the
Acoustical Society of America, 102, 3742-3753.

186
Pegg, J., Werker, J., Ferguson, L., Menn, & Stoel-Gammon, C. (1992). Infant speech perception and phonological acquisition. In Phonological development: models, research, implications. (pp. 285-311).
Pisoni, D. B., & Tash, J. (1974). Reaction times to comparisons within and across phonetic
categories. Perception and Psychophysics, 15, 285-290. Rapp, B., & Goldrick, M. (2000). Discreteness and Interactivity in Spoken Word Production.
Psychological Review, 107, 460-499. Repp, B. H., & Liberman, A. M. (1987). Phonetic category boundaries are flexible. In S. R.
Harnad (Ed.), Categorical Perception Vol (pp. 89-112). Cambridge, England: Cambridge University Press.
Rochet, B. (1995) Perception and production of second-language speech sounds by adults. In
Speech Perception and Linguistic Experience: Issues in Cross-Language Research Vol (pp. 379-410) Baltimore: York.
Romani, C. (1992). Are there distinct input and output buffers? Evidence from an aphasic patient
with an impaired output buffer. Language & Cognitive Processes. Rvachew, S. (1994). Speech perception training can facilitate sound production learning. Journal
of Speech and Hearing Research, 37, 347. Rvachew, S., Nowak, M., & Cloutier, G. (2004). Effect of phonemic perception training on the
speech production and phonological awareness skills of children with expressive phonological delay. American Journal of Speech-Language Pathology, 13, 250-263.
Saffran, J. R., Aslin, R. N., & Newport, E. (1996). Statistical learning by 8-month-old infants.
Science, 274, 1926-1928. Saffran, J. R., Johnson, E., Aslin, R. N., & Newport, E. (1999). Learning of tone sequences by
human infants and adults. Cognition, 70. Samuel, A. G., & Kraljic, T. (2009). Perceptual learning for speech. Attention, Perception &
Psychophysics, 71, 1207-1218. Schouten, B., Gerrits, E., & van Hessen, A. (2003). The end of categorical perception as we
know it. Speech Communication. Sheldon, A., & Strange, W. (1982). The acquisition of /r/ and /l/ by Japanese learners of English:
Evidence that speech production can precede speech perception. Applied Psycholinguistics, 3, 243-261.

187
Shockley, K., Sabadini, L., & Fowler, C. (2004). Imitation in shadowing words. Perception & Psychophysics, 66, 422-429.
Stevens, K. N., & Blumstein, S. E. (1981). The search for invariant acoustic correlates of
phonetic features. In P. D. Eimas & J. L. Miller (Eds.), Perspectives on the Study of Speech Vol (pp. 1-38). Hillsdale, NJ: Erlbaum.
Storkel, H. L., Armbrüster, J., & Hogan, T. P. (2006). Differentiating phonotactic probability and
neighborhood density in adult word learning. Journal of Speech, Language, and Hearing Research, 49, 1175-1192.
Strange, W., & Dittman, S. (1984). Effects of discrimination training on the perception of /r-l/ by
Japanese adults learning English. Perception & psychophysics, 36, 131-145. Studdert-Kennedy, M., Liberman, A. M., Harris, K. S., & Cooper, F. S. (1970). The motor theory
of speech perception: A reply to Lane's critical review. Psychological Review, 77, 234-249.
Thiessen, E. D. (2010). Effects of visual information on adults' and infants' auditory statistical
learning. Cognitive Science, 34, 1093-1106. Toro, J., Sinnet, S., & Soto-Faraco, S. (2005). Speech segmentation by statistical learning
depends on attention. Cognition, 97, B25-B34. Tremblay, K., Kraus, N., Carrell, T. D., & McGee, T. (1997). Central auditory system plasticity:
Generalization to novel stimuli following listening training. Journal of the Acoustical Society of America, 102, 3762-3773.
Tsao, F. M., Liu, H. M., & Kuhl, P. K. (2006). Perception of native and non-native affricate
fricative contrasts: Cross language tests on adults and infants. Journal of the Acoustical Society of America, 120, 2285-2294.
Vallabha, G., & Tuller, B. (2004). Perceptuomotor bias in the imitation of steady-state vowels.
Journal of the Acoustical Society of America, 116, 1184. Vallabha, G., & Tuller, B. (Submitted). Say aah: Diagnosing the inaccuracies in vowel imitation. Van Engen, K. J., Baese-Berk, M., Baker, R. E., Choi, A., Kim, M., & Bradlow, A. R. (2010).
The Wildcat Corpus of Native- and Foreign-Accented English: Communicative efficiency across conversational dyads with varying language alignment profiles. Language and Speech 53 (4).
VanDam, M. (2007). Plasticity of Phonological Categories. Unpublished doctoral dissertation.
Indiana University.

188
Wang, Y., Jongman, A., & Sereno, J. (2003). Acoustic and perceptul evaluation of Mandarin tone productions before and after perceptual training. Journal of the Acoustical Society of America, 113, 1033-1043.
Wang, Y., Spence, M., Jongman, A., & Sereno, J. (1999). Training American Listeners to
perceive Mandarin tones. Journal of the Acoustical Society of America, 106, 3649-3658. Warker, J. A., & Dell, G. S. (2006). Speech errors reflect newly learned phonotactic constraints.
Journal of Experimental Psychology: Learning, Memory, and Cognition, 32, 387. Warker, J. A., Dell, G. S., Whalen, C. A., & Gereg, S. (2008). Limits on learning phonotactic
constraints from recent production experience. Journal of Experimental Psychology: Learning, Memory, and Cognition, 34, 1289-1295.
Warker, J. A., Xu, Y., Dell, G. S., & Fisher, C. (2009). Speech errors reflect the phonotactic
constraints in recently spoken syllables, but not in recently heard syllables. Cognition, 112, 81-96.
Werker, J., & Tees, R. C. (1984). Cross-language speech perception: evidence for perceptual
reorganization during the first year of life. Infant Behavior and Development, 7, 49-63. Werker, J. F., Gilbert, J. H. V., Humphrey, K., & Tees, R. C. (1981). Developmental aspects of
cross-language speech perception. Child Development, 52, 349-355.

189
APPENDICES

190
APPENDIX A: Picture sets for training and breakdown of picture assignments
Picture Set A:
Picture Set B:
Picture assignment chart for six subjects in unimodal and bimodal training groups
Picture assignments were repeated 3 times within each training group (for a total of 18 subjects
in each group):
Pictures Bimodal1 Bimodal2 Bimodal3 Bimodal4 Bimodal5 Bimodal6 circle da1 da1 dae1 dae1 dr1 dr1 square da8 da8 dae8 dae8 dr8 dr8 triangle dae1 dr1 da1 dr1 da1 dae1 arc dae8 dr8 da8 dr8 da8 dae8 heart dr1 dae1 dr1 da1 dae1 da1 cross dr8 dae8 dr8 da8 dae8 da8
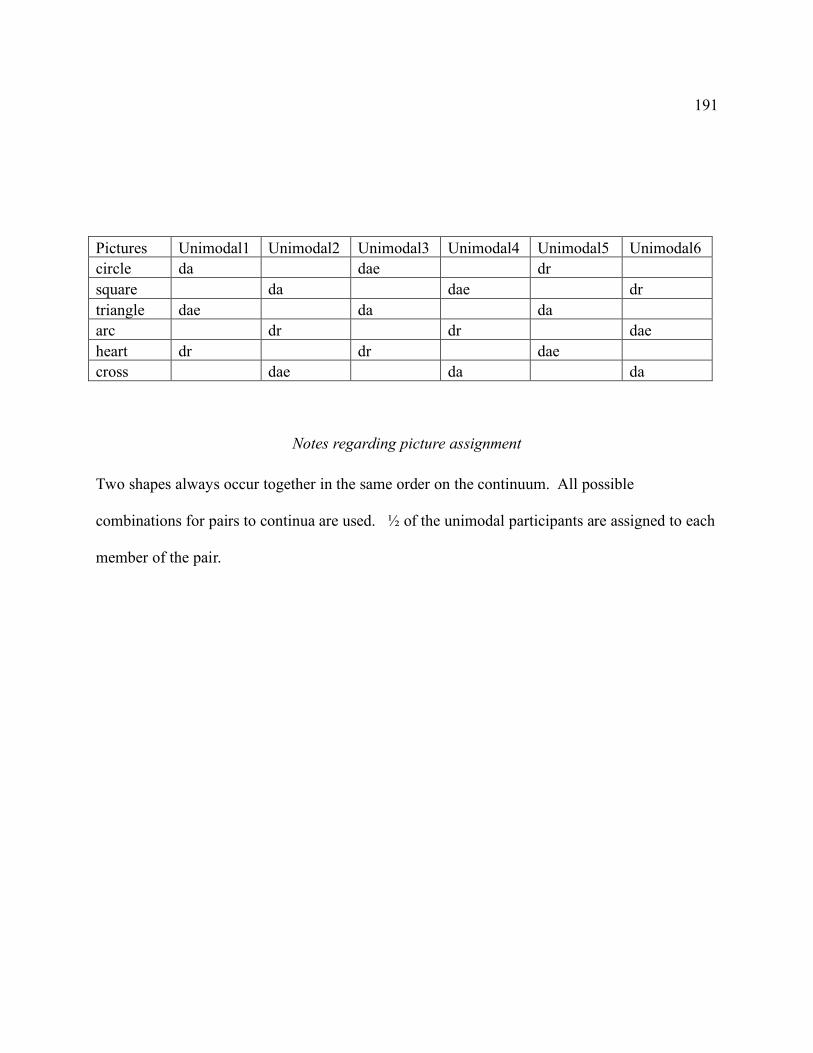
191
Pictures Unimodal1 Unimodal2 Unimodal3 Unimodal4 Unimodal5 Unimodal6 circle da dae dr square da dae dr triangle dae da da arc dr dr dae heart dr dr dae cross dae da da
Notes regarding picture assignment
Two shapes always occur together in the same order on the continuum. All possible
combinations for pairs to continua are used. ½ of the unimodal participants are assigned to each
member of the pair.

192
APPENDIX B: Instructions for Training
Perception Only
During this part of the experiment you'll be learning new words from a language you've never
heard before.
You'll hear single words spoken by one speaker. The words will be matched with a single
picture. Pay attention to each word. To help you pay attention, we'll ask you to press a key
between each trial.
Remember, your job is to learn the words in this new language, so be sure to pay attention to the
words.
If you have any questions, ask the experimenter now. Otherwise, press any key to begin.
Perception+Production
During this part of the experiment you'll be learning new words from a language you've never
heard before.
You'll hear single words spoken by one speaker. The words will be matched with a single
picture. Pay attention to the word. To help you learn the words, we'll ask you to repeat each

193
word, immediately after you hear it. Try to repeat the word as close as possible to what you
hear. Once you've said the word, press the key to advance.
Remember, your job is to learn the words in this new language, so be sure to pay attention to the
words.
If you have any questions, ask the experimenter now. Otherwise, press any key to begin.

194
APPENDIX C: Instructions for Tests
Discrimination
During this portion of the experiment you will hear pairs of words. Your task is to determine if
the words are the same or different. Press the red button for same and the blue button for
different.
If you have any questions, please ask the experimenter now.
Otherwise press any key to begin.
Repetition
During this portion of the experiment, you will hear single words over the speakers. Your task is
to simply repeat the word you hear. Try to produce the word as close as possible to the token
you hear. After you have produced the word, press any button to move to the next item.
If you have any questions, alert the experimenter. Otherwise press any key to continue.
Categorization
During this portion of the experiment, you will hear single words over the speakers. Your task is
to match the word with the corresponding picture.

195
The buttons correspond to the pictures (farthest left button is for the picture to the far left, etc.).
If you have any questions, alert the experimenter. Otherwise press any key to continue.
Naming
During this portion of the experiment, you will see a single picture on the screen. Your task is to
simply "name" the picture with the label you learned during training. Try to produce the word as
close as possible to the token you heard during training. After you have produced the word,
press any button to move to the next item.
If you have any questions, alert the experimenter. Otherwise press any key to continue.

196
APPENDIX D: Piloted Methods
Before the current methods were decided upon a number of other methods were attempted, but
failed to result in robust perceptual learning. These various methods are detailed below and
include: multiple talker training with fillers and a speaker identification task, single talker
training with fillers and no target task, single talker training with fillers and with the addition of
visual stimuli, and single talker training without fillers and with the addition of visual stimuli.
Multiple Talker Training with Speaker Identification
In order to better equate the perception-only training discussed above and the perception +
production training in Experiments 2 and 3, I hoped to have participants undertake a similarly
demanding task during perception-only training. In order to achieve this, I used two speakers for
training, rather than just one, as discussed above.
Both speakers’ productions were resynthesized with the same formant transitions and the
same voice onset time. Vowel duration was also equated for all tokens by both speakers. Thus
the only unique information across speakers was information typically used in voice
identification (e.g., higher formants and pitch).
In addition to multiple talkers producing each token, the target tokens were also
embedded with fillers beginning with /m/ and /l/ in the same vowel contexts as the target tokens.
This doubled the number of trained tokens, since participants were presented with a total of 16
fillers along with the 16 target tokens in each training block. These filler tokens were included

197
following Maye and Gerken. Multiple tokens of each filler word ([ma], [la], [mæ], [læ], [mә˞],
and [lә˞])were recorded by each speaker and presented during training.
Participants were also tested at the end on generalization of the trained contrast to a new
place of articulation. Velar stimuli were included in a separate discrimination and repetition
post-test at the end of the training regimen for this pilot study. Again, continua were formed in
three vowel contexts. This resulted in the following vowel continua: [ga]-[Ga], [gæ]-[Gæ], and
[gә˞] to [Gә˞]. Participants were not exposed to these velar stimuli until the discrimination and
repetition post-tests at the end of each training day. Filler tokens beginning with /m/ and /l/ were
included in these tests as well.
During training, participants were presented with a single token and asked to identify the
speaker. They were instructed to assign the speaker of the first token to the left button on the
button box, and the other speaker to the right button on the button box. Participants in this
condition were trained for five consecutive days. Four native, monolingual English speakers
participated in this pilot study in the bimodal training condition.
During test, participants completed the discrimination and repetition tests described
above. The major differences between those tests and the tests piloted here were the number of
speakers and the inclusion of fillers. Each participant heard a comparison spoken by one of two
speakers. In addition to the same, within-category, and across-category comparisons for the
target tokens, participants also heard two types of comparisons for filler tokens: same and
different. Same comparisons for fillers were pairs made of unique productions of a word such as
“ma,” spoken by the same speaker. Different comparisons for fillers were pairs of words such as
“ma” and “la”. With the exception of multiple speakers, this was intended to be a close
replication of Maye and Gerken.

198
The training and testing routine was similar than that described in Experiment 1;
however, naming and categorization were not included and a generalization test was included.
Training was interleaved with discrimination and repetition testing as follows: discrimination
pre-test, repetition pre-test, training 1, discrimination post-test 1, training 2, discrimination post-
test 2, training 3, repetition post-test, training, generalization discrimination test, generalization
repetition test. This routine was followed for 5 consecutive days in this pilot study.
Unfortunately, the addition of this task resulted in no perceptual learning. That is, the
three pilot participants in the bimodal group failed to infer two perceptual categories, even after
five consecutive days of training. They also performed much worse on across category
comparisons than on different trials for fillers. In fact, participants never identified any of the
target tokens as “different” during test, only choosing to categorize filler tokens as “different”
from one another. Additionally, participants did not discriminate between any of the target
tokens in the generalization test (n.b.: these pilot experiment only examined generalization from
alveolar to velar, not the reverse).
I believe the lack of learning in this condition was in part due to the fact that I explicitly
asked participants during training to pay attention to information for the speaker identification
task that was irrelevant to the broader phoneme learning task of the entire experiment. This
possibility will be discussed further in the general discussion.
199
Single Talker Training (No target task)
Because of the intuition that the lack of learning in the first pilot task may be due to attention
being directed toward irrelevant properties of the stimuli during the training task, I removed the
training task for two additional pilot subjects. Instead, I asked participants to simply press a
button to advance to the next trial, as they do in Experiment 1. I also only presented stimuli by
one of the two speakers in the first pilot experiment. Fillers were presented in a random order
along with target tokens.
Participants were trained for five consecutive days. Two participants completed this pilot
study in the bimodal training condition. This study was a more direct attempt at replication of
Maye and Gerken, as only one speaker’s tokens were included in the training and test sets. The
generalization test was also included in this pilot study.
Once again, neither participant improved in their ability to discriminate across categories.
In fact, both participants had d' scores (a measure of sensitivity discussed further below) of zero.
Both participants were much worse at discriminating between the target tokens than between the
filler tokens.
Even though this was an attempt at a direct replication of Maye and Gerken, there are
several possibilities for the differences in results found in this pilot study and in Maye and
Gerken. First, the training and testing paradigm in this study is more complicated than that in
Maye and Gerken, which included a training period and a post-test. Participants in this study
began with two pre-tests (discrimination and repetition), which gave participants some exposure
to stimuli before training. Additionally, the stimuli in this study were resynthesized in a slightly
different way in this study. Specifically, the stimuli were resynthesized using point 1 on a
continuum. Each subsequent step was resynthesized from point 1. Maye and Gerken, on the
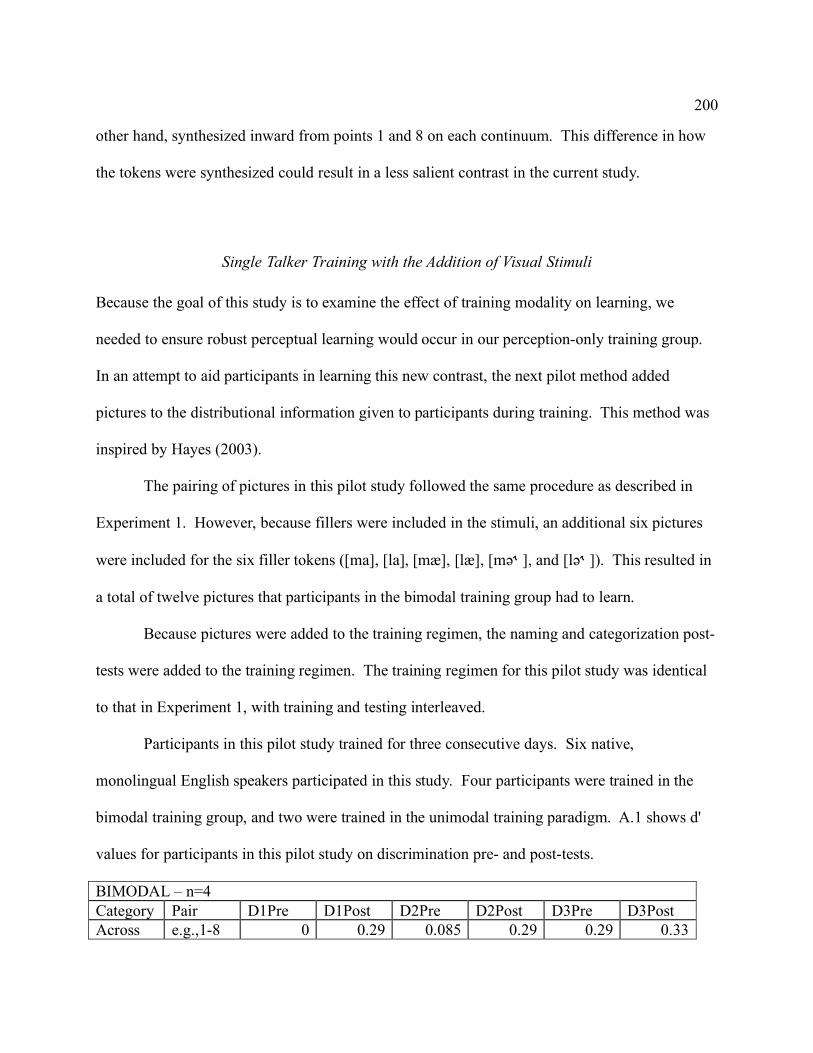
200
other hand, synthesized inward from points 1 and 8 on each continuum. This difference in how
the tokens were synthesized could result in a less salient contrast in the current study.
Single Talker Training with the Addition of Visual Stimuli
Because the goal of this study is to examine the effect of training modality on learning, we
needed to ensure robust perceptual learning would occur in our perception-only training group.
In an attempt to aid participants in learning this new contrast, the next pilot method added
pictures to the distributional information given to participants during training. This method was
inspired by Hayes (2003).
The pairing of pictures in this pilot study followed the same procedure as described in
Experiment 1. However, because fillers were included in the stimuli, an additional six pictures
were included for the six filler tokens ([ma], [la], [mæ], [læ], [mә˞], and [lә˞]). This resulted in
a total of twelve pictures that participants in the bimodal training group had to learn.
Because pictures were added to the training regimen, the naming and categorization post-
tests were added to the training regimen. The training regimen for this pilot study was identical
to that in Experiment 1, with training and testing interleaved.
Participants in this pilot study trained for three consecutive days. Six native,
monolingual English speakers participated in this study. Four participants were trained in the
bimodal training group, and two were trained in the unimodal training paradigm. A.1 shows d'
values for participants in this pilot study on discrimination pre- and post-tests.
BIMODAL – n=4 Category Pair D1Pre D1Post D2Pre D2Post D3Pre D3Post Across e.g.,1-8 0 0.29 0.085 0.29 0.29 0.33
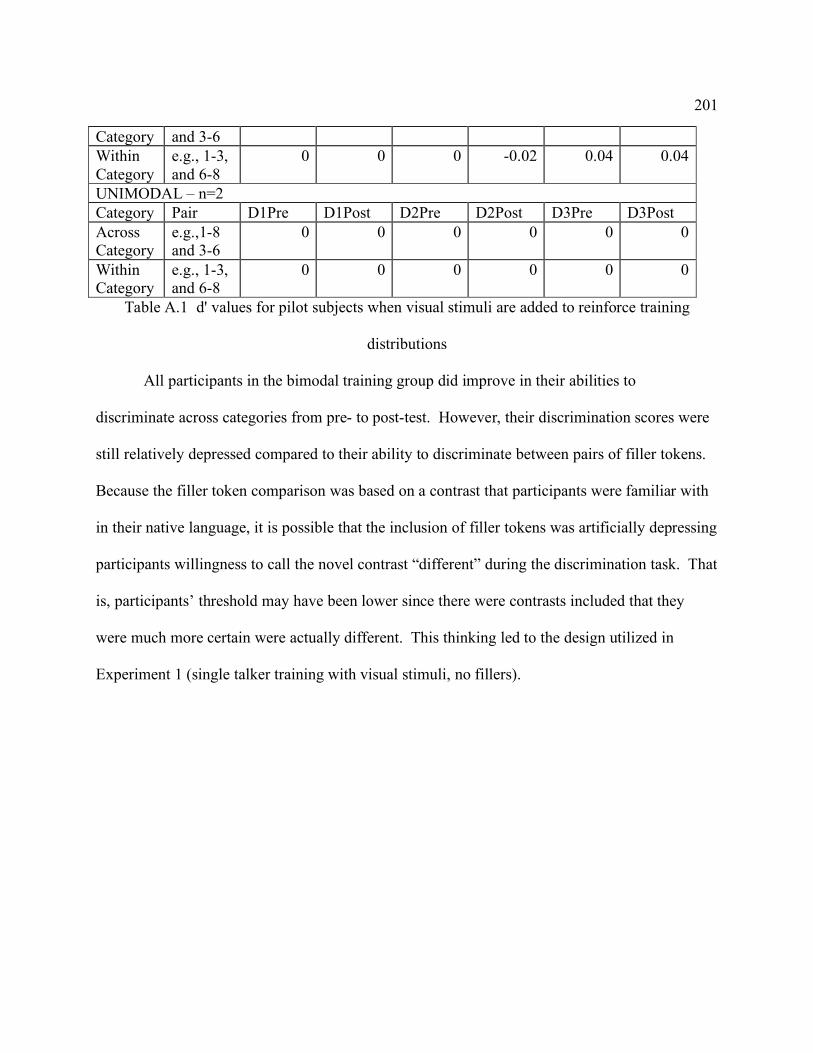
201
Category and 3-6 Within Category
e.g., 1-3, and 6-8
0 0 0 -0.02 0.04 0.04
UNIMODAL – n=2 Category Pair D1Pre D1Post D2Pre D2Post D3Pre D3Post Across Category
e.g.,1-8 and 3-6
0 0 0 0 0 0
Within Category
e.g., 1-3, and 6-8
0 0 0 0 0 0
Table A.1 d' values for pilot subjects when visual stimuli are added to reinforce training
distributions
All participants in the bimodal training group did improve in their abilities to
discriminate across categories from pre- to post-test. However, their discrimination scores were
still relatively depressed compared to their ability to discriminate between pairs of filler tokens.
Because the filler token comparison was based on a contrast that participants were familiar with
in their native language, it is possible that the inclusion of filler tokens was artificially depressing
participants willingness to call the novel contrast “different” during the discrimination task. That
is, participants’ threshold may have been lower since there were contrasts included that they
were much more certain were actually different. This thinking led to the design utilized in
Experiment 1 (single talker training with visual stimuli, no fillers).