Embed Size (px)
Citation preview
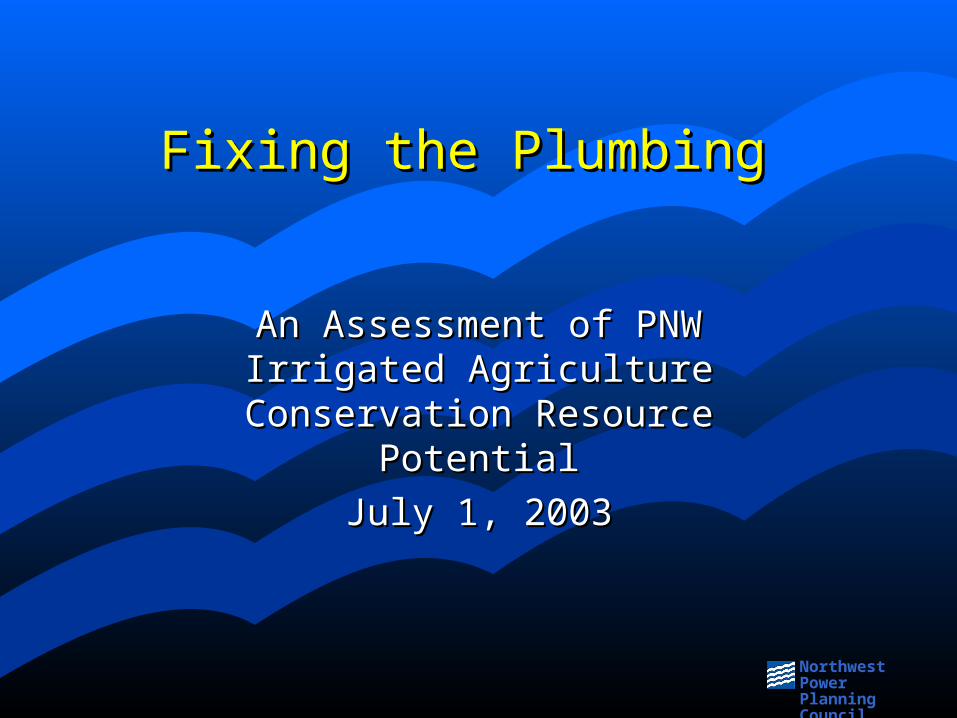
Northwest PowerPlanning Council
Fixing the Plumbing Fixing the Plumbing
An Assessment of PNW Irrigated An Assessment of PNW Irrigated Agriculture Conservation Resource Agriculture Conservation Resource
PotentialPotential
July 1, 2003July 1, 2003

slide 2
Northwest PowerPlanning Council
PNW Irrigated Acreage Has PNW Irrigated Acreage Has Been IncreasingBeen Increasing
StateState Acres Irrigated Acres Irrigated 19971997
Acres Irrigated Acres Irrigated 19921992
Acres Irrigated Acres Irrigated 19871987
IdahoIdaho 3,493,5423,493,542 3,260,0063,260,006 3,219,1923,219,192
MontanaMontana 1,994,4841,994,484 1,978,1671,978,167 1,996,8821,996,882
OregonOregon 1,948,7391,948,739 1,622,2351,622,235 1,648,2051,648,205
WashingtonWashington 1,705,0251,705,025 1,641,4371,641,437 1,518,6841,518,684
PNWPNW 9,141,7909,141,790 8,501,8458,501,845 8,382,9638,382,963
Avg. Size Avg. Size (acres)(acres)
173173 159159 150150

slide 3
Northwest PowerPlanning Council
Sprinkler Systems Dominate Sprinkler Systems Dominate Irrigated Acreage in PNWIrrigated Acreage in PNW
StateState
Total Total Irrigated Irrigated AcreageAcreage
Sprinkled AcreageSprinkled Acreage Gravity AcreageGravity Acreage
AcresAcres %% AcresAcres %%
IdahoIdaho 3,188,406 3,188,406
2,186,806 2,186,806 69%69%
991,613 991,613 31%31%
MontanaMontana 1,740,873 1,740,873
570,550 570,550 33%33%
117,807 117,807 7%7%
OregonOregon 1,534,961 1,534,961
769,310 769,310 50%50%
745,083 745,083 49%49%
WashingtonWashington 1,554,813 1,554,813
1,263,572 1,263,572 81%81%
252,312 252,312 16%16%
PNW TotalPNW Total 8,019,053 8,019,053
4,790,238 4,790,238 60%60%
2,106,815 2,106,815 26%26%

slide 4
Northwest PowerPlanning Council
Center Pivot Sprinkler Acreage Has Center Pivot Sprinkler Acreage Has Been IncreasingBeen Increasing
(Although Not in All States) (Although Not in All States)
StateState 19941994 19971997
FarmsFarms AcresAcres FarmsFarms AcresAcres
IdahoIdaho 2,147 2,147 776,081 776,081 1,5691,569 1,001,6071,001,607
MontanaMontana 949 949 249,059 249,059 1,0151,015 241,287241,287
OregonOregon 2,012 2,012 337,270 337,270 487487 256,678256,678
WashingtonWashington 1,960 1,960 578,414 578,414 1,3011,301 773,788773,788
PNWPNW 7,0687,068 1,940,8241,940,824 4,3724,372 2,273,3602,273,360

slide 5
Northwest PowerPlanning Council
Low Pressure Center Pivot Systems Low Pressure Center Pivot Systems Increased Between 1993 and 1997Increased Between 1993 and 1997
StateState Change in High Change in High Pressure (60 + Pressure (60 + PSI) AcresPSI) Acres
Change in Change in Medium Medium Pressure (30 – Pressure (30 – 59 PSI) Acres59 PSI) Acres
Change in Low Change in Low Pressure (30 Pressure (30 PSI & lower) PSI & lower) AcresAcres
IdahoIdaho -13%-13% -1%-1% 14%14%
MontanaMontana -10%-10% -8%-8% 18%18%
OregonOregon -10%-10% 3%3% 7%7%
WashingtonWashington -16%-16% 2%2% 14%14%
PNWPNW -13%-13% 0%0% 13%13%
slide 6
Northwest PowerPlanning Council
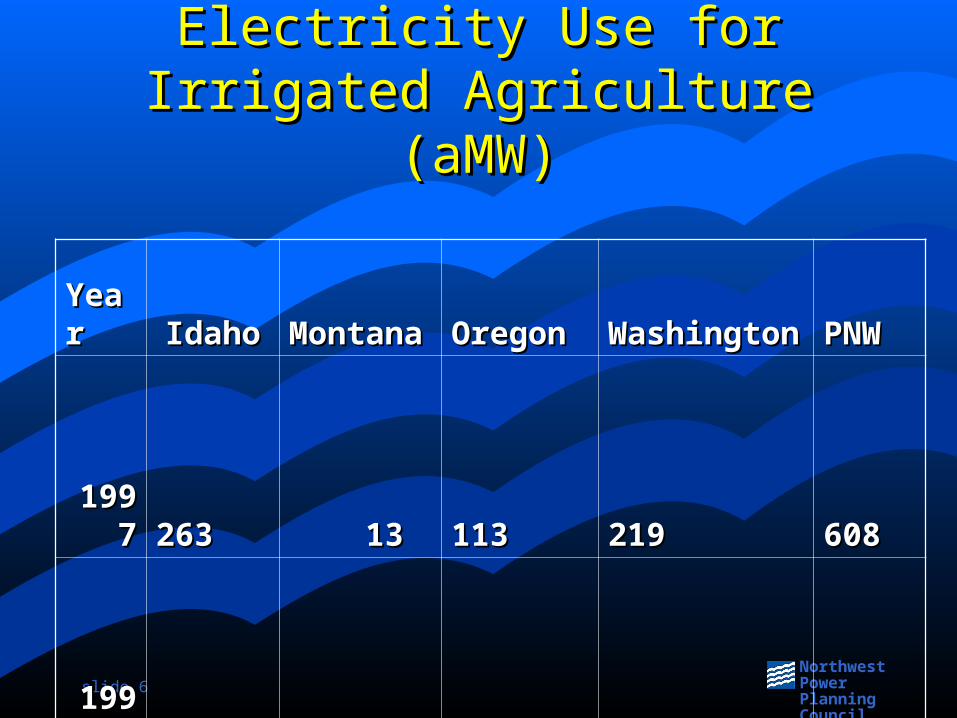
Electricity Use for Irrigated Electricity Use for Irrigated Agriculture (aMW)Agriculture (aMW)
YearYear IdahoIdaho MontanaMontana OregonOregon WashingtonWashington PNWPNW
19971997 263 263
13 13 113 113
219 219
608 608
19941994 322 322
10 10 123 123
219 219
675 675

slide 7
Northwest PowerPlanning Council
Irrigation Electricity Use Represented Irrigation Electricity Use Represented Two-Thirds of Agricultural Sector Total in Two-Thirds of Agricultural Sector Total in
19971997
StateState Total Agricultural Total Agricultural Sector Electricity Sector Electricity Expenditures Expenditures (millions)(millions)
Irrigation Irrigation Electricity Electricity Expenses Expenses (millions)(millions)
Share of Total Share of Total Sector Sector
Electricity Electricity CostsCosts
IdahoIdaho $ 90 $ 90 $ 71 $ 71 79%79%
MontanaMontana $ 30 $ 30 $ 9 $ 9 31%31%
OregonOregon $ 48 $ 48 $ 23 $ 23 48%48%
WashingtonWashington $ 74 $ 74 $ 49 $ 49 66%66%
PNWPNW $ 241 $ 241 $ 152 $ 152 63%63%
slide 8
Northwest PowerPlanning Council
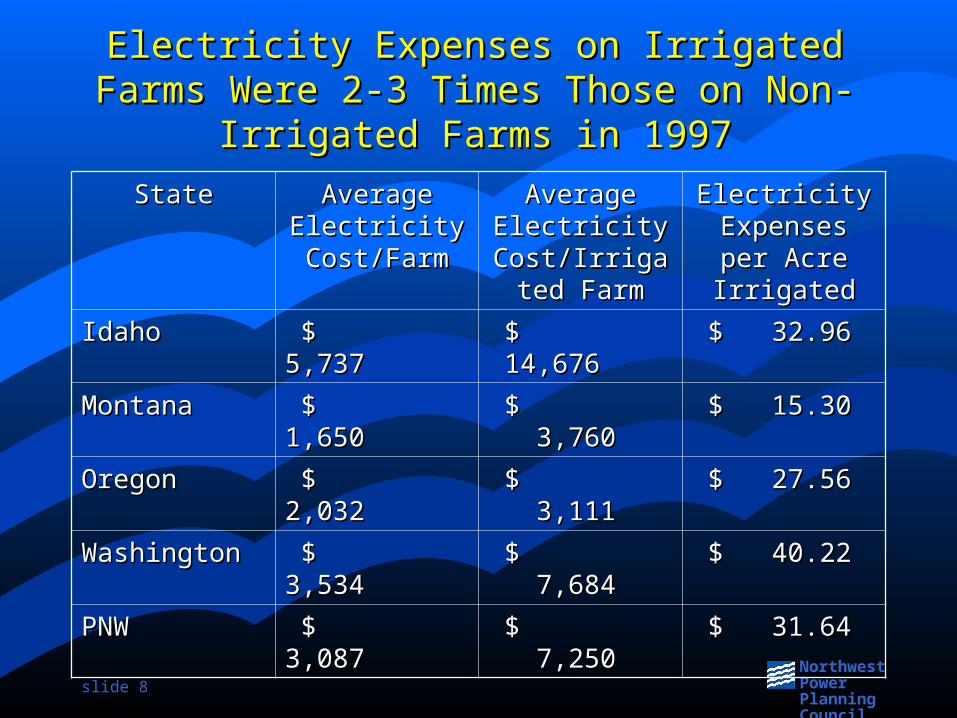
Electricity Expenses on Irrigated Farms Electricity Expenses on Irrigated Farms Were 2-3 Times Those on Non-Irrigated Were 2-3 Times Those on Non-Irrigated
Farms in 1997Farms in 1997
StateState Average Average Electricity Electricity Cost/FarmCost/Farm
Average Average Electricity Electricity
Cost/Irrigated Cost/Irrigated FarmFarm
Electricity Electricity Expenses per Expenses per Acre IrrigatedAcre Irrigated
IdahoIdaho $ 5,737 $ 5,737 $ 14,676 $ 14,676 $ 32.96 $ 32.96
MontanaMontana $ 1,650 $ 1,650 $ 3,760 $ 3,760 $ 15.30 $ 15.30
OregonOregon $ 2,032 $ 2,032 $ 3,111 $ 3,111 $ 27.56 $ 27.56
WashingtonWashington $ 3,534 $ 3,534 $ 7,684 $ 7,684 $ 40.22 $ 40.22
PNWPNW $ 3,087 $ 3,087 $ 7,250 $ 7,250 $ 31.64 $ 31.64

slide 9
Northwest PowerPlanning Council
Electricity Use/Irrigated Acre Has Electricity Use/Irrigated Acre Has Been DecliningBeen Declining
0
200
400
600
800
1,000
1,200
1,400
1,600
Idaho Montana Oregon Washington PNW
kWh/a
cre
19941997
(At Least We Think So)(At Least We Think So)
slide 10
Northwest PowerPlanning Council
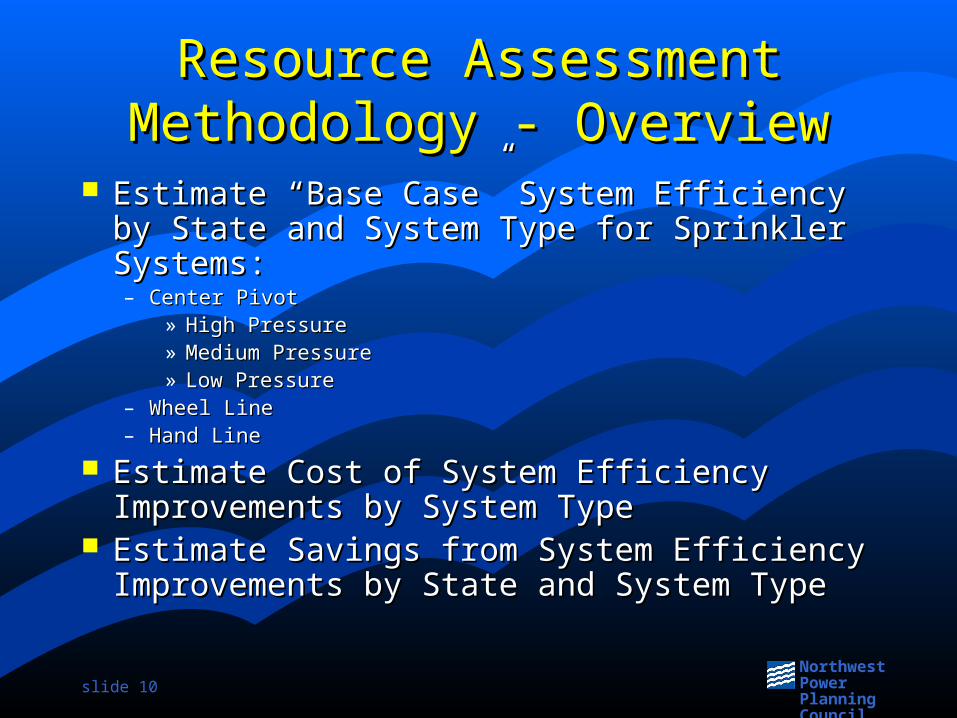
Resource Assessment Resource Assessment Methodology - OverviewMethodology - Overview
Estimate “Base Case” System Efficiency by State Estimate “Base Case” System Efficiency by State and System Type for Sprinkler Systems:and System Type for Sprinkler Systems:– Center PivotCenter Pivot
» High PressureHigh Pressure» Medium PressureMedium Pressure» Low PressureLow Pressure
– Wheel LineWheel Line– Hand LineHand Line
Estimate Cost of System Efficiency Improvements Estimate Cost of System Efficiency Improvements by System Typeby System Type
Estimate Savings from System Efficiency Estimate Savings from System Efficiency Improvements by State and System TypeImprovements by State and System Type

slide 11
Northwest PowerPlanning Council
Step 1- Estimate Annual Irrigation Step 1- Estimate Annual Irrigation System Use by StateSystem Use by State
Data Sources:Data Sources:– 1994 & 1997 Farm and Ranch Irrigation Surveys 1994 & 1997 Farm and Ranch Irrigation Surveys
(FRIS)(FRIS)» Acres irrigated by electric pumpingAcres irrigated by electric pumping» Annual electricity cost/irrigated acreAnnual electricity cost/irrigated acre» Annual water use/acreAnnual water use/acre
– 1994 & 1997 Bonneville Irrigation Sector Sales and 1994 & 1997 Bonneville Irrigation Sector Sales and RevenuesRevenues
Approach:Approach:– Use FRIS Annual electricity cost by state divided by Use FRIS Annual electricity cost by state divided by
BPA irrigation sales by state to derive “kWh/Acre” & BPA irrigation sales by state to derive “kWh/Acre” & “kWh/acre-ft/acre”“kWh/acre-ft/acre”

slide 12
Northwest PowerPlanning Council
Step 1- Estimate Annual Irrigation Step 1- Estimate Annual Irrigation System Use by State (cont)System Use by State (cont)
Example: Idaho (1997) Example: Idaho (1997) – FRIS Estimate of Sprinkler Irrigated Acreage FRIS Estimate of Sprinkler Irrigated Acreage
Using Electric Pumping = 2,166,804 acresUsing Electric Pumping = 2,166,804 acres– FRIS Estimate of Water Use = 1.7 acre-ft/acreFRIS Estimate of Water Use = 1.7 acre-ft/acre– BPA Estimate of Idaho Irrigation Sector Sales = BPA Estimate of Idaho Irrigation Sector Sales =
263 aMW263 aMW– 263 aMW x 8760000 / 2,166,804 = 1064 kWh/acre263 aMW x 8760000 / 2,166,804 = 1064 kWh/acre– 1064 kWh/acre /1.7 acre-ft/acre = 626 kWh/acre-ft1064 kWh/acre /1.7 acre-ft/acre = 626 kWh/acre-ft

slide 13
Northwest PowerPlanning Council
Step 2 - Estimate Annual Energy Step 2 - Estimate Annual Energy Consumption of “Typical” Field by Consumption of “Typical” Field by
System Type and StateSystem Type and State Use 1997 Farm and Ranch Irrigation Use 1997 Farm and Ranch Irrigation
Survey to Estimate AverageSurvey to Estimate Average– Pumping Lift (Feet of head pressure)Pumping Lift (Feet of head pressure)– Flow Rate (GPM)Flow Rate (GPM)– System Pressure (PSI)System Pressure (PSI)– Water Use (Acre-Ft/Acre)Water Use (Acre-Ft/Acre)
Adjust “System Friction” and “Field Lift” Adjust “System Friction” and “Field Lift” Values until energy use = Estimated 1997 Values until energy use = Estimated 1997 kWh/acre-ft/yearkWh/acre-ft/year

slide 14
Northwest PowerPlanning Council
Electricity Use for Irrigation Electricity Use for Irrigation Pumping - ExamplePumping - Example
\\fs1\power\TE\New Plan\Irrigated Agriculture\I\\fs1\power\TE\New Plan\Irrigated Agriculture\IrrAgSampleCalc.xlsrrAgSampleCalc.xls

slide 15
Northwest PowerPlanning Council
Step 3 – Estimate Measure CostStep 3 – Estimate Measure Cost High Pressure > Low Pressure Center PivotHigh Pressure > Low Pressure Center Pivot
» $4,000/160 acre pivot w/o boom$4,000/160 acre pivot w/o boom» $7,000/160 acre pivot w/boom$7,000/160 acre pivot w/boom
Medium Pressure > Low Pressure Center PivotMedium Pressure > Low Pressure Center Pivot» $3000/160 acre pivot$3000/160 acre pivot
Replace pump, nozzles & gaskets – Replace pump, nozzles & gaskets – » $18,350/160 acre pivot w/deep well$18,350/160 acre pivot w/deep well» $15, 350/160 acre pivot w/average well$15, 350/160 acre pivot w/average well
Replace nozzles and gasketsReplace nozzles and gaskets– $8,350 /160 acre pivot$8,350 /160 acre pivot
Convert wheel line to low pressure (alfalfa only)Convert wheel line to low pressure (alfalfa only)» $130/acre, plus $3.75/acre O&M)$130/acre, plus $3.75/acre O&M)
Convert hand line to low pressure (alfalfa only)Convert hand line to low pressure (alfalfa only)» $30/acre, plus $12/acre O&M$30/acre, plus $12/acre O&M

slide 16
Northwest PowerPlanning Council
Step 4 – Determine Measure Savings Step 4 – Determine Measure Savings Input AssumptionsInput Assumptions
MeasureMeasure
Baseline Baseline Pump Pump EfficiencyEfficiency
Retrofitted Retrofitted Pump Pump EfficiencyEfficiency
Baseline Baseline PressurePressure
Retrofitted Retrofitted PressurePressure
Pump, Nozzle & Gasket Pump, Nozzle & Gasket Replacement Deep WellReplacement Deep Well 50%50% 70%70% 62 *62 * 62 *62 *
Pump, Nozzle & Gasket Pump, Nozzle & Gasket Replacement Average WellReplacement Average Well 55%55% 70%70%
59 *59 *
59 *59 *
Nozzle & Gasket Replacement Nozzle & Gasket Replacement 55%55% 65%65%
59 59 59 59
Convert High Pressure Center Pivot Convert High Pressure Center Pivot to Low pressure systemto Low pressure system 60%60% 75%75%
59 59
20 20
Convert Medium Pressure Center Convert Medium Pressure Center Pivot to Low pressure systemPivot to Low pressure system 65%65% 75%75%
40 40
20 20
Convert wheel line systems to low Convert wheel line systems to low pressure systems on alfalfa acreagepressure systems on alfalfa acreage 65%65% 65%65%
59 *59 *
30 30
Convert hand line systems to low Convert hand line systems to low pressure systems on alfalfa acreagepressure systems on alfalfa acreage 65%65% 65%65%
59 *59 *
30 30
*Varies by state
slide 17
Northwest PowerPlanning Council
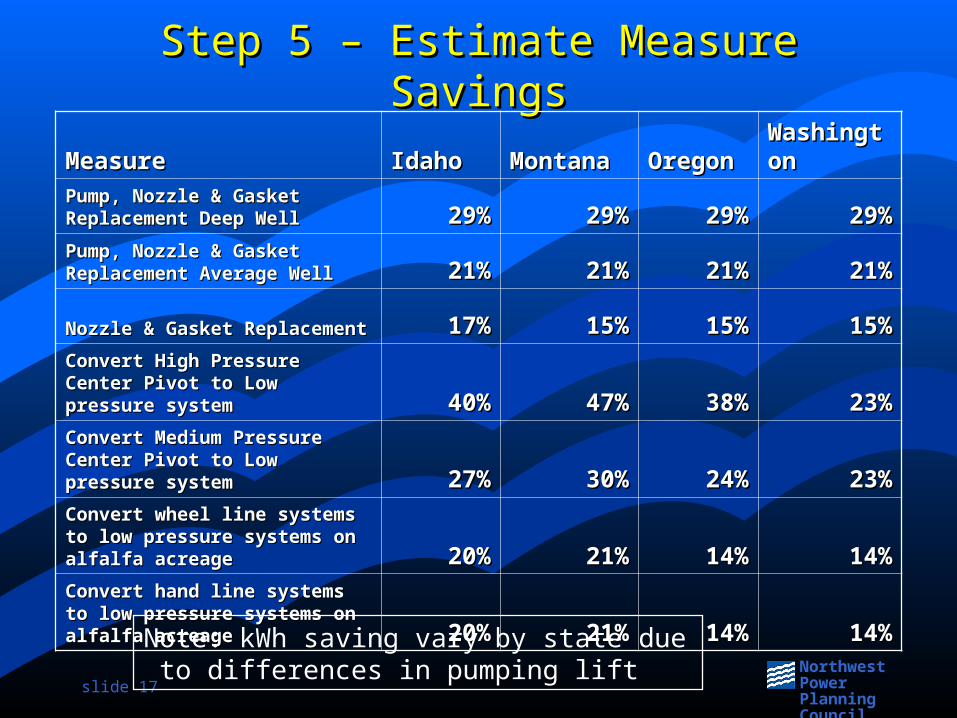
Step 5 – Estimate Measure SavingsStep 5 – Estimate Measure Savings
MeasureMeasure IdahoIdaho MontanaMontana OregonOregon WashingtonWashington
Pump, Nozzle & Gasket Pump, Nozzle & Gasket Replacement Deep WellReplacement Deep Well 29%29% 29%29% 29%29% 29%29%
Pump, Nozzle & Gasket Pump, Nozzle & Gasket Replacement Average WellReplacement Average Well 21%21% 21%21% 21%21% 21%21%
Nozzle & Gasket Replacement Nozzle & Gasket Replacement 17%17% 15%15% 15%15% 15%15%
Convert High Pressure Center Convert High Pressure Center Pivot to Low pressure systemPivot to Low pressure system 40%40% 47%47% 38%38% 23%23%
Convert Medium Pressure Center Convert Medium Pressure Center Pivot to Low pressure systemPivot to Low pressure system 27%27% 30%30% 24%24% 23%23%
Convert wheel line systems to low Convert wheel line systems to low pressure systems on alfalfa pressure systems on alfalfa acreageacreage 20%20% 21%21% 14%14% 14%14%
Convert hand line systems to low Convert hand line systems to low pressure systems on alfalfa pressure systems on alfalfa acreageacreage 20%20% 21%21% 14%14% 14%14%
Note: kWh saving vary by state due to differences in pumping lift

slide 18
Northwest PowerPlanning Council
Irrigated Agriculture Irrigated Agriculture Conservation Resource PotentialConservation Resource Potential
0
20
40
60
80
100
120
140
160
180
0 20 40 60 80 100 120 140
Levelized Cost (Mills/ kWh 2000$)
Reso
urc
e P
ote
nti
al
(aM
W)
Cumulative TechnicalPotential (aMW)
Cumulative Cost EffectivePotential (aMW)
slide 19
Northwest PowerPlanning Council
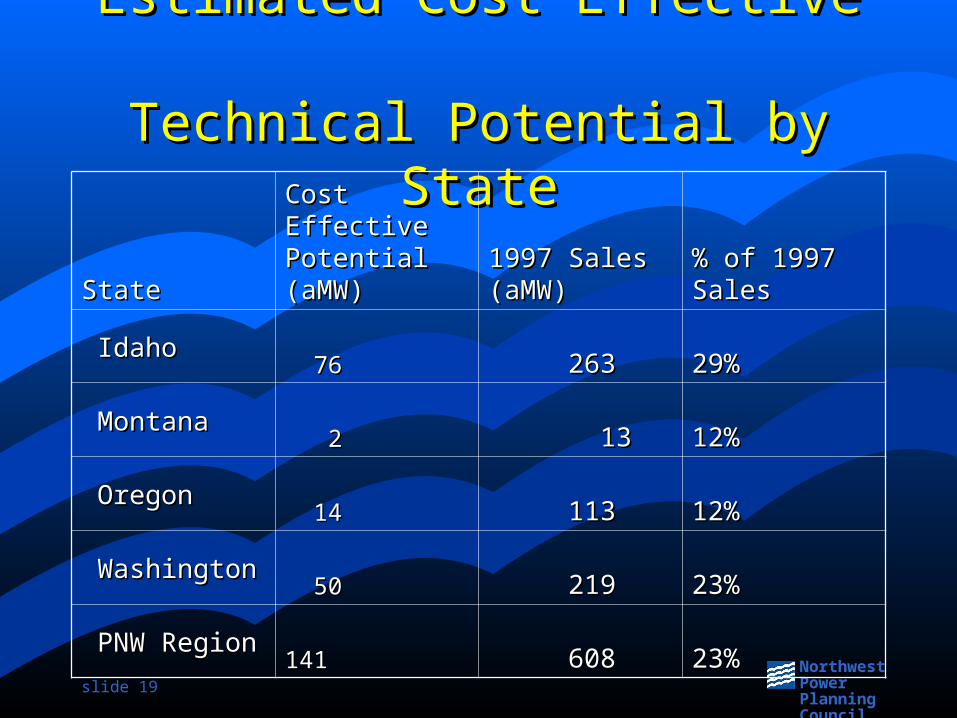
Estimated Cost Effective Estimated Cost Effective Technical Potential by StateTechnical Potential by State
StateState
Cost Effective Cost Effective Potential Potential (aMW)(aMW)
1997 Sales 1997 Sales (aMW)(aMW)
% of 1997 % of 1997 SalesSales
Idaho Idaho 76 76 263 263 29%29%
Montana Montana 2 2 13 13 12%12%
Oregon Oregon 14 14 113 113 12%12%
Washington Washington 50 50 219 219 23%23%
PNW Region PNW Region 141 141 608 608 23%23%

slide 20
Northwest PowerPlanning Council
Resource Potential by Resource Potential by MeasureMeasure
MeasureMeasure Resource Potential (aMW)Resource Potential (aMW)
Pump, Nozzle & Gasket Pump, Nozzle & Gasket Replacement Average WellReplacement Average Well
5555
Pump, Nozzle & Gasket Pump, Nozzle & Gasket Replacement Deep WellReplacement Deep Well
3030
Convert Medium Pressure Center Convert Medium Pressure Center Pivot to Low pressure systemPivot to Low pressure system
2929
Nozzle & Gasket ReplacementNozzle & Gasket Replacement 2020
Convert High Pressure Center Pivot Convert High Pressure Center Pivot to Low pressure systemto Low pressure system
66
Convert hand line systems to low Convert hand line systems to low pressure systems on alfalfa acreagepressure systems on alfalfa acreage
11

slide 21
Northwest PowerPlanning Council
Resource Potential by State and Resource Potential by State and MeasureMeasure
MeasureMeasure Remaining Remaining Technical Potential Technical Potential (aMW)(aMW)
B/C Ratiio B/C Ratiio (TRC)(TRC)
Pump, Nozzle & Gasket Replacement Pump, Nozzle & Gasket Replacement Average Well - IdahoAverage Well - Idaho
2828 1.19 1.19
Pump, Nozzle & Gasket Replacement Pump, Nozzle & Gasket Replacement Deep Well - IdahoDeep Well - Idaho
2121 2.95 2.95
Pump, Nozzle & Gasket Replacement Pump, Nozzle & Gasket Replacement Average Well - WashingtonAverage Well - Washington
1919 1.78 1.78
Convert Medium Pressure Center Pivot Convert Medium Pressure Center Pivot to Low pressure system - Washingtonto Low pressure system - Washington
1414 7.53 7.53
Convert Medium Pressure Center Pivot Convert Medium Pressure Center Pivot to Low pressure system - Idahoto Low pressure system - Idaho
1212 6.26 6.26
Nozzle & Gasket Replacement - IdahoNozzle & Gasket Replacement - Idaho 1111 1.13 1.13