Embed Size (px)
Citation preview
Northern Territory Population ProjectionsInterim – Update (2013 Release)
Northern Territory 2011-41Interim Projections based on the 2011 Census
Department of Treasury and Finance
Date of publication: March 2013.
Suggested citation Northern Territory Department of Treasury and Finance, Northern Territory Population Projections, 2013: Darwin
Website address www.treasury.nt.gov.au/
Acknowledgements:
Northern Territory Department of Treasury and Finance (DTF) acknowledges the expertise of The Northern Institute, Charles Darwin University (CDU) in preparing these projections, especially Dr Andrew Taylor.
2 Northern Territory Population Projections

Department of Treasury and Finance
ContentsIntroduction..............................................................................................................................4
Outputs on the Website............................................................................................................5
How to Use These Projections.................................................................................................7
Overview of Territory Population Growth.................................................................................8
NTPOP Population Projections Model...................................................................................10
Overview of Results...............................................................................................................12
Appendix 1: Alternative Net Interstate Migration Scenarios for the Northern Territory..........22
Appendix 2: Technical Details of the NTPOP Population Projections Model.........................25
Northern Territory Population Projections 3
Department of Treasury and Finance
IntroductionThis report provides an overview of the Northern Territory Population Projections, Interim-Update (2013 Release), incorporating 2011 Census results and covering the years 2011-2041. The report includes the process of development and results.
Population projections outlined in this report were developed using the NTPOP model. The projections are calculations of the future estimates of Northern Territory residents based on historical trends in fertility, mortality and migration. Like the ABS definition of estimated resident population (ERP), the term residents used here excludes people in the Territory whose usual residence is another state or country, for example, fly-in fly-out workers, business visitors and tourists. Accordingly, the projected population does not necessarily represent the service population for Northern Territory Government agencies.
A summary of the projection results is included in this report but for the complete set of projected population numbers, users should refer to the electronic Excel spreadsheets available through the Department of Treasury and Finance (DTF) website at http://www.treasury.nt.gov.au/Economy/Pages/PopulationProjections.aspx.
The projections update the previous report, Northern Territory Population Projections, 2010-2040, to incorporate preliminary data from the 2011 Census and also to update and improve some input assumptions. They are an interim update prior to a more comprehensive revision of the projections, which will follow the release, by the Australian Bureau of Statistics (ABS), of final ERP figures and other demographic data based on the 2011 Census. The projections were developed in collaboration with The Northern Institute at Charles Darwin University.
This report includes information on two sets of population projections:
residents of the whole of the Northern Territory from 2011 to 2041, disaggregated by individual year of age, sex and Indigenous status; and
residents of each of the Greater Darwin region and the Rest of the Northern Territory (NT). These sub-NT level projections are made available for 2011, 2016, 2021 and 2026 and are disaggregated by five-year age groups, sex and Indigenous status.
The Greater Darwin and Rest of NT regions align with the ABS Statistical Area Level 4 regions of Darwin (which includes Darwin City, Darwin Suburbs, Palmerston and Litchfield) and NT – Outback (remainder of the NT).
Population projections are formulated using the cohort-component method and values reflect the consequences of applying certain assumptions about the future direction and levels of fertility, mortality and migration. Therefore, projections should not be interpreted as accurate forecasts or predictions but rather an indication of population change over time, given a set of assumptions. All population projections should be used with caution, in particular, the sub-NT level projections where base input data is less accurate and the migration flows are more complex requiring intra-region, interstate and international migration to be taken into account.
ABS expects to release final ERPs based on the 2011 Census in August 2013. Following release of these results, the main 2011-2041 Census based projections will be produced. The main 2011 Census based release will reconsider all parameter inputs.
4 Northern Territory Population Projections
Department of Treasury and Finance
Outputs on the WebsiteThe detailed projection results are available through the DTF website, http://www.treasury.nt.gov.au/Economy/Pages/PopulationProjections.aspx. A mathematical description of the projection model NTPOP is also provided on the website (Wilson, T, Mathematical details of the NTPOP projection model, School for Social and Policy Research, Charles Darwin University, Darwin).
There are three standard output Excel files for each scenario including:
NTPOP summary, 2011-2041
NTPOP single-year age, 2011-2041
NTPOP 5-year age, 2011-2041
Content of the Output FilesThe summary spreadsheet contains:
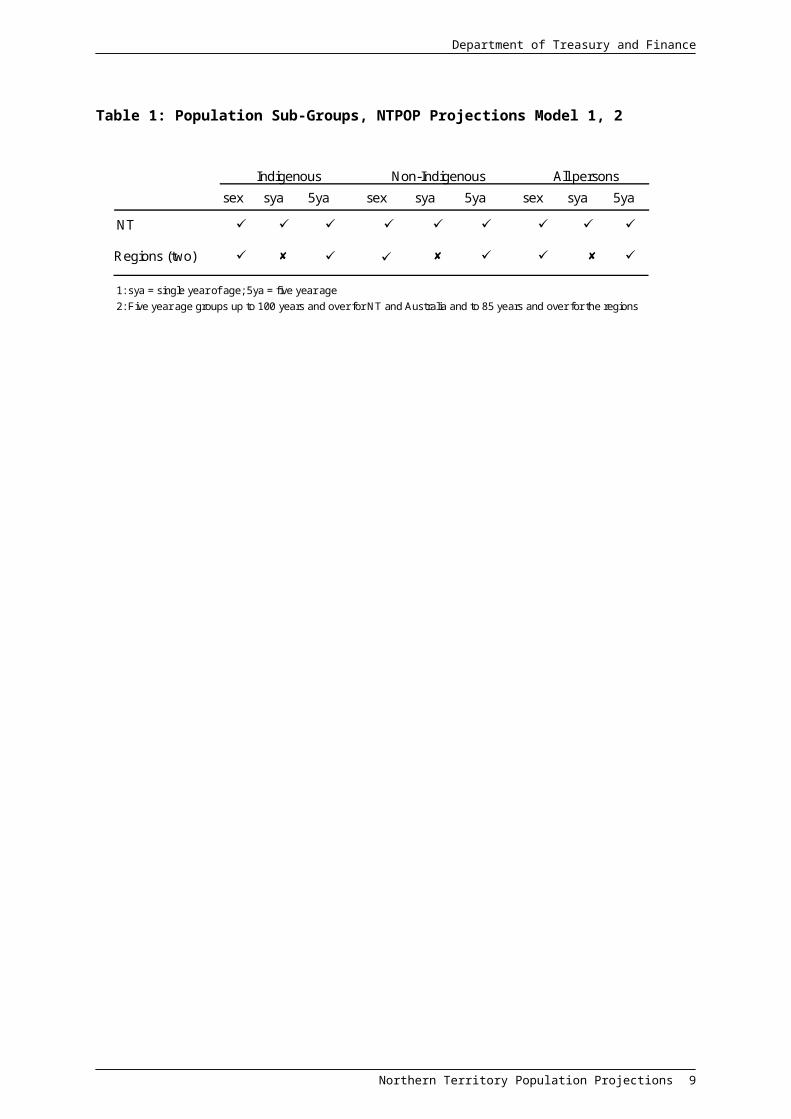
Projection totals (no age or sex breakdowns) for each population sub-group (Table 1) for each year of the projection period to 2041;
projection totals (no age or sex breakdown) for each population sub-group, every five years (2011, 2016, 2021, 2026) for the two regions;
average annual growth rates;
summary population accounts (start population, growth components, end population);
growth indices;
sex ratios; and
median ages for the Territory-wide projections.
The single-year of age projections spreadsheet contains projected numbers for each population sub-group for each year of the projection period by sex and individual year of age, from 0 to 100 years and over. The single-year of age sheet is not available for the regions.
The five-year age groups spreadsheet contains projected numbers for each population sub-group for each year of the projection period by sex and five-year age groups 0-4 years up to 100 years and over for the Territory as a whole and to 85 years and over for the Greater Darwin region and the Rest of the NT.
Previous releases have included alternative projections, which demonstrate the sensitivity of the model to change in the baseline assumptions. For this interim projection, a single scenario (the NT baseline projection) has been produced together with sensitivities in regard to differing migration assumptions (Appendix 1). The next release of projections based on the final 2011 Census estimates will assess impact of changes in assumptions across a broader range of variables though scenario analysis.
Northern Territory Population Projections 5
Department of Treasury and Finance
Table 1: Population Sub-Groups, NTPOP Projections Model 1, 2
sex sya 5ya sex sya 5ya sex sya 5ya
NT Regions (two)
1: sya = single year of age; 5ya = five year age 2: Five year age groups up to 100 years and over for NT and Australia and to 85 years and over for the regions
Indigenous Non-Indigenous All persons
6 Northern Territory Population Projections
Department of Treasury and Finance
How to Use These ProjectionsGuidelines for Northern Territory Government AgenciesPopulation projections should not be interpreted as accurate forecasts or predictions. Projections are the result of applying certain assumptions about the future direction and levels of fertility, mortality and migration to a base population, in this case 2011 population estimates (see Taylor, 2011 for a discussion of these issues in the context of places like the Northern Territory1).
Users of these projections should exercise caution when using them in decision-making. The following guidelines are not intended to be fully prescriptive, and agency staff are encouraged to contact DTF with any questions regarding the appropriate use of projections. In general, NTG agencies should use the projections for:
work relating to internal Territory issues; and
work that will be used in official documents circulated to other agencies.
Uncertainty in ProjectionsPopulation projections are not predictions of the future size and composition of the Territory’s population. Rather, they are calculations of what the population will be at future times given specific assumptions about the components of population growth between the base year for the projections and any future year. The degree to which projections coincide with actual future growth will ultimately depend on the extent to which the assumptions about future growth turn out to be correct.
The accuracy of the projections also depends on the accuracy of the initial population estimates used as the foundation for the projections. These population projections are based on preliminary ERPs for the Territory and Australia and preliminary Aboriginal and Torres Strait Islander population estimates as at 30 June 2011. Both are provided by the ABS in 3101.0 Australian Demographic Statistics, June 2012. These estimates are based on preliminary 2011 Census data and are used to derive the jump-off (or starting populations) for the projections by age, sex and Indigenous status. These estimates are subject to change until finalised by the ABS in August 2013. This uncertainty should be factored in when users are considering the likely accuracy of future projections.
The release of the final figures based on 2011 Census will occur in mid 2013 and at that time the ERPs from 1991 to 2011 will be revised to align with the 2011 estimate. This realignment adjusts for intercensal error, which arises from errors in the estimates of the population in current and previous Censuses and errors in the estimates of any of the components of population change (births, deaths and migration) since the previous Census. For further information on intercensal error and its treatment, users are referred to feature articles in ABS publications 3101.0 Australian Demographic Statistics, Dec 2011 and 3101.0 Australian Demographic Statistics, March 2012 available on the ABS website (http://www.abs.gov.au/). Users should consider all sources of uncertainty when using these projections.
1 Taylor, A. (2011). The Forecasting of Remote Area Populations: Numbers Aren't Everything, In D. Carson, R. Rasmussen, P. C. Ensign, A. Taylor and L. Huskey (Eds). Demography at the Edge: Remote human populations in developed nations. Farnham, England: Ashgate Publishing, 39-52.
Northern Territory Population Projections 7

Department of Treasury and Finance
Overview of Territory Population GrowthPopulation growth in the Territory is significantly more volatile than Australian population growth, largely reflecting the impact of major projects on the Territory’s interstate and overseas migration. Nationally, population growth is influenced by changing fertility and mortality patterns over time and changes to Commonwealth policy on the international migration intake program and visa applications. Population growth is also influenced by living conditions and employment opportunities in Australia compared with those abroad.
Over the long term, the Territory’s population growth has been predominately driven by natural increase (births less deaths). The contribution of natural increase to the Territory’s annual population growth is about double that of the national percentage contribution.
The Territory’s fertility rate is influenced by the age distribution of non-Indigenous women, which favours the child-bearing ages by comparison with other jurisdictions. As at June 2011, 56.2 per cent of non-Indigenous women in the Territory were aged 15 to 49 years, compared with 48.5 per cent nationally. High fertility rates among Territory Indigenous women also influences the Territory’s fertility rate.
Territorians have a lower life expectancy than people in other jurisdictions, reflecting high mortality rates in the Territory’s Indigenous population, largely the result of a high prevalence and early onset of chronic disease. Non-Indigenous life expectancy is also lower than those in other jurisdictions due to the higher proportion of the population in the younger age groups, who typically partake in more risky behaviours. Despite a lower life expectancy, the Territory’s population experiences a relatively low crude death rate (deaths per 1000 persons) because of its young age profile.
Although more variable than the rate of natural increase, net overseas migration has been a relatively stable positive contributor to the Territory’s annual population growth. Net overseas migration has increased in recent years, reflecting increased labour demand as a result of the resources boom and skills shortages, particularly for trades and technical workers and specialists in the mining and construction sectors. Net overseas migration in the Territory, is largely driven by demand for labour for major projects and is also heavily influenced by changes to Commonwealth migration intake policies.
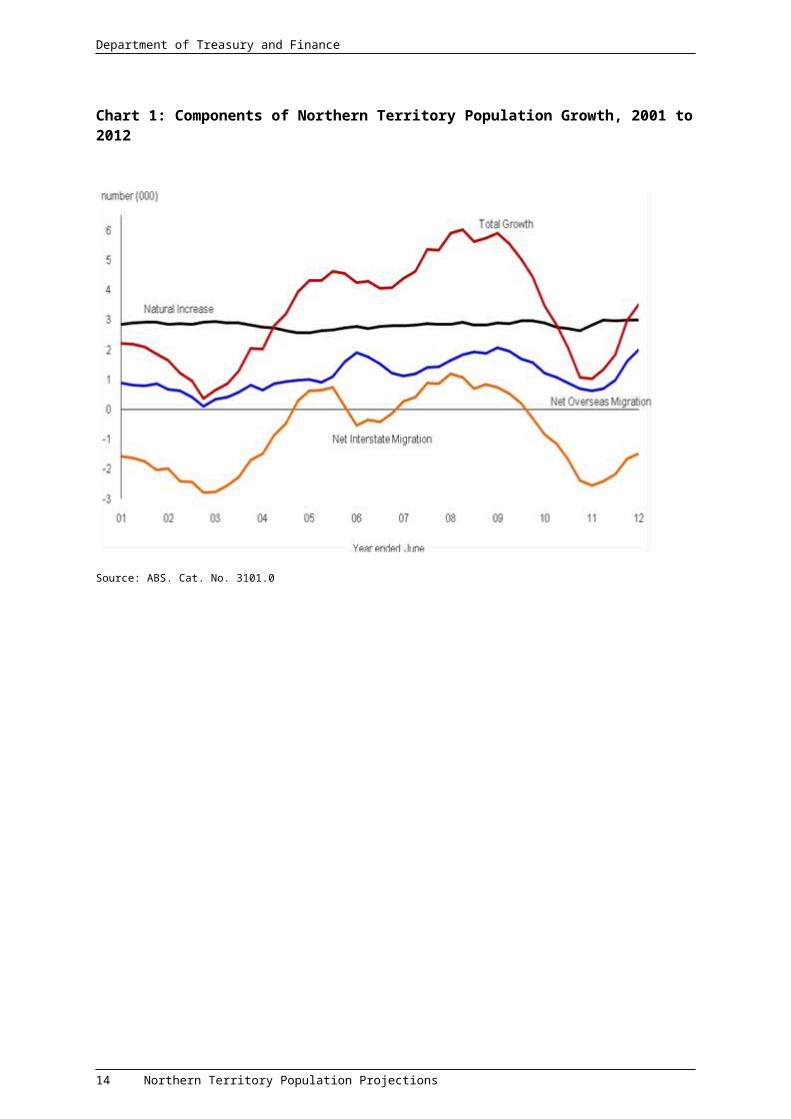
Significant fluctuations in the Territory’s annual population growth rate are largely due to variations in interstate migration (Chart 1). The Territory experiences very large interstate flows of people both into and out of the Territory, with about 7 per cent of the Territory’s population going interstate each year and a similar number arrives from interstate. The net annual figure is volatile and has fluctuated from negative 2768 to positive 1754 over the last 20 years. However, interstate migration in the Territory has typically been a detractor from growth, with positive interstate migration occurring for short periods of time, in response to increased labour demand during the construction phase of major projects.
Although high rates of natural increase drive growth in both the Territory’s Indigenous and non-Indigenous populations, variations in the Territory’s annual population growth rates are largely a consequence of the non-Indigenous population, through interstate and, to a lesser extent, overseas migration. The Territory’s Indigenous population, while highly mobile, typically moves intrastate and experiences significantly lower rates of net interstate and overseas migration. As a consequence, population growth of the Indigenous population is significantly more stable and almost exclusively a consequence of natural increase.
8 Northern Territory Population Projections
Department of Treasury and Finance
Chart 1: Components of Northern Territory Population Growth, 2001 to 2012
Source: ABS. Cat. No. 3101.0
Northern Territory Population Projections 9
Department of Treasury and Finance
NTPOP Population Projections ModelDevelopmentThe Northern Territory population projections were developed in response to a long-standing need within the Northern Territory Government (NTG) to better understand the drivers of, and likely future trends for the Indigenous and non-Indigenous Territory populations. Although the ABS produces a range of projections series after each Census (for Australia, the States and Territories, and the capital city/balance of State level), these projections do not take into account the different growth patterns in the Indigenous and non-Indigenous populations. This is a significant issue for the Territory, with the Indigenous population accounting for about 30 per cent of the population.
In addition, population denominators underpin important socio-economic rates and performance indicators. As such, population-specific denominators are required in order to properly plan for the very different and separate needs of the Indigenous and non-Indigenous populations. In addition, NTG agencies have a need for sub-Territory level projections, which the ABS projections do not provide.
The process of developing population projections was approved by the NTG in December 2007. Agencies are required to use the NTG projections unless another approach was warranted and can be justified. Annual reviews of the projections are conducted with updates where necessary, with a major review and re-release of population projections conducted every five years following the release of the Census.
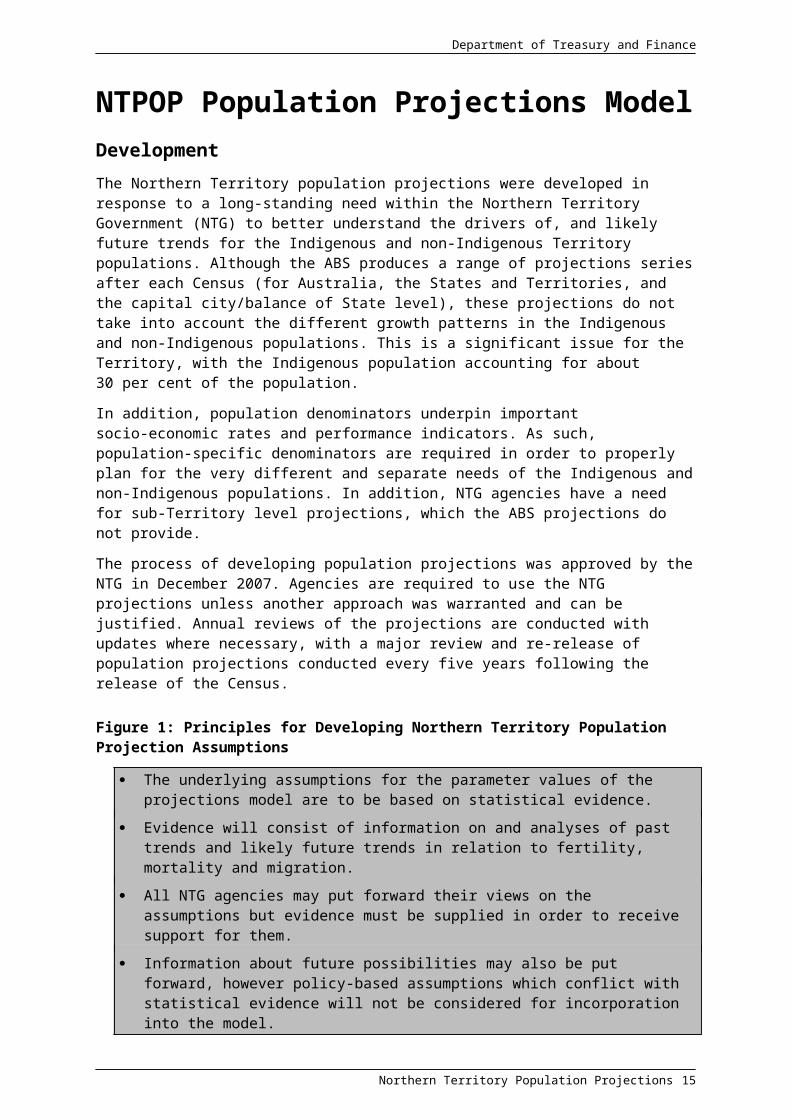
Figure 1: Principles for Developing Northern Territory Population Projection Assumptions
The underlying assumptions for the parameter values of the projections model are to be based on statistical evidence.
Evidence will consist of information on and analyses of past trends and likely future trends in relation to fertility, mortality and migration.
All NTG agencies may put forward their views on the assumptions but evidence must be supplied in order to receive support for them.
Information about future possibilities may also be put forward, however policy-based assumptions which conflict with statistical evidence will not be considered for incorporation into the model.
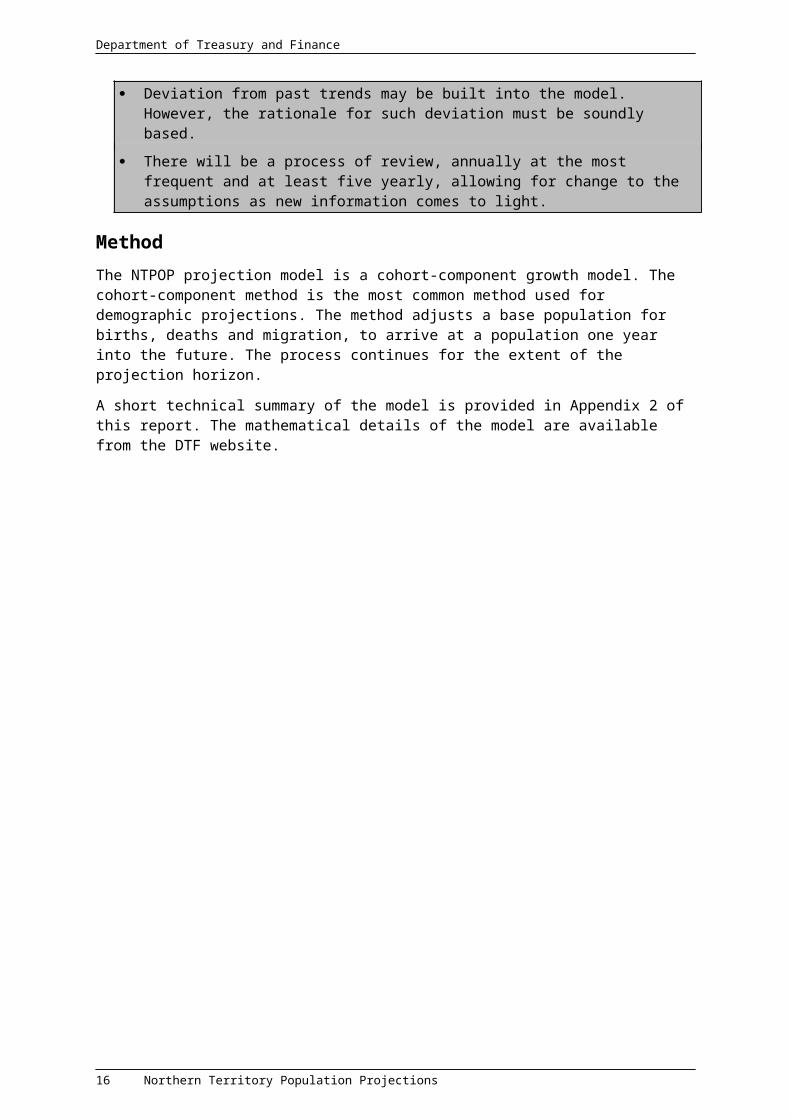
Deviation from past trends may be built into the model. However, the rationale for such deviation must be soundly based.
There will be a process of review, annually at the most frequent and at least five yearly, allowing for change to the assumptions as new information comes to light.
MethodThe NTPOP projection model is a cohort-component growth model. The cohort-component method is the most common method used for demographic projections. The method adjusts a base population for births, deaths and migration, to arrive at a population one year into the future. The process continues for the extent of the projection horizon.
A short technical summary of the model is provided in Appendix 2 of this report. The mathematical details of the model are available from the DTF website.
10 Northern Territory Population Projections
Department of Treasury and Finance
OutputsPrevious releases have included alternative projections, which demonstrate the sensitivity of the model to change in the baseline assumptions. For this interim projection, a single scenario (the NT baseline projection) has been produced. However, to demonstrate the influence of migration on the projections, various migration scenarios have been developed by assuming different levels of constant annual net migration and holding all other parameters fixed. The next release of projections based on the final 2011 Census estimates will also assess impact of changes in key assumptions though scenario analysis.
The NTPOP model also has the capacity to run other user-defined scenarios if users need to explore other population futures that incorporate different parameter values for the growth components. Users wishing to explore different scenarios should discuss their needs with DTF.
AssumptionsThe NTG projections baseline scenario uses input parameters based on recent to medium-term historical averages and trends and assumes that these trends will continue into the future. No adjustments are made to reflect policy choice or the impact of specific projects. These issues will only influence population projections through their impact on historical averages and trends on the components of population change (births, deaths and migration).
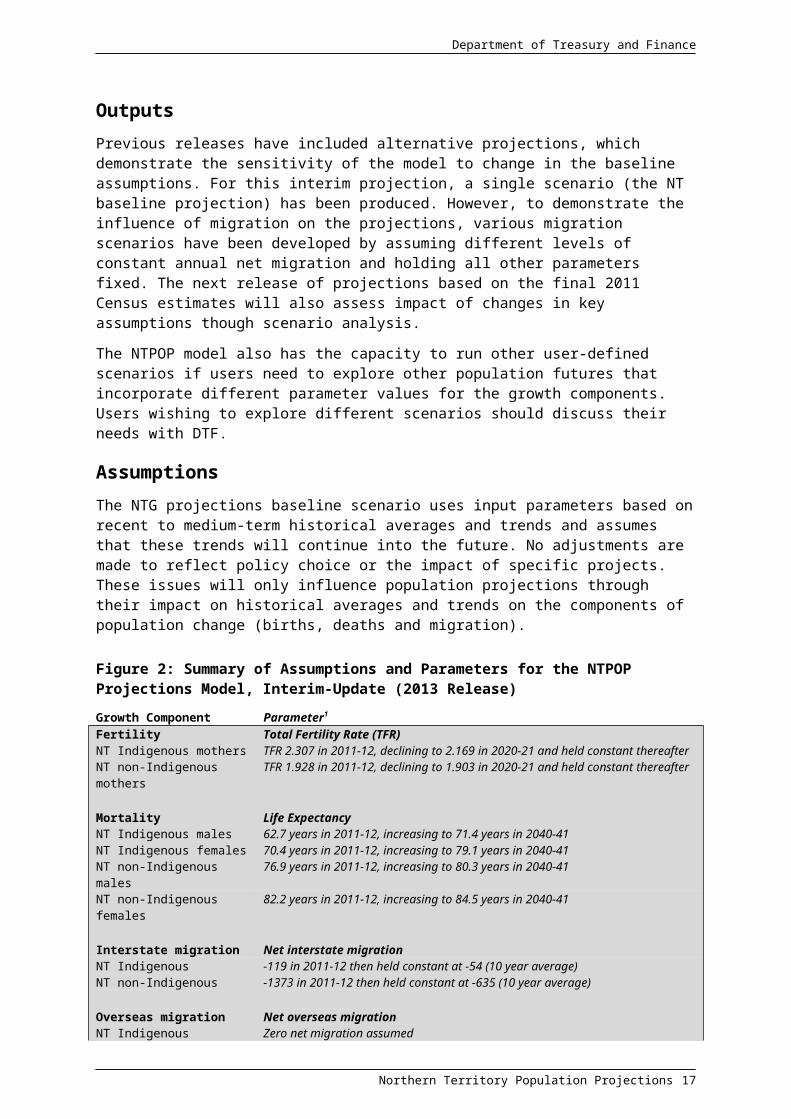
Figure 2: Summary of Assumptions and Parameters for the NTPOP Projections Model, Interim-Update (2013 Release)Growth Component Parameter1
Fertility Total Fertility Rate (TFR)NT Indigenous mothers TFR 2.307 in 2011-12, declining to 2.169 in 2020-21 and held constant thereafterNT non-Indigenous mothers TFR 1.928 in 2011-12, declining to 1.903 in 2020-21 and held constant thereafter
Mortality Life ExpectancyNT Indigenous males 62.7 years in 2011-12, increasing to 71.4 years in 2040-41NT Indigenous females 70.4 years in 2011-12, increasing to 79.1 years in 2040-41NT non-Indigenous males 76.9 years in 2011-12, increasing to 80.3 years in 2040-41NT non-Indigenous females 82.2 years in 2011-12, increasing to 84.5 years in 2040-41
Interstate migration Net interstate migrationNT Indigenous -119 in 2011-12 then held constant at -54 (10 year average)NT non-Indigenous -1373 in 2011-12 then held constant at -635 (10 year average)
Overseas migration Net overseas migrationNT Indigenous Zero net migration assumedNT non-Indigenous 2004 in 2011-12 then held constant at 1287 (10 year average)
1: Regional projections fertility and mortality assumptions are the same as for the total Territory; migration varies between the regions and is based on movements recorded between Censuses.
Northern Territory Population Projections 11
Department of Treasury and Finance
Overview of ResultsPlease see http://www.treasury.nt.gov.au/Economy/Pages/PopulationProjections.aspx for the complete set of projection numbers, available in Excel spreadsheets.
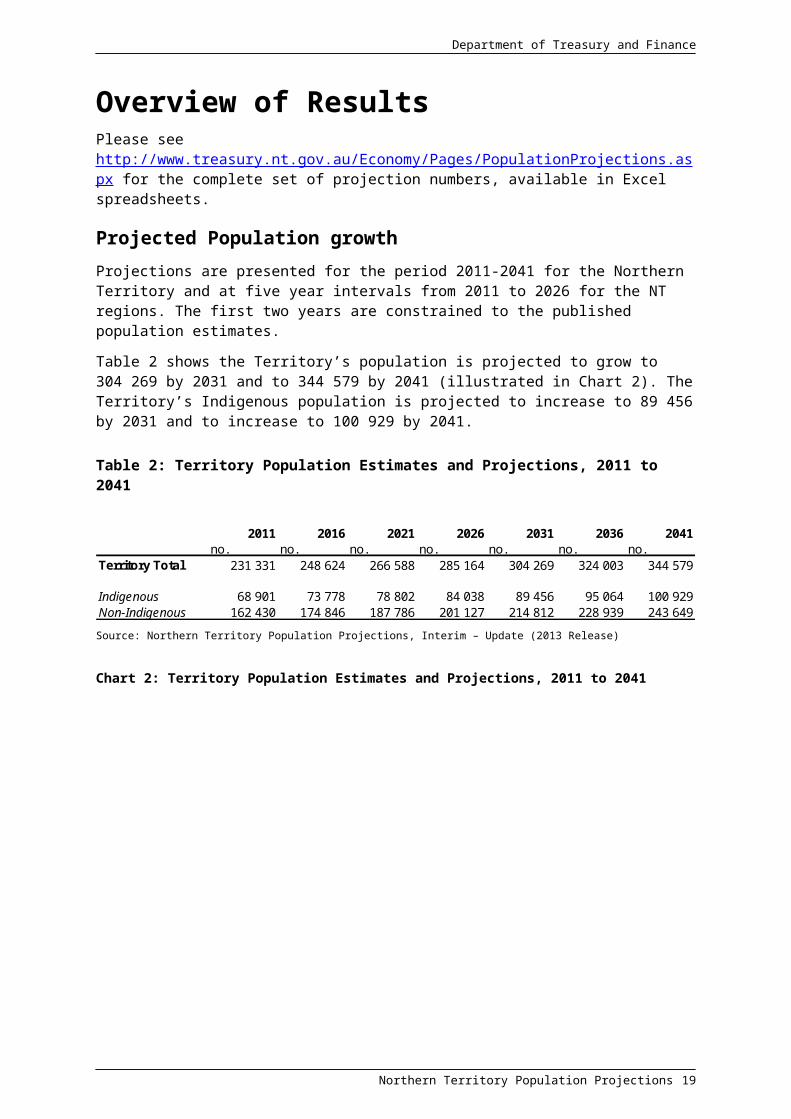
Projected Population growthProjections are presented for the period 2011-2041 for the Northern Territory and at five year intervals from 2011 to 2026 for the NT regions. The first two years are constrained to the published population estimates.
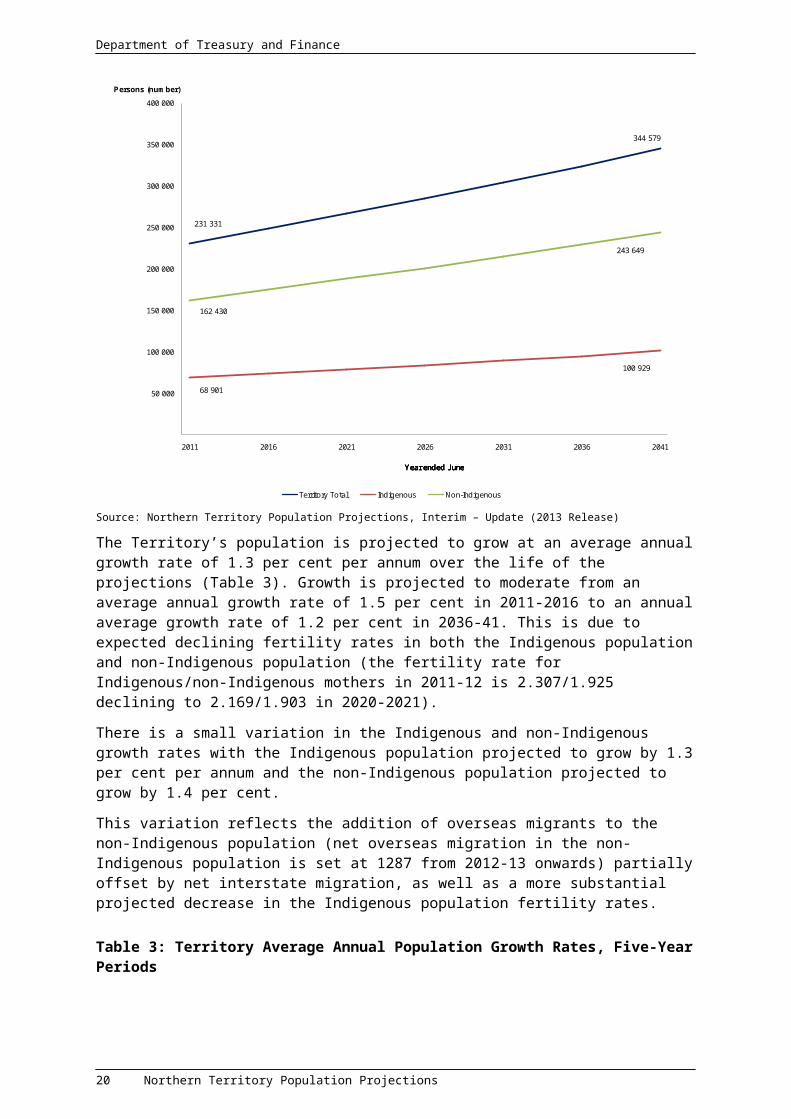
Table 2 shows the Territory’s population is projected to grow to 304 269 by 2031 and to 344 579 by 2041 (illustrated in Chart 2). The Territory’s Indigenous population is projected to increase to 89 456 by 2031 and to increase to 100 929 by 2041.
Table 2: Territory Population Estimates and Projections, 2011 to 2041
2011 2016 2021 2026 2031 2036 2041
no. no. no. no. no. no. no.Territory Total 231 331 248 624 266 588 285 164 304 269 324 003 344 579
Indigenous 68 901 73 778 78 802 84 038 89 456 95 064 100 929Non-Indigenous 162 430 174 846 187 786 201 127 214 812 228 939 243 649
Source: Northern Territory Population Projections, Interim – Update (2013 Release)
Chart 2: Territory Population Estimates and Projections, 2011 to 2041
344 579
50 000
100 000
150 000
200 000
250 000
300 000
350 000
400 000
2011 2016 2021 2026 2031 2036 2041
Persons (number)
Territory Total Indigenous Non-Indigenous
Year ended JuneYear ended JuneYear ended JuneYear ended June
231 331
162 430
243 649
68 901
100 929
Source: Northern Territory Population Projections, Interim – Update (2013 Release)
The Territory’s population is projected to grow at an average annual growth rate of 1.3 per cent per annum over the life of the projections (Table 3). Growth is projected to moderate from an average annual growth rate of 1.5 per cent in 2011-2016 to an annual
12 Northern Territory Population Projections
Department of Treasury and Finance
average growth rate of 1.2 per cent in 2036-41. This is due to expected declining fertility rates in both the Indigenous population and non-Indigenous population (the fertility rate for Indigenous/non-Indigenous mothers in 2011-12 is 2.307/1.925 declining to 2.169/1.903 in 2020-2021).
There is a small variation in the Indigenous and non-Indigenous growth rates with the Indigenous population projected to grow by 1.3 per cent per annum and the non-Indigenous population projected to grow by 1.4 per cent.
This variation reflects the addition of overseas migrants to the non-Indigenous population (net overseas migration in the non-Indigenous population is set at 1287 from 2012-13 onwards) partially offset by net interstate migration, as well as a more substantial projected decrease in the Indigenous population fertility rates.
Table 3: Territory Average Annual Population Growth Rates, Five-Year Periods
2011-16 2016-21 2021-26 2026-31 2031-36 2036-41
Average annual
growth rate 2011-41
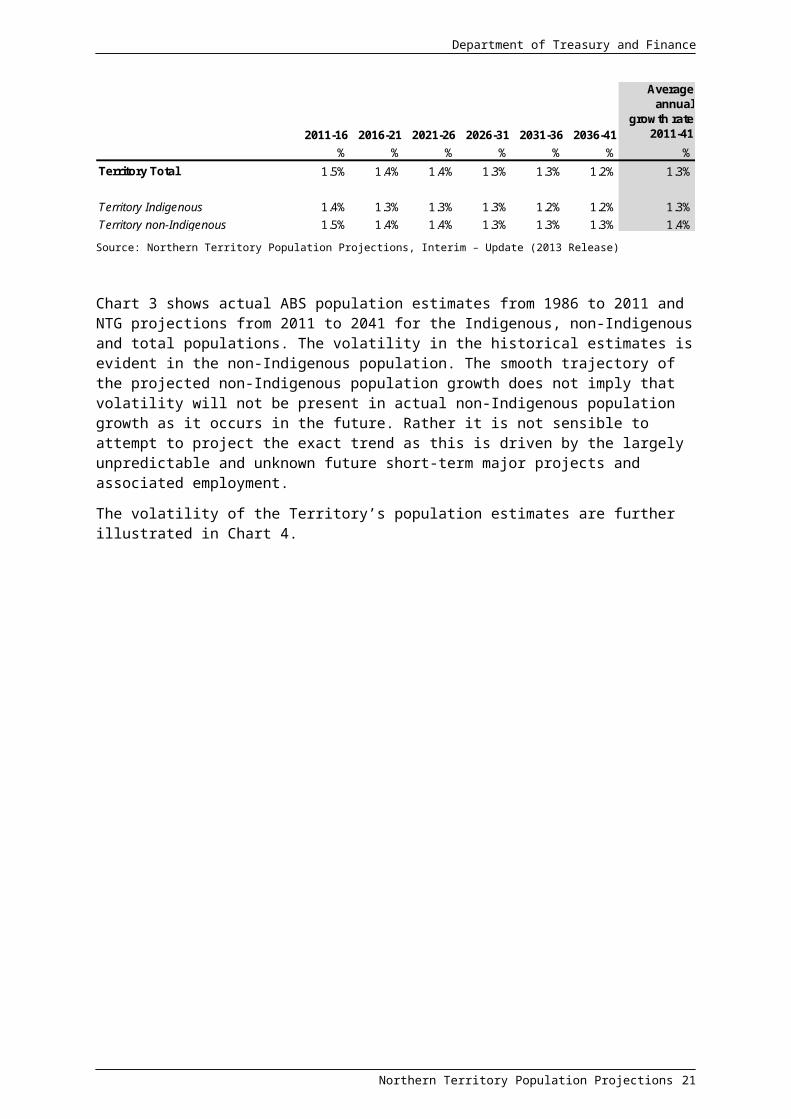
% % % % % % %Territory Total 1.5% 1.4% 1.4% 1.3% 1.3% 1.2% 1.3%
Territory Indigenous 1.4% 1.3% 1.3% 1.3% 1.2% 1.2% 1.3%Territory non-Indigenous 1.5% 1.4% 1.4% 1.3% 1.3% 1.3% 1.4%
Source: Northern Territory Population Projections, Interim – Update (2013 Release)
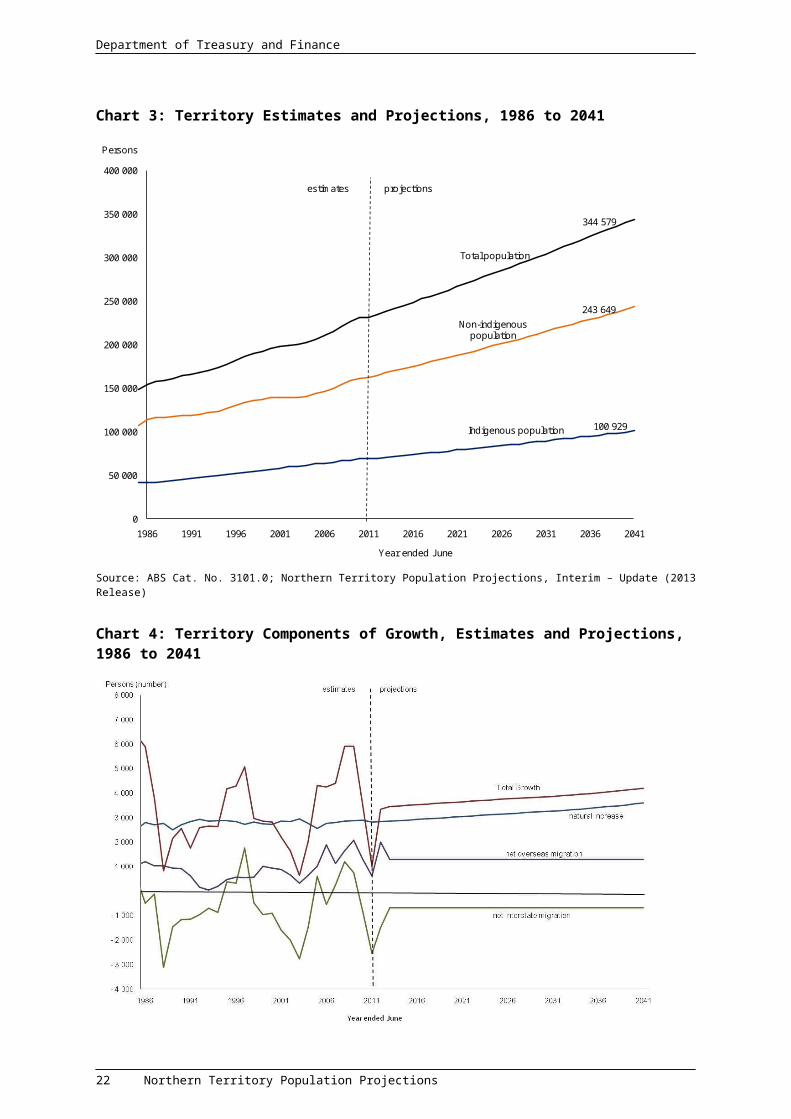
Chart 3 shows actual ABS population estimates from 1986 to 2011 and NTG projections from 2011 to 2041 for the Indigenous, non-Indigenous and total populations. The volatility in the historical estimates is evident in the non-Indigenous population. The smooth trajectory of the projected non-Indigenous population growth does not imply that volatility will not be present in actual non-Indigenous population growth as it occurs in the future. Rather it is not sensible to attempt to project the exact trend as this is driven by the largely unpredictable and unknown future short-term major projects and associated employment.
The volatility of the Territory’s population estimates are further illustrated in Chart 4.
Northern Territory Population Projections 13
Department of Treasury and Finance
Chart 3: Territory Estimates and Projections, 1986 to 2041
0
50 000
100 000
150 000
200 000
250 000
300 000
350 000
400 000
1986 1991 1996 2001 2006 2011 2016 2021 2026 2031 2036 2041
estimates projections
Total population
Non-indigenous population
Indigenous population
Persons
Year ended June
243 649
100 929
344 579
Source: ABS Cat. No. 3101.0; Northern Territory Population Projections, Interim – Update (2013 Release)
Chart 4: Territory Components of Growth, Estimates and Projections, 1986 to 2041
Source: ABS Cat. No. 3101.0; Northern Territory Population Projections, Interim – Update (2013 Release)
14 Northern Territory Population Projections
Department of Treasury and Finance
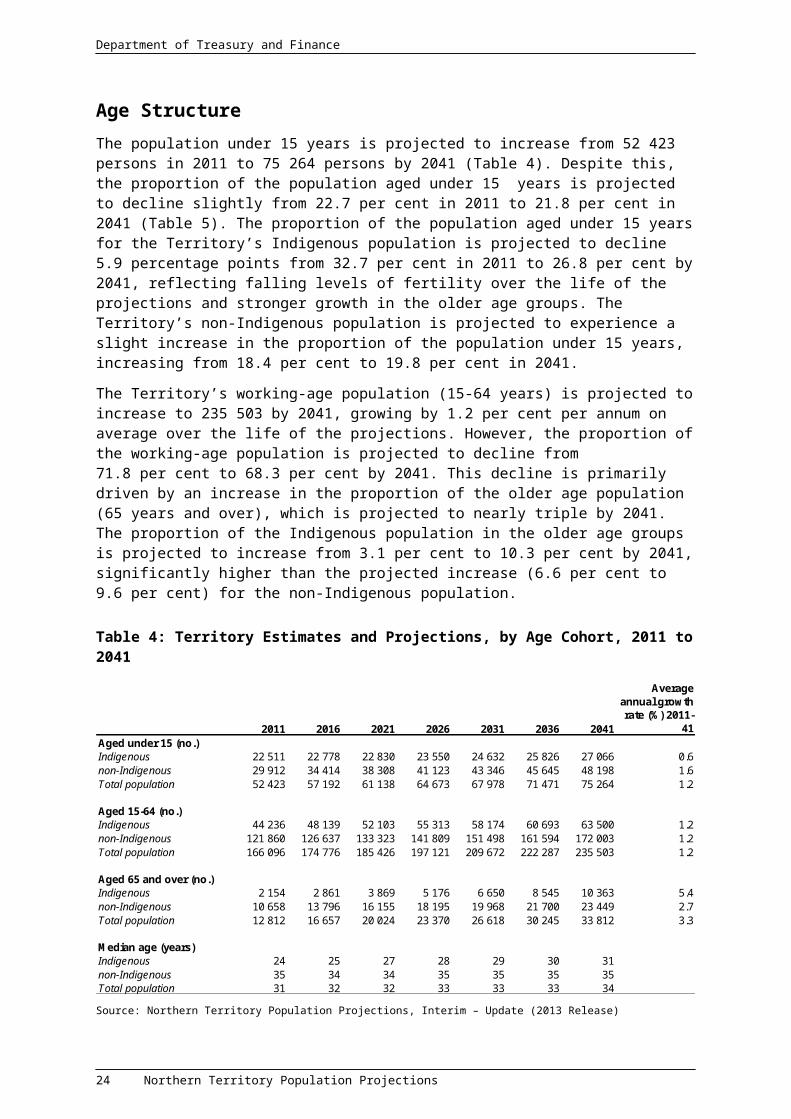
Age StructureThe population under 15 years is projected to increase from 52 423 persons in 2011 to 75 264 persons by 2041 (Table 4). Despite this, the proportion of the population aged under 15 years is projected to decline slightly from 22.7 per cent in 2011 to 21.8 per cent in 2041 (Table 5). The proportion of the population aged under 15 years for the Territory’s Indigenous population is projected to decline 5.9 percentage points from 32.7 per cent in 2011 to 26.8 per cent by 2041, reflecting falling levels of fertility over the life of the projections and stronger growth in the older age groups. The Territory’s non-Indigenous population is projected to experience a slight increase in the proportion of the population under 15 years, increasing from 18.4 per cent to 19.8 per cent in 2041.
The Territory’s working-age population (15-64 years) is projected to increase to 235 503 by 2041, growing by 1.2 per cent per annum on average over the life of the projections. However, the proportion of the working-age population is projected to decline from 71.8 per cent to 68.3 per cent by 2041. This decline is primarily driven by an increase in the proportion of the older age population (65 years and over), which is projected to nearly triple by 2041. The proportion of the Indigenous population in the older age groups is projected to increase from 3.1 per cent to 10.3 per cent by 2041, significantly higher than the projected increase (6.6 per cent to 9.6 per cent) for the non-Indigenous population.
Table 4: Territory Estimates and Projections, by Age Cohort, 2011 to 2041
2011 2016 2021 2026 2031 2036 2041
Average annual growth rate (%) 2011-
41Aged under 15 (no.)Indigenous 22 511 22 778 22 830 23 550 24 632 25 826 27 066 0.6non-Indigenous 29 912 34 414 38 308 41 123 43 346 45 645 48 198 1.6Total population 52 423 57 192 61 138 64 673 67 978 71 471 75 264 1.2
Aged 15-64 (no.)Indigenous 44 236 48 139 52 103 55 313 58 174 60 693 63 500 1.2non-Indigenous 121 860 126 637 133 323 141 809 151 498 161 594 172 003 1.2Total population 166 096 174 776 185 426 197 121 209 672 222 287 235 503 1.2
Aged 65 and over (no.)Indigenous 2 154 2 861 3 869 5 176 6 650 8 545 10 363 5.4non-Indigenous 10 658 13 796 16 155 18 195 19 968 21 700 23 449 2.7Total population 12 812 16 657 20 024 23 370 26 618 30 245 33 812 3.3
Median age (years)Indigenous 24 25 27 28 29 30 31non-Indigenous 35 34 34 35 35 35 35Total population 31 32 32 33 33 33 34
Source: Northern Territory Population Projections, Interim – Update (2013 Release)
Northern Territory Population Projections 15
Department of Treasury and Finance
Table 5: Percentage by Age Cohort, 2011 to 2041
2011 2016 2021 2026 2031 2036 2041Aged under 15 years % % % % % % %Indigenous 32.7% 30.9% 29.0% 28.0% 27.5% 27.2% 26.8%non-Indigenous 18.4% 19.7% 20.4% 20.4% 20.2% 19.9% 19.8%Total population 22.7% 23.0% 22.9% 22.7% 22.3% 22.1% 21.8%
Aged 15-64 yearsIndigenous 64.2% 65.2% 66.1% 65.8% 65.0% 63.8% 62.9%non-Indigenous 75.0% 72.4% 71.0% 70.5% 70.5% 70.6% 70.6%Total population 71.8% 70.3% 69.6% 69.1% 68.9% 68.6% 68.3%
Aged 65 years and over Indigenous 3.1% 3.9% 4.9% 6.2% 7.4% 9.0% 10.3%non-Indigenous 6.6% 7.9% 8.6% 9.0% 9.3% 9.5% 9.6%Total population 5.5% 6.7% 7.5% 8.2% 8.7% 9.3% 9.8%
Source: ABS Cat. No. 3238.0; Northern Territory Population Projections, Interim - Update (2013 Release)
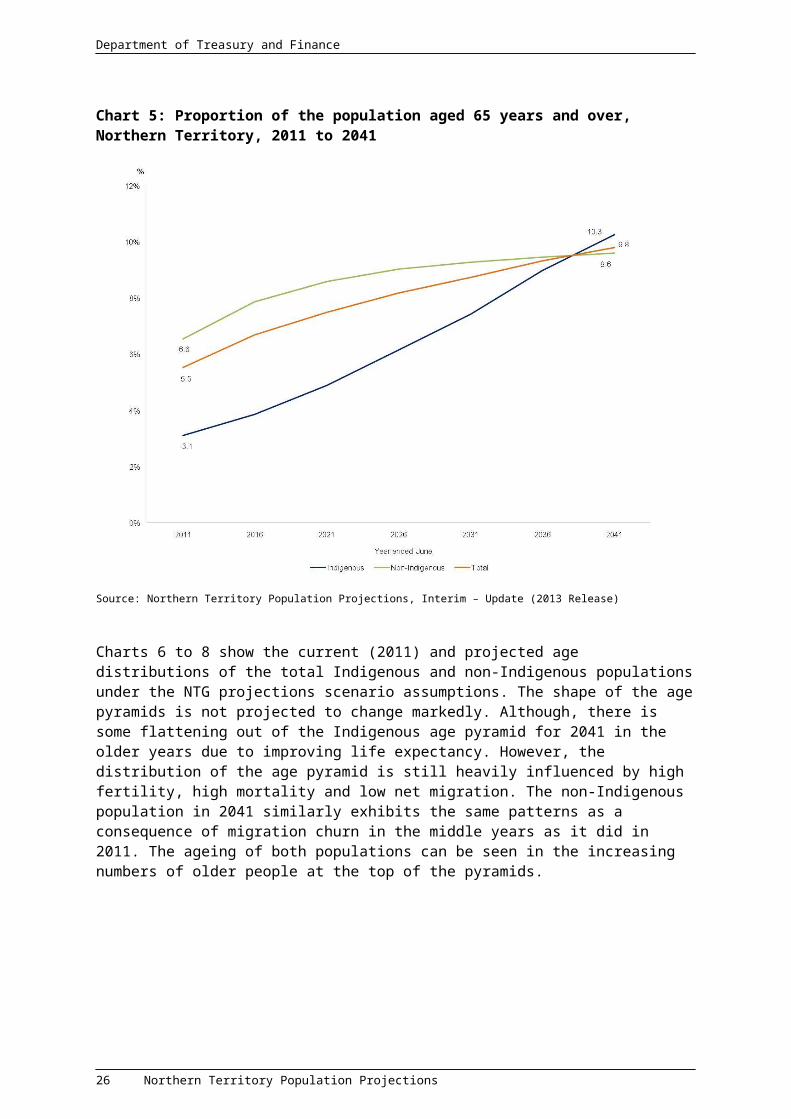
By 2041, the proportion of the Indigenous population aged over 65 years is projected to be greater than the non-Indigenous population (Chart 5). This is primarily driven by out migration of older non-Indigenous people assisted by improvements in Indigenous life expectancy, which is projected to increase from 62.4 years to 71.4 years for Indigenous males and from 70.1 years to 79.1 years for Indigenous females (Table 6).
Table 6: Life expectancy at birth, NTG projections, Northern Territory
2011years
2021years
2031years
2041years
Change 2011-41
yearsIndigenous males 62.4 65.4 68.4 71.4 9.0Indigenous females 70.1 73.1 76.1 79.1 9.0Non-Indigenous males 76.6 78.5 79.5 80.3 3.7Non-Indigenous females 81.9 83.4 84.1 84.5 2.6
Source: ABS Cat. No. 3238.0; CDU and DTF
16 Northern Territory Population Projections
Department of Treasury and Finance
Chart 5: Proportion of the population aged 65 years and over, Northern Territory, 2011 to 2041
Source: Northern Territory Population Projections, Interim – Update (2013 Release)
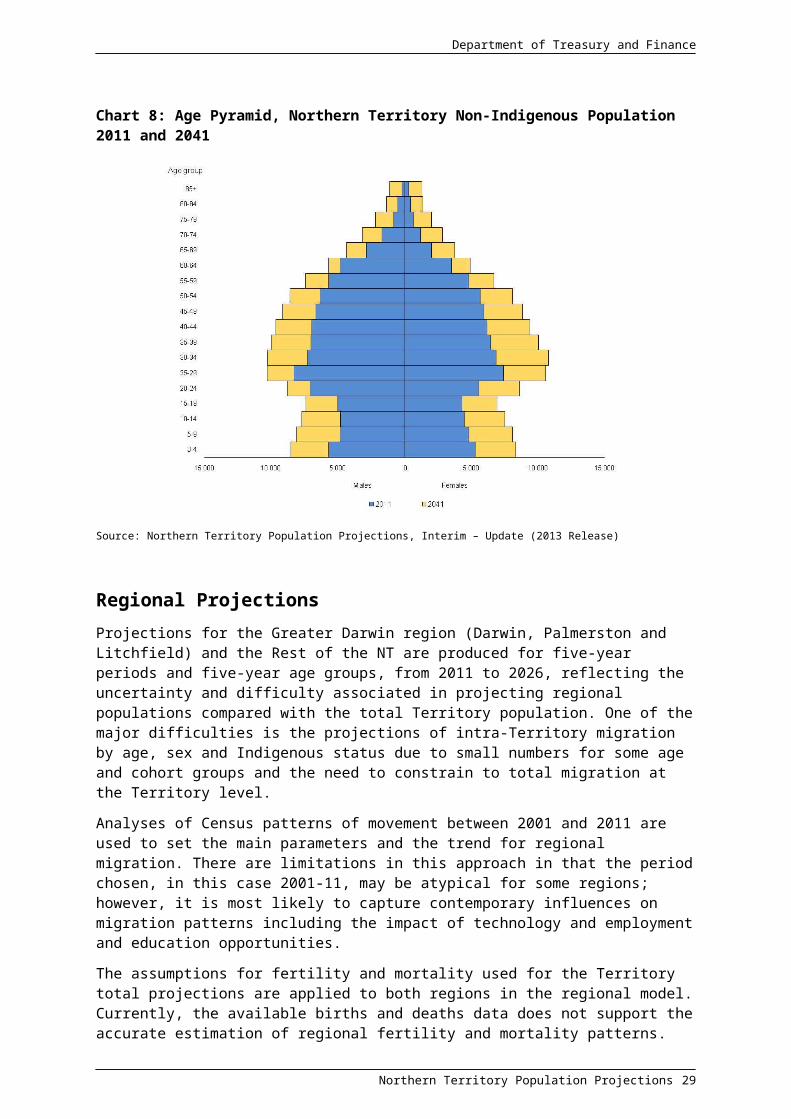
Charts 6 to 8 show the current (2011) and projected age distributions of the total Indigenous and non-Indigenous populations under the NTG projections scenario assumptions. The shape of the age pyramids is not projected to change markedly. Although, there is some flattening out of the Indigenous age pyramid for 2041 in the older years due to improving life expectancy. However, the distribution of the age pyramid is still heavily influenced by high fertility, high mortality and low net migration. The non-Indigenous population in 2041 similarly exhibits the same patterns as a consequence of migration churn in the middle years as it did in 2011. The ageing of both populations can be seen in the increasing numbers of older people at the top of the pyramids.
Northern Territory Population Projections 17
Department of Treasury and Finance
Chart 6: Age Pyramid, Northern Territory, Age group 2011 and 2041
Source: Northern Territory Population Projections, Interim – Update (2013 Release)
Chart 7: Age Pyramid, Northern Territory Indigenous Population 2011 and 2041
Source: Northern Territory Population Projections, Interim – Update (2013 Release)
18 Northern Territory Population Projections
Department of Treasury and Finance
Chart 8: Age Pyramid, Northern Territory Non-Indigenous Population 2011 and 2041
Source: Northern Territory Population Projections, Interim – Update (2013 Release)
Regional ProjectionsProjections for the Greater Darwin region (Darwin, Palmerston and Litchfield) and the Rest of the NT are produced for five-year periods and five-year age groups, from 2011 to 2026, reflecting the uncertainty and difficulty associated in projecting regional populations compared with the total Territory population. One of the major difficulties is the projections of intra-Territory migration by age, sex and Indigenous status due to small numbers for some age and cohort groups and the need to constrain to total migration at the Territory level.
Analyses of Census patterns of movement between 2001 and 2011 are used to set the main parameters and the trend for regional migration. There are limitations in this approach in that the period chosen, in this case 2001-11, may be atypical for some regions; however, it is most likely to capture contemporary influences on migration patterns including the impact of technology and employment and education opportunities.
The assumptions for fertility and mortality used for the Territory total projections are applied to both regions in the regional model. Currently, the available births and deaths data does not support the accurate estimation of regional fertility and mortality patterns.
The results from the regional projections model (Table 7) show the population of the Greater Darwin region is projected to increase to 164 916 persons by 2026. The share of the Territory’s population living in the Greater Darwin region is projected to gradually increase from 56 per cent to 58 per cent in 2026 with corresponding gradual declines in the Rest of NT.
The Greater Darwin region is projected to increase by an average of 1.7 per cent per annum in the five years to 2016, before decreasing to 1.4 per cent per annum on average between 2021 and 2026. Growth in the Rest of NT is projected to increase from 1.1 per cent in 2011-16 to 1.2 per cent in 2021-26. The projected growth rate for Greater Darwin is higher than for the rest of NT throughout the projection period despite a small decline in the Greater
Northern Territory Population Projections 19
Department of Treasury and Finance
Darwin projected growth rate and a corresponding small increase in the projected growth rate of Rest of NT. This convergence of projected growth rates appears to be associated with slight differences in the relative net numbers of non-Indigenous females of child bearing ages migrating to the two NT regions.
The Indigenous population in the Greater Darwin region is projected to grow more strongly than the non-Indigenous population, although from a lower base, mainly due to the impact of net intrastate Indigenous migration to Greater Darwin from the rest of NT.
Table 7: Estimates and Projections and Average Annual Growth Rates (5-Year Periods)
2011 2016 2021 2026 2011-16 2016-21 2021-26no. no. no. no. % % %
Greater Darwin RegionIndigenous 13 742 15 488 17 461 19 652 2.4 2.4 2.4non-Indigenous 116 843 126 455 135 957 145 264 1.6 1.4 1.3Total population 130 585 141 943 153 419 164 916 1.7 1.6 1.4Share of total Territory population (%) 0.56 0.57 0.58 0.58
Rest of NTIndigenous 55 159 58 286 61 332 64 373 1.1 1.0 1.0non-Indigenous 45 587 48 395 51 837 55 875 1.2 1.4 1.5Total population 100 746 106 681 113 169 120 248 1.1 1.2 1.2Share of total Territory population (%) 0.44 0.43 0.42 0.42
Source: Northern Territory Population Projections, Interim – Update (2013 Release)
Comparison of Projection ReleasesThis section compares the output from this release (based on the 2011 Census) with two prior releases of population projections in 2009 and 2011, both of which were based on the 2006 Census.
Each release has a different starting (‘jump-off’ year) and end point so comparison is made based on years common to all three releases – 2020 and 2030 (Table 8).
At both time periods, this release (based on the 2011 Census) projects a lower total population than in the 2011 Release, but a higher population than was projected in the 2009 Release. This result is mirrored in the projection for the non-Indigenous population, but for the Indigenous population the result differs with the current projection being lower than in the both the 2009 and 2011 Releases.
Changes in the projections between each of the releases are a reflection of changes in the ‘jump-off’ populations used as well as changes in the input assumptions.
20 Northern Territory Population Projections
Department of Treasury and Finance
Table 8: Comparison of projection results for years 2020 and 2030
2020 2009 Release
(2006 Census based)
2013 Interim Release
(2011 Census based)
Difference 2011 Release
(2006 Census based)
2013 Interim Release
(2011 Census based)
Difference
NT Total
Indigenous 80 330 77 790 - 2 540 80 778 77 790 -2 988
Non-Indigenous 179 446 185 165 5 719 186 229 185 165 -1 064
Total 259 776 262 954 3 178 267 077 262 954 -4 123
Age Structure
15 years and under
63 928 60 485 -3 443 64 261 60 485 -3 776
15-64 years 179 132 183 115 3 983 183 242 183 115 -127
65 years and over 20 272 19 354 -918 19 574 19 354 -220
2030
NT Total
Indigenous 93 181 88 358 -4 823 94 018 88 358 -5 660
Non-Indigenous 201 673 212 045 10 372 215 459 212 045 -3 414
Total 294 854 300 403 5 549 309 477 300 403 -9 074
Age Structure
15 years and under
71 387 67 311 -4 076 73 390 67 311 -6 079
15-64 years 199 357 207 104 7 747 209 639 207 104 -2 535
65 years and over 28 109 25 988 -2 121 26 448 25 988 -460
Source: Northern Territory Population Projections, 2009, 2011 and Interim – Update (2013 Release)
Northern Territory Population Projections 21
Department of Treasury and Finance
Appendix 1: Alternative net interstate migration scenarios for the Northern TerritoryThe principle driver of volatility in the Territory’s annual population growth rate is net interstate migration (see Chart 1, page 8). This section explores the effects of some alternative net interstate migration assumptions on the Territory’s projected population over the medium and long term.
The net annual interstate inflow has ranged from a low of -2800 to a high of +1700 over the last two decades. In the short term, positive net interstate migration related to the construction of major projects can drive above average growth and negative net migration can follow after the completion of major construction projects or other economic downturns. Consequently, annual fluctuations in net interstate migration tend not to be randomly distributed in time but to follow broadly the cycles of economic activity (see Chart 9). It is not possible to make realistic long-term assumptions about the timing or size of future economic cycles or similar assumptions about cycles of net interstate migration. As such, future net interstate migration assumptions used to develop the NT Population Projections are based on the average over a reasonable period of time (10 years).
Chart 9: Territory Net Interstate Migration, Quarterly (moving annual average) and occurrence of major events.
-1000
-800
-600
-400
-200
0
200
400
600
82 83 84 85 86 87 88 89 90 91 92 93 94 95 96 97 98 99 00 01 02 03 04 05 06 07 08 09 10 11 12
Persons No.
Year ended September
Post Cyclone Tracy rebuilding
Defence build-up under the Army Presence in the North Initiative
Commencement of severalmajor projects (LNG Plant, Rio Tinto Alcan G3 expansion, Black tip, ect.)
29 year average (-137)
Relocation of the 7RAR
However, to demonstrate the influence of migration on the projections, various scenarios have been developed by assuming different levels of constant annual net migration and holding all other parameters fixed. The following net interstate migration assumptions were chosen to cover a wide range of spectrums: -1000, -500, -250 and 0 and 250, 500 and 1000. Additional context is provided by looking at the migration outcomes recorded in the Territory. Chart 10a shows a histogram of the 10 year moving averages for net interstate migration from 1981-1991 to 2001-2011 while Chart 10b shows a histogram of annual changes for interstate migration between 1981 and 2011 to provide additional context.
22 Northern Territory Population Projections

Department of Treasury and Finance
Chart 10a: Net interstate migration averages: Historical 10-year moving averages (histogram)
Chart 10b: Net interstate migration annual averages, 1981 to 2011
Table 9 and Chart 11 show the Territory’s projected population and growth rates under the different interstate migration scenarios. As can be seen, increasing net interstate migration has a predictable positive effect on the size of the Territory’s population. The difference between the -1000 and 1000 net interstate migration scenarios reached 61 521 by 2037 (that is after 25 years of growth).
Northern Territory Population Projections 23
Department of Treasury and Finance
Table 9: Territory population projection scenarios under different interstate migration assumptions
2012 2022 2037Interstate Migration Assumption No
Annual GR (%) No
Annual GR (%) No
Annual GR (%)
Net Migration -1000 234 676 1.34 266 812 1.24 318 466 1.14NTPOP Model -689 234 676 1.47 270 254 1.37 328 044 1.24 Net Migration -500 234 676 1.55 272 336 1.44 333 841 1.30 Net Migration -250 234 676 1.66 275 099 1.53 341 530 1.38 Net Migration 0 234 676 1.77 277 861 1.63 349 220 1.45 Net Migration 250 234 676 1.88 280 635 1.72 356 941 1.52 Net migration 500 234 676 1.98 283 386 1.81 364 603 1.59 Net migration 1000 234 676 2.20 288 911 1.98 379 986 1.71
Chart 11: Territory population projection scenarios under different net interstate migration (NIM) assumptions
225 000
250 000
275 000
300 000
325 000
350 000
375 000
400 000
2011 2014 2017 2020 2023 2026 2029 2032 2035
NIM -1000 NTPOP Model NIM -500 NIM -250
NIM 0 NIM 250 NIM 500 NIM 1000
24 Northern Territory Population Projections

Department of Treasury and Finance
Appendix 2: Technical Details of the NTPOP Population Projections ModelIn addition to the summary presented below, interested readers are referred to the DTF website http://www.treasury.nt.gov.au/Economy/Pages/PopulationProjections.aspx for the mathematical details of NTPOP (Wilson, T, Mathematical details of the NTPOP projection model, School for Social and Policy Research, CDU, Darwin).
The projections in this report, Interim Projections based on the 2011 Census, were produced using the NTPOP projection model, a cohort-component model designed specifically for the Territory to project both Indigenous and non-Indigenous populations.
The model produces projections of the population disaggregated by:
sex (male and female);
Indigenous status (Indigenous and non-Indigenous);
region (Northern Territory, Northern Territory Statistical Reporting regions, and rest of Australia); and
single-year and five-year age cohorts.
For the purpose of producing interim projections for publication in a timely manner and owing to the fact that finalised 2011 Census-derived ERPS will be released in August 2013, the NTPOP projections model in this interim update has been modified to produce projections for two regions only at the sub-state level. These two regions are Greater Darwin (Darwin, Palmerston, and Litchfield) and the Rest of the Northern Territory. The Rest of the Northern Territory region is an aggregation of the five regions (Rest of Darwin, East Arnhem, Katherine, Barkly, Alice Springs) under the complete NTPOP model.
Projected population numbers are calculated at 30 June for each year of the projection horizon, and demographic components of change reflect the year to 30 June.
Each cohort (age, sex, Indigenous status and region) is individually calculated in the projection model. Projection calculations proceed in one-year intervals, from 30 June one year to 30 June in the next. During every projection interval various quantities are added to the initial population and other quantities are subtracted, leaving the projected population at the end of the year. These quantities are known as the demographic components of change (hence the description ‘cohort-component’ model).
The population accounting equation in the NTPOP model is:
Population at time t = population at time t -1 + (births - deaths) + (interstate in migration - interstate out migration) + (overseas arrivals – overseas departures).
For the NTG regions, interstate, intra-regional and overseas migration are combined into one net migration input figure which represents the expected net flow of migrants to the region over a five-year period. The conceptual basis however is essentially the same as that presented above with the components of growth being added to or subtracted from the initial population.
Projection assumptions and parameters are required for each component of the population equation for Indigenous and non-Indigenous populations for the Territory, the rest of Australia and each region for each year of the projections.
Demographic components of change in the accounting equation are calculated by multiplying rates by populations, for example: deaths = death rate × population; or in the case of net migration, set as numbers directly.
Northern Territory Population Projections 25
Department of Treasury and Finance
Components of NTPOP Population Projections Model
Jump-Off YearThe current version of the model commences from the 30 June 2011. These population projections are based on preliminary ERPs for the Territory and Australia and preliminary Aboriginal and Torres Strait Islander population estimates as at 30 June 2011 and were derived in the following way;
ERPs were sourced from ABS Publication, 3101.0 Australian Demographic Statistics - June 2012.
Single age profiles found in the Census data were applied to generate single age estimates by region.
A basic smoothing technique was applied to address the issue of age heaping found in the Census data (see ABS Cat. No.3101.0 - Australian Demographic Statistics March 2012, citing the prevalence of age heaping in the NT).
NTPOP Projection of Cohort BirthsThe projection of cohorts born in each projection interval is performed in a three step process.
1. The number of babies born by Indigenous status of mother is projected by multiplying age-specific fertility rates by the female population in each single-year age group from 15 to 49 years. This gives projected births to Indigenous mothers and non-Indigenous mothers.
2. Births to these two groups of mothers are then cross-classified by the Indigenous status of the infant, giving rise to a four-fold classification of infants:
a) Indigenous births to Indigenous mothers;
b) non-Indigenous births to Indigenous mothers;
c) Indigenous births to non-Indigenous mothers; and
d) non-Indigenous births to non-Indigenous mothers.
Babies in groups (a) and (c) are then grouped as Indigenous births;(b) and (d) as non-Indigenous births.
3. The resulting Indigenous and non-Indigenous infant cohorts then have various components of change added or subtracted in the same manner as for other cohorts. The previous accounting equation is modified slightly, with births replacing the start-of-year population.
GeographyThe projection model considers Australia to be divided into two geographic regions, Northern Territory and ‘rest of Australia’. Migration between the two geographic regions is allowed, as is migration into and out of Australia through either of the regions. Within the Northern Territory, migration is allowed between the regions, as well as to and from the rest of Australia and overseas.
26 Northern Territory Population Projections

Department of Treasury and Finance
Parameter SettingThe model splits all demographic rates into two parts: a summary indicator and an age profile. For the fertility component for example, initially the user needs to set the total fertility rate (TFR) and a fertility age profile for each population group. The fertility age profile consists of age-specific fertility rates. Once the fertility age profile has been set, it does not need to be changed again for the life of the model unless new information comes to light that warrants this. The TFR however can be easily changed allowing different scenarios to be explored.
A similar split into age profile and summary indicator is used for all the other components of growth.
FertilityThe model applies TFRs to four population sub-groups (Territory Indigenous mothers; Territory non-Indigenous mothers; rest of Australia Indigenous mothers; rest of Australia non-Indigenous mothers), adjusts for the percentage of Indigenous births to these mothers, and uses the age-profiles of fertility at each reproductive age to calculate age-specific fertility rates. The projected numbers of births are then calculated by multiplying the age-specific fertility rates by the relevant populations.
The input parameters are TFRs, sex ratios at birth, the percentage of Indigenous births, and age profiles of fertility for each of the population subgroups of mothers and for each year of the projections.
MortalityThe model uses life expectancies at birth for eight population sub-groups (Territory Indigenous males; Territory Indigenous females; Territory non-Indigenous males; Territory non-Indigenous females, rest of Australia Indigenous males; rest of Australia Indigenous females; rest of Australia non-Indigenous males; rest of Australia non-Indigenous females) and age-specific death rates (ASDRs) to calculate numbers of deaths for each of the groups for each year of the projections.
Inputs are the life expectancies at birth and ASDRs for the eight groups for each year of the projections.
Different mortality scenarios can be explored by changing the life expectancy at birth estimates.
Interstate MigrationThe NTPOP model calculates in-and out-migration differently. The user defines a net interstate migration figure and an out-migration figure is added to this to obtain a total in-migration figure. The out-migration figure is calculated by multiplying the Territory population by age-specific out-migration rates. These out-migration rates are known as gross migraproduction rates (GMRs) and are inputs to the model. They are similar in concept to TFRs in that they are the sum of all the age-specific migration rates. The GMR represents the total number of out-moves a person might make in his or her lifetime.
Numbers of in-migrants by age and sex are calculated by applying the age and sex-specific rates of in-migration to the Territory from the rest of Australia to the population of rest of Australia. These numbers are then scaled so they sum to the total in-migration figure calculated as above. This ensures that sensible in-migration numbers are maintained.
Northern Territory Population Projections 27

Department of Treasury and Finance
Inputs are:
Net interstate migration (NIM) numbers for the Territory for each year of the projections for: (i) Indigenous males; (ii) Indigenous females; (iii) non-Indigenous males; and (iv) non-Indigenous females.
GMRs for out-migration from the Territory (to the rest of Australia) for each year of the projections for: (i) Indigenous males; (ii) Indigenous females; (iii) non-Indigenous males; and (iv) non-Indigenous females.
Age profiles of interstate in-and out-migration for each year of the projections for the same four categories as above. Age-specific migration rates are stable over time, and as a consequence these age profiles remain fixed over the life of the projections.
Overseas MigrationImmigration (migration into Australia from overseas) is projected as numbers rather than rates. It is common practice to use numbers rather than rates in the projection of immigration for several reasons, including: (i) the origin population for immigration is the rest of the world, so taking a ‘rates times origin population’ approach would require projections for the rest of the world; and (ii) unlike many other demographic variables, immigration has little to do with the global population size and more to do with things like migration policy and major refugee generating events.
Emigration (migration from Australia to overseas) is calculated by multiplying emigration rates by the origin (Territory or rest of Australia) population and then scaling to the user-defined total.
By having a user-defined total for emigration, it is possible to also indirectly set net overseas migration totals because, as described above, immigration assumptions are also set in terms of numbers.
Inputs are:
Immigration totals for each year of the projections for: (i) Territory Indigenous males; (ii) Territory Indigenous females; (iii) Territory non-Indigenous males; (iv) Territory non-Indigenous females; (v) rest of Australia Indigenous males; (vi) rest of Australia Indigenous females; (vii) rest of Australia non-Indigenous males; and (viii) rest of Australia non-Indigenous females.
Emigration totals for each year of the projections for each of the eight categories above.
Age profiles of immigration and emigration for each of the eight categories above. These age profiles remain fixed over time in the model.
Changes in Indigenous IdentificationDirect migration between the Indigenous and non-Indigenous populations is possible in the model, simulating changes in the propensity for people to change their Indigenous status. This is a unique feature of the model but currently the lack of available information about people’s propensity to identify as Indigenous means that it has not been feasible to set meaningful values for these parameters. Hence currently changes in identification, which are projected as rates multiplied by populations, are set at zero.
28 Northern Territory Population Projections
Department of Treasury and Finance
Notes on Data Sources and Assumptions in the Interim Update
Key publicationsKey ABS publications used in setting assumptions and parameters n the Interim Update are:
3101.0- Australian Demographic Statistics, June 2012 (released 18/12/2012)
3301.0- Births, Australia, 2011 (25/10/2012)
3222.0- Population Projections, Australia, 2006 to 2101 (09/04/2008);
3218.0- Regional Population Growth, 2011 (31/7/2012);
3235.0- Population by Age and Sex, Regions of Australia, 2011 (31/08/2012);
3238.0- Experimental Estimates and Projections, Aboriginal and Torres Strait Islander Australians, 1991 to 2021 (08/09/2009); and
3412.0- Migration, Australia 2010-11 (15/08/2012).
Fertility
TFRTerritory Indigenous TFR for 2011 is sourced from ABS Cat. No. 3301.0 (2.323 births per woman). This TFR is then decreased by 0.7 per cent over a ten-year period (this ratio is calculated using data from the Health Gains Planning branch of the Department of Health and Families (DHF) and is the 13 year trend rate). The TFR is then held constant at 2.169 from 2020-21 onwards.
Territory non-Indigenous TFR for 2011 (1.928 births per woman) is set at a constant ratio of the total TFR. This ratio is calculated using 2006 data from the Health Gains Planning branch of the Department of Health and Families (DHF) (0.9 of the total Territory TFR) and applied to the total Territory TFR as published in ABS Cat. No. 3222.0. This TFR is then decreased at the ABS projected rate (-0.1 per cent) over a 10 year period and held constant from 2020-21 onwards.
Sex ratios at birthTerritory sex ratios at birth for Indigenous mothers are set to a 10 year average based on Health Gains Planning data (108.4 males per 100 females), while sex ratios at birth for non-Indigenous mothers are set to published figures in ABS Cat. No. 3301.0 (104.8 males per 100 females).
Percentage Indigenous birthsThe Territory’s percentage of Indigenous births to non-Indigenous mothers is based on published data in ABS Cat. No. 3238.0 for 2007. A constant increase of 0.017 per cent per annum is applied based on existing research to derive the 2011 figure (8.7 per cent) and future years. The percentage of Indigenous births to Indigenous mothers is set to 100 per cent for the life of the projections.
Northern Territory Population Projections 29
Department of Treasury and Finance
Mortality
Life expectanciesIndigenous and non-Indigenous life expectancies are based on ABS Cat. No. 3238.0 published for 2005-2007 with Indigenous males (61.5 years) and Indigenous females (69.2 years). These estimates are than increased at a constant rate of 0.3 years per annum to give the 2011 jump off and subsequent life expectancies of 62.7 years for males and 70.4 years for females. Non-Indigenous life expectancy estimates from 2005-2007 adjusted according to research by Wilson (2007) to give life expectancy estimates for 2011 of 76.9 years for non-Indigenous males and 82.2 years for non-Indigenous females.
The assumption of improvement in Indigenous life expectancy is based on current research in the field, reflecting gradual improvements over time in Indigenous health and education, leading to improved socio-economic outcomes resulting in increased life expectancy.
Regional Fertility and MortalityThe same Indigenous and non-Indigenous TFRs as for the Territory total population (see above) are used for the regions. There is uncertainty over the data on place of usual residence for mothers giving birth in the Territory, hence the TFRs published by the ABS for regions are not considered accurate.
Mortality is assumed to be the same for both the regions and the Territory as a whole. This is known not to be the case however there is insufficient accurate data to justify an alternative approach.
Interstate MigrationTerritory net interstate migration for Indigenous persons is set to -55 persons per annum as published in ABS Cat. No. 3238.0. Research has shown that Indigenous persons engage in interstate migration, particularly around cross-border areas such as the Northern Territory/South Australia border. However, due to data limitations capturing these movements is difficult. Census data indicates that the numbers of Indigenous interstate movements is small and that, in net terms the number is close to zero.
Net interstate migration for non-Indigenous persons in 2010-11 (-2549) and 2011-12 (-1492) are actuals. From 2012-13 onwards, the average level of the 10 year period between 2002 and 2012 (-634) is used. This is split between males (51 per cent) and females (49 per cent) using ratios obtained from migration data ABS Cat. No.3412.0.
Age profiles of migration to and from the Territory were based on movements of people between the 2006 and 2011 Censuses.
Overseas MigrationNet overseas migration for Indigenous people for the Territory is set at zero.
For non-Indigenous people, overseas arrivals and departures data for 2010 is sourced from ABS Cat. No. 3412.0. Overseas migration for 2010-11 (630) and 2011-12 (2004) are actuals. Projections from 2012-13 onwards are set at the 8 year average to June 2012 (1287). Net overseas migration arrivals are split for 62 per cent males and 38 per cent females. Net overseas migration departures are split 67 per cent males and 33 per cent females. Male/female proportions are based on 7 year averages (ABS Cat. No. 3412.0).
For the age profiles of overseas migration for non-Indigenous people, the average age profile over the period 1995-96 to 2005-06 was based on passenger card data supplied by ABS. The data refers to long-term and permanent migrants.
30 Northern Territory Population Projections
Department of Treasury and Finance
Regional MigrationAs noted previously in this report, the regional population projections have greater limitations than the Territory total projections because the base input data is less accurate for smaller geographic areas, and the migration flows become more complex at lower geographic levels as intra-regional as well as interstate and international migration to the Territory needs to be taken into account.
Regional net migration is set as the sum of (1) net interstate, (2) net intra-Territory and (3) net overseas migration, with net intra-Territory migration summing to zero. Regional net migration for all three types of migration for all regions sums to net interstate and net overseas migration for the Territory as a whole.
Census (2006 Census and 2011 Census) data on migration patterns was used to allocate migration to the regions.
Northern Territory Population Projections 31


![GET IN GEAR2017 AUTOMOTIVE INDUSTRY FACTBOOK · Millennial consumers’ desire.[5] Source: U.S. Census Bureau, interim population projections released 2014 and annual population estimates;](https://img.dokumen.tips/doc/110x75/601045388db6574ad213be4e/get-in-gear2017-automotive-industry-factbook-millennial-consumersa-desire5.jpg)