Embed Size (px)
Citation preview

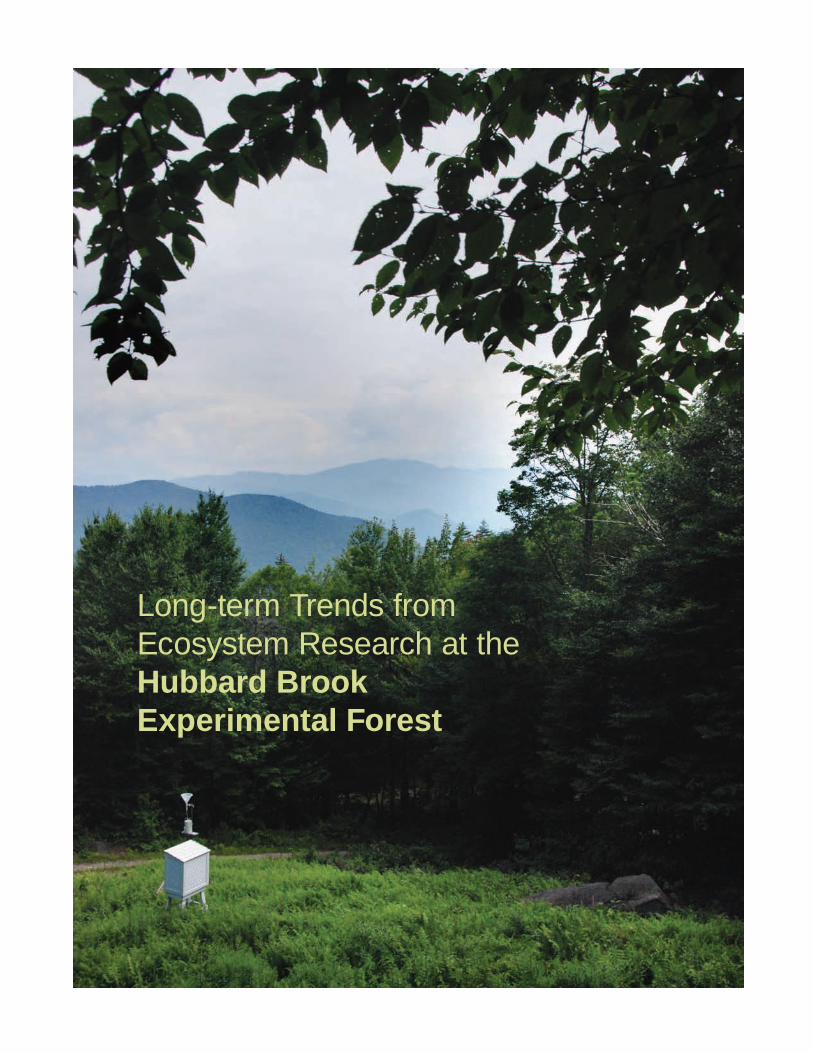
Long-term Trends from Ecosystem Research at the Hubbard Brook Experimental Forest
John L. CampbellCharles T. DriscollChristopher EagarGene E. LikensThomas G. SiccamaChris E. JohnsonTimothy J. FaheySteven P. HamburgRichard T. HolmesAmey S. BaileyDonald C. Buso
United States Department ofAgriculture
Forest Service
NorthernResearch Station
General TechnicalReport NRS-17
HUBBARD
BROOK
RESEARCH
FOUNDATION

The U.S. Department of Agriculture (USDA) prohibits discrimination in all its programs and
activities on the basis of race, color, national origin, age, disability, and where applicable, sex,
marital status, familial status, parental status, religion, sexual orientation, genetic information,
political beliefs, reprisal, or because all or part of an individual’s income is derived from any public
assistance program (Not all prohibited bases apply to all programs.) Persons with disabilities who
require alternate means for communication of program information (Braille, large print, audiotape,
etc.) should contact USDA’s TARGET Center at (202) 720-2600 (voice and TDD). To file a
complaint of discrimination, write to USDA, Director, Office of Civil Rights, 1400 Independence
Avenue, S.W., Washington, DC 20250-9410, or call (800)795-3272 (voice) or (202)720-6382
(TDD). USDA is an equal opportunity provider and employer.
Campbell, John L.; Driscoll, Charles T.; Eagar, Christopher; Likens, Gene E.; Siccama, Thomas G.; Johnson, Chris E.; Fahey, Timothy J.; Hamburg,Steven P.; Holmes, Richard T.; Bailey, Amey S.; Buso, Donald C. 2007.Long-term trends from ecosystem research at the Hubbard BrookExperimental Forest. Gen. Tech. Rep. NRS-17. Newtown Square, PA:U.S. Department of Agriculture, Forest Service, Northern ResearchStation. 41 p.
Summarizes 52 years of collaborative, long-term research conducted at the Hubbard Brook (NH) Experimental Forest on ecosystem response to disturbances such as air pollution, climate change, forest disturbance, and forest management practices. Also provides explanations of some of the trends and lists references from scientific literature for further reading.
KEY WORDS: biogeochemistry, disturbance, ecosystem, forestry, lake, soil, stream, trends, watershed.
PRINTED ON RECYCLED PAPER
AbstractThe Hubbard Brook Experimental Forest was established by the U.S. Forest Service in 1955 as a major center for hydrologic research in the Northeast. The Hubbard Brook Ecosystem Study originated 8 years later with the idea of using the small watershed approach to study element flux and cycling and the response of forest ecosystems to disturbance. Since that time, the research program at Hubbard Brook has expanded to include various physical, chemical and biological measurements collected by researchers from a number of cooperating institutions. Collaborative, long-term data are the keystone of the Hubbard Brook Ecosystem Study and have provided invaluable insight into how ecosystems respond to disturbances such as air pollution, climate change, forest disturbance, and forest management practices. This report highlights long-term ecological trends at Hubbard Brook, provides explanations for some of the trends, and lists references from the scientific literature for further reading.
AcknowledgmentsWe would like to thank Kimberley M. Driscoll of Syracuse University for compiling data and developing initial graphs used in this publication. We also thank David Sleeper of the Hubbard Brook Research Foundation for advice and encouragement. The Hubbard Brook Research Foundation provided support for the photography, design, and layout of this report, through a grant from the Northeastern Ecosystem Research Cooperative. This manuscript is a contribution of the Hubbard Brook Ecosystem Study. Hubbard Brook is part of the Long-Term Ecological Research (LTER) network, which is supported by the National Science Foundation. The Hubbard Brook Experimental Forest is operated and maintained by the U.S. Forest Service, Northern Research Station, Newtown Square, Pennsylvania.
The design of this report was done by RavenMark, Inc. of Montpelier, Vermont. Cover photos, top two: U.S. Forest Service Archives. Bottom two: Buck Sleeper. Photographs throughout this report are by Buck Sleeper, unless otherwise noted.
The AuthorsJOHN L.CAMPBELL and CHRISTOPHER EAGAR are research ecologists and AMEY S. BAILEY is a forest technician with the Northern Research Station, Durham, NH. CHARLES T. DRISCOLL is a university professor of environmental systems engineering and CHRIS E. JOHNSON is an associate professor of civil and environmental engineering, Syracuse University, Syracuse, NY. GENE E. LIKENS is an ecologist and distinguished senior scientist of the Institute of Ecosystem Studies, Millbrook, NY. THOMAS G. SICCAMA is a professor emeritus of forest ecology, Yale School of Forestry and Environmental Studies, New Haven, CT. TIMOTHY J. FAHEY is a professor of natural resources, Cornell University, Ithaca, NY. STEVEN P. HAMBURG is Director of the Global Environment Program at the Watson Institute for International Studies, Brown University, Providence, RI. RICHARD T. HOLMES is a professor emeritus of biology, Dartmouth College, Hanover, NH. DONALD C. BUSO is a biologist and manager of field research at the Hubbard Brook Experimental Forest, for the Institute of Ecosystem Studies, Millbrook, NY.
Published by:
USDA FOREST SERVICE11 Campus Blvd., Suite 200Newton Square, PA 19073-3294
October 2007
www.nrs.fs.fed.us
For additional copies:
USDA Forest ServicePublications Distribution359 Main RoadDelaware, OH 43015-8640Fax: (704) 368-0152
Covers.indd 2 10/2/07 5:08:25 PM

Contents
Hubbard Brook Experimental Forest ................................................................................................... 1
Site Description and Characteristics .................................................................................................... 1
Map of the Hubbard Brook Experimental Forest in the
White Mountain National Forest, New Hampshire ........................................................................ 2
Research Focus .................................................................................................................................... 3
Report Overview ................................................................................................................................. 5
Biological Measurements
Birdabundance............................................................................................................................... 5
Treespeciesbiomass...................................................................................................................... 7
Treestemcountswithinandbetweenhealthclasses................................................................... 9
Physical Measurements
Precipitation,streamrunoff,andevapotranspiration.................................................................... 11
Meanannualairtemperature.......................................................................................................... 13
Maximumsnowdepthandwatercontent
andsnowcoverduration........................................................................................................... 15
DaysoficecoverforMirrorLake................................................................................................... 17
Chemical Measurements
ChlorideinMirrorLake................................................................................................................... 19
Sulfurdioxideemissionsversussulfateconcentrations................................................................. 21
Streamwaterconcentrationsofbasecations,
sulfateandnitrate,andpH........................................................................................................ 23
Concentrationsofformsofaluminuminsoilsolutions................................................................ 25
Leadinprecipitation,streamwater,andtheforestfloor.............................................................. 27
Forestfloorcarbonandnitrogen.................................................................................................... 29
Experimental Manipulations
Nitrateconcentrationsinstreamwater.......................................................................................... 31
Wholetreeharvesteffectsonexchangeablecalcium................................................................... 33
Calciumconcentrationinwoodfernfronds................................................................................. 35
Abovegroundbiomass..................................................................................................................... 37
Changesinwateryieldafterforestcutting.................................................................................... 39
Long-term Trends from Ecosystem Research at the Hubbard Brook experimental Forest

�
HuBBard Brook experimental Forest
TheHubbardBrookExperimentalForest(HBEF)wasestablishedin1955asasiteofhydrologicresearchinNewEngland.ThesiteislocatedwithintheWhiteMountainNationalForestincentralNewHampshire.TheemphasisofearlystudiesattheHBEFwastheimpactofforestmanagementonwateryieldandquality,andfloodcontrol.TheNorthernResearchStationoftheU.S.ForestServicemanagesthesiteforlong-termecosystemresearchandoperatesanon-sitefieldstation,theRobertS.PierceEcosystemLaboratory.
ThenorthernhardwoodforestoftheHBEFisrepresentativeofmuchoftheNorthernForestregion,whichcoversmorethan10.5millionhectaresstretchingfromthenorthernwoodsofMainetotheAdirondackMountainsandTugHillregionsofNewYork.TheNorthernForestisthelargestcontiguousblockofforestlandintheeasternUnitedStatesandincludesamixtureofmountainranges,rivers,lakes,andwetlandsinhabitedbymanywildlifespecies(e.g.,moose,pinemarten,Canadalynx,songbirds,peregrinefalcons,commonloons,baldeagles).ThekeyissuesfacingthesustainablemanagementoftheNorthernForestincludetheimpactsofforestmanagement,landdevelopment,airpollution,climatechange,introducedspecies,timberandfiberproduction,watersupplyandquality,andmanagementofcarbonstocks.
TheHubbardBrookEcosystemStudy(HBES)originatedwiththeideaofusingthesmallwatershedapproachtostudyelementfluxandcycling.AjointresearchprogrambetweentheU.S.ForestServiceandDartmouthCollegewasestablishedbyacooperativeagreementin1963.In1988theHBEFwasdesignatedaLongTermEcologicalResearch(LTER)sitebytheNationalScienceFoundation.Ongoingcooperativeeffortsamongdiverseeducationalandresearchinstitutionsandgovernmentagencieshaveresultedinoneofthelongestandmostextensivecontinuousdatabasesonthehydrology,biology,geology,andchemistryofnaturalecosystems.Today,morethan40scientistsfromabout20institutionsparticipateintheHBES.
TheprimarygoalsoftheHBESare:1)toadvancescientificunderstandingofforestandaquaticecosystems,andtheirresponsetonaturalandhuman-induceddisturbances;2)providescientificinformationrequiredformakingsoundmanagementandpolicydecisions;3)tooffereducationalandresearchopportunitiestostudents;and4)topromotegreaterpublicawarenessofecosystemscience,withafocusonthenorthernhardwoodforest.
site desCription and CHaraCteristiCs
TheHBEFisa3,160-ha,bowl-shapedvalleywithhillyterrain,rangingfrom222to1,015maltitude;theForestislocatedinthetownsofWoodstockandEllsworth,NH.TheHBEFhasanetworkofprecipitationandstream-gagingstations,weatherinstrumentation,aswellassoilandvegetationmonitoringsitesonsmallfirstorderwatersheds.Thereareninefirst-ordergagedwatershedsattheHBEF,includingseveralusedforlong-termexperiments.Watershedsarenumbered(Fig.1)andthroughoutthisreportarereferredtointheshorthand:W1,W2,etc.
The northern
hardwood forest
of the HBEF is
representative of
much of the Northern
Forest region,
which covers more
than �0.5 million
hectares stretching
from the northern
woods of Maine
to the Adirondack
Mountains and
Tug Hill regions
of New York.

�
Averageannualprecipitationisabout1,400mm,withone-thirdtoone-quarterassnow.Approximately111separateprecipitationeventsoccureachyear.Asnowpackusuallypersistsfromlate-Decemberuntilmid-April,withapeakdepthinMarch.Januaryaveragesabout–9°C,andlongperiodsoflowtemperaturesarecommon.TheaverageJulytemperatureis18°C.Theaveragenumberofdayswithoutkillingfrostis145;however,thegrowingseasonfortreesisconsideredtobefrom15Mayto15September.Theestimatedannualevapotranspirationisabout500mm.
SoilsattheHBEFarepredominantlywelldrainedSpodosols,TypicHaplorthods,derivedfromglacialbasaltill,withsandyloamtextures.Thesesoilsareacidic(pHabout4.5orless)andrelativelyinfertile(basesaturationofmineralsoil~10percent).A20-to200-mmthickforestfloorlayerispresent,exceptwherethesoilsurfacehasbeendisturbedbyfallentrees.Soildepths,includingunweatheredtill,arehighlyvariablebutaverageabout2.0m.Soilontheridgetopsmayconsistofathinaccumulationoforganicmatterrestingdirectlyonbedrock.Theseparationbetweenthepedogeniczoneandunweatheredtillandbedrockbelowisindistinct.AveragedepthtotheChorizonisabout0.6m.AtvariousplacesintheHBEF,theChorizonexistsasanimpermeablepan.Theunsortedtillincludescoarsefragments(rocks)ofallsizesscatteredthroughoutthesoilprofile,thoughwithincreasingdensitywithdepth.Inmanylocations,surficialbouldersareprominent.
Figure 1. site map of the Hubbard Brook experimental Forest in the White mountain national Forest, new Hampshire. shown are the network of rain gages, experimental watersheds, and mirror lake.

�
TheHBEFisentirelyforested,mainlywithdeciduousnorthernhardwoods:sugarmaple(Acer saccharum),beech(Fagus grandifolia),andyellowbirch(Betula allegheniensis),andsomewhiteash(Fraxinus americana)onthelowerandmiddleslopes.Otherlessabundantspeciesincludemountainmaple(Acer spicatum),stripedmaple(Acer pensylvanicum),andtremblingaspen(Populus tremuloides).Redspruce(Picea rubens),balsamfir(Abies balsamea),andmountainpaperbirch(Betula papyrifera var. cordifolia)areabundantathigherelevationsandonrockoutcrops.Hemlock(Tsuga canadensis)isfoundalongthemainHubbardBrook.Pincherry(Prunus pensylvanica),ashadeintolerantspecies,dominatesallsitesforthefirstdecadefollowingamajorforestdisturbance.Thepresettlementforestwasdominatedbyredspruce,beechandbirch.Loggingoperationsbeganinthe1880swithmajorremovalsinthe1910swhentheremainingspruceandlargeportionsofthebetterqualityhardwoodswereremoved.The1938hurricaneandsubsequentsalvageloggingresultedinadditionaltreeremovalandunderstoryrelease.Thepresentsecond-growthforestisunevenagedandcomprisedofabout80to90percenthardwoodsand10to20percentconifers.
researCH FoCus
ThesmallwatershedecosystemapproachtoresearchonnutrientcyclingwaspioneeredattheHBEF.Thisapproachusestheforestasasingleintegratedlandscapeunitwithwhichscientistscanconductexperimentsonawatershedlevel,monitoringlong-termchangesinstreamflow,nutrientcycling,forestgrowth,andcomposition.ExperimentalmanipulationshavebeenusedextensivelyattheHBEF.Manywholewatershed,stream,andlakemanipulationshavebeenconductedtotesthypotheses,obtainquantitativeinformationontheimpactsofmanagementoptions,andtovalidateprocess-basedecosystemmodels.WholeecosystemmanipulationsconductedattheHBEFincludeexperimentstoexamineforestmanagementpractices,(clearcutting,stripcutting,wholetreeharvesting),theroleofbiologicaluptakeonnutrientcycles(herbicideapplicationfor3years)andmitigationofairpollution(additionofcalciumsilicate).
Scientiststrackclimaticconditionsandchemicalinputsthroughtheair,rain,andsnow.Researchersuselong-termmeasurements,long-termexperiments,models,andcross-sitestudiestoinvestigatetheeffectsoftheseconditionsandhowtheecosystemrespondstochangesintheseconditions.Thesedataareusedtodocumentandassesstheecologicaleffectsofregionalandglobalenvironmentaldisturbances.AtHubbardBrooktherearemajorresearchthemesthatencompassmuchoftheongoingresearchatthesite,includingperturbationsfromairpollution(suchasacidrainandmercury),andtheresponseandrecoveryfromcatastrophic(suchasclearcutting)andnoncatastrophicforestperturbations(suchasicestorms,forestdisease).
AstrengthoftheHBESisthelong-termmonitoringprogram,whichhasdemonstratedthatshort-termobservationsareoftenmisleadingandthatdecadesmayberequiredtodetectrealchangesincomplexecosystems.Thelong-termrecordattheHBEFprovides:1)insightintoecosystemfunction;2)empiricaldatafortestingmodelsandgeneratinghypotheses;3)arecordofextremeorunusualevents;and4)informationthatisrelevanttoregional,national,andglobalissues.
Bluebeadlily(Clintonia borealis)fruit

�
table 1. Current long-term monitoring data sets developed through the Hubbard Brook ecosystem study. the institution responsible for the data and initial year of data collection is indicated.
measurement institution Year
Hydrometeorological monitoring Instantaneous streamflow (9 stations) U.S. Forest Service 1956Daily streamflow (9 stations) U.S. Forest Service 1956Daily precipitation (25 stations) U.S. Forest Service 1956Air temperature: mean, min, max (8 stations) U.S. Forest Service 1955Solar radiation U.S. Forest Service 1958Wind speed and direction U.S. Forest Service 1965Vapor pressure U.S. Forest Service 1966Weekly snow depth and snow water equivalent U.S. Forest Service 1959Hourly canopy surface wetness Inst. of Ecosystem Studies 1989Mirror Lake precipitation (2 stations) Inst. of Ecosystem Studies 1974Mirror Lake groundwater Inst. of Ecosystem Studies 1978Mirror Lake streamflow (outlet and 3 inlets) Inst. of Ecosystem Studies 1978Mirror Lake thermal profiles Inst. of Ecosystem Studies 1967Mirror Lake ice in/out dates Inst. of Ecosystem Studies 1967
solution and air Chemistry Weekly bulk precipitation (6-10 stations) Inst. of Ecosystem Studies 1963Monthly soil solution chemistry within W1 and W6 Syracuse University 1984Weekly stream chemistry at weirs of W1-9 Inst. of Ecosystem Studies 1963Monthly stream chemistry within W1 and W6 Syracuse University 1982Mirror Lake water column chemistry Inst. of Ecosystem Studies 1967Mirror Lake precipitation chemistry (2 stations) Inst. of Ecosystem Studies 1974Mirror Lake groundwater chemistry Inst. of Ecosystem Studies 1980Mirror Lake inlets/outlet chemistry (outlet and 3 inlets) Inst. of Ecosystem Studies 1967Air chemistry (sulfur dioxide, nitric acid, particulates, ozone) Inst. of Ecosystem Studies 1988
organisms Bird populations Dartmouth College 1969Phytophagous insect populations Dartmouth College 1969Salamander populations Inst. of Ecosystem Studies 1970Snail populations Brown University 1996Small mammals Dartmouth and Wellesley 1986W2 Vegetation, biomass, chemistry University of Wyoming 1970W4 Vegetation, biomass U.S. Forest Service 1970W5 Vegetation, biomass, chemistry Cornell/Yale University 1985W6 Vegetation, biomass, chemistry Yale University 1965Valley-wide vegetation Cornell University 1997 Vegetation structure and composition (Bird Transect Area) Dartmouth and Wellesley 1970Fine-root, biomass, chemistry Cornell University 1992Microbial biomass and activity Inst. of Ecosystem Studies 1992Litter-Fall Cornell University 1988Phenology U.S. Forest Service 1989
soils Forest floor mass, chemistry (W1, W5, and W6) Yale/Brown University 1968Chemical and physical properties from soil pits Syracuse/Cornell/ 1984 (W5, valley-wide) Brown University Sediment yield in weir basin U.S. Forest Service 1956Soil frost U.S. Forest Service 1956Soil temperature and moisture U.S. Forest Service 1959

5
report overvieW Inthisreport,wehighlightsomeresultsoflong-termmeasurementsandexperimentsconductedattheHBEF.Thefiguresincludedshowsomeofthemoreinterestinglong-termtrends;howevernotallofthelong-termHubbardBrookdataarepresented.Acompletelistoflong-termmeasurementsisprovidedinTable1.Thisreportincludesgraphs,adescriptionofthedataandtrends,theprincipalinvestigator(s)andrelatedreferences.Thefiguresaregroupedintofourmajorcategories:1)biologicalmeasure-ments;2)physicalmeasurements;3)chemicalmeasurements;and4)experimentalmanipulations.Thereporttargetsabroadaudience,includinglandmanagers,environmentalprotectionagenciesandorganizations,educatorsandstudents,researchscientists,andthegeneralpublic.
BiologiCal measurements Bird abundance
BirdcensusesareconductedannuallybetweenlateMayandearlyJulyona10-haplotwestofW6.Thecensusmethods,whichhavebeenusedconsistentlysincetheinceptionofthestudy,consistoftimedcensusesalongtransects,mistnetcapture,andsystematicobservationsonindividualbirds.Resultsfromthisstudyshowthattheabundanceofbirdshasdeclinedfrommorethan200individualsper10haintheearly1970sto70to100per10hafromtheearly1990stothepresent.Shiftsinthe
Figure 2. number of adult birds (males and females, all species combined) breeding at the HBeF, 1969-2005.
Bird abundance
Black-throatedbluewarbler(Dendroica caerulescens).PhotographbyNicholasRodenhouse

6
compositionofthebirdcommunitythathaveoccurredsincesamplingbeganin1969canbeexplainedinpartbychangesinvegetation,resultingfromnaturalforestsuccessionandlocaldisturbances.Otherimportantfactorsthatinfluencebirdabundancearefoodavailabilityandeventsthatoccurduringmigrationandwinterperiods.However,long-termdeclinesintheoverallabundanceofbirdsremainlargelyunexplainedandmaydependuponshiftsatmultiplelevelsastheecosystemrespondstocompoundedstressesandperturbations.FigureupdatedfromHolmesandSherry(2001).
Principal Investigator:RichardT.Holmes,DartmouthCollege
Online Access: Birdabundances–http://www.hubbardbrook.org/data/dataset.php?id=81
Associated Databases:Lepidoptera,smallmammals
Further Reading:Holmes,R.T.;Sherry,T.W.1988.Assessing population trends of New Hampshire forest birds: Local versus regional patterns.TheAuk.105:756-768.
Holmes,R.T.;Sherry,T.W.2001.Thirty-year bird population abundance in an unfragmented temperate deciduous forest: Importance of habitat change.TheAuk.118:589-609.
Holmes,R.T.;Sherry,T.W.;Sturges,F.W.1986.Bird community dynamics in a temperate deciduous forest: long-term trends at Hubbard Brook.EcologicalMonographs.56:201-220.
Holmes,R.T.;Sturges,F.W.1975.Bird community dynamics and energetics in a northern hardwoods ecosystem.JournalofAnimalEcology.44:175-200.
Undergraduatestudentsupdatingthebirdcensuscomputerdatabase

7
Figure 3. tree species biomass for live and dead trees on the reference watershed W6.
tree species Biomass
tree species biomass
Treedensityanddiameteratbreastheight(d.b.h.=1.37mabovegroundlevel)havebeenmeasuredat5-yearintervalsonthereferencewatershed(W6)since1965.Biomassiscalculatedusingallometricequationsthatrelatetreediametertothemassofeachspecies.Biomasscalculationsfordeadtreesincludeestimatesofdecay(seeSiccamaetal.2007).Recentunexpecteddeclinesintotallivebiomass(>10cmd.b.h.)onW6reflectacombinationofdecreasedgrowthratesandincreasedmortalityratesofthedominantspecies(sugarmaple,Americanbeech,andyellowbirch).Onepossibleexplanationforthedeclineinsugarmaplebiomassisdepletionofsoilcalciumassociatedwithacidicdeposition.WhileAmericanbeechbiomassincreasedsteadilyfrom1965to1997,therecentdeclinesinthelargesizeclass(>10cmd.b.h.)aredueprimarilytobeechbark

8
disease.Beechtreesaffectedbythediseasearegraduallygirdledbycankersandoftenrespondwithvigorousrootsprouts.Beechbarkdiseasetypicallydoesnotaffectthegrowthofsmallertrees(2to9cmd.b.h.).Ofthethreedominanttreespecies,yellowbirchhasshowntheleastamountofchangeinbiomassoverthelong-termrecord.TotallivetreebiomassinW6reachedamaximumearlierandatalowerlevelthanpreviouslypredicted(seeWittakeretal.1974),whichclearlyshowstheimportanceoftestingsuchestimateswithcarefullycollectedlong-termdata.
Principal Investigators: ThomasG.Siccama,YaleUniversityTimothyJ.Fahey,CornellUniversityJohnJ.Battles,UniversityofCalifornia-BerkeleyChrisE.Johnson,SyracuseUniversity
Online Access:1965W6forestinventory–http://www.hubbardbrook.org/data/dataset.php?id=291977W6forestinventory–http://www.hubbardbrook.org/data/dataset.php?id=301982W6forestinventory–http://www.hubbardbrook.org/data/dataset.php?id=311987W6forestinventory–http://www.hubbardbrook.org/data/dataset.php?id=321992W6forestinventory–http://www.hubbardbrook.org/data/dataset.php?id=331997W6forestinventory–http://www.hubbardbrook.org/data/dataset.php?id=342002W6forestinventory–http://www.hubbardbrook.org/data/dataset.php?id=35
Associated Databases: Forestinventorydata(W1,W5,andBirdTransectArea)
Further Reading:Whittaker,R.H.;Bormann,F.H.;Likens,G.E.;Siccama,T.G.1974.The Hubbard Brook Ecosystem Study: Forest Biomass and Production.EcologicalMonographs.44:233-254.
Siccama,T.G.;Denny,E.2006.Long-term changes in the calcium concentration of wood fern fronds [Online].Availableathttp://www.hubbardbrook.org/yale/watersheds/w6/biomass-stop/how-to-quantify.htm.(accessed12Sept.2006).
Siccama,T.G.;Fahey,T.J.;Johnson,C.E.;Sherry,T.;Denny,E.G.;Girdler,E.B.;Likens,G.E.;Schwarz,P.2007.Population and biomass dynamics of trees in a northern hardwood forest at Hubbard Brook.CanadianJournalofForestResearch.37:737-749.
ThenorthernhardwoodforestattheHBEF

9
tree stem Counts Within and Between Health Classes
tree stem counts within and between health classes
Figure 4. tree stem counts within and between health classes at the 10-ha Bird transect area.
Thefateofmorethan5,000treeshasbeentrackedatthe10-haBirdTransectArea(seeFigure2)attheHBEFaspartofacontinuingforestinventorythatstartedin1991.Atthebeginningofthestudy,allstemsgreaterthan10-cmintheentire10-haareaweremarkedwithaluminumtagsandthestatusofeachtreewasrecorded.Treesarereassessedat2-yearintervalsandthesedataareusedtocalculatethetransfersoftreesamongfivecategories:1)liveandhealthy;2)unhealthy(thincrownsandfeworyellowedleaves);3)standingdead(mostbranchesstillpresent);4)snag(deadtreeswithoutmajorbranches,orbrokenoffabovebreastheight[1.37m]);or5)downed(uprootedorbrokenoffbelow1.37m).Ineach2-yearresurvey,ingrowthtrees,definedasthosereachingthe10-cmd.b.h.threshold,arealsotagged.Inthediagramabove,whichincludes10yearsofdata(1991-2001),thenumbersinboxesrepresentthenumberoftreesineachcategoryforeachsamplingyearandthevaluesassociatedwitharrowsrepresentthenumberoftreeschangingcategoriesbetweenthe2-yearmeasurementinterval.Tokeepthediagramlegible,transferstothedownedwoodcategoryarenotshownbyarrows.Instead,theyaregiveninbracketsatthebottomofthefigure,orderedaccordingtothesource
Treetaggedwithidentificationnumber

�0
category[live(includingingrowth),unhealthy,standingdead,snag].Ofthe4720livetrees(4662healthyand58unhealthy)taggedin1991,11percentdiedoverthe10-yearperiod.Mostofthedyingtreesenteredthestandingdeadpool.Thereafter,amajorityof
thestandingdeadtreespassedthroughthesnagpoolbeforefinallyfallingtotheground.Anaveragestandingdeadtreeremainedstandinginthisforestfor~7.5yearswhileanaveragesnagremainedstandingfor~15years.Therelativelyshortexistenceofstandingdeadandsnagtreesinmaturenorthernhardwoodforestsresultsinalowdensityofdeterioratingtreesforwildlifethatusethishabitat.Furthercalculationsandsummaries,includingbasalarea,stemdensity,andspeciescompositioncanbemadeusinganonlineinteractiveprogram(seehttp://www.hubbardbrook.org/w6_tour/biomass-stop/phytobird.htm).FigureadaptedfromSiccama etal.2007.
Principal Investigators: ThomasG.Siccama,YaleUniversityTimothyJ.Fahey,CornellUniversityChrisE.Johnson,SyracuseUniversityEllenG.Denny,YaleUniversityandU.S.ForestService
Online Access:BirdTransectAreaforestinventory–http://www.hubbardbrook.org/data/dataset.php?id=43
Associated Databases: Forestinventorydata(W1,W5,andW6)
Further Reading:Siccama,T.G.;Fahey,T.J.;Johnson,C.E.;Sherry,T.;Denny,E.G.;Girdler,E.B.;Likens,G.E.;Schwarz,P.2007.Population and biomass dynamics of trees in a northern hardwood forest at Hubbard Brook.CanadianJournalofForestResearch.37:737-749.
Deterioratingtreesprovidehabitatforwildlife

��
Figure 5. Precipitation, streamflow, and evapotranspiration at the hydrologic reference watershed (W3) from 1957 to 2005.
precipitation, stream runoff, and evapotranspiration
pHYsiCal measurements
precipitation, stream runoff, and evapotranspiration
Precipitationandstreamflowhavebeenmeasuredatthehydrologicreferencewatershed(W3)since1957andateightotherwatershedsattheHBEFwithstartingdatesrangingfrom1956to1995.Precipitationismeasuredwithraingageslocatedinandaroundeachwatershed,andisweightedtodeterminethevaluefortheentirewatershed.Streamsaregagedatweirslocatedattheoutletofeachwatershed,allowingforprecisemeasurementsofstreamflow.Evapotranspiration,whichisatermthatdescribeswaterevaporateddirectlyfromtheleaves,soilorsnow,iscalculatedbysubtractingstreamflowfromprecipitation.Variationinprecipitationandstreamflowismuchgreaterthanvariationinevapotranspiration.Overthelong-term,61percentoftheprecipitationthatentersW3leavesasstreamflow,while39percentisreturnedtotheatmosphereviaevapotranspiration.Therearenosignificantlong-termtrendsinprecipitation,streamflow,orevaporationalthoughsomeindicessuggestthatthepast4to5decadeshavebeenrelativelywet.

��
Principal Investigators: JohnL.Campbell,U.S.ForestServiceAmeyS.Bailey,U.S.ForestServiceChristopherEagar,U.S.ForestService
Online Access:Dailyprecipitationbywatershed–http://www.hubbardbrook.org/data/dataset.php?id=14Dailystreamflowbywatershed–http://www.hubbardbrook.org/data/dataset.php?id=2
Associated Databases: Instantaneousstreamflow,dailyprecipitationbyraingage
Further Reading:Bailey,A.S.;Hornbeck,J.W.;Campbell,J.L.;Eagar,C.2003.Hydrometeorological database for Hubbard Brook Experimental Forest: 1955-2000.Gen.Tech.Rep.NE-305.NewtonSquare,PA:U.S.DepartmentofAgriculture,ForestService,NortheasternResearchStation.36p.
Measurementsfromstream-gagingstationsarerecordedandanalyzed.
Photographs:(top)U.S.ForestServiceArchives;(bottom)HubbardBrookResearchFoundationArchives.

��
Figure 6. mean annual air temperature at the robert s. pierce ecosystem laboratory and station 14.
mean annual air temperature
mean annual air temperature
Airtemperatureismeasuredatsevenraingageclearings(RobertS.PierceEcosystemLaboratoryandStations1,6,14,17,23,and24)locatedthroughouttheareaoftheexperimentalwatersheds(seeFigure1).Theoldestairtemperaturerecorddatesbackto1955atStation1.Sincethattime,temperaturemeasurementshavebeenmadeconsistentlyusinghygrothermographshousedinstandardshelters.Althoughmeanannualtemperatureisquitevariable,alllocationsshowanupwardtrend,consistentwithtemperaturerecordsfromelsewhereintheregionoverthesametimeperiod,aswellasoveralonger(>100year)timeperiod.WinterairtemperaturesattheHBEFarewarmingmorerapidlythansummertemperatures,andhavegreaterinterannualvariability.Inthegraphabove,airtemperaturedatashowsignificantincreases(seasonalKendalltautest,p<0.01)andgiveanindicationoftherangeinairtemperaturesarisingprimarilyfromdifferencesinelevationandaspect.Amorethoroughunderstandingoflong-termtemperaturetrendsattheHBEFiscrucialtopredictinghowecosystemprocesseswillrespondtofutureclimatechange.

��
Principal Investigators: JohnL.Campbell,U.S.ForestServiceAmeyS.Bailey,U.S.ForestServiceChristopherEagar,U.S.ForestService
Online Access:Airtemperature–http://www.hubbardbrook.org/data/dataset.php?id=58
Associated Databases: Solarradiation,soiltemperature
Further Reading:Bailey,A.S.;Hornbeck,J.W.;Campbell,J.L.;Eagar,C.2003.Hydrometeorological database for Hubbard Brook Experimental Forest: 1955-2000.Gen.Tech.Rep.NE-305.NewtonSquare,PA:U.S.DepartmentofAgriculture,ForestService,NortheasternResearchStation.36p.
ViewoftheHubbardBrookValleyduringfall.PhotographbyJerryFranklin

�5
Figure 7. maximum snow depth and water equivalence and snow cover duration at station 2.
maximum snow depth and Water Content and snow Cover duration
maximum snow depth and water content and snow cover duration
Snowmeasurementshavebeencollectedweeklyat21locationsattheHBEFforvarioustimeperiods.Snowdepthandwatercontentaremeasuredat“snowcourses”thatarelocatedundertheforestcanopyadjacenttoselectraingages.A“snowcourse”consistsofatransectof10pointsspacedat2-mintervals.Eachweek,snowdepthisrecordedateachpointandacoreofthesnowpackiscollectedandweighedtodeterminesnowwatercontent.Thefollowingweek,anundisturbedparalleltransect,2-mfromtheprevioustransect,isused.Meanannualmaximumsnowdepthforthe50-yearrecordatStation2is726mmandmeanannualmaximumsnowwatercontentis189mm.OnaveragecontinuoussnowcoverlastsfromDecember25toApril16,atotalof112days.Despitehighinterannualvariability,therehavebeenslight,butstatisticallysignificantlong-term

16
Snowcoresarecollectedandweighedtomeasurethewatercontentofsnow.Photographs:U.S.ForestServiceArchives
declinesinsnowdepth(Mann-Kendalltest,p=0.04),watercontent(p=0.03)andsnowcoverduration(p=0.04).Overthe50-yearrecord,onaverage,meanannualmaximumsnowdepthhasdecreasedby243mm,snowwaterequivalenceby65mmandsnowcoverdurationby23days.ThesetrendsforsnowareconsistentwithotherindicatorsofclimatechangeattheHBEF.
Principal Investigators: JohnL.Campbell,U.S.ForestServiceAmeyS.Bailey,U.S.ForestServiceChristopherEagar,U.S.ForestService
Online Access:Snowdepth–http://www.hubbardbrook.org/data/dataset.php?id=27Snowwaterequivalence–http://www.hubbardbrook.org/data/dataset.php?id=28
Associated Databases: Airtemperature,soilfrost
Further Reading:Bailey,A.S.;Hornbeck,J.W.;Campbell,J.L.;Eagar,C.2003.Hydrometeorological database for Hubbard Brook Experimental Forest: 1955-2000.Gen.Tech.Rep.NE-305.NewtonSquare,PA:U.S.DepartmentofAgriculture,ForestService,NortheasternResearchStation.36p.

17
days of ice cover for mirror lake
MirrorLake(area,15ha;max.depth,11m)islocatedwithintheHubbardBrookValleyandhasbeenthesubjectofnumerouscontinuouslimnologicalinvestigationssincetheearly1960s.RoutinemeasurementsoficecoveronMirrorLakebeganin1967;however,theexactdateofonset(icein)in1967isuncertainsotherecordshownherebeginsin1968.Datesforiceinanddissipation(iceout)oficecoverhavebeenrecordedusingcriteriathathavebeenfollowedfaithfullysincethebeginningofthestudy.Thedateoficeinistakenwhenmorethan50percentofthelakesurfaceiscoveredwithiceandremainscovered.Thedateoficeoutistakenwhenmorethan50percentofthelakesurfaceisopenwaterandthelake’ssurfacedoesnotrefreeze.Thelong-termtrendinicecovereddays(numberofdaysbetweeniceinandiceout)showsanoveralldeclineofabout0.5daysperyearduringthelong-termrecord.TheiceoutdateisinAprilandhasbeenoccurringsignificantlyearlieronaverage,whereastherehasbeennosignificantchangeintheiceindate.TheearliericeoutdateinAprilwithtimeforMirrorLakeiscorrelatedwithincreasedaverageairtemperaturesinApril.Thispatternisconsistentwiththepatternofglobalwarming,buttheinterannualvariabilityislargeandmostofthesignificantchangeoccurredbefore1985.FigureadaptedfromLikens(2000).
Figure 8. days of ice cover for mirror lake from 1968 to 2004.
days of ice Cover for mirror lake

18
Principal Investigator: GeneE.Likens,InstituteofEcosystemStudies
Online Access:MirrorLakeicecover-http://www.hubbardbrook.org/data/dataset.php?id=118
Associated Databases: Airtemperature,MirrorLakethermalprofiles
Further Reading:Likens,G.E.2000.A long-term record of ice-cover for Mirror Lake, New Hampshire: Effects of global warming?VerhandlungenInternationaleVereinigungfürtheoretischeundangewandteLimnologie.27:2765-2769.
IceoutatMirrorLake.PhotographbyDonaldBuso

19
Chloride in mirror lake
Figure 9. Chloride concentrations at the northeast inlet to mirror lake and at the mirror lake outlet.
CHemiCal measurements
Chloride in mirror lake
TheincreaseinchlorideconcentrationsatthenortheastinletandMirrorLakeoutletiscausedprimarilybyrunoffofroadsaltusedtode-iceInterstate93(I-93).MuchoftheroadsaltistransportedtoMirrorLakeviathenortheastinletstream,whichprovidesapproximately30-50percentofallthechloridetothelakebutonlyasmallfractionoftotalstreamflow(2percent).Chlorideconcentrationsatthenortheastinletbegantoincreasein1970,whenI-93opened,despitetheinstallationofanearthendiversiondam.Thedecreaseinconcentrationsin1995-96waslikelyduetodilutionfromhigherthanusualprecipitation.After2000,furtherdeclinesresultedfrominstallingaplasticlineradjacenttothehighwaytodivertcontaminatedrunoffawayfromthelake.Unlikethenortheastinlet,chlorideconcentrationsatthelakeoutlethavecontinuedtoincreasebecauseofsmallincreasesinsaltuseonlocalroadswithinthewestandnorthwestinletstothelake,whichcarry47percentofthewaterinflow.

�0
MirrorLakeanditsgagedoutlet.Photographs:(left)U.S.ForestServiceArchives,
and(right)JudyBrown
Principal Investigator: GeneE.Likens,InstituteofEcosystemStudies
Online Access:MirrorLakenortheastinletchemistry–http://www.hubbardbrook.org/data/dataset.php?id=87
MirrorLakeoutletchemistry–http://www.hubbardbrook.org/data/dataset.php?id=86
Associated Databases: ChemistryofMirrorLakewatercolumn,westinlet,northwestinlet
Further Reading:Bormann,F.H.;Likens,G.E.1985.Air and watershed management and the aquatic ecosystem.In:Likens,G.E.,ed.Anecosystemapproachtoaquaticecology:MirrorLakeanditsenvironment.NewYork:Springer-Verlag:436-444.
Rosenberry,D.O.;Bukaveckas,P.A.;Buso,D.C.;Likens,G.E.;Shapiro,A.M.;Winter,T.C.1999.Movement of road salt to a small New Hampshire lake.Water,Air,andSoilPollution.109:179-206.

��
Figure 10. sulfur dioxide emissions versus sulfate concentrations in precipitation and stream water.
sulfur dioxide emissions versus sulfate Concentrations
sulfur dioxide emissions versus sulfate concentrations
Inthenationaldebateaboutacidrainduringthe1980s,therewasinsufficientdatatoshowhowsulfuremittedtotheatmospherefrompollutionsourcesisrelatedtosulfurconcentrationsinprecipitationandstreamwater.Sincethattime,therehavebeenimprovementsinthemethodsfordeterminingthequantityofsulfuremittedtotheatmosphereandtherearenowlongerrecordsofweeklyprecipitationandstreamwaterchemistrydataattheHBEF.ThesefactorshavemadeitpossibletoshowthatthereisastrongsignificantrelationshipbetweensulfurdioxideemissionsfromsourceareasintheUnitedStatesandCanadaandsulfateconcentrationsinbulkprecipitationattheHBEF.Long-termdata(1965-2003)fromtheHBEFshowthatreducingemissionsofsulfurdioxidedecreasestheconcentrationofsulfateinbulkprecipitation,ultimatelyreducingsulfateconcentrationsinstreamwater.FigureadaptedfromLikensetal.(2002).

��
Principal Investigator: GeneE.Likens,InstituteofEcosystemStudies
Online Access:Streamwaterchemistry(W6)–http://www.hubbardbrook.org/data/dataset.php?id=8Bulkprecipitationchemistry(W6)–http://www.hubbardbrook.org/data/dataset.php?id=20
Associated Databases: Streamwaterchemistry(W1-5,andW7-9),Bulkprecipitationchemistry(W1-5,andW7-9)
Further Reading:Likens,G.E.;Buso,D.C.;Butler,T.J.2005.Long-term relationships between SO
2 and
NOX emissions and SO
42- and NO
3- concentration in bulk deposition at the Hubbard
Brook Experimental Forest, New Hampshire.JournalofEnvironmentalMonitoring.7:964-968.
Likens,G.E.;Driscoll,C.T.;Buso,D.C.;Mitchell,M.J.;Lovett,G.M.;Bailey,S.W.;Siccama,T.G.;Reiners,W.A.;Alewell,C.2002.The biogeochemistry of sulfur at Hubbard Brook.Biogeochemistry.60:235-316.
Samplingprecipitationchemistry.Photograph:HubbardBrookResearch
FoundationArchives

��
Figure 11. stream water concentrations of base cations, sulfate and nitrate, and pH at W6.
stream Water Concentrations of Base Cations, sulfate and nitrate, and pH
stream water concentrations of base cations, sulfate and nitrate, and pH
Streamwaterchemistryhasbeenmonitoredattheoutletofthebiogeochemicalreferencewatershed(W6)since1963.Declinesinstreamwatersulfateduringthistimehavecoincidedwithdecreasesinatmosphericdepositionofsulfur.Duringthelast35years,nitrateconcentrationshavealsodeclinedinstreamwater.However,thetrendinstreamwaternitratehasnotbeenclearlylinkedtoatmosphericnitrogendeposition,andthecauseofthetrendisnotyetwellestablished.TherecenttrendofdecreasingnitrateinW6wasinterruptedbytwononcatastrophicdisturbanceevents:asoilfreezingeventin1989andanicestormin1998.Declinesinnitrateandsulfatehavebeenbalancedtosomedegreebydeclinesinconcentrationsofbasecations.ThepHofstreamwaterhasincreasedslightlyasstreamsrecoverfromacidicdeposition.However,recoveryhasbeenslowerthananticipatedbecausebasecationshavebeendepletedfromthesoilduetoacidicdepositionandtoalesserextent,areductioninatmosphericinputsofbasecations.Additionally,yearsofhighsulfurdepositionhavecausedsulfurtoaccumulateinthesoil,whichisnowbeingreleasedtosurfacewatersassulfate.Theslowrecoveryresponsedemonstratestheneedforlong-termmeasurements.FigureadaptedfromLikensetal.(1996).
0
20
40
60
80
100
120
140
160
4.7
4.8
4.9
5.0
5.1
Water year
pH
C
on
cen
trat
ion
(µeq
/L)
1960 1965 1970 1975 1980 1985 1990 1995 2000 2005

��
SamplingstreamsforchemicalanalysesPhotograph:HubbardBrookResearchFoundationArchives
Principal Investigator: GeneE.Likens,InstituteofEcosystemStudies
Online Access:Streamwaterchemistry(W6)–http://www.hubbardbrook.org/data/dataset.php?id=8
Associated Databases: Streamwaterchemistry(W1-5,andW7-9)
Further Reading:Likens,G.E.;Driscoll,C.T.;Buso,D.C.1996.Long-term effects of acid rain: response and recovery of a forest ecosystem. Science.272:244-246.
Likens,G.E.;Driscoll,C.T.;Buso,D.C.;Mitchell,M.J.;Lovett,G.M.;Bailey,S.W.;Siccama,T.G.;Reiners,W.A.;Alewell,C.2002.The biogeochemistry of sulfur at Hubbard Brook. Biogeochemistry.60:235-316.
Likens,G.E.;Driscoll,C.T.;Buso,D.C.;Siccama,T.G.;Johnson,C.E.;Lovett,G.M.;Fahey,T.J.;Reiners,W.A.;Ryan,D.F.;Martin,C.W.;Bailey,S.W.1998.The biogeochemistry of calcium at Hubbard Brook.Biogeochemistry.41:89-173.
Driscoll,C.T.;Lawrence,G.B.;Bulger,A.J.;Butler,T.J.;Cronan,C.S.;Eagar,C.;Lambert,K.F.;Likens,G.E.;Stoddard,J.L.;Weathers,K.C.2001.Acidic deposition in the northeastern United States: Sources and inputs, ecosystem effects, and management strategies.BioScience.51:180-198.

�5
Concentrations of forms of aluminum in soil solutions
Shownaretwoformsofdissolvedaluminuminsoilwaters:totaldissolvedaluminumandorganicaluminum.Thedifferencebetweentotaldissolvedandorganicaluminumrepresentstheinorganicformofdissolvedaluminum.Dissolvedinorganicaluminumisconsideredtobetoxicathighconcentrations.Organicaluminumisconsideredtobelesstoxic.Figure12showstrendsinaluminuminforestfloor(Oahorizon)andlowermineralsoil(Bshorizon)solutions.Themobilizationofaluminumisaconsequenceofinputsofacidicdepositiontoforestsoils.Insoilsolutionsdrainingtheupperorganichorizon,aluminumislargelyinthenontoxicorganicform.Inthemineralsoil,toxicinorganicaluminumismobilizedandisultimatelytransportedtostreams.Shownare
Concentrations of Forms of aluminum in soil solutions
Figure 12. Concentrations of total dissolved and organic aluminum in soil solutions at the high elevation hardwood zone in W6.

26
soilsolutionscollectedinthehighelevationhardwoodzone.ThisisanareaoftheHBEFwhereeffectsofacidicdepositiononsoilsaregreatest.Overthelongterm,concentrationsofbothformsofaluminumhavedecreased,consistentwithdeclinesininputsofacidicdepositiontotheHBEF.
Principal Investigator: CharlesT.Driscoll,SyracuseUniversity
Online Access:Soilsolutionchemistry(W6)–http://www.hubbardbrook.org/data/dataset.php?id=62
Associated Databases: Precipitationandstreamwaterchemistry(W6)
Further Reading:Driscoll,C.T.;vanBreemen,N.;Mulder,J.1985.Aluminum chemistry in a forested Spodosol.SoilScienceSocietyAmericaJournal.49:437-444.
Lawrence,G.B.;Fuller,R.D.;Driscoll,C.T.1986.Spatial relationships of aluminum chemistry in the streams of the Hubbard Brook Experimental Forest, New Hampshire.Biogeochemistry.2:115-135.
Driscoll,C.T.;Johnson,N.M.;Likens,G.E.;Feller,M.C.1988.The effects of acidic deposition on stream water chemistry: a comparison between Hubbard Brook, New Hampshire and Jamieson Creek, British Columbia.WaterResourcesResearch.24:195-200.
Lawrence,G.B.;Driscoll,C.T.;Fuller,R.D.1988.Hydrologic control of aluminum chemistry in an acidic headwater stream. WaterResourcesResearch.24:659-669.
Driscoll,C.T.;Postek,K.M.1995.The chemistry of aluminum in surface waters.In:Sposito,G.,ed.TheEnvironmentalChemistryofAluminum.Chelsea,MI:LewisPublishers:363-418.
Palmer,S.M.;Driscoll,C.T.2002.Acidic deposition. Decline in mobilization of toxic aluminum.Nature.417:242-243.
Palmer,S.M.;Driscoll,C.T.;Johnson,C.E.2004.Long-term trends in soil solution and stream water chemistry at the Hubbard Brook Experimental Forest: relationship with landscape position.Biogeochemistry.68:51-70.

27
lead in precipitation, stream Water, and the Forest Floor
Figure 13. Lead in precipitation, stream water, and the forest floor (±SE).
Lead in precipitation, stream water, and the forest floor
Inthe1970s,thesaleofgasolinecontainingleadadditiveswasrestrictedintheUnitedStatesundertheCleanAirAct.Sincethen,theamountofleademittedtotheatmospherehasdeclinedresultinginlowerconcentrationsofleadinprecipitationandstreamwater.However,despitelowerinputs,leadcontinuestoaccumulateintheforestecosystemattheHBEFduetoextremelylowlossesindrainagewater.Sinceleadwasassumedtohavealongresidencetimeintheforestfloor,thedecliningrateofdepositionwasexpectedtosimplyslowtherateofaccumulation.However,studiesattheHBEFandelsewhereinthenortheasternUnitedStateshaveshownsignificantnetdecreasesintheamountofleadintheforestfloor.Leadnowappearstobeaccumulatinginthemineralsoil.Itisunclearwhatcausedtheincreaseinforestfloorleadin1992attheHBEF;however,itmayberelatedtothehighforestfloororganicmattermassmeasuredinsamplescollectedthatyear.Basedonthesefieldobservations,itisclearthatleadismoremobilethanpreviouslythought,suggestingacontinuedthreatofleadpollutionindrainagewater.

28
Principal Investigator: ChrisE.Johnson,SyracuseUniversityThomasG.Siccama,YaleUniversity
Online Access:
1976forestfloormassandchemistry(W6)–http://www.hubbardbrook.org/data/dataset.php?id=69
1977forestfloormassandchemistry(W6)–http://www.hubbardbrook.org/data/dataset.php?id=70
1978forestfloormassandchemistry(W6)–http://www.hubbardbrook.org/data/dataset.php?id=71
1982forestfloormassandchemistry(W6)–http://www.hubbardbrook.org/data/dataset.php?id=72
1987forestfloormassandchemistry(W6)–http://www.hubbardbrook.org/data/dataset.php?id=73
1992forestfloormassandchemistry(W6)–http://www.hubbardbrook.org/data/dataset.php?id=74
1997forestfloormassandchemistry(W6)–http://www.hubbardbrook.org/data/dataset.php?id=75
Associated Databases: Forestfloormassandchemistry(W1andW5)
Further Reading:Johnson,C.E.;Petras,R.J.1998.Lead and zinc fractionation in a forest Spodosol.SoilScienceSocietyofAmericaJournal.62:782-789.
Johnson,C.E.;Petras,R.J.;April,R.H.;Siccama,T.G.2004.Post-glacial lead dynamics in a forest soil. Water,AirandSoilPollution:Focus.4:579-590.
Johnson,C.E.;Siccama,T.G.;Driscoll,C.T.;Likens,G.E.;Moeller,R.E.1995.Changes in lead biogeochemistry in response to decreasing atmospheric inputs.EcologicalApplications.5:813-822.
Siccama,T.G.;Smith,W.H.1978.Lead accumulation in a northern hardwood forest.EnvironmentalScienceandTechnology.12:593-594.
Smith,W.H.;Siccama,T.G.1981.The Hubbard Brook Ecosystem Study: biogeochemistry of lead in the northern hardwood forest.JournalofEnvironmentalQuality.10:323-333.
Wang,E.X.;Bormann,F.H.;Benoit,G.1995.Evidence of complete retention of atmospheric lead in the soils of northern hardwood forested ecosystems.EnvironmentalScienceandTechnology.29:735-739.
Yanai,R.D.;Ray,D.G.;andSiccama,T.G.2004.Lead reduction and redistribution in the forest floor in New Hampshire northern hardwoods.JournalofEnvironmentalQuality.33:141-148.

29
Forest Floor Carbon and nitrogen
Figure 14. Forest floor carbon and nitrogen (±95 percent confidence interval) at W6.
Forest floor carbon and nitrogen
Theforestfloor(Oi,OeandOahorizons)ofW6hasbeensampledandanalyzedforcarbonandnitrogencontentseventimessince1976.AllsampleswerecollectedfromrandomlyselectedgridcellsinW6,andthesamplingintensitysteadilyincreasedfrom58samplesperyearin1976to100in2002.Samplesfrom1976and1977werecombinedtomakethesamplesizemorecomparabletothoseinlateryears.Overthe25yearsofmonitoring,therehasbeennosignificantchangeineitherthecarbonornitrogencontentoftheforestfloor.Linearregressionanalysisshowsaninsignificantlong-termincreaseof95kgcarbonperha/yrandanincreaseof1.7kgnitrogenperha/yr.Thereisasignificantincreaseinthecarbon:nitrogenratioforthewholeforestfloorover25years,reflectingthegreaterincreaseincarbonrelativetonitrogen.Thoughthechangesinforestfloorcarbonandnitrogencontentsaresubtle,theshiftingcarbon:nitrogenratiosuggeststhattheforestfloorhasbeendynamicoverthe25yearsofrecord.Thischangeinthecarbon:nitrogenratiomaysloworganicmatterdecompositionifsufficientnitrogentosupportmicrobialgrowthcannotbeobtainedfromthedecomposingmaterialorsoilsolution.ForestfloorsamplesarepermanentlystoredinthesamplearchiveatHubbardBrook,alongwithmanyothertypesofsamples,notonlytoconstructlongerrecordsformonitoring,butalsotoapplynewanalyticaltechniquestopreservedsamples.

�0
Theforestflooristhedarkhorizonnearthesurface.Itissampledwithapinblock(below)whichisusedtoextracttheintactorganicmatterforanalyses.Photographs:U.S.ForestServiceArchives
Principal Investigator: StevenP.Hamburg,BrownUniversityThomasG.Siccama,YaleUniversity
Associated Databases: Forestfloormassandchemistry(W1andW5)
Further Reading:Huntington,T.G.;Ryan,D.F.;Hamburg,S.P.1988.Estimating soil nitrogen and carbon pools in a northern hardwood forest ecosystem.SoilScienceSocietyofAmericaJournal.52:1162-1167.
Yanai,R.D.;Stehman,S.V.;Arthur,M.A.;Prescott,C.E.;Friedland,A.J.;SiccamaT.G.;Binkley,D.2003.Detecting change in forest floor carbon.SoilScienceSocietyofAmericaJournal.67:1583-1593.

��
nitrate Concentrations in stream Water
Figure 15. nitrate concentrations in stream water at W2, W4, W5, and W6.
experimental manipulations
nitrate concentrations in stream water
Biologicallyimportantnutrients,suchasnitrogen,areusuallystronglyretainedinnorthernhardwoodforestecosystems.Whennorthernforestecosystemsaredisturbed,however,thenitrogencycleisdisrupted,resultinginhighleachinglossesofnitrate.Thisstreamwaternitrateresponseisdemonstratedbycomparinglong-termtrendsofannualvolume-weightedconcentrationsofnitrateinthereference(W6),andcut(W2devegetationandherbicidetreatment,1965-1968;W4strip-cut,1970-1974;W5clearcut,1983-1984)watersheds.Theincreaseinstreamwaternitrateaftercuttinggenerallyonlylastsafewyearsbecausenitrateisreadilyretainedbyregrowingvegetation.Inadditiontotheseresults,therehavebeensomeunexpectedpatternsinlong-termnitrogenretentiondatafromtheseexperimentallycutwatersheds.Duringthe10to15yearaggradingphaseofW2andW4,inputsofnitrogenwerestronglyretainedandnitrateleachinglosseswerelow.Inrecentyears,thispatternhasshiftedsuchthatnitratelossincutwatershedsexceedsvaluesobservedinthereferencewatershed.Ifthispatternremainsconsistentacrosscutwatersheds,nitrateconcentrationsinW5wouldsoonexceedconcentrationsinthereferencewatershed.Withoutlong-termstudiessuchunexpectedandinterestingfindingswouldnotbediscovered.

��
StreamsamplesarestoredinthearchivebuildingattheHBEFforfutureanalyses.Photographs:(top)U.S.ForestServiceArchives,and(bottom)BuckSleeper
Principal Investigator: GeneE.Likens,InstituteofEcosystemStudies
Online Access:Streamwaterchemistry(W2)-http://www.hubbardbrook.org/data/dataset.php?id=4Streamwaterchemistry(W4)-http://www.hubbardbrook.org/data/dataset.php?id=6Streamwaterchemistry(W5)-http://www.hubbardbrook.org/data/dataset.php?id=7Streamwaterchemistry(W6)-http://www.hubbardbrook.org/data/dataset.php?id=8
Associated Databases: Streamwaterchemistry(W1,W3andW7-9)
Further Reading:Bormann,F.H.;Likens,G.E.;Fisher,D.W.;Pierce,R.S.1968.Nutrient loss accelerated by clear-cutting of a forest ecosystem.Science.159:882-884.
Likens,G.E.;Bormann,F.H.;Johnson,N.M.;Fisher,D.W.;Pierce,R.S.1970. Effects of forest cutting and herbicide treatment on nutrient budgets in the Hubbard Brook watershed-ecosystem.EcologicalMonographs.40:23-47.
Pardo,L.H.;Driscoll,C.T.;Likens,G.E.1995.Patterns of nitrate loss from a chronosequence of clear-cut watersheds.Water,Air,andSoilPollution.85:1659-1664.

��
Whole-tree Harvest effects on soil exchangeable Calcium
Figure 16. Whole-tree harvest effects on soil exchangeable calcium at W5.
Whole-tree harvest effects on soil exchangeable calcium
Clearcuttingnorthernhardwoodforeststypicallycausesenhancedexportofmineralnutrients,suchascalcium,indrainagewaters.Whenthesedrainagelossesareaddedtotheamountofnutrientsremovedintimber,thetotalamountofnutrientsremovedfromtheecosystemcanbesubstantial.Thus,changesinsoilchemicalpropertiesafterloggingareimportantindeterminingthelong-termimplicationsofloggingonnutrientavailabilityandsitefertility.Duringthewinterof1983-84,W5wasloggedbyremovingwholetreesgreaterthan5cmd.b.h.Soilexchangeablecalciumwasmeasuredinmineralandorganicsoilbefore(1983)andafter(1986,1991,1998)thewhole-treeharvest.Long-termdatafromthisstudyindicatethatthewhole-treeharvesthadlittleeffectonthetotalpoolofexchangeablecalcium.Inthe15yearssincetheforestwasharvested,thecutdidnotresultinthedepletionofexchangeablecalciumpools,eventhoughaconsiderableamountofcalciumwasremovedfromtheecosystemviaincreasedstreamwaterexportandbiomass.Soilistheprincipalsourceofcalciumintheseforests,andwhole-treeharvestingdoesnotappeartohavemuchofaninfluenceonthisnutrientreserve.Whilethereissomeevidenceofsoilcalciumdepletioninadjacentuncutwatersheds,possiblycausedbyacidicatmosphericdeposition,theeffectsarenotevidentinthesoilexchangeablepooloftheaggradingforestatW5.

��
Whole-treeharvestatW5.Photographs:U.S.ForestServiceArchives
Principal Investigator: ChrisE.Johnson,SyracuseUniversityThomasG.Siccama,YaleUniversity
Associated Databases: Quantitativepitsoilcarbonandnitrogen(W5),Continuousrevegetationsurveydata(W5)
Further Reading:Johnson,C.E.;A.H.Johnson,A.H.;Siccama,T.G.1991.Whole-tree clear-cutting effects on exchangeable cations and soil acidity.SoilScienceSocietyofAmericaJournal.55:502-508.
Johnson,C.E.;Romanowicz,R.B.;Siccama,T.G.1997.Conservation of exchangeable cations after clear-cutting of a northern hardwood forest.CanadianJournalofForestResearch.27:859-868.
Likens,G.E.;Driscoll,C.T.;Buso,D.C.;Siccama,T.G.;Johnson,C.E.;Lovett,G.M.;Fahey,T.J.;Reiners,W.A.;Ryan,D.F.;Martin,C.W.;Bailey,S.W.1998.The biogeochemistry of calcium at Hubbard Brook.Biogeochemistry.41:89-173.

�5
Figure 17. Calcium concentrations (±SE) in wood fern fronds at W1 and west of W6.
Calcium Concentration in Wood Fern Fronds
Calcium concentration in wood fern fronds
Woodfern(Dryopteris spinulosa)isthemostabundantherbaceousspeciesattheHBEFcomprisingnearlyhalfofthebiomassofthatstratumofvegetation.Annualwoodfernsamplingbeganin1985usingconsistentmethodsinanareawestoftheweiratW6.EachJuly,frondsarecollectedandanalyzedforseveralelementsincludingcalcium.Intheearly1990s,therewasadeclineinthecalciumconcentrationofwoodfernfronds.ThispatternisconsistentwiththeideathatcalciumisbeingdepletedfromsoilsattheHBEFduetobasecationleachingassociatedwithacidicdeposition.AnexperimentwasconductedinW1designedtoreplacethislostcalcium.Pelletizedwollastonite(CaSiO
3)wasaddedtotheentirewatershedby
aerialapplicationduringthefallof1999.Woodfernwasamongthefirstspeciesofvegetationtoshowacalciumresponse,withfrondconcentrationsincreasingimmediatelyfollowingthewollastoniteaddition.Despitethegeneralpatternsdescribedhere,thereareseveralunexplainedvalues,suchastheextremelyhighconcentrationsatW6in2000and2004.Furthermonitoringwillhelpdeterminewhatcausestheseanomaliesinthelong-termrecord.

36
Woodferns(Dryopteris spinulosa)
Principal Investigator:
ThomasG.Siccama,YaleUniversity
Associated Databases: Temporalcanopyleafchemistry(W1andW6)
Further Reading:Peters,S.C.;Blum,J.D.;Driscoll,C.T.;Likens,G.E.2004.Dissolution of wollastonite during the experimental manipulation of Hubbard Brook Watershed 1.Biogeochemistry.67:309-329.
Siccama,T.G.;Denny,E.2006.Long-term changes in the calcium concentration of wood fern fronds [Online].Availableathttp://www.hubbardbrook.org/yale/misc/ferncycl.htm(accessed29Sept.2006).

37
Figure 18. aboveground biomass at W2 and W5.
aboveground Biomass
aboveground biomass
Abovegroundbiomasshasbeenmeasuredatplotsontwooftheexperimentallyharvestedwatersheds(W2andW5)toexamineregrowthfollowingdisturbance.Watershed2wasdeforestedin1965followedby3successivesummersofherbicidetreatment.Vegetationwasallowedtobeginregrowingin1969andbiomasswasmeasuredinyears1,2,3,5,11,20and31ofregrowth.Watershed5underwentawhole-treeharvestin1984–1985andabovegroundbiomasswasmeasuredinyears2,3,5,7,11,16and21ofregrowth.Thefast-growingpioneerspecies,pincherry,dominatesthevegetationoncutoversitesattheHBEFandresultsinparticularlyhighratesofbiomassaccumulation.Forexample,inthefirst5yearsofregrowth,therateofbiomassaccumulationonW5significantlyexceededthatonnearbyW2,wheretheabundanceofpincherrywasreducedbyrepeatedtreatmentwithherbicides.ReductioninvegetativesproutinganddeclineinsitefertilityduetohighnutrientleachingprobablyalsocontributedtothedifferenceinbiomassaccumulationbetweenW2andW5.Thesedifferencesinvegetationandsoilsassociatedwiththedifferenttreatmentsappeartohavelong-lastingeffects.Duringtheseconddecadeafterdisturbance,ratesofbiomassaccumulationacceleratedonW5comparedtoW2.After21yearsofregrowth,morebiomassaccumulatedonW5thantheamountaccumulatedafter31yearsonW2.FigureadaptedfromFaheyetal.(2005).

38
AggradingforeststandattheHBEF.Photograph:NicholasRodenhouse
Principal Investigators: TimothyJ.Fahey,CornellUniversityWilliamA.Reiners,UniversityofWyomingThomasG.Siccama,YaleUniversity
Online Access:Vegetationrecovery(W2)-http://www.hubbardbrook.org/data/dataset.php?id=521982forestinventory(W5)-http://www.hubbardbrook.org/data/dataset.php?id=361990forestinventory(W5)-http://www.hubbardbrook.org/data/dataset.php?id=371994forestinventory(W5)-http://www.hubbardbrook.org/data/dataset.php?id=381999forestinventory(W5)-http://www.hubbardbrook.org/data/dataset.php?id=39
Associated Databases: Forestinventory(W1,W6,andBirdTransectArea)
Further Reading:Fahey,T.J.;Siccama,T.G.;Driscoll,C.T.;Likens,G.E.;Campbell,J.;Johnson,C.E.;Battles,J.J.;Aber,J.D.;Cole,J.J.;Fisk,M.C.;Groffman,P.M.;Hamburg,S.P.;Holmes,R.T.;Schwarz,P.A.Yanai,R.D.2005.The biogeochemistry of carbon at Hubbard Brook.Biogeochemistry.75:109-176.
JohnsonC.E.;DriscollC.T.;FaheyT.J.;SiccamaT.G.;HughesJ.W.1995.Carbon dynamics following clearcutting of a northern hardwood forest.In:McFeeW.W.;KellyJ.M.(eds),Carbonformsandfunctionsinforestsoils.Madison,WI:AmericanSocietyofAgronomy:463-488.
Likens,G.E.;Bormann,F.H.;Johnson,N.M.;Fisher,D.W.;Pierce,R.S.1970.Effects of forest cutting and herbicide treatment on nutrient budgets in the Hubbard Brook watershed-ecosystem.EcologicalMonographs.40:23-47.
ReinersW.A.1992.Twenty years of ecosystem reorganization following experimental deforestation and regrowth suppression.EcologicalMonographs.62:503-523.

39
Changes in Water Yield after Forest Cutting
Figure 19. Changes in water yield after forest cutting at W2, W4, and W5.
Changes in water yield after forest cutting
Experimentswerecarriedoutonthreeofthegagedwatershedstoexaminetheeffectofforestcuttingonwateryield.Experimentsincludedclear-fellingand3successiveyearsofherbicideapplications(W2),strip-cutting(W4),andwhole-treeharvesting(W5).Responsesinannualwateryieldvariedamongtreatments,butincreasedinitiallyandthendecreasedastheforestregenerated.Theincreaseinwateryieldfollowingthetreatmentswasshort-lived,withthegreatestlossesoccurringatW2wherevegetationregrowthwassuppressedbytheapplicationofherbicides.Unexpecteddecreasesinannualwateryieldswereevidentaftertheclearfellingandherbicidetreatmentandafterthestrip-cuttingtreatment.Thesedecreasesinwateryieldoccurredbecausenewlydevelopingstandsdominatedbypincherryandbircheshavethecapacitytotranspiremorethanmatureforests,leavinglesswateravailableforstreamflow.Interestingly,nosustaineddecreasesinwateryieldoccurredonW5followingthewhole-treeharvest.Severalpossibleexplanationsforthedifferent

�0
responseatW5includealackofregenerationonskidroads,heavymoosebrowsenearthetopofthewatershed,andagreaterproportionofAmericanbeechintheregeneratingforest.Allthesefactorscouldreducetranspirationrateswithoutdecreasingwateryield.
Principal Investigators: JohnL.Campbell,U.S.ForestServiceAmeyS.Bailey,U.S.ForestServiceChristopherEagar,U.S.ForestService
Online Access:Dailystreamflowbywatershed-http://www.hubbardbrook.org/data/dataset.php?id=2
Associated Database: Instantaneousstreamflow
Further Reading:Bailey,A.S.;Hornbeck,J.W.;Campbell,J.L.;Eagar,C.2003.Hydrometeorological database for Hubbard Brook Experimental Forest: 1955-2000.Gen.Tech.Rep.NE-305.NewtonSquare,PA:U.S.DepartmentofAgriculture,ForestService,NortheasternResearchStation.36p.
Hornbeck,J.W.;Martin,C.W.;Eagar,C.1997.Summary of water yield experiments at Hubbard Brook Experimental Forest, New Hampshire.CanadianJournalofForestResearch.27:2043-2052.

��
The use of trade, firm, or corporation names in this publication is for the information and convenience of the reader. Such use does not constitute an official endorsement or approval by the U.S. Department of Agriculture or the Forest Service of any product or service to the exclusion of others that may be suitable.
This publication/database reports research involving pesticides. It does not contain recommendations for their use, nor does it imply that the uses discussed here have been registered. All uses of pesticides must be registered by appropriate State and/or Federal, agencies before they can be recommended.
CAUTION: Pesticides can be injurious to humans, domestic animals, desirable plants, and fish or other wildlife—if they are not handled or applied properly. Use all pesticides selectively and carefully. Follow recommended practices for the disposal of surplus pesticides and pesticide containers.

The U.S. Department of Agriculture (USDA) prohibits discrimination in all its programs and
activities on the basis of race, color, national origin, age, disability, and where applicable, sex,
marital status, familial status, parental status, religion, sexual orientation, genetic information,
political beliefs, reprisal, or because all or part of an individual’s income is derived from any public
assistance program (Not all prohibited bases apply to all programs.) Persons with disabilities who
require alternate means for communication of program information (Braille, large print, audiotape,
etc.) should contact USDA’s TARGET Center at (202) 720-2600 (voice and TDD). To file a
complaint of discrimination, write to USDA, Director, Office of Civil Rights, 1400 Independence
Avenue, S.W., Washington, DC 20250-9410, or call (800)795-3272 (voice) or (202)720-6382
(TDD). USDA is an equal opportunity provider and employer.
Campbell, John L.; Driscoll, Charles T.; Eagar, Christopher; Likens, Gene E.; Siccama, Thomas G.; Johnson, Chris E.; Fahey, Timothy J.; Hamburg,Steven P.; Holmes, Richard T.; Bailey, Amey S.; Buso, Donald C. 2007.Long-term trends from ecosystem research at the Hubbard BrookExperimental Forest. Gen. Tech. Rep. NRS-17. Newtown Square, PA:U.S. Department of Agriculture, Forest Service, Northern ResearchStation. 41 p.
Summarizes 52 years of collaborative, long-term research conducted at the Hubbard Brook (NH) Experimental Forest on ecosystem response to disturbances such as air pollution, climate change, forest disturbance, and forest management practices. Also provides explanations of some of the trends and lists references from scientific literature for further reading.
KEY WORDS: biogeochemistry, disturbance, ecosystem, forestry, lake, soil, stream, trends, watershed.
PRINTED ON RECYCLED PAPER
AbstractThe Hubbard Brook Experimental Forest was established by the U.S. Forest Service in 1955 as a major center for hydrologic research in the Northeast. The Hubbard Brook Ecosystem Study originated 8 years later with the idea of using the small watershed approach to study element flux and cycling and the response of forest ecosystems to disturbance. Since that time, the research program at Hubbard Brook has expanded to include various physical, chemical and biological measurements collected by researchers from a number of cooperating institutions. Collaborative, long-term data are the keystone of the Hubbard Brook Ecosystem Study and have provided invaluable insight into how ecosystems respond to disturbances such as air pollution, climate change, forest disturbance, and forest management practices. This report highlights long-term ecological trends at Hubbard Brook, provides explanations for some of the trends, and lists references from the scientific literature for further reading.
AcknowledgmentsWe would like to thank Kimberley M. Driscoll of Syracuse University for compiling data and developing initial graphs used in this publication. We also thank David Sleeper of the Hubbard Brook Research Foundation for advice and encouragement. The Hubbard Brook Research Foundation provided support for the photography, design, and layout of this report, through a grant from the Northeastern Ecosystem Research Cooperative. This manuscript is a contribution of the Hubbard Brook Ecosystem Study. Hubbard Brook is part of the Long-Term Ecological Research (LTER) network, which is supported by the National Science Foundation. The Hubbard Brook Experimental Forest is operated and maintained by the U.S. Forest Service, Northern Research Station, Newtown Square, Pennsylvania.
The design of this report was done by RavenMark, Inc. of Montpelier, Vermont. Cover photos, top two: U.S. Forest Service Archives. Bottom two: Buck Sleeper. Photographs throughout this report are by Buck Sleeper, unless otherwise noted.
The AuthorsJOHN L.CAMPBELL and CHRISTOPHER EAGAR are research ecologists and AMEY S. BAILEY is a forest technician with the Northern Research Station, Durham, NH. CHARLES T. DRISCOLL is a university professor of environmental systems engineering and CHRIS E. JOHNSON is an associate professor of civil and environmental engineering, Syracuse University, Syracuse, NY. GENE E. LIKENS is an ecologist and distinguished senior scientist of the Institute of Ecosystem Studies, Millbrook, NY. THOMAS G. SICCAMA is a professor emeritus of forest ecology, Yale School of Forestry and Environmental Studies, New Haven, CT. TIMOTHY J. FAHEY is a professor of natural resources, Cornell University, Ithaca, NY. STEVEN P. HAMBURG is Director of the Global Environment Program at the Watson Institute for International Studies, Brown University, Providence, RI. RICHARD T. HOLMES is a professor emeritus of biology, Dartmouth College, Hanover, NH. DONALD C. BUSO is a biologist and manager of field research at the Hubbard Brook Experimental Forest, for the Institute of Ecosystem Studies, Millbrook, NY.
Published by:
USDA FOREST SERVICE11 Campus Blvd., Suite 200Newton Square, PA 19073-3294
October 2007
www.nrs.fs.fed.us
For additional copies:
USDA Forest ServicePublications Distribution359 Main RoadDelaware, OH 43015-8640Fax: (704) 368-0152
Covers.indd 2 10/2/07 5:08:25 PM

Capitalizing on the strengths of existing science capacity in the Northeast and Midwest to attain a more integrated, cohesive, landscape-scale research program