Embed Size (px)
Citation preview

JOURNAL OF GEOPHYSICAL RESEARCH, VOL. ???, XXXX, DOI:10.1029/,
Northern Hemisphere blocking climatology as1
simulated by the CMIP5 models2
Etienne Dunn-Sigouin,1
Seok-Woo Son1
Etienne Dunn-Sigouin, Departement of Atmospheric and Oceanic Sciences, McGill University,
805 rue Sherbrooke Ouest, Montreal, Quebec, Canada. ([email protected])
Seok-Woo Son, Departement of Atmospheric and Oceanic Sciences, McGill University, 805 rue
Sherbrooke Ouest, Montreal, Quebec, Canada. ([email protected])
1Departement of Atmospheric and
Oceanic Sciences, McGill University,
Montreal, Quebec, Canada.
D R A F T August 9, 2012, 5:20am D R A F T

X - 2 DUNN-SIGOUIN AND SON: CMIP5 BLOCKING CLIMATOLOGY
Abstract. Northern Hemisphere (NH) blocking climatology is examined3
using a subset of climate models participating in the Coupled Model Inter-4
Comparison Project phase 5 (CMIP5). Both historical and Representative5
Concentration Pathway (RCP) 8.5 integrations are analzyed to evaluate the6
performance of the CMIP5 models and to identify possible changes in NH7
blocking frequency and duration in a warmer climate. Comparison to reanal-8
ysis data reveals that CMIP5 models can reproduce the NH blocking clima-9
tology reasonably well although the frequency of Euro-Atlantic blockings,10
particularly those with relatively short duration, is underestimated in most11
models during the cold season. In several models, overestimation of the Pa-12
cific blocking frequency is also evident throughout the year. In comparison13
to historical integrations, RCP 8.5 integrations show statistically significant14
decrease in blocking frequency over both the north Pacific and north Atlantic15
regions, with a weak hint of increasing blocking frequency over western Rus-16
sia. This change is clear from autumn to winter, and dominated by changes17
in relatively short-lived blocking events.18
D R A F T August 9, 2012, 5:20am D R A F T
DUNN-SIGOUIN AND SON: CMIP5 BLOCKING CLIMATOLOGY X - 3
1. Introduction
Atmospheric blocking is one of the most dramatic examples of extratropical low-19
frequency variability. Traditionally it refers to a synoptic-scale high pressure system, often20
accompanied by low pressure system(s) at lower latitudes, that remains quasi-stationary21
for days to weeks, interrupting the zonal flow (e.g., Rex 1950). Since blocking highs are22
persistent and quasi-stationary by definition, they affect surface weather and climate in23
a major way. For instance, a blocking high often causes a significant increase in surface24
temperature beneath it and enhanced storm activity around it (e.g., Trigo et al. 2004).25
Striking examples are the 2003 European and 2010 Russian heat waves, that resulted from26
exceptionally long-lasting blocking events. Both of them lead to record breaking surface27
air temperatures and significant increases in mortality rates [Black et al., 2004; Dole et al.,28
2011].29
The crucial role that blocking plays in surface weather (especially in extreme weather)30
has underlined the need for the reliable simulation of blocking events by climate models.31
It is however well documented that climate models often underestimate Northern Hemi-32
sphere (NH) blocking frequency, especially over the North Atlantic and Europe (e.g.,33
D’Andrea et al. 1998; Doblas-Reyes et al. 2002; Scaife et al. 2010; Barriopedro et al.34
2010). While detailed causality is still an active area of research, this underestimation35
has been attributed to the limited model resolution, misrepresentation of surface bound-36
ary conditions and uncertainties in physical parametrizations that lead to the biases in37
the time-mean flow and high-frequency eddies (e.g., Matsueda et al. 2009; Scaife et al.38
2010, 2011).39
D R A F T August 9, 2012, 5:20am D R A F T

X - 4 DUNN-SIGOUIN AND SON: CMIP5 BLOCKING CLIMATOLOGY
Recent studies have shown that the frequency of NH blocking events may decrease in40
the future, in response to global warming. By analyzing CMIP3 models, Barnes and41
Hartmann [2010] and Barnes et al. [2011] documented a statistically significant decrease42
in blocking frequency over both north Pacific and north Atlantic in the 21st century. They43
however found no evidence in blocking duration change. While a similar frequency change44
is also found in model sensitivity tests [Matsueda et al., 2009; Sillmann and Croci-Maspoli,45
2009], different studies show slightly different results in duration change. For example,46
Sillmann and Croci-Maspoli [2009] showed a possible increase in maximum blocking du-47
ration over the Euro-Atlantic region, whereas Matsueda et al. [2009] showed a possible48
reduction in long-lived blocking events.49
It should be noted that, despite of the importance of blocking events, only few studies50
(as listed above) have documented possible changes in blocking activities in a warmer51
climate. As a matter of fact, future projection of NH blocking highs was not commented52
in the Intergovernmental Panel on Climate Change (IPCC) Fourth Assessment Report53
(AR4) (Solomon et al. 2007) which is largely based on the CMIP3 data. This lack of54
documentation partly results from availability of daily data. Although blocking is typically55
examined using 500-hPa geopotential height or upper-tropospheric dynamic fields such56
as potential temperature on the 2-PVU surface or upper-tropospheric PV anomalies,57
these data sets were not archived in the CMIP3 in daily or sub-daily resolution. Of the58
few studies based on CMIP3 models, Barnes et al. [2011] used zonal wind, assuming59
geostrophic balance, to characterize the NH blocking climatology in the CMIP3.60
The primary goal of this study is to examine the NH blocking climatology in the present61
and future climate as simulated by the CMIP5 models. Extending and updating previous62
D R A F T August 9, 2012, 5:20am D R A F T

DUNN-SIGOUIN AND SON: CMIP5 BLOCKING CLIMATOLOGY X - 5
studies, we evaluate state-of-the-art climate models in the context of present-day blocking63
climatology and document the multi-model projection of blocking frequency and duration64
in the 21st century. This goal is achieved by applying a hybrid blocking index [Dunn-65
Sigouin et al., 2012], that is essentially a combination of the two widely-used blocking66
indices, to daily 500-hPa geopotential height fields in both historical and RCP integrations.67
2. Data and Methodology
The model data used in this study are historical and RCP 8.5 runs from a subset of68
climate models participating in the CMIP5 [Taylor et al., 2012]. Briefly, historical runs69
are 20th-century climate integrations with all observed climate forcings. RCP 8.5 runs are70
scenario integrations with a rapid warming, specifically with an anthropogenic radiative71
forcing of 8.5 Wm−2 at 2100. All available models that archived daily geopotential height72
fields are used: i.e., a total of 17 models for historical integrations and 13 models for RCP73
8.5 integrations as of June 2012 (Table 1). If multiple realizations are available, only the74
first ensemble member is considered.75
All model output is first interpolated onto the lowest model resolution, namely 2.8◦76
latitude by 2.8◦ longitude (Table 1). Blocking statistics are then derived using this inter-77
polated data. To minimize the effect of internal variability in climatology, analyses are78
performed for a sufficiently long time period. Specifically, 40 years, 1966-2005 for histori-79
cal runs and 2060-2099 for RCP 8.5 runs, are considered. The performance of the CMIP580
models is first evaluated by comparing the blocking climatology derived from historical81
integrations to that of the National Centers for Atmospheric Prediction (NCEP) and the82
National Center for Atmospheric Research (NCAR) reanalysis (NNR, Kalnay et al. 1996).83
D R A F T August 9, 2012, 5:20am D R A F T

X - 6 DUNN-SIGOUIN AND SON: CMIP5 BLOCKING CLIMATOLOGY
Future changes in blocking activities are then quantified by comparing historical runs with84
RCP 8.5 runs.85
The blocking index employed in this study is a hybrid index which combines the two86
widely-used blocking indices in a simple way [Dunn-Sigouin et al., 2012]. A contiguous87
area of blocking anomalies is first identified from the 500-hPa geopotential height field, as88
in the Dole-Gordon type blocking index [Dole and Gordon, 1983], and then a reversal of the89
meridional gradient of geopotential height, as in the Tibaldi-Molteni type blocking index90
[Tibaldi and Molteni, 1990], is evaluated on the equatorward side of the blocking anomaly91
maximum. The spatio-temporal evolution of the blocking anomalies is assured by tracking92
the amplitude (A), spatial extent (S), overlap between successive days (O) and duration93
(D). The amplitude threshold (A) is set to 1.5 standard deviation of geopotential height94
anomalies over 30◦-90◦N for a 3-month period centered at a given month. The remaining95
threshold values are set to (S)=2.5x10⁶km2, (O)=50% and (D)=5 days, for both NNR96
and CMIP5 data. See Dunn-Sigouin et al. [2012] for the details.97
All results are shown in the multi-model mean. But, to illustrate inter-model differences98
and statistical uncertainty, individual models are also presented in the auxiliary materials.99
3. Blocking climatology
Figure 1a presents NH blocking climatology from 40-year long NNR data (see also100
Dunn-Sigouin et al. 2012). Blocking frequency is shown as the number of days per year a101
blocked area occupies each grid point. As widely documented in the literature, two active102
regions of blocking occurrence emerge: north Pacific (hereafter PA blocking) and Europe-103
northeastern Atlantic (EA blocking). The latter generally exhibits higher frequency than104
the former although the opposite is true during the summer (Fig. 2a). EA blocking also105
D R A F T August 9, 2012, 5:20am D R A F T

DUNN-SIGOUIN AND SON: CMIP5 BLOCKING CLIMATOLOGY X - 7
shows a more zonally-elongated geographical distribution than PA blocking, with a long106
tail to western Russia. In certain seasons, blocking activities over western Russia are107
separated from those over North Atlantic and western Europe (e.g., November in Fig.108
2a), and referred to as Ural blocking, .109
The blocking climatology, derived from 17 CMIP5 historical runs, is illustrated in Figs.110
1b-c. It is evident that the CMIP5 models can reproduce the overall geographical dis-111
tribution of the NH blocking activities reasonably well. Noticeable biases are however112
present in amplitude (Fig. 1c). Most of all, EA blocking frequency is underestimated by113
about 30%. This is common to all the models analyzed in this study (Fig. S1) and con-114
sistent with previous modelling studies (e.g., D’Andrea et al. 1998; Scaife et al. 2010). In115
contrast, PA blocking frequency is overestimated by the models over broad regions. While116
this bias is less robust than EA blocking bias (see shading in Fig. 1 in midlatitudes; see117
also Fig. S1), it is still significant particularly on the poleward side of the climatologi-118
cal blocking frequency maxima. A similar overestimation was also reported in a recent119
study by Dunn-Sigouin et al. [2012] as well as in a few climate models participating in120
the CMIP3 [Scaife et al., 2010].121
The above model biases in blocking frequency might be partly caused by the model122
resolution. It is well known that high-frequency eddy forcing, which is one of the most123
important maintenance mechanisms of blocking highs (e.g., Shutts 1983; Nakamura et al.124
1997), is very sensitive to the model resolution. Matsueda et al. [2009], for instance,125
presented more accurate EA blocking simulation in a higher-resolution model integration.126
However, a direct comparison between IPSL-CM5A-MR and IPSL-CM5A-LR, whose dif-127
ference is only model resolution (Table 1), shows a negligible difference in EA blocking128
D R A F T August 9, 2012, 5:20am D R A F T

X - 8 DUNN-SIGOUIN AND SON: CMIP5 BLOCKING CLIMATOLOGY
frequency (Figs. S1c-d). A moderate increase in horizontal resolution instead leads to129
a slight decrease in EA blocking frequency. This result supports the finding of Scaife130
et al. [2011] that EA blocking frequency is more sensitive to surface boundary condi-131
tions than atmospheric model resolution. Matsueda et al. [2009] further indicated that132
the PA blocking frequency could be overestimated in a high-resolution model integration.133
However, no systematic relationship between PA blocking bias and model resolution is ob-134
served throught the models (Fig. S1). This is largely consistent with Dunn-Sigouin et al.135
[2012] who showed that PA blocking frequency could be overestimated even in a coarse136
resolution model integration where high-frequency eddy activities are underrepresented.137
They suggested that the biases in time-mean flow could result in model biases in blocking138
frequency.139
The seasonal cycles of blocking frequency are illustrated in Fig. 2. It presents the140
evolution of monthly-mean NH blocking frequency as a function of longitude. The number141
of blocking events are simply counted along a given longitude band from 30◦ to 90◦N for142
a given month. The longitudinal distribution of blocking frequency and its seasonality is143
reasonably well reproduced in the multi-model mean (Figs. 2a-b). Underestimation of EA144
blocking frequency is largely confined to the cold season, whereas overestimation of PA145
blocking frequency is found throughout most of the year. It is also found that, although146
the models successfully reproduce the summertime peak in PA blocking, it is delayed by147
a month from August to September.148
Figure 3 shows the number of blocking events as a function of duration. The EA and149
PA blocking events, defined over 0-90◦N and 25◦W-42◦E and 0-90◦N and 151◦E-220◦W,150
respectively, are separately illustrated along with a total number of blocking events over151
D R A F T August 9, 2012, 5:20am D R A F T

DUNN-SIGOUIN AND SON: CMIP5 BLOCKING CLIMATOLOGY X - 9
whole NH. In general, the number of blocking events exhibits an exponential decrease152
with duration (Figs. 3a-b). Comparison of CMIP5 to NNR data, however, reveals that,153
although not statistically significant, short-lived blocking events, duration shorter than 9154
days, are generally underrepresented by the models while long-lived ones are somewhat155
overrepresented (see black bars in Fig. 3c). The bias in short-lived blocking events is156
mostly due to EA blocking events (see blue bars in Fig. 3c). In most durations, PA157
blocking events show overestimation.158
To identify the possible sources of model biases in blocking frequency climatology, high159
frequency eddy fields are further examined in Fig. 4. High-frequency eddy activities are160
quantified by using the standard deviation of 500-hPa geopotential height anomalies with161
periods shorter than 7 days. While the high-frequency eddy activities are in qualitatively162
good agreement with the NNR (Figs. 4a-b), the strength of both north Atlantic and north163
Pacific storm tracks is underestimated in the CMIP5 models (Fig. 4c). This underestima-164
tion is consistent with EA blocking frequency biases (compare Figs. 1c and 4c). However,165
a similar consistency is not found with PA blocking frequency biases. This result suggests166
that the formation and maintenance mechanism(s) of blocking highs may be different over167
the two basins [Tibaldi et al., 1997; Matsueda et al., 2009; Dunn-Sigouin et al., 2012].168
4. Future changes
With model biases described above in hand, this section examines potential changes in169
blocking frequency and duration in a warmer climate. The multi-model mean climatology,170
derived from 40 years (2060-2099) of RCP 8.5 runs, are presented in Fig. 1d and compared171
with its counterpart derived from 40 years of historical runs (1966-2005) in Fig. 1e.172
D R A F T August 9, 2012, 5:20am D R A F T

X - 10 DUNN-SIGOUIN AND SON: CMIP5 BLOCKING CLIMATOLOGY
Only 13 models, that have both historical and RCP 8.5 runs, are used to make a direct173
comparison.174
The geographical distribution of blocking frequency in the future climate is quite similar175
to the one in the present climate (Fig. 1d). However, blocking frequency in a warmer176
climate is slightly decreased over the northeastern Pacific and northwestern Atlantic (Fig.177
1e). While the decrease is rather weak, it is robustly found in several models (Fig. S5).178
This result agrees with previous findings [Matsueda et al., 2009; Sillmann and Croci-179
Maspoli, 2009; Barnes et al., 2011], and is consistent with high-frequency eddy changes180
which are predicted to be weakened upstream of the north Atlantic and north Pacific181
blocking regions (Figs. 4d-e).182
In contrast to blocking frequency changes over the north Pacific and north Atlantic,183
blocking frequency over eastern Europe-Russia is predicted to increase in the future.184
This increase of the so-called Ural blocking frequency is relatively weak and not quite185
robust across the models (Fig. 1e). However, a general tendency is observed in a number186
of models (Fig. S5). In some models (e.g., HadGEM2-CC), the Ural blocking frequency187
change is statistically significant and even larger than PA blocking frequency change. The188
increased high-frequency eddy activities upstream of the Ural region in a warm climate189
(Fig. 4e) further supports the potential increase in Ural blocking frequency.190
The seasonal cycle of the NH blocking activities in the RCP 8.5 runs is compared with191
their historical counterparts in Figs. 2d-e. Again, overall geographical distribution and192
seasonality are quite similar to those in the present climate. It is further found that the193
reduced blocking frequencies observed over the north Pacific and north Atlantic occur194
primarily during the fall and winter seasons, although they extend into spring over the195
D R A F T August 9, 2012, 5:20am D R A F T

DUNN-SIGOUIN AND SON: CMIP5 BLOCKING CLIMATOLOGY X - 11
north Pacific (see also Fig. S6). Figures 3d-e presents blocking frequency change as a196
function of duration. A decrease in number of blocking events is found in all durations,197
with a larger decrease in shorter-lived blocking events. Although statistically insignificant,198
this result may suggest that the mean duration of individual blocking events would slightly199
decrease in a warmer climate.200
5. Conclusions
This study examines the NH blocking climatology as simulated by the CMIP5 models.201
Both historical and RCP 8.5 runs are examined to evaluate the performance of the CMIP5202
models in comparison to NNR and to identify possible changes in blocking frequency and203
duration in a warmer climate.204
Comparison to reanalysis data reveals that the CMIP5 models can reproduce the NH205
blocking climatology reasonably well. It is however found that the EA blocking frequency206
is generally underestimated in most models during the cold seasons. This is mostly due207
to the short-lived blocking events with duration shorter than 9 days. In contrast, the208
PA blocking frequency is largely overestimated throughout the year for almost all dura-209
tions. Although this result contrasts to previous modelling studies which have typically210
documented underestimation of the blocking frequency over both the north Pacific and211
Atlantic in a moderate-resolution climate model integration (e.g., D’Andrea et al. 1998;212
Doblas-Reyes et al. 2002; Matsueda et al. 2009; Barriopedro et al. 2010), a similar result213
is documented for the latest operational model [Dunn-Sigouin et al., 2012], and for certain214
models participating in the CMIP3 [Scaife et al., 2010].215
In comparison to historical integrations, the RCP8.5 integrations show a weak hint of216
reduced blocking frequency over the north Pacific and north Atlantic especially during the217
D R A F T August 9, 2012, 5:20am D R A F T

X - 12 DUNN-SIGOUIN AND SON: CMIP5 BLOCKING CLIMATOLOGY
fall and winter. This result largely confirms previous findings that are based on different218
data and different blocking indices [Matsueda et al., 2009; Sillmann and Croci-Maspoli,219
2009; Barnes and Hartmann, 2010; Barnes et al., 2011]. In contrast to north Pacific220
and north Atlantic blocking events, blocking events over eastern Europe and Russia, the221
so-called Ural blocking, are predicted to marginally increase in a warmer climate.222
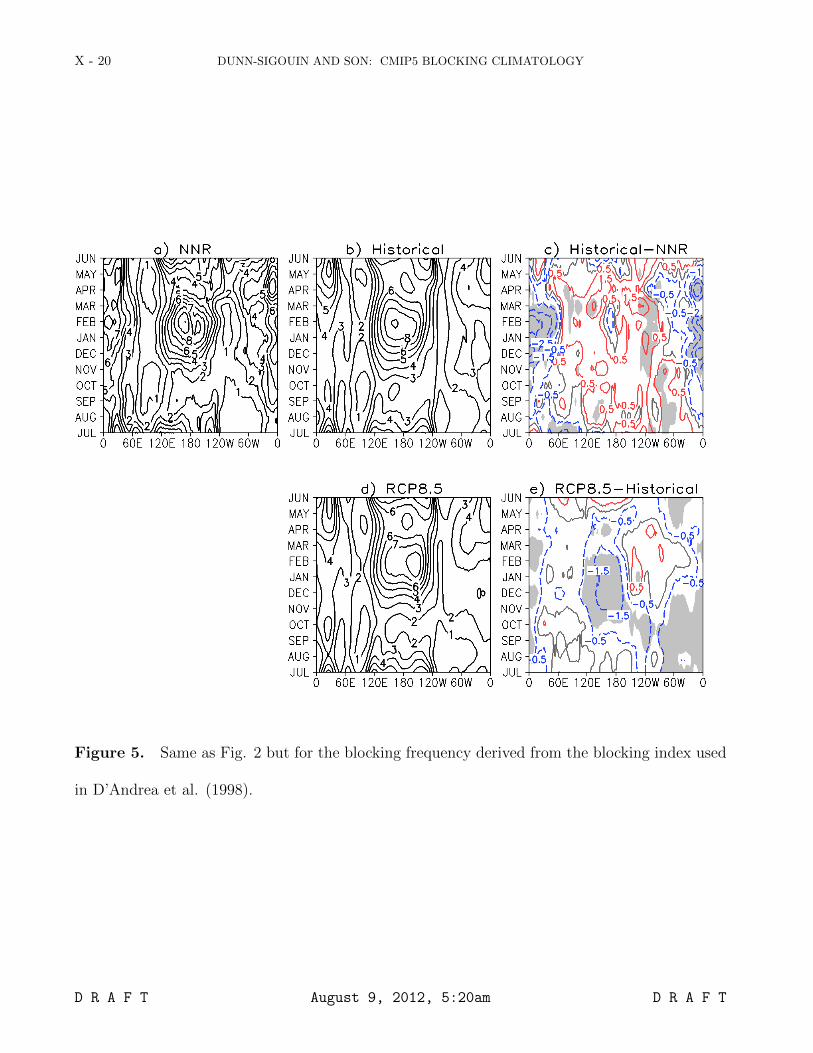
Here it should be noted that the results presented in this study are largely insensitive223
to the horizontal interpolation. Although not shown, quantitatively similar results are224
found with raw data. Overall results, however, could be sensitive to the choice of blocking225
index. As an example, Fig. 5 presents the blocking climatology derived from the TM-type226
blocking index [D’Andrea et al., 1998]. While model bias and future projection of the NH227
blocking frequency are qualitatively similar to those presented in this study (compare228
Figs. 2c and 5c, and Figs. 2e and 5e), the detailed spatial distribution and seasonal229
cycles are quantitatively different. This indicates that different blocking index could lead230
to quantitatively (or even qualitatively) different results in blocking climatology and its231
relationship with regional climate systems. Further analyses are needed.232
The causes of model biases and possible reasons of future blocking changes are not233
explicitly addressed in this study. While detailed analyses are needed, preliminary results234
indicate that underestimation of blocking frequency over the Euro-Atlantic and a future235
decrease in blocking frequency over the north Atlantic and north Pacific are consistent236
with changes in upstream high-frequency eddy activities. In most CMIP5 models, high-237
frequency eddy activities are underrepresented in the present climate integrations and are238
predicted to be weakened in the future over the two basins. A similar consistency between239
D R A F T August 9, 2012, 5:20am D R A F T

DUNN-SIGOUIN AND SON: CMIP5 BLOCKING CLIMATOLOGY X - 13
high-frequency eddy activities and north Pacific blocking frequency biases, however, is not240
observed.241
Acknowledgments. We acknowledge the World Climate Research Programme’s242
Working Group on Coupled Modelling, which is responsible for CMIP, and we thank243
the climate modeling groups (listed in Table 1 of this paper) for producing and mak-244
ing available their model output. For CMIP the U.S. Department of Energy’s Program245
for Climate Model Diagnosis and Intercomparison provides coordinating support and led246
development of software infrastructure in partnership with the Global Organization for247
Earth System Science Portals.248
References
Barnes, E. A. and D. L. Hartmann, 2010: Influence of eddy-driven jet latitude on North249
Atlantic jet persistence and blocking frequency in CMIP3 integrations. Geophys. Res.250
Lett., 37, doi:10.1029/2010GL045700.251
Barnes, E. A., J. Slingo, and T. Woollings, 2011: A methodology for the comparison of252
blocking climatologies across indices, models and climate scenarios. Clim. Dynam., 23,253
1–15.254
Barriopedro, D., R. Garcia-Herrera, and R. M. Trigo, 2010: Application of blocking255
diagnosis methods to General Circulation Models. part I: a novel detection scheme.256
Clim. Dynam., 35, 1373–1391.257
Black, E., M. Blackburn, G. Harrison, B. Hoskins, and J. Methven, 2004: Factors con-258
tributing to the summer 2003 European heatwave. Weather, 59, 217–223.259
D R A F T August 9, 2012, 5:20am D R A F T

X - 14 DUNN-SIGOUIN AND SON: CMIP5 BLOCKING CLIMATOLOGY
D’Andrea, F., et al., 1998: Northern Hemisphere atmospheric blocking as simulated by260
15 atmospheric general circulation models in the period 1979-1988. Clim. Dynam., 14,261
385–407.262
Doblas-Reyes, F., M. Casado, and M. Pastor, 2002: Sensitivity of the Northern263
Hemisphere blocking frequency to the detection index. J. Geophys. Res., 107, doi:264
10.1029/2000JD000290.265
Dole, R. and N. Gordon, 1983: Persistent anomalies of the extratropical Northern Hemi-266
sphere wintertime circulation - geographical-distribution and regional persistence char-267
acteristics. Mon. Wea. Rev., 111, 1567–1586.268
Dole, R., et al., 2011: Was there a basis for anticipating the 2010 Russian heat wave?269
Geophys. Res. Lett., 38, doi:10.1029/2010GL046582.270
Dunn-Sigouin, E., S.-W. Son, and H. Lin, 2012: Evaluation of Northern Hemisphere271
blocking climatology in the Global Environment Multiscale (GEM) model. Mon. Wea.272
Rev., in press.273
Kalnay, E., et al., 1996: The NCEP/NCAR 40-year reanalysis project. Bull. Amer. Me-274
teor. Soc., 77, 437–471.275
Matsueda, M., R. Mizuta, and S. Kusunoki, 2009: Future change in wintertime atmo-276
spheric blocking simulated using a 20-km-mesh atmospheric global circulation model.277
J. Geophys. Res., 114, doi:10.1029/2009JD011919.278
Nakamura, H., M. Nakamura, and J. Anderson, 1997: The role of high- and low-frequency279
dynamics in blocking formation. Mon. Wea. Rev., 125, 2074–2093.280
Rex, D. F., 1950: Blocking action in the middle troposphere and its effect upon regional281
climate. part 2: The climatology of blocking action. Tellus, 2, 275–301.282
D R A F T August 9, 2012, 5:20am D R A F T

DUNN-SIGOUIN AND SON: CMIP5 BLOCKING CLIMATOLOGY X - 15
Scaife, A. A., T. Woollings, J. Knight, G. Martin, and T. Hinton, 2010: Atmospheric283
blocking and mean biases in climate models. J. Climate, 23, 6143–6152.284
Scaife, A. A., et al., 2011: Improved Atlantic winter blocking in a climate model. Geophys.285
Res. Lett., 38, doi:10.1029/2011GL049573.286
Shutts, G., 1983: The propagation of eddies in diffluent jetstreams - eddy vorticity forcing287
of blocking flow-fields. Quart. J. Roy. Meteor. Soc., 109, 737–761.288
Sillmann, J. and M. Croci-Maspoli, 2009: Present and future atmospheric blocking and289
its impact on European mean and extreme climate. Geophys. Res. Lett., 36, doi:290
10.1029/2009GL038259.291
Solomon, S., D. Qin, M. Manning, Z. Chen, M. Marquis, K. B. Averyt, M. Tignor, and292
H. L. Miller, 2007: Climate change 2007 - the physical science basis: Working group I293
contribution to the fourth assessment report of the IPCC. Cambridge University Press.294
Taylor, K. E., R. J. Stouffer, and G. a. Meehl, 2012: A summary of the CMIP5 experiment295
design. Bull. Amer. Meteor. Soc., 93, 485–498.296
Tibaldi, S. and F. Molteni, 1990: On the operational predictability of blocking. Tellus,297
42, 343–365.298
Tibaldi, S., F. DAndrea, E. Tosi, and E. Roeckner, 1997: Climatology of Northern Hemi-299
sphere blocking in the ECHAM model. Clim. Dynam., 13, 649–666.300
Trigo, R., I. Trigo, C. DaCamara, and T. Osborn, 2004: Climate impact of the European301
winter blocking episodes from the NCEP/NCAR Reanalyses. Clim. Dynam., 23, 17–28.302
D R A F T August 9, 2012, 5:20am D R A F T

X - 16 DUNN-SIGOUIN AND SON: CMIP5 BLOCKING CLIMATOLOGY
Figure 1. Climatology of NH annual-mean blocking frequency: (a) NNR, (b) historical multi-
model mean, (c) historical multi-model mean - NNR, (d) RCP 8.5 multi-model mean and (e)
RCP 8.5 - historical multi-model mean. Black and colored contour intervals in (a,b,d) and (c,e)
are 4 days and 2 days, respectively. The grey contour in (c,e) denotes the zero line and shaded
areas denote differences greater than one standard deviation of individual model differences.
D R A F T August 9, 2012, 5:20am D R A F T

DUNN-SIGOUIN AND SON: CMIP5 BLOCKING CLIMATOLOGY X - 17
Figure 2. Seasonal cycle of the NH blocking frequency as a function of longitude: (a) NNR,
(b) historical multi-model mean, (c) historical multi-model mean - NNR, (d) RCP 8.5 multi-
model mean and (e) RCP 8.5 - historical multi-model mean. Black and colored contour intervals
in (a,b,d) and (c,e) are 1 day and 0.5 days per month, respectively. the grey contour in (c,e)
denotes the zero line and shaded areas denote differences greater than one standard deviation of
individual model differences.
D R A F T August 9, 2012, 5:20am D R A F T

X - 18 DUNN-SIGOUIN AND SON: CMIP5 BLOCKING CLIMATOLOGY
Figure 3. Number of blocking events as a function of duration: (a) NNR, (b) historical multi-
model mean, (c) historical multi-model mean - NNR, (d) RCP 8.5 multi-model mean and (e)
RCP 8.5 - historical multi-model mean. Black, blue and red bars denote blocking events over the
NH, the EA and PA sectors, respectively. Shaded bars in (c,e) denote differences greater than
one standard deviation of individual model differences.
D R A F T August 9, 2012, 5:20am D R A F T

DUNN-SIGOUIN AND SON: CMIP5 BLOCKING CLIMATOLOGY X - 19
Figure 4. Climatology of annual-mean standard deviation of 500-hPa high-frequency eddies
with periods shorter than 7 days: (a) NNR, (b) historical multi-model mean, (c) historical multi-
model mean - NNR, (d) RCP 8.5 multi-model mean and (e) RCP 8.5 - historical multi-model
mean. Black and colored contour intervals in (a,b,d) and (c,e) are 10 m and 2 m, respectively.
The grey contour in (c,e) denotes the zero line and shaded areas denote differences greater than
one standard deviation of individual model differences.
D R A F T August 9, 2012, 5:20am D R A F T
X - 20 DUNN-SIGOUIN AND SON: CMIP5 BLOCKING CLIMATOLOGY
Figure 5. Same as Fig. 2 but for the blocking frequency derived from the blocking index used
in D’Andrea et al. (1998).
D R A F T August 9, 2012, 5:20am D R A F T

DUNN-SIGOUIN AND SON: CMIP5 BLOCKING CLIMATOLOGY X - 21
Table 1. Description of CMIP5 models used in this analysis. Resolutions refer to atmospheric
model resolution and horizontal resolution is approximate for spectral models.
Model Group, country Horizontal res. (lat. x lon.) Historicalrun
RCP8.5run
BNU-ESM BNU, China T42L26 (2.8◦x2.8◦) yes yesCanESM2 CCCma, Canada T63L35 (2.8◦x2.8◦) yes yesCMCC-CM CMCC, Italy (0.75◦x0.75◦) yes yesHadGEM2-CC MOHC, UK N96L60 (1.875◦x1.25◦) yes yesIPSL-CM5A-LR IPSL, France (1.875◦x3.75◦) yes yesIPSL-CM5A-MR IPSL, France (1.25◦x2.5◦) yes yesIPSL-CM5B-LR IPSL, France (1.875◦x3.75◦) yes yesMIROC5 CCSR, Japan T85L40 (1.4◦x1.4◦) yes yesMIROC-ESM-CHEM CCSR, Japan T42L80 (2.8◦x2.8◦) yes yesMPI-ESM-LR MPI-M, Germany T63L47 (1.875◦x1.875◦) yes yesMPI-ESM-MR MPI-M, Germany T63L95 (1.875◦x1.875◦) yes yesMRI-CGCM3 MRI, Japan TL159L48 (1.125◦x1.125◦) yes yesNorESM1-M NCC, Norway f19L26 (2.5◦x1.875◦) yes yesBCC-CSM1-1 BCC, China T42L26 (2.8◦x2.8◦) yes noCCSM4 NCAR, US (0.9◦x1.25◦) yes noCNRM-CM5 CNRM, France TL127L31 (1.4◦x1.4◦) yes noMIROC-ESM CCSR, Japan T42L80 (2.8◦x2.8◦) yes no
D R A F T August 9, 2012, 5:20am D R A F T
Northern Hemisphere blocking climatology assimulated by the CMIP5 models
(Auxiliary Material)
Etienne Dunn-Sigouin1 and Seok-Woo Son1
1. Department of Atmospheric and Oceanic Sciences, McGill University, Montreal, Quebec,Canada

Figure S1: Same as Fig. 1c except for individual models. Contour interval is 2 days peryear and shaded areas denote statistically significant differences at the 95 percent confidencelevel using a two-tailed student t-test. Zero lines are omitted.
1

Figure S2: Same as Fig. 2c except for individual models. Contour interval is 1 day per yearand shaded areas denote statistically significant differences at the 95 percent confidence levelusing a two-tailed student t-test. Zero lines are omitted.
2
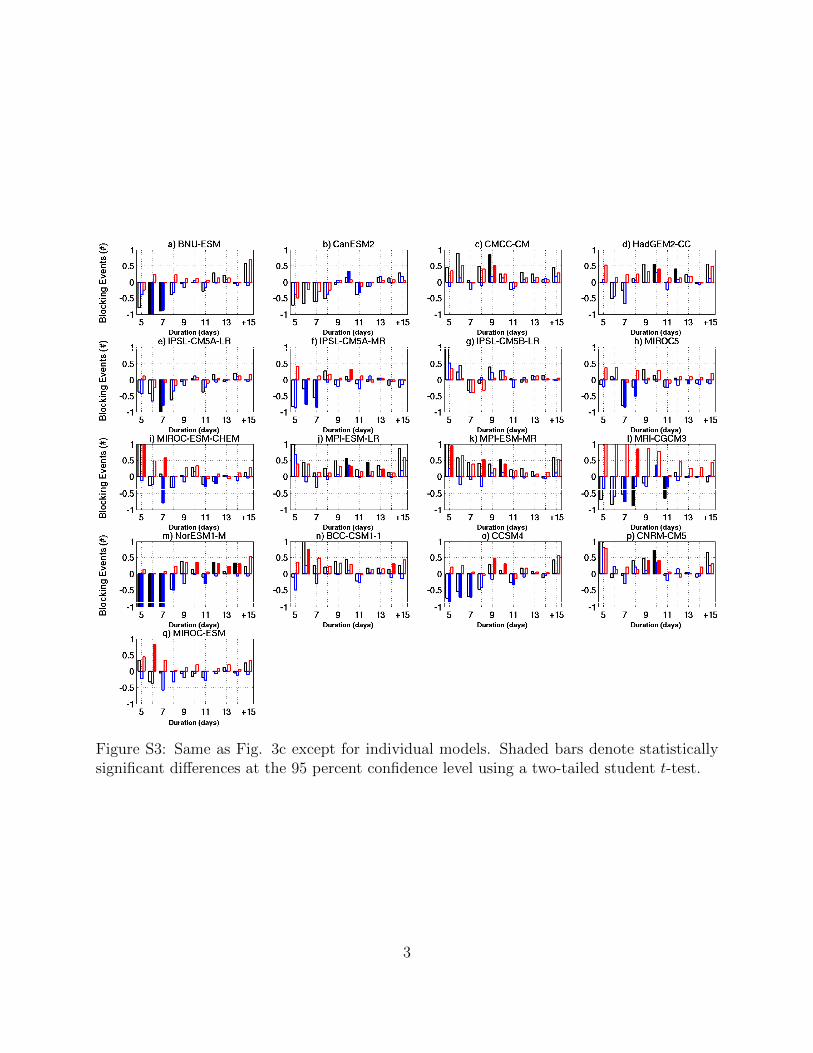
Figure S3: Same as Fig. 3c except for individual models. Shaded bars denote statisticallysignificant differences at the 95 percent confidence level using a two-tailed student t-test.
3
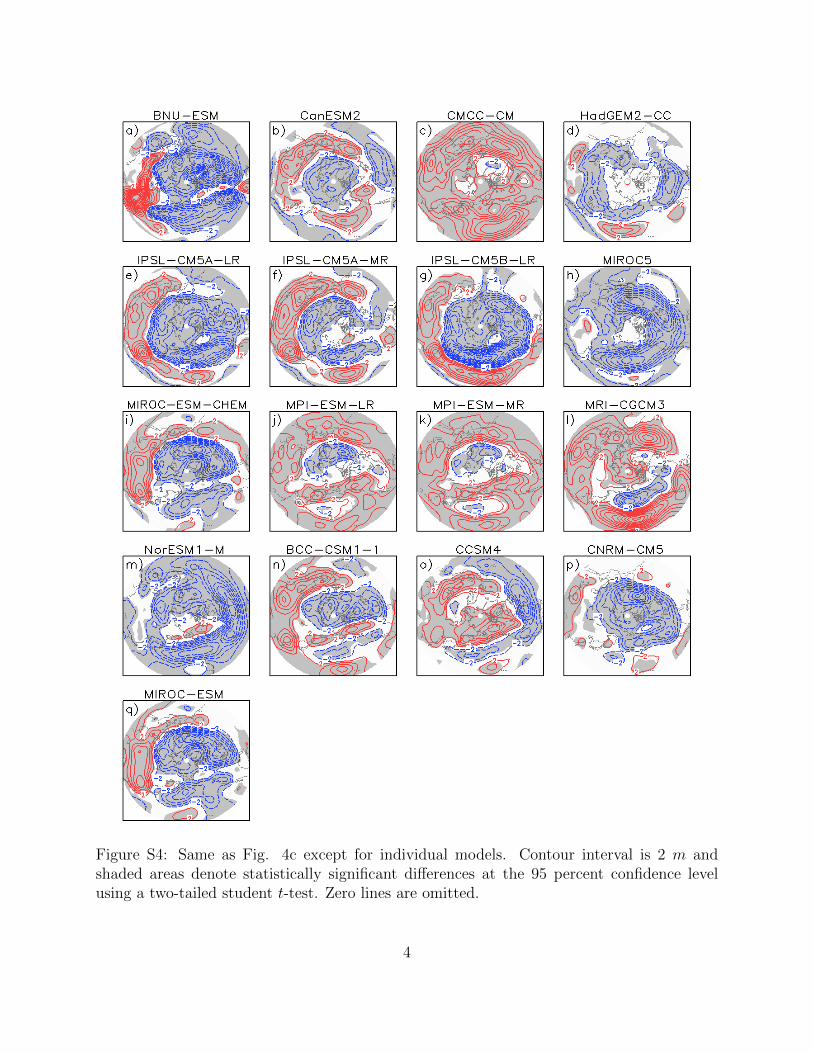
Figure S4: Same as Fig. 4c except for individual models. Contour interval is 2 m andshaded areas denote statistically significant differences at the 95 percent confidence levelusing a two-tailed student t-test. Zero lines are omitted.
4

Figure S5: Same as Fig. 1e except for individual models. Contour interval is 2 days peryear and shaded areas denote statistically significant differences at the 95 percent confidencelevel using a two-tailed student t-test. Zero lines are omitted.
5

Figure S6: Same as Fig. 2e except for individual models. Contour interval is 1 day per yearand shaded areas denote statistically significant differences at the 95 percent confidence levelusing a two-tailed student t-test. Zero lines are omitted.
6

Figure S7: Same as Fig. 3e except for individual models. Shaded bars denote statisticallysignificant differences at the 95 percent confidence level using a two-tailed student t-test.
7

Figure S8: Same as Fig. 4e except for individual models. Contour interval is 2 m andshaded areas denote statistically significant differences at the 95 percent confidence levelusing a two-tailed student t-test. Zero lines are omitted.
8


![Climatology [Autosaved]](https://img.dokumen.tips/doc/110x75/577cd2e91a28ab9e78964bc6/climatology-autosaved.jpg)