Embed Size (px)
Citation preview

Northeast Siberian ice wedges confirm Arctic winter warming over the past two millennia
Article (Accepted Version)
http://sro.sussex.ac.uk
Opel, Thomas, Laepple, Thomas, Meyer, Hanno, Dereviagin, Alexander Yu and Wetterich, Sebastian (2017) Northeast Siberian ice wedges confirm Arctic winter warming over the past two millennia. Holocene, 27 (11). pp. 1789-1796. ISSN 0959-6836
This version is available from Sussex Research Online: http://sro.sussex.ac.uk/id/eprint/68791/
This document is made available in accordance with publisher policies and may differ from the published version or from the version of record. If you wish to cite this item you are advised to consult the publisher’s version. Please see the URL above for details on accessing the published version.
Copyright and reuse: Sussex Research Online is a digital repository of the research output of the University.
Copyright and all moral rights to the version of the paper presented here belong to the individual author(s) and/or other copyright owners. To the extent reasonable and practicable, the material made available in SRO has been checked for eligibility before being made available.
Copies of full text items generally can be reproduced, displayed or performed and given to third parties in any format or medium for personal research or study, educational, or not-for-profit purposes without prior permission or charge, provided that the authors, title and full bibliographic details are credited, a hyperlink and/or URL is given for the original metadata page and the content is not changed in any way.

1
Northeast Siberian ice wedges confirm Arctic winter warming over the past two 1
millennia 2
3
Thomas Opel1,2*, Thomas Laepple1, Hanno Meyer1, Alexander Yu. Dereviagin3, 4
Sebastian Wetterich1 5
1 Alfred Wegener Institute, Helmholtz Centre for Polar and Marine Research, 6
Periglacial Research Section, Telegrafenberg A43, 14473 Potsdam, Germany. 7
2 now at University of Sussex, Department of Geography, Permafrost Laboratory, 8
Brighton, BN1 9RH, United Kingdom 9
3 Moscow State University, Department of Geocryology, Faculty of Geology, 10
Vorob’evy Gory, 119899 Moscow, Russia. 11
* corresponding author: Thomas Opel ([email protected], [email protected] ) 12
13
14
Abstract 15
Arctic climate has experienced major changes over the past millennia that are not fully 16
understood in terms of their controls and seasonality. Stable-data from ice wedges in 17
permafrost provide unique information on past winter climate. Recently, an ice-wedge 18
record from the Lena River Delta suggested for the first time that Siberian winter 19
temperatures increased throughout the Holocene, contradicting most other Arctic 20

2
paleoclimate reconstructions which are likely biased towards the summer. However, the 1
representativeness of this single record and the spatial extent of its reconstructed winter 2
warming signal is unclear. Here, we present a new winter temperature record based on 3
paired stable oxygen (δ18O) and radiocarbon age data spanning the last two millennia 4
from the Oyogos Yar coast in northeast Siberia. The record confirms the long-term 5
winter warming signal as well as the unprecedented temperature rise in recent decades. 6
This confirmation demonstrates that winter warming over the last millennia is a 7
coherent feature in the northeastern Siberian Arctic, supporting the hypothesis of an 8
insolation-driven seasonal Holocene temperature evolution followed by a strong 9
warming likely related to anthropogenic forcing. 10
11
Keywords: Ice wedges, stable water isotopes, permafrost, Siberian Arctic, winter 12
climate reconstruction, Late Holocene, Arctic2k 13
14
Introduction 15
Currently, the Arctic climate faces significant changes, expressed by a rapid warming 16
that is more pronounced than in other regions of the Earth (Serreze and Barry, 2011; 17
PAGES 2k Consortium, 2013). A sharp decrease in sea-ice area and thickness, 18
enhanced melting of glaciers and ice caps, as well as warming and thawing of 19
permafrost illustrate the vulnerability of the Arctic under recent conditions and in 20

3
particular for a predicted future warming (AMAP, 2011). Due to its importance for the 1
global climate system, the Arctic is a key region to study past and recent climate 2
variability and their environmental implications on different spatial, temporal and 3
seasonal scales. 4
The Russian Arctic is underrepresented in Arctic paleoclimate records (Kaufman et al., 5
2009; PAGES 2k Consortium, 2013; McKay and Kaufman, 2014). Most records in the 6
recent PAGES Arctic2k (McKay and Kaufman, 2014) and Arctic Holocene Transitions 7
(Sundqvist et al., 2014) databases are based on biological proxies such as pollen and 8
tree rings, which mainly record summer climate conditions. Hence, the reconstructions 9
are either restricted or biased to summer conditions (Liu et al., 2014). But winter 10
conditions, as obtained from ice wedges, are essential for a comprehensive assessment 11
of past climate. 12
Ice wedges are widespread in permafrost regions and form by thermal contraction 13
cracking in winter and filling of cracks by snow-melt water in spring (Lachenbruch, 14
1962). Due to this seasonality of cracking and filling, the contribution of summer 15
precipitation can be excluded when analysing ice-wedge ice. Ice wedges can be studied 16
using stable water isotopes (Mackay, 1983; Vaikmäe, 1989). As the meltwater in the 17
frost crack refreezes rapidly, the isotopic signature of each resultant ice vein is directly 18
related to atmospheric precipitation, i.e. snowfall in winter and spring, before snowmelt. 19
Therefore, ice-wedge stable isotopes represent the climate conditions during the cold 20

4
period of a year from December to May (Meyer et al., 2015), hereafter referred to as 1
winter. 2
Stable-isotope data from ice wedges have been used to reconstruct past climate in 3
Siberian Arctic permafrost regions on glacial-interglacial timescales (e.g. Meyer et al., 4
2002a; Meyer et al., 2002b; Vasil'chuk and Vasil'chuk, 2014; Wetterich et al., 2011; 5
Wetterich et al., 2014; Wetterich et al., 2016), as well as centennial timescales for the 6
Lateglacial (Meyer et al., 2010) and the Holocene (Meyer et al., 2015). Meyer et al. 7
(2015) suggested a Mid to Late Holocene winter warming trend based on stable-isotope 8
studies of ice wedges in the Russian Arctic Lena River Delta (Figure 1), a remarkable 9
finding given that the majority of paleoclimate records show a cooling trend. 10
To test whether the findings of Meyer et al. (2015) are also valid in a larger region and 11
to test them with independent data, we present a new oxygen-isotope record from ice 12
wedges at the Oyogos Yar coast in the northeast Siberian Arctic, about 570km east of 13
the central Lena River Delta (Figure 1) (Opel et al., 2011). Our record is based on newly 14
available radiocarbon ages of organic matter enclosed in ice-wedge samples used to 15
generate a stacked record based on paired isotope and age information. 16
17
Study region 18
Oyogos Yar is on the southern coast of the Dmitry Laptev Strait in the permafrost 19
lowlands of the northeast (Figure 1). The study site (72.7°N, 143.5°E) is located in a 20

5
vast thermokarst basin that formed due to permafrost degradation of Late Pleistocene 1
Yedoma Ice Complex sequences (Schirrmeister et al., 2011; Opel et al., 2017) during 2
the Lateglacial to Holocene transition (Wetterich et al., 2009). The Oyogos Yar coast is 3
subject to rapid coastal erosion (-6.5 ± 0.2 m a−1) (Günther et al., 2013) that leads to the 4
development of steep coastal bluffs about 10 to 12 m high in the drained thermokarst 5
basins (Figure 1). The thawed and refrozen Yedoma Ice Complex sediments are 6
overlain by 1-2 m of lacustrine deposits that accumulated before the drainage of the 7
former thermokarst lakes. The lacustrine deposits are covered by a distinctive peat 8
horizon ca. 2 to 3 m below the surface and dating to 8 to 9 ky BP (Wetterich et al., 9
2009). In the Late Holocene, palustrine polygonal deposits have capped the sequence 10
and contain syngenetic ice wedges (Opel et al., 2011). 11
12
[insert Figure 1] 13
14
Material and Methods 15
Fieldwork 16
Sampling took place after surveying coastal bluffs (Opel et al., 2011) to identify suitable 17
Late Holocene ice wedges. We cut by chain saw complete horizontal profiles at depths 18
of 1 to 1.5 m below surface in high sampling resolution (2-3 cm) along the growth 19
direction of two ice wedges (Oy7-04 IW2 and Oy7-11 IW1). The samples were melted 20

6
on site and packed for further analysis. A complete horizontal profile of a third ice 1
wedge (Oy7-11 IW7) was cut in blocks that were transported frozen to the cold 2
laboratory for sub-sampling at low (4-6 cm) and high (1 cm) resolution. All three ice 3
wedges were sampled less than 1 km apart. Additionally, we sampled ice veins from 4
recently growing ice wedges (RIW) connected to the modern polygonal surface to 5
capture reference records of modern wedge ice. 6
7
Stable water isotopes 8
To determine the stable-isotope composition, we used a Finnigan-MAT Delta S mass 9
spectrometer with an analytical precision of better than ±0.1‰ for δ18O and ±0.8‰ for 10
δD, respectively (Meyer et al., 2000). The δ18O and δD values of wedge ice are 11
interpreted as proxies for local winter air temperatures (Meyer et al., 2015). The d 12
excess (d=δD-8δ18O) (Dansgaard, 1964) indicates the evaporation conditions in the 13
moisture source region (Merlivat and Jouzel, 1979). However, the involvement of other 14
factors (atmospheric transport, moisture source changes, seasonality effects of frost 15
cracking and snow-cover development) has to be considered. In our analysis we focus 16
on stable oxygen isotopes (δ18O), which are commonly used in Arctic paleoclimate 17
studies and therefore comparable to our record. 18
19
Radiocarbon dating and stacking procedure 20

7
To anchor the stable-isotope information in time, organic remains enclosed in 19 ice-1
wedge samples were radiocarbon-dated using the accelerator mass spectrometry (AMS) 2
facilities at the Leibniz Laboratory (Kiel University, Germany) (Grootes et al., 2004) 3
and CologneAMS (University of Cologne, Germany) (Dewald et al., 2013; Rethemeyer 4
et al., 2013). Conventional 14C ages were calculated according to (Stuiver and Polach, 5
1977) and were calibrated using the tool clam (Blaauw, 2010) with the IntCal13 dataset 6
(Reimer et al., 2013). We report the highest posterior density region (hpd) with its 7
limits, its midpoint and probability (Table 1). All hpd ranges add up to 95%. One post-8
bomb age was determined using the tool CALIbomb (Reimer et al., 2004) with 9
F14C=1.2661±0.005 and post-bomb calibration dataset NHZ1. 10
The age-model construction and stacking procedure follows Meyer et al. (2015). As 11
every ice-wedge sample is dated with a separate 14C measurement and the chronological 12
order between single ice wedges is not determined by their position, age models were 13
constructed by repeated sampling of point estimates from the calibrated distributions of 14
the ages. To account for the effect of the age uncertainty on the proxy time series, 15
10,000 age models were constructed. For every age model a proxy curve was estimated 16
by linearly interpolating the δ18O values between the observed points. Finally, the 50, 17
90 and 99% quantiles of the δ18O distribution for every point in time were calculated 18
and plotted. 19
20

8
Climate model simulations 1
We analysed the monthly surface air temperature fields of seven simulations from five 2
coupled climate models (CCSM4, IPSL-CM5A-LR, MPI-ESM-P, BCC-CSM1-1, 3
GISS-E2-R) participating in the millennium simulations (past1000) of the third 4
Palaeoclimate and the fifth Coupled Modelling Intercomparison Projects (PMIP3: 5
Braconnot et al., 2012; CMIP5: Taylor et al., 2012). The MIROC simulation was 6
omitted because of an unphysical drift over the simulated period. 7
We analysed the winter season, which we expect to be recorded in the ice wedges 8
(DJFMAM), as well as the classical summer season (JJA) to represent the summer-9
biased proxies. We analysed the simulations for the study area (72-73N, 126-144E) and 10
show the multi-model ensemble mean. Time series covering the years 850 to 2005 were 11
constructed by appending the 20C3M simulations to the hist1000 simulations. We 12
corrected for potential offsets between both simulations by aligning the mean of the last 13
years of the hist1000 simulation (1844-1849) with the mean of the first years of the 14
20C3M simulations (1850-1854). 15
16
Results 17
Ice-wedge stable-isotope data 18
We analyzed 485 samples from the three ice wedges; 107 samples from Oy7-04 IW2, 19
123 from Oy7-11 IW1, 210 from Oy7-11 IW7 (high-resolution profile) and 45 from 20

9
Oy7-11 IW7 (low-resolution profile). Additionally, 14 samples from eight RIW were 1
analyzed to represent the most recent ice-wedge rejuvenation stages, i.e. modern ice-2
wedge growth. Near the profile margins, isotopic exchange with enclosing sediments 3
(Meyer et al., 2002a) can alter the isotopic composition. We therefore omitted 26 4
samples from the profile margins that show distinct signs of isotopic alteration, i.e. 5
strongly increased δ18O (Figure 2) and decreased d excess values, from the further 6
analysis. 7
The three ice-wedge δ18O datasets show similar statistical properties independent of ice-8
wedge width or sampling resolution (Figure 2). The minimum δ18O values per ice 9
wedge vary between -27.1 and -26.5‰, the maximum values between -21.6 and -20.7‰ 10
and mean values between -25.1 and -25.0‰. The regression in δ18O-δD co-isotopic 11
plots reveal slopes between 7.6 and 7.7, with intercepts between -2.2 and -0.8 and R2 12
values of 0.99 for each profile. The RIW δ18O data vary between -24.4 and -18.2‰. The 13
mean value of -20.7‰ equals the maximum value of ice wedge Oy7-11 IW7. The co-14
isotopic regression slope is 7.8 and the intercept 3.2 (R2=0.99). The isotopic 15
compositions of Late Holocene and recent ice wedges plot close to the GMWL (Global 16
Meteoric Water Line: δD=8δ18O+10) (Craig, 1961), which suggests that major 17
secondary isotope fractionation effects can be neglected. 18
A common feature of all δ18O profiles is the predominance of low values (-27 to -25‰) 19
in the outer parts of the profiles, i.e. the older ice-wedge sections (Figure 2). In contrast, 20

10
the younger sections in the central parts of the profiles (except for Oy7-11-IW1), exhibit 1
generally higher values δ18O values (above -24‰). The low-resolution profile of ice 2
wedge Oy7-11- IW7 closely resembles the corresponding high-resolution profile 3
(R=0.98, after bringing both to the same resolution). The δ18O maxima of the profiles (-4
21.6 to -20.7‰) correspond to the δ18O values of the respective RIW δ18O values 5
(Figure 2) and are relate directly to (i.e. underlie) the recent ice-wedge rejuvenation 6
stages (Figure 5 in Opel et al., 2011). 7
The ice wedges Oy7-04-IW2 and, in particular, Oy7-11-IW7 show symmetric δ18O 8
profiles with the highest δ18O values and modern ages in the central ice-wedge part as 9
mirror axes (Figure 2). In contrast, ice wedge Oy7-11 IW1 lacks symmetry, indicating 10
peripheral ice-wedge development rather than central frost cracking and growth. 11
12
[insert figure 2] 13
14
Radiocarbon dating 15
Radiocarbon ages cluster in two distinct groups: 14 out of 19 ages are from the last two 16
kyr BP, whereas five ages range from 3.5 to 14 kyr BP (Table 1). The latter ages, which 17
we now discuss in detail, likely represent older reworked organic material and are, 18
therefore, excluded from chronology interpretation. The age of sample Oy7-11-Hy31 19
corresponds to the initiation of the lacustrine phase in the thermokarst basin. Sample 20

11
Oy7-04-247 contained only degraded organic material with very low carbon content 1
(Opel et al., 2011). The ages of the peaty material in samples Oy7-11-138, Oy7-11-162 2
and sample Oy7-11-Hy40 fit well to that of the distinctive peat layer (Wetterich et al., 3
2009) about 1 to 1.5 m below the sampling depth and may therefore originate from this 4
horizon (Opel et al., 2011). Relocation of older material may be caused by the upward 5
bending of sediment layers close to the ice wedges (Figure 1). 6
Generally, younger ages are related to the central ice-wedge parts with higher δ18O 7
values, whereas the outer parts show older ages (Figure 2). Except for one age each in 8
both symmetric profiles, all radiocarbon ages are in “logical chronological order” as 9
implied by the schematic (i.e. central) ice-wedge growth model (Lachenbruch, 1962). 10
11
Stacked δ18O record 12
We used the paired δ18O and calibrated radiocarbon age information of the 14 ice-13
wedge samples from all three ice wedges to generate a stacked δ18O record. We 14
additionally added the mean δ18O value of RIW, related to the period AD2000-2007 that 15
represents the most recent data point. The stacked δ18O record spans roughly two 16
millennia. It exhibits a general increase in δ18O of about 1.5‰ per 1,000 years, with an 17
unprecedented maximum obtained in the most recent samples (Figure 3). 18
19
Discussion 20

12
Oyogos Yar ice-wedge δ18O based climate reconstruction 1
The predominance of ages younger than 2,000 years shows increased horizontal growth 2
activity of the studied ice wedges at the height of the sampled profiles. This suggests 3
relatively stable polygonal surface conditions in the thermokarst basin over the last two 4
millennia, without substantial sediment accumulation and corresponding vertical ice-5
wedge growth. Such stability is in line with field observations of ice-wedge shapes 6
(Figure 1). It also indicates that the horizontal ice-wedge δ18O profiles are not 7
significantly influenced by vertical ice-wedge growth and, therefore, are suitable for 8
paleoclimatic interpretation. Their suitability is supported by the mean ice-wedge 9
isotopic compositions close to the GMWL, indicating the preservation of climate 10
signals in ice-wedge stable isotopes. In the following, we attribute the δ18O evolution 11
recorded by the ice wedges to winter temperature changes as the stable isotope 12
composition of Arctic precipitation depends mainly on local air temperatures (Meyer et 13
al., 2015). 14
15
[insert Figure 3] 16
17
The stacked Oyogos Yar δ18O record shows a warming trend (Figure 3). This trend is 18
also confirmed in each of the three ice-wedge δ18O profiles (Figure 2), emphasizing, 19
that this millennial warming is not an artefact of stacking. 20

13
The warming culminates in an unprecedented recent δ18O maximum attributed to the 1
Arctic amplification of climate change. This recent δ18O maximum might be slightly 2
amplified by substantial changes in the Arctic climate system. Slight changes in the 3
seasonal distribution of precipitation may increase the contribution of isotopically 4
heavier early and/or late winter precipitation to the total snowpack. Additionally, 5
ongoing warming and associated decline of sea-ice extent and later freeze-up in the 6
Russian Arctic may affect the δ18O-temperature relationship. Modelling results suggest 7
that higher temperatures and lower sea-ice extent enhance local to regional evaporation 8
(Faber et al., 2016). An increase of locally-derived moisture that is less depleted than 9
water vapour transported over long distances may increase the δ18O values of 10
precipitation. However, even though these processes may adapt the long-term δ18O-11
temperature relation to recent Arctic climate change, they support the paleoclimatic 12
interpretation of our δ18O stack. 13
The Oyogos Yar δ18O stack shows a similar evolution as that of the Lena River Delta 14
δ18O stack (Meyer et al., 2015), (Figure 3). Both reconstructions are significantly 15
correlated to each other (R=0.52, p=0.01 accounting for autocorrelation and the 16
interpolation before correlation), which is mainly due to the simultaneous strong 17
increase of δ18O values in the last century. Both stacked ice-wedge records reveal that 18
highest δ18O values of the Late Holocene correspond to radiocarbon-dated samples of 19
post-bomb origin as well as actively growing recent ice wedges. 20

14
However, the isotopic increase during the last centuries in the Oyogos Yar stack (3.5‰ 1
increase between the mean δ18O before and after AD1800) is more pronounced than that 2
in the Lena River Delta record (2.4‰). Interestingly, both the preindustrial (before 3
AD1800) variability as well as this recent warming are amplified by a similar amount. 4
The ratio of preindustrial standard deviations is 1.6 (Oyogos Yar: 1.1‰; Lena River 5
Delta: 0.7‰), and the ratio of the recent warming amplitude is 1.5. 6
The ice wedges that form the Oyogos Yar stack were studied less than 1 km apart, while 7
the ice wedges that form Lena River Delta stack originate from a larger sampling area. 8
Therefore, the higher Oyogos Yar variability is unlikely to be an artefact of mixing 9
spatial and temporal variability but instead relates to a stronger climate variability in 10
this region. This might be explained by its more northeasterly location and 11
corresponding feedback effects, such as sea ice and polynya variability, that likely differ 12
from the central Lena River Delta. 13
The multi-model mean of the CMIP5 climate model simulations (Figure 3) shows a 14
slight decrease in temperature until ~1750, followed by a warming for both winter 15
(DJFMAM) and summer (JJA). This simulated winter cooling trend (-0.54K / kyr) 16
likely relates to a combination of nonlinear responses to insolation, as well as increased 17
volcanic forcing (PAGES 2k Consortium, 2013). The cooling trend is within the 18
uncertainty of the Oyogos Yar ice-wedge trend estimate (850-1750, 0.3±1.8 (1se) 19
K/kyr), demonstrating that the ice-wedge record is too coarse to infer whether the model 20

15
overestimates the cooling trend. Interestingly, the model simulations clearly suggest that 1
the Arctic winter warming in the last century is much stronger than changes in the 2
annual mean (not shown) or summer (Screen et al., 2010). This is consistent with the 3
strong warming observed in both ice-wedge records, and it explains why Siberian ice 4
wedges as particular winter climate archives, despite their associated uncertainties, 5
record the unprecedented warming. 6
7
Implications for Late Holocene Arctic paleoclimatology 8
To our knowledge the Oyogos Yar and Lena River Delta ice-wedge records represent 9
the only available Late Holocene ice-wedge records that are dated to sub-millennial 10
scale. Their similarity shows that the reconstructed winter warming trends are at least 11
representative for the northeast Siberian Arctic. Case studies on Svalbard and the Yamal 12
Peninsula (Vasil'chuk et al., 2015) as well as a review on ice-wedge isotopes across the 13
Russian Arctic (Streletskaya et al., 2015) lack well-constrained geochronological 14
information based on sufficient radiocarbon data of ice-wedge samples and are therefore 15
of limited use for centennial- to millennial-scale paleoclimate reconstruction. 16
It is noteworthy that the nearest millennial record based on tree-ring width from Avam-17
Taimyr (Briffa et al., 2008), interpreted as June-July temperatures, lacks any long-term 18
trend over the last two millennia. Shorter regional, i.e. northeast Siberian, tree-ring 19
records from the Lower Lena River (MacDonald et al., 1998) and Indigirka (Hughes et 20

16
al., 1999), interpreted as June and early summer temperatures, respectively, show 1
warming trends over the past six centuries. However, interpreting long-term climate 2
trends from tree-ring records is challenging (Cook et al., 1995). The nearest ice-core 3
δ18O record to our study area, from Severnaya Zemlya (Opel et al., 2013), has been 4
interpreted as a proxy for annual mean temperatures and does not show any long-term 5
trend over the past millennium. However, these tree-ring and ice-core records show a 6
cooling trend up to AD1850 due to the Late Holocene decreasing summer insolation. 7
This is expected since all these reconstructions are biased towards summer. The 8
pronounced warming they exhibit after AD1850 underlines the extent of the recent 9
Arctic amplification to global warming. 10
The reconstructed ice-wedge winter warming trend over the past two millennia clearly 11
contradicts most other Arctic proxy records and compilations (Kaufman et al., 2009; 12
PAGES 2k Consortium, 2013; McKay and Kaufman, 2014) (Figure 3). This likely 13
relates to the climate response on the seasonally differing insolation forcing (Laskar et 14
al., 2004). For winter (November to April, NDJFMA), insolation at 60°N has slightly 15
increased, whereas for summer (May to October, MJJASO) it has decreased (Figure 3). 16
Additionally, increasing atmospheric greenhouse gas concentrations (Joos and Spahni, 17
2008) (Figure 3) may have contributed to the long-term warming already before and 18
especially during industrial times. As pointed out by several studies, non-linear internal 19
feedbacks from ocean, sea-ice and land-cover changes have an additional impact on the 20

17
Arctic temperature evolution, in particular during winter (Braconnot et al., 2007; Zhang 1
et al., 2010). Here, our winter δ18O stack, in combination with isotope-enabled climate 2
models (Werner et al., 2011), might help to elucidate the strength of these feedback 3
processes. 4
5
Conclusions and outlook 6
Our presented data highlight the potential of ice wedges in permafrost as promising and 7
unique archives of winter climate. This is particularly important for the Holocene, when 8
summers and winters show opposite insolation trends. The stacked Oyogos Yar ice-9
wedge δ18O record shows a long-term winter warming over the last two millennia, with 10
an unprecedented recent maximum. It independently confirms the results of Meyer et al. 11
(2015). Our results imply that, the seasonality of climate archives and proxies needs to 12
be better constrained before comparing proxy records with climate model results, in 13
particular for the Arctic. Ultimately, a better understanding of the relationship of climate 14
variations, variations in δ18O of the precipitation and the signal preserved in the ice 15
wedges is needed to better quantify the reconstruction of past temperatures. More ice-16
wedge studies are essential as well as new approaches for ice-wedge chronologies to 17
increase the temporal resolution of ice-wedge-based climate reconstructions. 18
19
Acknowledgements 20
18
The study presented here is part of the Russian-German System Laptev Sea cooperative 1
scientific effort. We thank our colleagues who helped during fieldwork and following 2
discussions as well as the staff from the AWI Potsdam stable isotope laboratory. This 3
study contributes to the ‘Eurasian Arctic Ice 4k’ project (Deutsche 4
Forschungsgemeinschaft grant no. OP217/2-1) and was supported by the Initiative and 5
Networking Fund of the Helmholtz Association Grant VG-NH900. The Program for 6
Climate Model Diagnosis and Intercomparison and the World Climate Research Pro- 7
gramme Working Group on Coupled Modeling made the WCRP CMIP5 simulations 8
available. We thank two anonymous reviewers and Julian Murton for their comments 9
that helped us to improve the manuscript. 10
11

19
References 1
AMAP. (2011) Snow, Water, Ice and Permafrost in the Arctic (SWIPA): Climate 2
Change and the Cryosphere. Oslo, Norway, xii + 538 pp. 3
Blaauw M. (2010) Methods and code for ‘classical’ age-modelling of radiocarbon 4
sequences. Quaternary Geochronology 5: 512-518. 5
Braconnot P, Otto-Bliesner B, Harrison S, et al. (2007) Results of PMIP2 coupled 6
simulations of the Mid-Holocene and Last Glacial Maximum - Part 1: 7
experiments and large-scale features. Climate of the Past 3: 261-277. 8
Braconnot P, Harrison SP, Kageyama M, et al. (2012) Evaluation of climate models 9
using palaeoclimatic data. Nature Climate Change 2: 417-424.Briffa KR, 10
Shishov VV, Melvin TM, et al. (2008) Trends in recent temperature and radial 11
tree growth spanning 2000 years across northwest Eurasia. Philosophical 12
Transactions of the Royal Society B-Biological Sciences 363: 2271-2284. 13
Brohan P, Kennedy JJ, Harris I, et al. (2006) Uncertainty estimates in regional and 14
global observed temperature changes: A new data set from 1850. Journal of 15
Geophysical Research-Atmospheres 111: 21. 16
Cook ER, Briffa KR, Meko DM, et al. (1995) The segment length curse in long tree-17
ring chronology development for palaeoclimatic studies. Holocene 5: 229-237. 18
Craig H. (1961) Isotopic variations in meteoric waters. Science 133: 1702-1703. 19
Dansgaard W. (1964) Stable isotopes in precipitation. Tellus 16: 436-468. 20
Dewald A, Heinze S, Jolie J, et al. (2013) CologneAMS, a dedicated center for 21
accelerator mass spectrometry in Germany. Nuclear Instruments & Methods in 22
Physics Research Section B-Beam Interactions with Materials and Atoms 294: 23
18-23. 24
Faber A-K, Vinter BM, Sjolte J, et al. (2016) How does sea ice influence δ18O of Arctic 25
precipitation? Atmospheric Chemistry and Physics Discussions in review. 26
Grootes PM, Nadeau MJ and Rieck A. (2004) C-14-AMS at the Leibniz-Labor: 27
radiometric dating and isotope research. Nuclear Instruments & Methods in 28
Physics Research Section B-Beam Interactions with Materials and Atoms 223: 29
55-61. 30
Günther F, Overduin PP, Sandakov AV, et al. (2013) Short- and long-term thermo-31
erosion of ice-rich permafrost coasts in the Laptev Sea region. Biogeosciences 32
10: 4297-4318. 33
Hughes MK, Vaganov EA, Shiyatov S, et al. (1999) Twentieth-century summer warmth 34
in northern Yakutia in a 600-year context. Holocene 9: 629-634. 35
Joos F and Spahni R. (2008) Rates of change in natural and anthropogenic radiative 36
forcing over the past 20,000 years. Proceedings of the National Academy of 37
Sciences of the United States of America 105: 1425-1430. 38

20
Kaufman DS, Schneider DP, McKay NP, et al. (2009) Recent Warming Reverses Long-1
Term Arctic Cooling. Science 325: 1236-1239. 2
Lachenbruch AH. (1962) Mechanics of Thermal Contraction Cracks and Ice-Wedge 3
Polygons in Permafrost. Geological Society of America Special Papers 70: 1-66. 4
Laskar J, Robutel P, Joutel F, et al. (2004) A long-term numerical solution for the 5
insolation quantities of the Earth. Astronomy & Astrophysics 428: 261-285. 6
Liu Z, Zhu J, Rosenthal Y, et al. (2014) The Holocene temperature conundrum. 7
Proceedings of the National Academy of Sciences of the United States of 8
America 111: E3501-E3505. 9
MacDonald GM, Case RA and Szeicz JM. (1998) A 538-year record of climate and 10
treeline dynamics from the lower Lena River region of northern Siberia, Russia. 11
Arctic and Alpine Research 30: 334-339. 12
Mackay JR. (1983) Oxygen isotope variations in permafrost, Tuktoyaktuk Peninsula 13
area, Northwest Territories. Current Research, Part B, Geological Survey of 14
Canada Paper 83-1B: 67-74. 15
McKay NP and Kaufman DS. (2014) An extended Arctic proxy temperature database 16
for the past 2,000 years. Scientific Data 1. 17
Merlivat L and Jouzel J. (1979) Global Climatic Interpretation of the Deuterium-18
Oxygen 18 Relationship for Precipitation. Journal of Geophysical Research-19
Oceans and Atmospheres 84: 5029-5033. 20
Meyer H, Dereviagin AY, Siegert C, et al. (2002a) Paleoclimate studies on Bykovsky 21
Peninsula, North Siberia-hydrogen and oxygen isotopes in ground ice. 22
Polarforschung 70: 37-51. 23
Meyer H, Dereviagin AY, Siegert C, et al. (2002b) Palaeoclimate reconstruction on Big 24
Lyakhovsky Island, North Siberia - Hydrogen and oxygen isotopes in ice 25
wedges. Permafrost and Periglacial Processes 13: 91-105. 26
Meyer H, Opel T, Laepple T, et al. (2015) Long-term winter warming trend in the 27
Siberian Arctic during the mid-to late Holocene. Nature Geoscience 8: 122-125. 28
Meyer H, Schirrmeister L, Yoshikawa K, et al. (2010) Permafrost evidence for severe 29
winter cooling during the Younger Dryas in northern Alaska. Geophysical 30
Research Letters 37: L03501. 31
Meyer H, Schönicke L, Wand U, et al. (2000) Isotope studies of hydrogen and oxygen 32
in ground ice - Experiences with the equilibration technique. Isotopes in 33
Environmental and Health Studies 36: 133-149. 34
Opel T, Dereviagin AY, Meyer H, et al. (2011) Palaeoclimatic Information from Stable 35
Water Isotopes of Holocene Ice Wedges on the Dmitrii Laptev Strait, Northeast 36
Siberia, Russia. Permafrost and Periglacial Processes 22: 84-100. 37
Opel T, Fritzsche D and Meyer H. (2013) Eurasian Arctic climate over the past 38
millennium as recorded in the Akademii Nauk ice core (Severnaya Zemlya). 39
Climate of the Past 9: 2379-2389. 40

21
Opel T, Wetterich S, Meyer H, et al. (2017) Ground-ice stable isotopes and 1
cryostratigraphy reflect late Quaternary palaeoclimate in the Northeast Siberian 2
Arctic (Oyogos Yar coast, Dmitry Laptev Strait). Climate of the Past 3
Discussions: 1-37.PAGES 2k Consortium. (2013) Continental-scale temperature 4
variability during the past two millennia. Nature Geoscience 6: 339-346. 5
Reimer PJ, Bard E, Bayliss A, et al. (2013) IntCal13 and Marine13 Radiocarbon Age 6
Calibration Curves 0–50,000 Years cal BP. Radiocarbon 55: 1869-1887. 7
Reimer PJ, Brown TA and Reimer RW. (2004) Discussion: Reporting and calibration of 8
post-bomb C-14 data. Radiocarbon 46: 1299-1304. 9
Rethemeyer J, Fulop RH, Hofle S, et al. (2013) Status report on sample preparation 10
facilities for C-14 analysis at the new CologneAMS center. Nuclear Instruments 11
& Methods in Physics Research Section B-Beam Interactions with Materials and 12
Atoms 294: 168-172. 13
Schirrmeister L, Kunitsky V, Grosse G, et al. (2011) Sedimentary characteristics and 14
origin of the Late Pleistocene Ice Complex on north-east Siberian Arctic coastal 15
lowlands and islands - A review. Quaternary International 241: 3-25. 16
Screen JA and Simmonds I. (2010) The central role of diminishing sea ice in recent 17
Arctic temperature amplification. Nature 464: 1334-1337. 18
Serreze MC and Barry RG. (2011) Processes and impacts of Arctic amplification: A 19
research synthesis. Global and Planetary Change 77: 85-96. 20
Streletskaya ID, Vasiliev AA, Oblogov GE, et al. (2015) Reconstruction of paleoclimate 21
of Russian Arctic in the Late Pleistocene–Holocene on the basis of isotope study 22
of ice wedges. Kriosfera Zemli 19: 86-94. 23
Stuiver M and Polach HA. (1977) Reporting of 14C Data - Discussion. Radiocarbon 19: 24
355-363. 25
Sundqvist HS, Kaufman DS, McKay NP, et al. (2014) Arctic Holocene proxy climate 26
database – new approaches to assessing geochronological accuracy and 27
encoding climate variables. Climate of the Past 10: 1605-1631.Taylor KE, 28
Stouffer RJ and Meehl GA. (2012) An Overview of CMIP5 and the Experiment 29
Design. Bulletin of the American Meteorological Society 93: 485-498. 30
Vaikmäe R. (1989) Oxygen isotopes in permafrost and ground ice: A new tool for 31
paleoclimatic investigations. 5th Working Meeting Isotopes in Nature, Leipzig, 32
September 1989, Proceedings. 543-553. 33
Vasil'chuk Y and Vasil'chuk A. (2014) Spatial distribution of mean winter air 34
temperatures in Siberian permafrost at 20-18ka BP using oxygen isotope data. 35
Boreas 43: 678-687. 36
Vasil'chuk YK, Budantseva NA, Christiansen HH, et al. (2015) Oxygen stable isotope 37
variation in Late Holocene ice wedges in Yamal Peninsula and Svalbard. 38
Geography, Environment, Sustainability 8: 36-54. 39

22
Werner M, Langebroek PM, Carlsen T, et al. (2011) Stable water isotopes in the 1
ECHAM5 general circulation model: Toward high-resolution isotope modeling 2
on a global scale. Journal of Geophysical Research-Atmospheres 116: 14. 3
Wetterich S, Rudaya N, Tumskoy V, et al. (2011) Last Glacial Maximum records in 4
permafrost of the East Siberian Arctic. Quaternary Science Reviews 30: 3139-5
3151. 6
Wetterich S, Schirrmeister L, Andreev AA, et al. (2009) Eemian and Late 7
Glacial/Holocene palaeoenvironmental records from permafrost sequences at the 8
Dmitry Laptev Strait (NE Siberia, Russia). Palaeogeography Palaeoclimatology 9
Palaeoecology 279: 73-95. 10
Wetterich S, Tumskoy V, Rudaya N, et al. (2014) Ice Complex formation in arctic East 11
Siberia during the MIS3 Interstadial. Quaternary Science Reviews 84: 39-55. 12
Wetterich S, Tumskoy V, Rudaya N, et al. (2016) Ice Complex permafrost of MIS5 age 13
in the Dmitry Laptev Strait coastal region (East Siberian Arctic). Quaternary 14
Science Reviews. 15
Zhang Q, Sundqvist HS, Moberg A, et al. (2010) Climate change between the mid and 16
late Holocene in northern high latitudes - Part 2: Model-data comparisons. 17
Climate of the Past 6: 609-626. 18
19
20
21
23
Tables and Figures 1
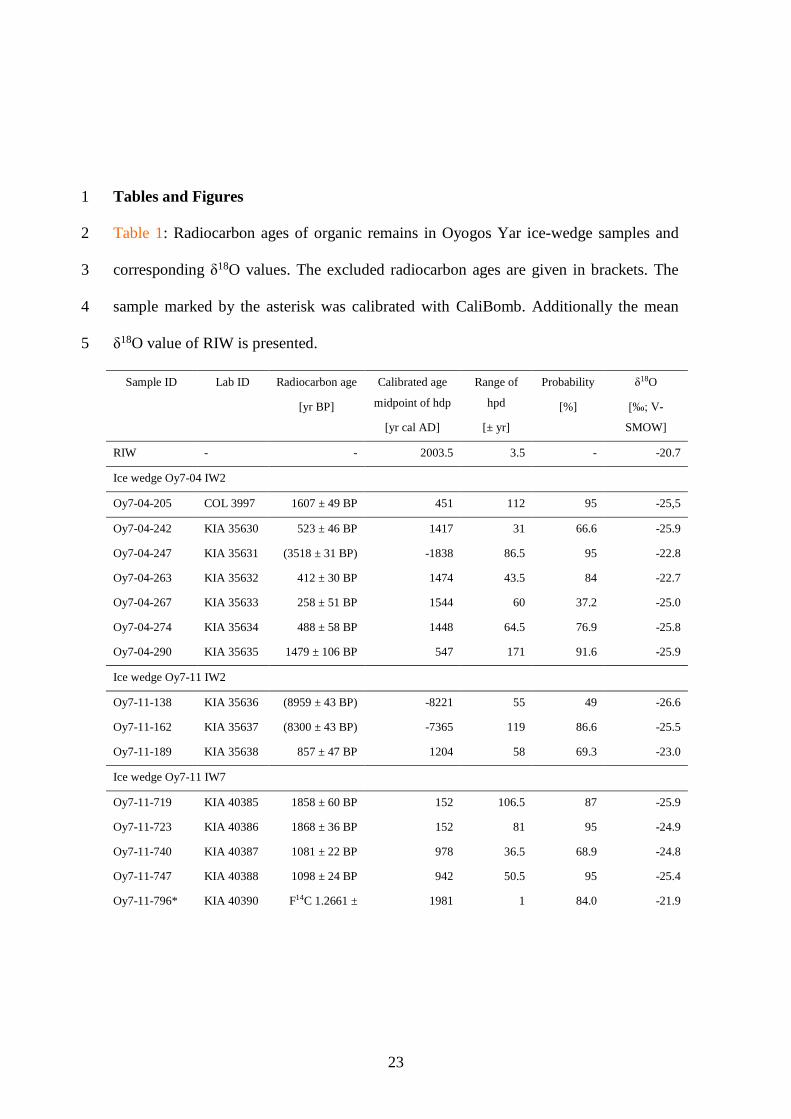
Table 1: Radiocarbon ages of organic remains in Oyogos Yar ice-wedge samples and 2
corresponding δ18O values. The excluded radiocarbon ages are given in brackets. The 3
sample marked by the asterisk was calibrated with CaliBomb. Additionally the mean 4
δ18O value of RIW is presented. 5
Sample ID Lab ID Radiocarbon age
[yr BP]
Calibrated age
midpoint of hdp
[yr cal AD]
Range of
hpd
[± yr]
Probability
[%]
δ18O
[‰; V-
SMOW]
RIW - - 2003.5 3.5 - -20.7
Ice wedge Oy7-04 IW2
Oy7-04-205 COL 3997 1607 ± 49 BP 451 112 95 -25,5
Oy7-04-242 KIA 35630 523 ± 46 BP 1417 31 66.6 -25.9
Oy7-04-247 KIA 35631 (3518 ± 31 BP) -1838 86.5 95 -22.8
Oy7-04-263 KIA 35632 412 ± 30 BP 1474 43.5 84 -22.7
Oy7-04-267 KIA 35633 258 ± 51 BP 1544 60 37.2 -25.0
Oy7-04-274 KIA 35634 488 ± 58 BP 1448 64.5 76.9 -25.8
Oy7-04-290 KIA 35635 1479 ± 106 BP 547 171 91.6 -25.9
Ice wedge Oy7-11 IW2
Oy7-11-138 KIA 35636 (8959 ± 43 BP) -8221 55 49 -26.6
Oy7-11-162 KIA 35637 (8300 ± 43 BP) -7365 119 86.6 -25.5
Oy7-11-189 KIA 35638 857 ± 47 BP 1204 58 69.3 -23.0
Ice wedge Oy7-11 IW7
Oy7-11-719 KIA 40385 1858 ± 60 BP 152 106.5 87 -25.9
Oy7-11-723 KIA 40386 1868 ± 36 BP 152 81 95 -24.9
Oy7-11-740 KIA 40387 1081 ± 22 BP 978 36.5 68.9 -24.8
Oy7-11-747 KIA 40388 1098 ± 24 BP 942 50.5 95 -25.4
Oy7-11-796* KIA 40390 F14C 1.2661 ± 1981 1 84.0 -21.9

24
0.005
Oy7-11-820 KIA 40391 225 ± 25 BP 1661 19 43.6 -24.4
Oy7-11-Hy27 COL 1925 1579 ± 43 BP 482 86.5 95 -23.9
Oy7-11-Hy31 KIA 40393 (14200 ± 71 BP) -15342 227.5 95 -25.3
Oy7-11-Hy40 KIA 40394 (6640 ± 51 BP) -5560 73.5 95 -25.3
1
25
1
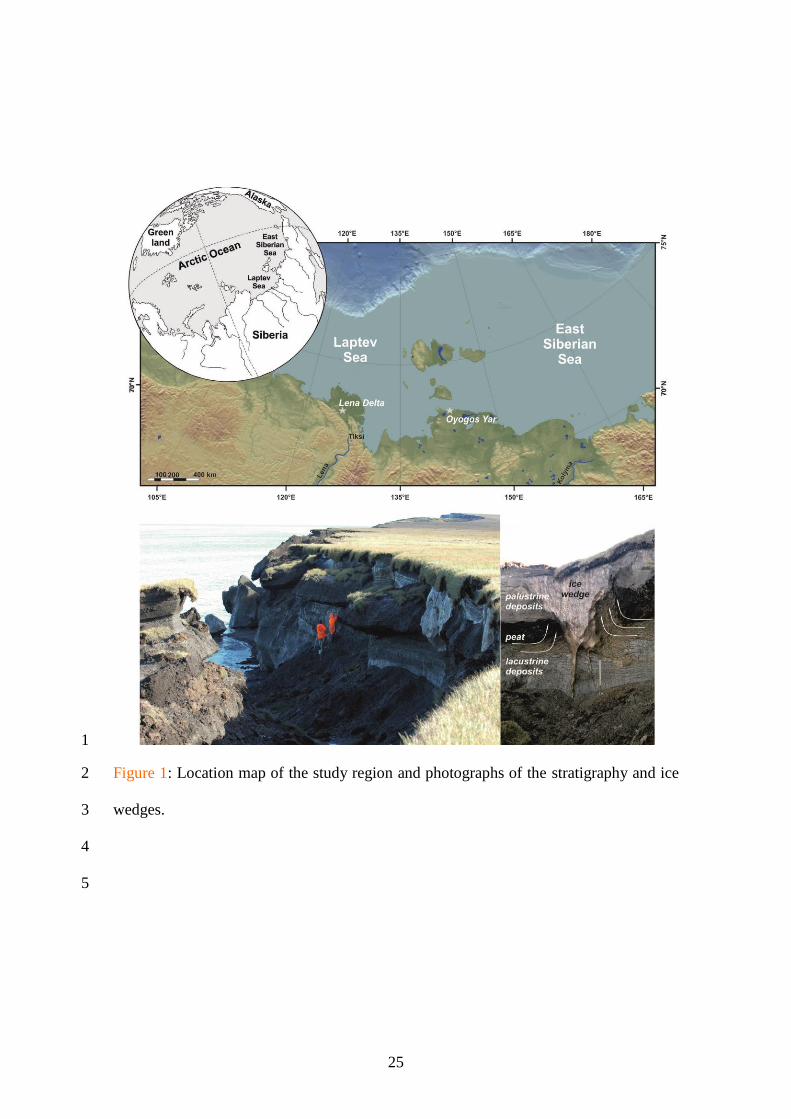
Figure 1: Location map of the study region and photographs of the stratigraphy and ice 2
wedges. 3
4
5

26
1
Figure 2: Ice-wedge δ18O profiles with calibrated radiocarbon ages (years AD) and 2
δ18O-δD co-isotopic plots for the three studied ice wedges from Oyogos Yar. Grey dots 3
and lines as well as ages in brackets in the profiles refer to excluded marginal samples 4
and excluded ages. Red stars represent the recent growth stages of ice wedges. For Oy7-5
11-IW7 the thick blue line refers to the low-resolution profile. 6

27
1
Figure 3: Oyogos Yar (Oy7) ice-wedge δ18O stack compared to Lena River Delta (LD) 2
ice-wedge δ18O stack, modelled surface air temperatures for the study region (20-year 3
running mean, anomalies relative to AD1961-1990), Arctic annual temperature 4

28
anomalies (20-year running mean, anomalies relative to AD1961-1990) reconstructed 1
(line) (McKay and Kaufman, 2014) and 60-90°N HadCRUT3 instrumental (dotted) 2
(Brohan et al., 2006), greenhouse gas (GHG) forcing (Joos and Spahni, 2008) and 3
seasonal insolation forcing (Laskar et al., 2004). The grey bands show the uncertainty 4
caused by the radiocarbon dating, and the black dots show the δ18O values at the 5
midpoint of the age distribution. 6


![Realistic Soft Shadows by Penumbra-Wedges Blending · Penumbra-wedges X + Specular & diffuse Visibility buffer Modulated spec+diff Ambient Final image. Penumbra-wedges [3/4] Penumbra-wedges](https://img.dokumen.tips/doc/110x75/5f543a4c0135c76e2b226697/realistic-soft-shadows-by-penumbra-wedges-penumbra-wedges-x-specular-diffuse.jpg)