Embed Size (px)
Citation preview

LUND UNIVERSITY
PO Box 117221 00 Lund+46 46-222 00 00
North versus South: Energy transition and energy intensity in Europe over 200 years
Gales, Ben; Kander, Astrid; Malanima, Paolo; Rubio, Mar
Published in:European Review of Economic History
DOI:10.1017/s1361491607001967
2007
Link to publication
Citation for published version (APA):Gales, B., Kander, A., Malanima, P., & Rubio, M. (2007). North versus South: Energy transition and energyintensity in Europe over 200 years. European Review of Economic History, 11(2), 219-253.https://doi.org/10.1017/s1361491607001967
Total number of authors:4
General rightsUnless other specific re-use rights are stated the following general rights apply:Copyright and moral rights for the publications made accessible in the public portal are retained by the authorsand/or other copyright owners and it is a condition of accessing publications that users recognise and abide by thelegal requirements associated with these rights. • Users may download and print one copy of any publication from the public portal for the purpose of private studyor research. • You may not further distribute the material or use it for any profit-making activity or commercial gain • You may freely distribute the URL identifying the publication in the public portal
Read more about Creative commons licenses: https://creativecommons.org/licenses/Take down policyIf you believe that this document breaches copyright please contact us providing details, and we will removeaccess to the work immediately and investigate your claim.
Download date: 24. Jan. 2022

European Review of Economic History, 11, 219–253.C© 2007 Cambridge University Press Printed in the United Kingdom doi:10.1017/S1361491607001967
North versus South: Energy transitionand energy intensity in Europe over200 yearsBEN G ALES †, A STRID K ANDER ‡,PAOLO M A L A NIMA ∗ A ND M AR RUBI O¶†Faculty of Economics, Economic History, University of Groningen,The Netherlands‡Department of Economic History, Box 7083, 220 07 Lund, Sweden∗Institute of Studies on Mediterranean Societies (Italian National Council ofResearch) Italy¶Department of Economics and Business, University Pompeu Fabra,Barcelona, Spain
This article examines energy consumption in Sweden, Holland, Italy andSpain over 200 years, including both traditional and modern energycarriers. The analysis is based on totally new series of energy consumptionincluding traditional carriers along with modern sources. Our mainpurposes are a closer examination of the process of the energy transition inEurope and a revision of the prevailing idea of there being, over the longrun, an inverted U-curve in energy intensity. Changes in energyconsumption are decomposed into effects from population growth,economic growth and energy intensity. The results on energy intensitychallenge the previous suggestions of most scholars. An inverted U-curvedoes not exist whenever we include traditional sources of energy in ouranalysis.
1. Introduction
There is no consensus on precisely how important energy is for economicgrowth and human welfare. If energy is a crucial resource for the economy,inasmuch as economic growth cannot take place without more or lessproportionate increases of energy, its availability could endanger economicbehaviour in the near future. If, on the other hand, energy consumptionshows high variability in relation to the economy, and especially if it tends todecline in relative terms, the prospects are more optimistic.
The proposition that energy consumption does not grow proportionatelyto GDP, but that the ratio between energy and GDP (energy intensity)1
1 Energy measured by its heat content divided by GDP in constant prices.

220 European Review of Economic History
shows a pattern that resembles an inverted U-curve, a curve with a relativeincrease in the early phases of industrialisation and subsequently a declinein the post-industrial phase, was widely accepted among energy scholarsfollowing an influential article in Scientific American, 1990.2 Nevertheless,this proposition does not take into account traditional forms of energyexploited prior to the introduction of fossil fuels. It is reasonable to believethat the long-term pattern will look profoundly different from an invertedU-curve when traditional energy carriers, such as firewood, food intake bymen and working animals, water and wind, are included in the calculation.In this case, the initial level of energy use would be higher and part of theincrease of energy consumption would, as a consequence, appear only as asubstitution of modern energy carriers for traditional ones.3 Unfortunately,few long-term series of energy consumption have been elaborated includingtraditional sources. The use of historical series that only account for modernenergy sources hinders the discussion of the dynamics of energy intensityin a long-term perspective. For two large economies, the US and Japanfrom 1900, the inclusion of one traditional energy source (firewood) madea difference for the long term energy intensity, but it is not clear how theseseries regarding firewood were compiled.4 The four series presented in theAppendix for Sweden, the Netherlands, Spain and Italy, are, in fact, the firstnational series to include the full set of traditional energy carriers (manpower,firewood, wind and water) with the sources and methods well accounted forand thus setting the problem of energy consumption and energy intensity ina historical perspective of two centuries.5
The lack of long-term series is the reason why the ever-increasing literatureon the environmental effects of growth typically deals with cross-sectiondata referring to sets of countries with different levels of per capita GDPand energy consumption for the period after 1960. There is a vast literaturerelating environmental consequences and economic growth and referringto the so-called ‘Environmental Kuznet’s Curve’ (EKC).6 Although related
2 Goldenberg and Reddy (1990). Smil (2003) discussed the trend in energy-intensity from ahistorical perspective. He concluded that ‘a deeper understanding of underlying realities’and efforts to overcome ‘serious data limitations’ were needed (p. 71).
3 For instance Schurr and Netschert (1978) and Humphrey and Stanislav (1979), who didnot include any traditional energy carriers, obtain the result that energy intensity increasessubstantially with modernisation and industrialisation both in the US and the UK.
4 Grubler (2004). Similarly an article by Martin (1988) lacks sources for firewood estimates;thus the quality of the graphs is hard to assess.
5 Kander (2002), Malanima (2006), Rubio (2005, and forthcoming), Gales (2007).6 Stern (2004) gives an effective and well-structured overview of the encompassing EKC
debate. More specifically related to the energy emission issues there are a couple of recentpapers expressing doubts about the existence of an EKC for CO2 emissions:Wagner-Furstenberger (2004), Mazzanti et al. (2006). Holtz-Eakin and Selden (1995)found that it is only at extremely high income levels that a falling trend in CO2 to GDPcould be discovered.

Energy transition in Europe over 200 years 221
to the topic of this article it is far beyond our intention to account herefor the EKC literature and debate. Particularly since energy consumptiondoes not translate straightforwardly into environmental consequences, wehave chosen simply to discuss the inverted U-curve hypothesis for energyintensity.
The hypothesis about the lack of an inverted U-curve in the long-term ratioof energy to GDP was confirmed for Sweden, where, from the beginningof the nineteenth century, energy intensity declined, even though withsome reversals in the trend.7 Sweden, however, may present an unusualpattern because of the large nineteenth-century consumption of firewoodfor household heating. However, a similar trend was recently found for Italy,where energy intensity diminished as from the middle of the nineteenthcentury.8 It seems reasonable to suppose that we could also discover adecreasing trend in the energy intensity for other European countries.
We have chosen two northern and two southern European regions totest our hypothesis because of the diversity of the pre-modern level andcomposition of energy consumption in the North and the South. Thepossibility of finding similar trends in different environments is muchmore rewarding than that of discovering similarities where homogeneousconditions already exist. These four countries represent regions of Europewith differences in climate, domestic sources of energy and economicdevelopment paths. The availability of new series of energy consumptiondata calculated according to the same criteria and including every primaryenergy source with an economic cost is the precondition for a comparativeexercise like this.
In Section 2 we account for the different energy systems of our fourcountries.9 In Section 3 we compare aggregate and per capita energyconsumption. We find pair-wise similar results in per capita consumption forthe northern and the southern countries. In Section 4 we analyse the changesin aggregate energy consumption. To this purpose we use a decompositionanalysis, better suited in this case to our basic materials than other statisticalprocedures. On this basis we are able to distinguish the relative importanceof population, per capita product and a residual representing the role oftechnology.10 Section 5 contains a concluding discussion, which sums up themain results of the study and makes some overall comments on what hasto be learnt from the previous analysis on the long term energy-economyrelationship.
7 Kander (2002), Kander and Lindmark (2004).8 Malanima (2006).9 Work on Germany, England and Wales, France, Portugal and Norway is ongoing by
researchers in our EGP (Energy-Growth-Pollution) network.10 Commoner (1971a, b), Ehrlich et al. (1977), Ehrlich and Ehrlich (1990).
222 European Review of Economic History
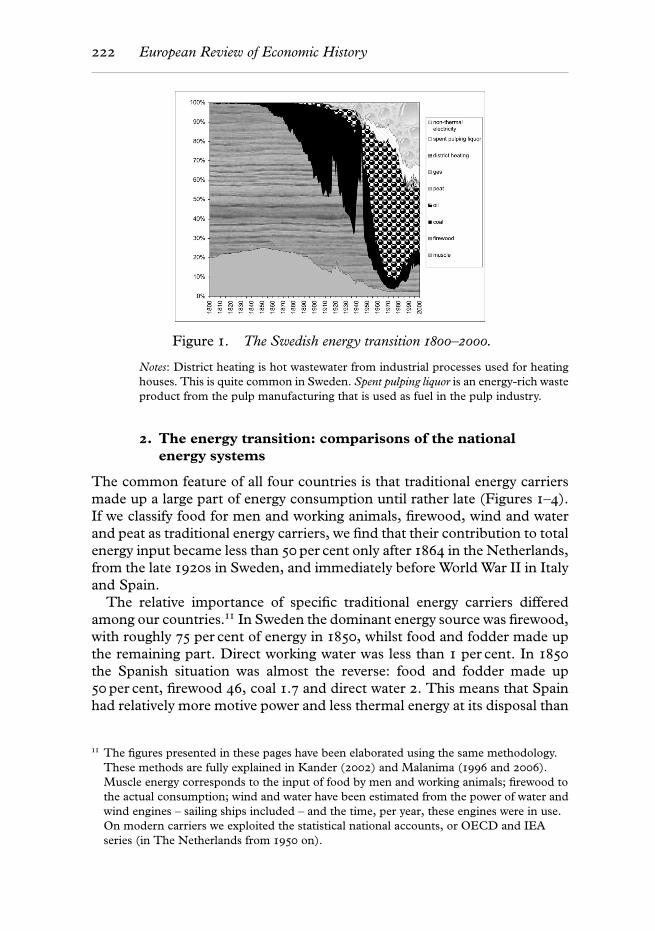
Figure 1. The Swedish energy transition 1800–2000.
Notes: District heating is hot wastewater from industrial processes used for heatinghouses. This is quite common in Sweden. Spent pulping liquor is an energy-rich wasteproduct from the pulp manufacturing that is used as fuel in the pulp industry.
2. The energy transition: comparisons of the nationalenergy systems
The common feature of all four countries is that traditional energy carriersmade up a large part of energy consumption until rather late (Figures 1–4).If we classify food for men and working animals, firewood, wind and waterand peat as traditional energy carriers, we find that their contribution to totalenergy input became less than 50 per cent only after 1864 in the Netherlands,from the late 1920s in Sweden, and immediately before World War II in Italyand Spain.
The relative importance of specific traditional energy carriers differedamong our countries.11 In Sweden the dominant energy source was firewood,with roughly 75 per cent of energy in 1850, whilst food and fodder made upthe remaining part. Direct working water was less than 1 per cent. In 1850
the Spanish situation was almost the reverse: food and fodder made up50 per cent, firewood 46, coal 1.7 and direct water 2. This means that Spainhad relatively more motive power and less thermal energy at its disposal than
11 The figures presented in these pages have been elaborated using the same methodology.These methods are fully explained in Kander (2002) and Malanima (1996 and 2006).Muscle energy corresponds to the input of food by men and working animals; firewood tothe actual consumption; wind and water have been estimated from the power of water andwind engines – sailing ships included – and the time, per year, these engines were in use.On modern carriers we exploited the statistical national accounts, or OECD and IEAseries (in The Netherlands from 1950 on).

Energy transition in Europe over 200 years 223
Figure 2. The Spanish energy transition 1850–2000.
Figure 3. The Italian energy transition 1861–2000.
Sweden.12 In Italy in 1861 the situation was similar to that of Spain, butfood for men and fodder for draught animals played a minor role (about20 per cent each), firewood made up 50 per cent and coal 7, while wind
12 On Spain see Rubio (2005).

224 European Review of Economic History
Figure 4. The Dutch energy transition 1800–2000.
Table 1. Composition of energy consumption in 1850 Sweden,The Netherlands, Italy∗ and Spain (%).
Sweden Netherlands Italy SpainFood (men, animals) 25 28 41 50Firewood 73 13 51 46Wind, water <1 12 1 2Fossil fuels 2 47 7 2
∗At 1861.
and water accounted for only 1 per cent.13 In Holland the situation wasremarkable in terms of the relative roles played by wind14 and peat. Around1850 peat represented 30 per cent and wind 10 per cent. The large pumpingand drainage projects, needed in a country with half of its surface closeto or below the sea level, were the main reason for the spectacularly highwind consumption. Firewood was, on the contrary, not very important, onlyaccounting for 13 per cent, with coal 20 and food and fodder 2815 per cent(Table 1).
The coal age arrived late in these countries, even though the age of fossilfuels was already in progress in Holland due to the widespread use of peat(Table 2). Coal was very much a phenomenon of the twentieth century.
13 Malanima (2006), Bardini (1998), Bartoletto (2004).14 Albers (2002), pp. 103–14 and 200–02.15 Van Zanden (1997), p. 491. See also the remarks on firewood consumption in the
Netherlands by Van der Woude (2003).

Energy transition in Europe over 200 years 225
Table 2. Composition of energy consumption in 1900 Sweden,The Netherlands, Spain and Italy (%).
Sweden Netherlands Italy SpainFood (men, animals) 17 15 39 31Firewood 45 2 34 26Wind, water <1 3 1 5Fossil fuels 38 80 26 38Primary electricity 0.1 0 0.1 0
Note: Primary electricity is an abridged expression used for hydro- and nuclearelectricity. Primary electricity does not actually exist, electricity being in any case asecondary form of energy. Electricity is here calculated by its heat content, and notby the energy content of the water or uranium used for its production.
Table 3. Composition of energy consumption in 1950 Sweden,the Netherlands, Spain and Italy (%).
Sweden Netherlands Italy SpainFood (men, animals) 6 9 27 27Firewood 21 0 17 12Wind, water <1 0 0 0Fossil fuels 64 91 47 59Primary electricity 9 0 9 2
The dominance of coal varied considerably. At its peak its share was82 per cent in the Netherlands (1913),16 but only 45 per cent in Sweden(1909). In Italy the maximum was around 40 per cent in 1935–40 andin Spain it peaked in the years 1927–30 with levels of 46–49 per cent(Table 3).
The fact that the Netherlands became more of a coal-based economy thanthe other countries is not due to its own stocks.17 Domestic coal-mining didnot take off until 1900, and essentially from World War I onwards.
All four countries showed greater similarity in the dependence upon oil.The major breakthrough for oil came after World War II in Italy, Spain andSweden, but less so in the Netherlands, which remained coal-based for alonger period (Table 4).
Primary electricity is of different importance in our four countries.Negligible in the Netherlands for a long period, because of lack of waterfalls,nowadays it makes up 10 per cent of national energy consumption, wheretwo-thirds comes from bio-fuels and one-third from nuclear power. In Spainits importance has increased steadily over time to its present 7 per cent.
16 We consider here normal conditions. The dependence upon coal could be larger in timesof war. The importance of coal, however, was not much bigger under abnormalconditions than in 1913. In 1941 the share of coal and lignite was 84 per cent.
17 Gales (2000).

226 European Review of Economic History
Table 4. Composition of energy consumption in 2000 inSweden, the Netherlands, Italy and Spain (%).
Sweden Netherlands Italy SpainFood (men, animals) 2 2 4 5Firewood 23 0 2 0Fossil fuels 40 88 88 88Primary electricity 33 10 6 7
Note: In 2000 Sweden had 2 per cent of its energy supplied by district heating,therefore the figures for Sweden do not sum to 100 per cent! Primary electricity inthe Netherlands is the sum of biomass electricity (7 per cent), international trade inelectricity (more than 2 per cent) and nuclear electricity.
In Italy the relative share declined from its maximum in the 1950s (9–10 per cent) and is nowadays 6 per cent. Nearly all of this primary electricityis produced by hydropower. Nuclear energy has been negligible in Italyand nowadays no nuclear power plant exists.18 Sweden has put most effortinto the production of primary electricity. This presently constitutes around30 per cent of the energy consumed in the country, half of which comesfrom nuclear energy and half from hydropower. Sweden today has ten activenuclear reactors, out of its original twelve.
Over 200 years, by the end of the twentieth century, a long energytransition had been accomplished with the almost total disappearance oftraditional carriers such as wind, water and draft animals. Another traditionalsource, human muscle energy, was then relatively unimportant, whereasfirewood remained of substantial importance in many countries until wellinto the twentieth century. The more recent decades, following the oil crisesof the 1970s, show a proliferation of relevant energy carriers. The portfoliois less determined by one prime energy carrier than in the past. There is,however, some difference in the importance of the diverse carriers. TheNetherlands became a gas-consuming country. In Italy gas consumption hasincreased rapidly since the oil crisis. Sweden opted for nuclear electricityand, again, wood. Spain in turn, reverted to coal-burning for electricityproduction. In the year 2000, about 90 per cent of the coal consumed inSpain was for thermal electricity production.
3. Aggregate energy consumption
While structures of the energy systems are different, there are clearsimilarities in the long-term patterns of total energy consumption in thefour countries (Figure 5). There were modest rates of increase until theWorld War II, a period of faster growth rates in 1950–73 and declining
18 Silvestri (1989), p. 175.

Energy transition in Europe over 200 years 227
Primary energy consumption, el (heat)
10
100
1000
10000
1800 1810 1820 1830 1840 1850 1860 1870 1880 1890 1900 1910 1920 1930 1940 1950 1960 1970 1980 1990 2000
PJ
SwedenItalySpain
Netherlands
Figure 5. Primary energy consumption in Italy, the Netherlands, Spainand Sweden (Petajoules, PJ).
growth rates between 1973 and 2000. These facts integrate well the overalleconomic growth patterns and lend some credibility to the idea that moregrowth requires more energy and more energy allows for further growth.However some differences are obvious:
1. The response to crises such as the World Wars differed. The First WorldWar produced similar effects in the Netherlands and Sweden, with arelatively large decrease in their energy consumption, while Spain andItaly witnessed more modest declines. Spain had its own civil war tocope with in the 1930s and for those years statistical data are lacking.
2. The interwar period was marked by strong growth in energyconsumption in the Netherlands and Sweden, while energy requirementsin Spain (which did not participate in World War II) and in Italy hardlyincreased at all.
3. Spain shows a stronger growth in energy consumption during the 1990sthan the other countries, which continue to have modest growth rates.
To some degree the different levels of energy consumption are naturallyconnected to the size and population of the country. The levels of energyconsumption, and the ordinal ranking of the countries in this respect, showthat Italy is the clear leader. Spain is second, but challenged in that positionby the Netherlands that catches up with Spain in the 1930s, after which thelevel of both countries stays very close. Sweden starts at a level higher thanThe Netherlands, but converges and reaches the same level in the 1880s,only to fall behind The Netherlands again from the 1920s onwards.

228 European Review of Economic History
Energy/cap
10
100
1000
1800 1810 1820 1830 1840 1850 1860 1870 1880 1890 1900 1910 1920 1930 1940 1950 1960 1970 1980 1990 2000
GJ/
cap Netherlands
SwedenItalySpain
Figure 6. Energy consumption per capita in Italy, the Netherlands,Spain and Sweden (Gigajoules, GJ).
When examining the energy consumption per capita (Figure 6), wesee more distinct developments in the northern and southern Europeancountries, together with a completely different hierarchy: Sweden andHolland clearly overtake Italy and Spain. The Netherlands and Swedenalso show remarkable resemblance in their long-term development, apartfrom the period before 1870, where Sweden actually reduces its per capitaenergy consumption thanks to impressive thermal efficiency developments,both in household heating and the iron industry, and in cultivation of newland, without proportionate increases in draught animals. Their developmentis thus one of convergence. Spain and Italy share almost the same level ofenergy per capita over the first 100 years (1860–1960), but then Italy witnessesa sharp increase and surpasses Spain. We see, however, that, while ever-important climatic conditions count relatively less in the long term, with theeconomic performance being more meaningful, a relative convergence takesplace. The difference between Sweden-Holland on one hand and Italy-Spainon the other is much lower today than immediately after the Second WorldWar and during the previous century.
4. Decomposing energy
A frequently used formula for decomposing the environmental impact intoits main components is the Commoner-Ehrlich formula:19
I = P · A · T (1)
19 For an overview, see Ekins (2000), pp. 154–81. The formula has often been used inenvironmental research. Well known examples are Gowdy and Miller (1987) and Caslerand Hannon (1989). On the decomposition analysis, see also Ang and Zhang (2000).

Energy transition in Europe over 200 years 229
where:I = environmental impact of a group or nation;P = population size;A = per capita affluence (measured by proxies such as income or product
per capita);T = a measure of the environmental impact from the technologies involved
in supporting each unit of consumption.A growth in P and A needs to be outbalanced by declines in T in order for I
to stay constant. Technical change can imply shifts in production possibilitiesso that the environmental stress per produced unit is reduced. In other words,there is an ongoing race between productivity increases and growth and thewinner determines the relationship between economy and environment.20
Translated into an energy context, the Commoner-Ehrlich formulabecomes the following identity, where E stands for total energy consumption,Y for GDP (A in Equation (1), while the T-factor has been replaced by energyintensity (E/Y):
E = P · YP
· EY
(2)
If we take the partial derivatives of the identity (2) with respect to time(represented by the dot in Equation (3), we get the following relationship forthe relative current growth rates:
EE
= PP
+(
YP
)
YP
+(
EY
)
EY
(3)
Then we compute annual continuous growth rate of any variable. TheEquation (3) can be simplified in:
e = p + y + ey (4)
where e, p, y and ey are the annual rates of increase of total energyconsumption, population, per capita GDP and energy intensity (Table 5).
In our identity (4), whenever p + y exceeds ey, the consequence is anincrease of total energy consumption e.
If we look at the overall trend from 1870 until 2000, we see that in any casethe yearly rise in energy consumption increased until the end of the series,whilst a marked reduction in the rate of growth took place after 1973. Duringthe period 1950–73, the fast rise in energy consumption was accompaniedby an increase in energy intensity (with the exception of Spain).21 The 1950s
20 Grubler (1998).21 Because of the civil war, energy intensity did not diminish in Spain in 1920–40 as
happened in the other three countries. Increases in efficiency took place (with some delay)only in 1950–73, especially in the agrarian sector which replaced much of the organicenergy with fossil fuels in this late period. See Figure 11 below.

230 European Review of Economic History
Table 5. Yearly growth rates in Energy (total), Population, percapita GDP, Energy intensity in 4 periods (1870–2000)(%).
E p y ey
Sweden 1870–1913 2.00 0.70 1.90 −0.601920–1938 2.30 0.37 3.00 −1.071950–1973 4.01 0.63 3.03 0.351973–2000 0.10 0.32 1.44 −1.66
Netherlands 1870–1913 2.56 1.26 0.89 0.411920–1938 3.07 1.36 1.19 0.521950–1973 5.41 1.24 3.40 0.771973–2000 1.70 0.99 2.93 −2.22
Italy 1870–1913 1.39 0.65 1.24 −0.501920–1938 2.09 0.84 1.44 −0.191950–1973 7.16 0.61 4.85 1.701973–2000 0.86 0.27 2.02 −1.43
Spain 1870–1913 1.60 0.56 1.21 −0.171920–1940 1.49 0.96 −0.24 0.771950–1973 5.13 0.96 5.43 −1.261973–2000 2.61 0.59 2.47 −0.45
Note: Because of the lack of data on energy consumption in Spain duringthe civil war, we assume 1940 as the end of our second period instead of 1938.
and 1960s were a period of very low energy prices. In the decade 1962–72,the price of oil on the international markets was lower than ever before orsince: less than 10 US dollars per barrel (in constant 1999 prices).22 Theforces of growth – population and GDP per capita – were stronger than theforces of the efficiency – energy intensity – in a period when industry andtransport were rapidly increasing everywhere.
We see, however, that when we distinguish the period 1973–2000 withinthis half century, the forces of productivity and efficiency show their strongerimpact on the overall trend of energy consumption. They have been able toreduce greatly the growth of energy consumption and finally, at the very endof the century, to neutralise it. In 1973–2000, the decline in energy intensitywas faster than per capita GDP and population growth, seen separately, onlyin Sweden. In any case, taking into account the 27 years between 1973 and2000, the combined effect of p+y has been stronger than the decline in ey.The whole result – the slower increase of e than before – has been moreeasily attained thanks to the slower growth rate of GDP and population.If we contrast the relative importance of any factor (p, y and ey) in thedetermination of overall energy consumption in the whole period 1870–2000, with the average of our four countries in 1973–2000, we discover that
22 The price refers to crude oil and the source is British Petroleum. The oil price on theinternational markets can be considered as a plausible proxy of the energy price as awhole.

Energy transition in Europe over 200 years 231
Table 6. The importance of any factor in determining the overall energyconsumption in 1973–2000 in comparison with the average for the fourcountries in 1870–2000 (%).
P y ey
4 countries 1870–2000 27.7 54.6 17.61973–2000Sweden 9.4 42.1 48.5Netherlands 13.9 55.2 30.9Italy 7.3 54.3 38.4Spain 16.8 70.4 12.8
Note: The figures in the table represent the ratio between the absolute value of anyfactor (p, y and ey) and the sum of p, y and ey, multiplied by 100. The first linerefers to the average values in 1870–2000.
Table 7. Population in Sweden, the Netherlands, Italyand Spain 1800–2000 (thousands).
Sweden Netherlands Italy Spain1800 2,336 2,112 18,260 10,392∗1825 2,771 2,514 20,134 12,6151850 3,482 3,098 24,603 14,8941875 4,383 3,788 28,258 16,2671900 5,136 5,133 33,343 18,5941925 6,053 7,362 38,715 22,4331950 7,041 10,113 46,768 27,9761975 8,208 13,666 54,764 35,5482000 8,882 15,925 57,844 40,933
∗Note: Year 1797.
the importance of energy intensity has been remarkable in our four countriesand particularly strong in Sweden (Table 6).
A disaggregate analysis per country and per factor provides a clearerpicture of the overall trend.
4.1. The P-factor
The P-factor (in Equation 3), or the population factor (Table 7), explainswhy the Netherlands overtook Sweden in energy consumption in the 1920s:after this point in time, the growth rate of the Dutch population was muchhigher than that of the Swedish. The Netherlands were a demographicoutlier for a considerable time. The number of births remained high afterthe demographic transition, in combination with a very low rate of femaleparticipation in the labour force. In an already densely populated countrysuch as Italy, the rate of population growth was lower than in the other threecountries.

232 European Review of Economic History
ception of the Netherlands in 1950-73. hich Figure 7 is based are from: Italy: Malanima (2006); ra (2003); The Netherlands: Smits, Horlings, Van Zanden 000); SL. and O. Krantz (2007) . Data in these series are expre ed in 19
PPP dollars by means of Maddison (1995).
Income per capita
100
1000
1000
100000
1800 1810 1820 1830 1840 1850 1860 1870 1880 1890 1900 1910 1920 1930 1940 1950 1960 1970 1980 1990 2000
Netherlands
Sweden
Italy
Spain
inte
rna
tio
na
l d
oll
ars
Figure 7. Income per capita (constant international 1990 PPP dollars).
On the whole, the P-factor shows small variations in growth rates overtime (less than 1 per cent per year in 1950–2000),23 and is thus incapable ofexplaining a factor that shows large fluctuations, such as energy. Globally,in our four countries, population grew 3.7 times, while energy consumptionincreased 30 times. We need then to look at the income per capita variable,the Y/P-factor.
4.2. The Y/P-factor
The Y/P-factor (in Equation 3) or the income per capita factor (Figure 7)24 isa more volatile variable than the P-factor and as such is more able to ‘explain’development of the E-factor over time. Energy consumption, however, is notmerely a function of income, as the differences between countries show.
Naturally this is not the place to discuss the long-term economicdevelopment of these four countries, but the differences across them appearas much in levels as in trends. The start of ‘modern growth’ coincided inthese four countries with the transition to the exploitation of modern energy
23 With the exception of the Netherlands in 1950–73.24 Data on which Figure 7 is based are from: Italy: Malanima (2006); Spain: Prados de la
Escosura (2003); The Netherlands: Smits et al. (2000); Sweden: Schon and Krantz (2007).Data in these series are expressed in 1990 international PPP dollars by means ofMaddison (1995).

Energy transition in Europe over 200 years 233
Energy per capita versus income per capita in several European countries (Netherlands, Sweden, Italy and, Spain 1850-2000)
10
100
1000
1.000 10.000 100.000
GDP per habitant (log)international dollars (1990$) per habitant
en
erg
y p
er
cap
ita (
log
) G
J/h
ab
itan
t ye
ar
Sweden Netherlands Italy Spain
20.0005.000
Netherlands 2000Eng: 183 GJ/habGDPpc: 21,546 $/hab
Sweden 2000Eng: 168 GJ/habGDPpc:19,898 $/hab
I taly 2000Eng: 132 GJ/habGDPpc: 20,574 $/hab
Spain 2000Eng: 119 GJ/habGDPpc: 14,927 $/hab
Figure 8. Energy per capita versus income per capita.
carriers and with the transition from an energy system based on vegetablecarriers to a mineral one. For a long time the Netherlands enjoyed a leadingposition. When, after World War II, GDP growth accelerated, a trend towardconvergence characterised the four economies. At the end of the century, thelevels of per capita GDP are the same in Sweden, Holland and Italy, and Spainis rapidly converging.
The rise in per capita GDP was the strongest variable in determiningan unprecedented growth in energy consumption (Figure 8), even thoughenergy intensity decline contributed to neutralise partially this upward trend.In log figures a nearly linear relationship exists between GDP and energyconsumption.
4.3. The E/Y-factor
E/Y (in Equation 3) is a factor, or a residual, that catches up everything thathas not been taken in by the P-factor and Y/P-factor (Figure 9). Its growthcorresponds to:
(EY
)
EY
= EE
−⎡⎣ P
P+
(YP
)
YP
⎤⎦ (5)
One main result is that Sweden is an outlier in its energy intensity. Thelong-term decline is impressive in this country. Some analogy exists withItaly, but in none of the other countries was it the same as in Sweden. Aweak linear decline can be discerned for Spain, but the Netherlands showno time trend at all. The reason is that, as an early-comer, its energy systemwas already different and, in a sense, more modern than those of the three

234 European Review of Economic History
Energy intensities, MJ/dollar
1,00
10,00
100,00
1800 1810 1820 1830 1840 1850 1860 1870 1880 1890 1900 1910 1920 1930 1940 1950 1960 1970 1980 1990 2000
Netherlands
Sweden
Italy
Spain
Figure 9. Energy intensity (Mj/int. PPP 1990 $).
late-comers. Still, with the exception of the Netherlands, the levels of energyintensity in the nineteenth century are higher than in the twentieth. Despitethe wide increases in energy consumption over the last 100 years, productionhas slowly become cheaper in energy terms. Towards the end of the twentiethcentury, three out of the four countries (Sweden, Italy, Spain) have droppedto less than 10MJ/$, a level which is well below those of the previous 100
years. The search for more efficiency in the use of energy partially dependedon the fast rise in prices. In the 1960s the price of oil on the internationalmarkets was less than 10 1999 dollars per barrel, while in 1974 it was fourtimes higher and in 1979 more than seven times. While the low level of priceshad resulted in increasing energy-intensity, from 1973 onwards the trend wasdeclining under the pressure of rising fuel costs.25
Efficiency in energy consumption, that is the ratio of the output ofuseful energy to the total input, certainly improved during the transition.It was estimated that, while subsistence agriculture exploits energy withan efficiency of about 10 per cent, a more advanced agrarian economy (aneconomy, that is, based on food, fodder and plants as the main carriers)before industrialisation can even reach 25 per cent.26 This is probably anoverestimation. We know that the efficiency of a working animal hardly
25 Data refer to the price per barrel of crude oil in 1999 dollars (source: British Petroleum).A closer examination of the relationships between energy intensity and prices would,however, require a reconstruction of energy price indices at the country level. It is not ourpurpose here.
26 Cook (1976, p. 135). For a more in-depth discussion of this issue, see Malanima (1996,pp. 119 ff).

Energy transition in Europe over 200 years 235
Figure 10. Traditional portrait of the long-term evolution of energyintensities.
Source: Adapted from Goldenberg and Reddy (1990).
reaches 10 per cent. Most fodder is used for the metabolism and does notproduce mechanical energy. In the case of a human being, efficiency is higher:about 20 per cent. Traditional fireplaces and stoves usually had a very lowefficiency, hardly reaching 20 per cent, and in most cases not even 10 per cent.A weighted average provides an estimate of overall efficiency at around20 per cent and perhaps less. Today modern energy systems are creditedwith an efficiency of about 35 per cent.27 In the end, the transition to the useof modern carriers and the exploitation of machines as converters resultedin higher efficiency. Biological, animal converters of traditional, vegetablesources are, on the whole, less efficient than the inanimate machines.
The transition from traditional energy carriers to modern ones thereforeimplied a decrease of energy intensity in any country. At the same timetechnological improvements in mechanical converters contributed in thatthe declining trend continued and even intensified.
How does our approach change the perception of the relationshipbetween energy intensity and economic growth? The most widely acceptedperspective on this relationship is probably the one by Goldenberg and Reddy(1990) (Figure 10). In their opinion, energy intensity will increase at lowlevels of income per capita, as countries industrialise, and then, after attaining
27 The topic of efficiency in the exploitation of energy is discussed in depth by Cook (1976,pp. 133 ff). The efficiency of 35 per cent refers to modern, advanced energy systems on thewhole; that is, to the ratio of the output of useful energy to the input. The efficiency ofenergy converters today runs from less than 5 per cent for the ordinary incandescent lampto 99 per cent for large electric generators. On the efficiency of specific energy converters,see also Summers (1971).

236 European Review of Economic History
Figure 11. Two views on energy intensities (11-year moving averages).
a certain level of per capita income, energy intensity will start to decrease.A straight implication of this inverted U-curve is that developing nationscould achieve comparable levels of economic growth with a lower ratio ofconsumed energy to GDP after a transition across a path of increasing energyintensity. A quadratic logarithmic model would represent the movement verywell.28
The inclusion of traditional energy carriers changes the implied relation.The immediate consequence is to elevate the levels of energy consumption,and thus energy intensities, of the earlier periods.
In the case of Italy, the Netherlands, Spain and Sweden we find astraightforward difference between the traditional view of energy intensityand the one we elaborated. In the first case, the curve is rising until therecent decades, when the inverted U appears in the graph. According toour new series, energy intensity tends to decrease, except during the 1950sand 1960s: a period of fast economic growth and very low energy prices(Figure 11).29
28 Such the one used by Galli (1998).29 In fact, this result was also found for the US (from 1800) and Japan (only from 1900),
with the inclusion of bio-fuels (Grubler 2004). For Italy the traditional rising curve ofenergy intensity is presented by Clo (1994) and Toninelli (1999).

Energy transition in Europe over 200 years 237
Total energy intensity versus income per capita in several European countries (Netherlands, Sweden, Italy and, Spain 1850-2000)
1,0
10,0
100,0
1.000 10.000 100.000GDP per habitant (log)
international dollars (1990$) per habitant
ener
gy in
tens
ity(lo
g)
MJ
of e
nerg
y pe
r $ p
rodu
ced
(199
0$)
Sweden Netherlands Italy SpainSweden 1860GDPpc:$1,076Eng: 37,9 MJ/$
Spain 1850GDPpc: $1,079Eng: 17MJ/$ Spain 2000
GDPpc: $14,927Eng: 8 MJ/$ Italy 2000
GDPpc: $20,574Eng: 6.4 MJ/$
Sweden 2000GDPpc: $19,898Eng: 8.2 MJ/$
Netherlands 2000GDPpc: $21,586Eng: 8.5 MJ/$
20.0005.000
Figure 12. Energy intensity versus income per capita.
The standard presentation of the inverted U-curve normally has the levelsof income per capita, rather than time, on the x-axis. In Figure 12 energyintensity includes all types of energies put into use by the economic systemand it is represented in the y-axis. Income per capita, measured by the GDPper inhabitant of each of our four countries, is represented in the x-axis. Theresult does not have the expected inverted-U shape implied by past literatureon the subject. For the most part, the figure looks more like a wave, movingtowards higher levels of income with a long-term trend of lower levels ofenergy intensity. In fact, the only inverted-U shape that can be identifiedis the one peaking around the first oil crisis for three of the four countries(Spain being the exception). From the level of $ 8,000 per capita (around1960 in Italy, Sweden and the Netherlands) the levels of energy intensityincreased to the level of $ 13,000 per capita (which was achieved in 1973 byall three countries). From then on all three reached higher levels of incomeper capita with lower levels of energy intensity. The decline in energy intensitycaused by the oil crisis is also observable in the case of Spain, but at a lowerlevel of income per capita: $ 7,700.
Over a longer period, the trend exhibits a steady decline in energy intensityat higher levels of income per inhabitant. Therefore, what remains untouchedof the original representation of the relationship between energy intensity andincome per capita proposed by Goldenberg and Reddy, is the fact that late-comers may achieve comparable levels of economic output per capita with alower ratio of consumed energy to GDP.30
30 On the prospects of energy intensity in the near future, see Kaufmann (2004).

238 European Review of Economic History
4.4. Unpacking the E/Y-factor
The E/Y-factor, or energy intensity, is a residual and may be perceivedas technical change in a broad sense. This technical change can ariseboth from process innovations that increase efficiency within a specifickind of production, from the introduction of superior energy carriers, orfrom product innovations that give rise to new branches, thus stimulatingstructural change in the economy. Within an existing branch or sector, theinnovations can be explicitly directed at energy savings (such as improving thethermal efficiency of a machine) or at innovations that save on the productionfactors that need energy to run (the total factor productivity). However, twothings complicate the picture and make the gains in energy intensity lesspredictable:
1. Rebound or ‘take-back’ effects, which means that the consumption ofenergy services increases as they become relatively cheaper, which isthe case when technical energy efficiency improves.31 This stimulatesstructural change in a more energy-intensive direction;
2. Biases in technical change, which may lead to fewer gains in energysavings than in total factor productivity. A normal feature of theeconomic development is that capital per worker (K/L) increases. Thecapital ratio to GDP (the K/Y ratio) varies among countries. In caseswhere capital is not saved in relation to GDP it may be that energy is notsaved either, although in general energy is saved in relation to capital.32
Thus energy intensity may not decrease at all, even though we havesubstantial efficiency improvements of various kinds in the economy.
A widely held belief is that energy intensity will increase duringindustrialisation and decline later, as soon as services grow in their shareof product.33 We think there is reason to be sceptical about the idea thatthe transition to the service economy will bring about any relative decline inenergy intensity.34 Because of its importance, we have, however, to devoteattention to the topic. Our problem is to find a way of distinguishing therole of the structural change in the overall decline in energy intensity fromthat of the technical efficiency. The question is then: how much of the declineof energy intensity in these last decades can be explained by the increasingimportance of services?
To answer the question, we will begin by decomposing energy intensityin:
EY
= Ei + Es
Y(6)
31 Howarth (1997).32 Kander and Schon (2007); Ayers and Warr (2003, 2005).33 Panayotou et al. (2000).34 Kander (2005).

Energy transition in Europe over 200 years 239
where Ei and Es are, respectively, energy consumption in industry and inservices (transport included).35
Energy consumption in industry and services can be resolved in:
Ei = ei · i · Y (7)
and
Es = es · (1 − i)Y (8)
where ei and es are respectively energy intensity in industry and services(expressed in Mj per unit of constant money; here 1990 international PPP$), i is the ratio of industrial production out of total product Y and (1 − i) isthe quote of the services (for example, 0.40, 0.50 in the 1970s).
The change in the energy intensity from the year 0 to the year n can bedescribed by the following equation:
ney − 0ey = �ey = n Ei + n Es
nY− 0Ei + 0Es
0Y(9)
where the subscripts on the right refer to the sector of the economy and tothe aggregate energy intensity (ey) and those on the left to the year.
Substituting (7) and (8) into (9) and developing the equation our resultis:
�ey = (ei − es )(ni − 0i) (10)
The change in the overall energy intensity depends on the differencebetween ei and es and on the change in time of the relative weight of industryin the economy between 0 and n.36
We can now express both the differences in the energy intensity (untilnow in Mj per unit of money) between industry and services, and in theimportance of the industry, in relative terms. The difference in total energyintensity (here referred to as �e) explained by the structural change fromindustry to services is then:
�e =ei − es
ei· ni − 0i
0ine y − 0ey
0ey
(11)
Between 1970 and 2000 the service sector increased by 2 percentageunits in Sweden, while transport grew by 4 percentage units (together their
35 To simplify the following analysis, we neglect the primary sector. Its inclusion, however,would not change the results.
36 Here and in the following examples, we assume that energy intensity is stable in time. Wecould, however, take this change into account without difficulty (using a mean valuebetween the beginning and the end of our period both for industry and services).

240 European Review of Economic History
increase was 6 percentage points).37 In Spain the service sector actuallydeclined by 1 percentage unit (transport included) and in Holland servicesgrew by 5 percentage units, while transport grew by another 2 percentageunits. Only Italy saw a relatively large increase in the service sector by14 percentage units (transport included).
Since in Italy the decrease of industry in favour of services from 1973
to 2000 was stronger than in the other three countries, let’s compute itsimportance on the aggregate decline in energy intensity, using the previousformula (11). The coefficient resulting from (ei − es)/ei is 0.20 and representsthe actual difference in energy intensity in the services (transports included).The weight of industry decreased from 0.50 of GDP to 0.36. In the sameperiod the aggregate energy intensity dropped from 10 Mj per international1990 PPP $ to 6 Mj. The decline was then 0.4. Substituting these values in(11), we find that the decline deriving from the change in GDP compositionwas –0.14, that is 14 per cent of the total change in energy intensity. Therest –86 per cent – is explained by the increase in technical efficiency.38
Italy is characterised by light industry and the industry–services’ differencein intensity is relatively small. The same result for Italy could be reachedwith a different combination of our coefficients: taking, for instance, anenergy-intensive industry and a smaller decline of industry in the structureof the economy. If we assume services with an energy intensity of 40 per centthat of industry (and then, a difference of 60 per cent between the energyintensities in industry and services) and a rise of 14 percentage points in theservices, the result on the aggregate energy intensity would be 28 per cent.It seems that in any case the influence of a structural change on energyintensity, within plausible values both for the difference in energy intensityin industry-services and structural change, has been marginal in the recentthree decades.
We have to notice, furthermore, that the passage to a service economyis largely an illusion in terms of real production, since it is generated bythe fall in the price of manufacturing goods relative to services, which isin turn caused by more rapid productivity growth in manufacturing thanin services.39 Efficient production, which is still mainly of industrial goods,provides great scope for consumption in the service economy. It is of coursetrue that parts of the service sector have high productivity and containinputs from the industrial sector, such as computers, which complicatesthe picture.40 Baumol’s main argument is still relevant: that is, for activitieswhere human time makes up part of the product (the services) it is not
37 In the following we use sector shares in constant prices.38 Reliable data on sectoral energy intensity are available only for the last three decades in
our four countries. However, for the Swedish case it has been possible to establish a fewbenchmarks, allowing us to prove that the structural effects from industrialisation wereincreasing energy intensity (Kander 2002; Kander and Lindmark 2004).
39 Baumol (1967), Kander (2005).40 Baumol (1985).

Energy transition in Europe over 200 years 241
possible to rationalise production by substituting machines for labour, andsuch labour-intensive activities make up a large share of the service sector.
Still, the more rapid decline in energy intensity after 1973 compared toearlier periods has partly to do with the increase in the relative price of energywhich has stimulated energy savings, and partly to do with the changeswithin the industrial sector, with a relative growth of energy-light brancheslike information and communication technology and bio-technology, plusthe indirect energy-saving effects of introducing ICT in many of theseindustrial branches.41 The grand transformation of societies related to themicro-electronic revolution, sometimes referred to as the third industrialrevolution, is thus partly responsible for the relative savings of energy.42
5. Concluding remarks
Our two aims in the present research have been:
1. Analysis of the process of the energy transition in four Europeancountries, representative of the North and South;
2. Revision of the widely held opinion that energy intensity shows thepattern of an inverted U-curve.
We have investigated energy consumption in the long term in Sweden,Holland, Spain and Italy and the energy transition taking place in ourfour countries. The relative importance of the traditional energy carriersdiffered among the countries, with Sweden relying upon firewood, Spainand Italy upon fodder and food, and wind and peat being substantial inthe Netherlands. The coal age was a twentieth-century phenomenon, buthere too, its maximum share in energy consumption varied between 42 and84 per cent.
In order to analyse energy consumption, we used a Commoner-Ehrlichtype of decomposition of the aggregate into major components, population,income per capita and energy intensity as a proxy for technology. Our mainresult has been the reshaping of the trend of energy intensity on the basisof our new data on traditional energy carriers in a very long perspective.The dominating view of an inverted U movement in energy intensity is notconfirmed by our research and depended on concentration, by most scholars,only upon ‘modern’ energy carriers. Our figures show, on the contrary, along-term decline in energy intensity.
As to the causes of this declining trend, there is reason to be scepticalabout the commonly held belief of a correlation between energy intensitydecline and the rising importance of services in the economic structure.In each of our four countries this change did not account for more than15 per cent of the total reduction of energy intensity. Our opinion is,
41 Martensson (1995)42 Schon (1990), Kander (2005).

242 European Review of Economic History
therefore, that technological changes accounted much more for this declinethan the rise of services. In any case, looking at the movement of energyconsumption and energy-GDP in a very long perspective, there are somegrounds for being less pessimistic than the majority of observers. Technicaladvance has over the long run limited the rise in energy consumption and itsimportance has grown in the last few decades. So, a continuing decrease inenergy intensity could realistically enable further economic growth.
References
ALBERS, R. M. (2002). Machinery Investment and Economic Growth: The Dynamicsof Dutch Development 1800–1913. Amsterdam: Aksant.
ANG, B. W. and ZHANG, F. (2000). A survey of index decomposition analysis inenergy and environmental studies. Energy 25, pp. 1149–76.
AYERS, R. and WARR, B. (2003). Energy, power and work in the US economy,1900–1998. Energy 28, pp. 219–73.
AYRES, R. and WARR, B. (2005). Accounting for growth: the role of physical work.Structural Change and Economic Dynamics 16, pp. 181–209.
BARDINI, C. (1998). Senza carbone nell’eta del vapore. Gli inizidell’industrializzazione italiana. Milano: B. Mondadori.
BARTOLETTO, S. (2004). Dalla legna al carbon fossile. I consumi di combustibilea Napoli nel corso dell’Ottocento. Melanges de l’Ecole Francaise de Rome 116,pp. 705–21.
BAUMOL, W. J. (1967). Macroeconomics of unbalanced growth: the anatomy ofurban crises. The American Economic Review 57, pp. 415–26.
BAUMOL, W. (1985). Unbalanced growth revisited: asymptotic stagnancy and newevidence. The American Economic Review 75, pp. 806–18.
CASLER, S. D. and HANNON, B. (1989). Readjustment potentials in industryefficiency and structure. Journal of Environmental Economics and Management 17,pp. 93–108.
CLO, A. (1994). Crisi energetica: consumi, risparmi e penetrazione elettrica. In G.Zanetti (ed.), Storia dell’industria elettrica in Italia, vol. 5: Gli sviluppi dell’ENEL,1963–1990. Roma-Bari: Laterza.
COMMONER, B. (1971a). The Closing Circle: Confronting the Environmental Crisis.London: Jonathan Cape.
COMMONER, B. (1971b). The environmental cost of economic growth. In S.Schurr (ed.), Energy, Economic Growth and the Environment. Baltimore, MD andLondon: Johns Hopkins University Press.
COOK, E. (1976). Man, Energy, Society. San Francisco: Freeman.EHRLICH, P. and EHRLICH, A. (1990). The Population Explosion. London:
Hutchinson.EHRLICH, P., EHRLICH, A. and HOLDREN, J. (1977). Ecoscience: Population,
Resources, Environment. San Francisco, Freeman.EKINS, P. (2000). Economic Growth and Environmental Sustainability: The Prospects
for Green Growth. London: Routledge.GALES, B. P. A. (2000). Delfstoffen. Schot, J. W. et al. (eds.), Techniek in Nederland
in de twintigste eeuw, vol. II: Delfstoffen, Energie en chemie. Zutphen: Walburg Pers.

Energy transition in Europe over 200 years 243
GALES, B. P. A (2007). Energy Consumption in the Netherlands in the 19th and 20thCenturies: A Statistical Outline. Naples: CNR-ISSM (forthcoming).
GALLI, R. (1998). The relationship between energy intensity and income levels.forecasting long term energy demand in Asian emerging countries. EnergyJournal 19, pp. 85–105.
GOLDENBERG, J. and REDDY, A. K. N. (1990). Energy for the developing world.Scientific American 263, pp. 111–18.
GOWDY, J. M. and MILLER, J. L. (1987). Technological and demand change inenergy use: an input-output analysis. Environment and Planning 19, pp. 1387–98.
GRUBLER, A. (1998). Technology and Global Change. Cambridge: CambridgeUniversity Press.
GRUBLER, A. (2004). Transition in energy use. Encyclopedia of Energy 6,pp. 163–77.
HOLTZ-EAKIN, D. and SELDEN, T. M. (1995). Stoking the fires? CO2 emissionsand economic growth. Journal of Public Economics 57, pp. 85–102.
HOWARTH, R. (1997). Energy efficiency and economic growth. ContemporaryEconomic Policy 15, pp. 1–9.
HUMPHREY, W. S. and STANISLAV, J. (1979). Economic growth and energyconsumption in the UK, 1700–1975. Energy Policy 7, pp. 29–42.
KANDER, A. (2002). Economic Growth, Energy Consumption and CO2 Emissions inSweden 1800–2000. Lund Studies in Economic History no. 19.
KANDER, A. (2005). Baumol’s disease and dematerialization of the economy.Ecological Economics 55, pp. 119–30.
KANDER, A. and LINDMARK, M. (2004). Energy consumption, pollutantemissions and growth in the long run: Sweden through 200 years. EuropeanReview of Economic History 3, pp. 297–335.
KANDER, A. and SCHON, L. (2007). The energy-capital relation: Sweden1870–2000. Structural Change and Economic Dynamics (forthcoming).
KAUFMANN, R. K. (2004). The mechanisms for autonomous energy intensityincreases: a cointegration analysis of the US energy/GDP ratio. Energy Journal25, pp. 63–86.
MADDISON, A. (1995). Monitoring the World Economy, 1820–1992. Paris: OECD.MALANIMA, P. (1996). Energia e crescita nell’Europa preindustriale. Roma: La Nuova
Italia Scientifica.MALANIMA, P. (2006). Energy Consumption in Italy in the 19th and 20th Centuries: A
Statistical Outline. Naples: CNR-ISSM.MARTIN, J.-M. (1988). L’intensite energetique de l’activite economique dans les
pays industrialises. Les evolutions de tres longue periode livrent-elles desenseignements utiles? Economies et Societes 4, pp. 9–27.
MAZZANTI, M., MUSOLESI, A. and ZOBOLI, R. (2006). A Bayesian approach tothe estimation of environmental Kuznets curves for CO2 emissions, Nota dilavoro, Fondazione ENI Enrico Mattei.
MARTENSSON, A. (1995). Energy Systems and Technology Change: Enhancing EnergyEfficiency by Using Information Technology and Options for Power Production.Sweden: Alnarp.
PANAYOTOU, T., PETERSON, A. and SACHS, J. (2000). Is the environmentalKuznets curve driven by structrual change? What extended time series mayimply for developing countries. Discussion Paper no. 80, CAER II.

244 European Review of Economic History
PRADOS DE LA ESCOSURA, L. (2003). El progreso economico de Espana 1850–2000.Madrid: Fundacion BBVA.
RUBIO, M. D. M (2005). Economıa, energıa y CO2: Espana 1850–2000. CuadernosEconomicos de ICE 70, pp. 51–75.
RUBIO, M. D. M (forthcoming). Energy Consumption in Spain in the 19th and 20thCenturies: A Statistical Outline. Naples: CNR-ISSM.
SCHON, L. (1990). Elektricitetens betydelse for svensk industriell utveckling.Stockholm: Vattenfall.
SCHON, L. and KRANTZ, O. (2007). Swedish Historical National Accounts,1800–2000. Lund, forthcoming.
SCHURR, S. H. and NETSCHERT, B. C. (1978). Energy in the American Economy,1850–1975: An Economic Study of its History and Prospects. Baltimore, MD: JohnsHopkins University Press.
SILVESTRI, M. (1989). Il futuro dell’energia. Torino: Bollati Boringhieri.SMIL, V. (2003). Energy at the Crossroads: Global Perspectives and Uncertainties.
Cambridge (MA) and London: The MIT Press.SMITS, J.-P., HORLINGS, E. and VAN ZANDEN, J. L. (2000). Dutch GNP and its
Components, 1800–1913. Groningen: Groningen Growth and DevelopmentCentre.
STERN, D. I. (2004). The rise and fall of the environmental Kuznets curve. WorldDevelopment 32, pp. 1419–39.
SUMMERS, C. M. (1971). The conversion of energy. Scientific American 224,pp. 148–63.
TONINELLI, P. A. (1999). La questione energetica. F. Amatori, D. Bigazzi, R.Giannetti and L. Segreto (eds.), Storia d’Italia, Annali, vol. 15: L’industria.Torino: Einaudi.
VAN DER WOUDE, A. (2003). Sources of energy in the Dutch Golden Age. In S.Cavaciocchi (ed.), Economia e energia secc. XIII–XVIII. Firenze: Le Monnier.
VAN ZANDEN, J. L. (1997). Werd de gouden eeuw uit turf geboren? Over hetenergieverbruik in de Republiek in de zeventiende en achttiende eeuw.Tijdschrift voor Geschiedenis 110, pp. 484–99.
WAGNER, M. and FURSTENBERGER, G. M. (2004). The carbon Kuznets curve: acloudy picture emitted by bad econometrics? Discussion Papers, University ofBern, December 2004.
Appendix
The series of energy consumption exploited in the present article include bothtraditional and modern energy carriers. The traditional energy carriers are firewood,food for the population and fodder for draught animals, direct working water, windand peat. The modern energy carriers are coal, oil, natural gas and electricity.
We go as far back in the different countries as the direct data allow. For Swedenand the Netherlands this means back to 1800, for Spain to 1850 and for Italy to1861. The methods followed in the collection and elaboration of the basic data arefully explained by Kander (2002) and Malanima (2006). See also Rubio (2005).43
Here we recall only some main features.
43 Spanish firewood data were updated for this article with regard to the figures in Rubio(2005).

Energy transition in Europe over 200 years 245
Firewood consumption is based on direct information in documents and coevalliterature on the subject. Men’s and working animals’ energy is the food theyconsume. Both for water and wind, the best possibility for estimating energy isthrough power. In order to estimate energy consumption from power, we have toknow for how long the engine – mill or ship – worked; which can be found inthe coeval literature on the topic. Peat in the Netherlands is included among thetraditional carriers.
Data on modern energy carriers are more easily available in production or importstatistics and are less problematic.
The series are expressed in joules. GJ = 109 J, PJ = 1015J. For people used to seeingenergy expressed in calories or tons of oil-equivalents, the conversion factors are: 1
Toe = 10 Gcal = 42 GJ.
Table 1A. Total energy consumption (PJ), consumption per capita (GJ)and percentage of traditional carriers in Sweden and the Netherlands1800–2000.
Sweden Netherlands
TotalPJ
Per c.GJ
Trad.%
TotalPJ
Per c.GJ
Trad.%
1800 110.5 47.3 99.8 46.1 21.8 90.61801 110.8 47.3 99.7 46.4 21.9 90.31802 110.4 46.8 99.8 46.8 22.0 90.01803 111.3 46.8 99.7 45.8 21.5 92.51804 111.2 46.5 99.6 46.4 21.7 91.71805 111.7 46.3 99.7 46.6 21.7 91.61806 112.0 46.3 99.5 47.0 21.8 91.21807 111.2 45.8 99.4 46.3 21.4 92.91808 110.4 45.7 99.2 45.8 21.2 94.21809 106.7 44.6 99.3 45.8 21.3 94.31810 106.2 44.3 99.5 45.7 21.2 95.01811 106.5 44.2 99.6 45.8 21.2 95.21812 106.8 44.2 99.6 46.0 21.2 95.31813 106.6 44.0 99.7 46.3 21.3 94.81814 106.5 43.7 99.7 46.3 21.2 94.81815 107.5 43.6 99.5 46.6 21.1 94.51816 109.7 43.9 99.5 46.7 20.9 94.91817 110.1 43.7 99.5 48.0 21.3 92.91818 110.7 43.5 99.6 48.5 21.3 92.21819 111.3 43.4 99.6 49.6 21.5 92.21820 111.9 43.3 99.6 50.9 21.8 91.91821 111.7 42.8 99.6 51.4 21.7 91.71822 112.1 42.4 99.6 51.6 21.5 91.91823 113.6 42.2 99.6 52.2 21.5 91.81824 114.4 41.9 99.6 53.6 21.7 90.41825 115.2 41.6 99.6 55.1 21.9 88.91826 115.8 41.3 99.6 55.8 21.9 88.41827 115.5 40.8 99.5 56.4 22.0 88.01828 115.7 40.6 99.6 57.5 22.3 87.01829 114.5 40.0 99.6 57.8 22.1 87.6

246 European Review of Economic History
Table 1A. Continued.
Sweden Netherlands
TotalPJ
Per c.GJ
Trad.%
TotalPJ
Per c.GJ
Trad.%
1830 115.1 39.9 99.4 58.6 22.2 87.11831 114.9 39.6 99.6 57.2 21.6 89.71832 115.0 39.3 99.6 58.8 22.1 86.51833 115.4 39.0 99.6 58.5 21.8 87.81834 115.5 38.7 99.4 57.9 21.4 89.61835 117.0 38.7 99.3 60.1 22.0 88.41836 117.5 38.4 99.3 62.2 22.5 87.91837 117.4 38.2 99.4 64.6 23.1 86.81838 117.4 38.0 99.3 68.1 24.1 85.71839 117.8 37.9 99.2 68.9 24.1 86.51840 118.4 37.7 99.2 71.7 24.9 84.61841 118.8 37.4 99.2 69.1 23.7 85.41842 119.6 37.3 98.9 69.4 23.5 85.91843 119.5 36.9 99.1 70.1 23.5 84.91844 119.2 36.4 99.1 69.3 23.0 85.91845 119.6 36.1 98.8 73.1 24.0 80.81846 120.6 36.1 98.9 73.5 24.0 85.61847 120.7 35.9 99.0 75.8 24.7 82.11848 121.8 35.8 98.5 73.9 24.1 82.51849 121.8 35.4 98.3 74.1 24.1 82.51850 123.4 35.4 98.0 77.1 24.9 81.41851 124.8 35.5 97.9 79.4 25.4 83.01852 125.4 35.4 97.9 81.7 25.8 81.31853 125.5 35.2 98.0 79.5 24.9 81.41854 127.5 35.3 97.6 83.8 26.1 79.11855 129.5 35.6 97.5 84.7 26.2 77.01856 131.0 35.7 96.4 90.1 27.7 79.11857 132.6 35.9 95.5 89.6 27.4 79.21858 133.7 35.8 95.7 89.7 27.2 77.01859 137.3 36.2 94.5 90.5 27.4 76.01860 139.0 36.0 94.6 95.2 28.7 71.81861 142.2 36.3 93.3 93.8 28.1 74.81862 144.7 36.5 93.2 97.3 28.9 75.81863 145.5 36.2 93.3 98.4 29.0 76.31864 148.0 36.4 93.0 109.5 31.9 66.61865 149.2 36.3 92.8 114.6 33.1 63.51866 150.6 36.2 92.6 117.6 33.7 61.91867 150.5 35.9 93.1 118.3 33.7 61.91868 151.5 36.3 92.0 122.4 34.5 61.61869 150.5 36.2 92.9 124.0 34.7 61.01870 153.0 36.7 91.3 129.9 36.0 58.31871 153.9 36.6 90.8 132.6 36.5 57.31872 162.0 38.1 88.9 134.9 36.8 56.31873 162.6 37.8 89.0 135.3 36.6 58.01874 161.8 37.3 87.9 131.8 35.2 59.81875 168.7 38.5 86.0 139.0 36.7 56.61876 171.8 38.8 85.2 147.5 38.5 53.5

Energy transition in Europe over 200 years 247
Table 1A. Continued.
Sweden Netherlands
TotalPJ
Per c.GJ
Trad.%
TotalPJ
Per c.GJ
Trad.%
1877 173.0 38.6 84.5 148.3 38.2 53.21878 169.3 37.4 86.6 147.8 37.6 49.91879 170.5 37.2 86.5 153.5 38.5 48.01880 178.2 39.0 83.5 161.4 40.0 45.31881 176.9 38.7 83.9 164.3 40.3 44.31882 180.6 39.4 82.2 167.2 40.5 43.41883 183.3 39.8 81.4 172.7 41.3 39.91884 185.8 40.0 80.7 168.6 39.9 40.91885 189.3 40.4 79.6 168.8 39.5 40.81886 187.2 39.7 79.8 174.3 40.3 39.51887 187.4 39.6 79.4 174.9 40.0 39.41888 190.6 40.2 77.6 188.4 42.5 36.51889 197.8 41.4 74.7 186.1 41.5 37.01890 200.0 41.8 74.8 181.8 40.1 37.61891 202.5 42.2 73.6 185.0 40.3 36.91892 201.8 42.0 73.6 194.0 41.9 36.81893 202.0 41.9 73.3 191.8 40.9 35.01894 213.8 43.9 70.1 193.5 40.8 34.81895 215.2 43.7 69.9 194.9 40.6 34.11896 220.4 44.4 69.6 204.5 42.0 33.11897 230.2 46.0 67.5 215.5 43.7 32.01898 235.3 46.5 66.2 212.4 42.5 33.31899 254.1 49.9 60.7 218.1 43.0 33.91900 259.8 50.6 61.4 229.9 44.8 30.31901 250.0 48.3 62.5 222.4 42.8 29.21902 258.9 49.8 62.1 218.6 41.5 29.41903 266.6 51.1 59.5 230.2 43.1 28.11904 271.7 51.7 58.1 241.3 44.5 26.81905 279.9 52.9 59.9 246.4 44.8 26.61906 293.9 55.1 57.5 262.5 47.1 25.11907 309.6 57.6 54.3 270.3 47.8 24.51908 315.9 58.2 52.0 275.6 48.1 24.31909 299.7 54.7 53.2 287.4 49.4 23.41910 320.9 58.1 54.8 290.7 49.2 22.21911 316.7 56.9 54.6 309.1 51.6 22.31912 329.8 58.9 52.3 349.3 57.4 23.11913 362.8 64.3 51.1 390.4 63.1 16.11914 356.7 62.8 53.2 342.6 54.5 19.31915 363.9 63.7 52.9 350.8 54.9 19.01916 390.7 67.9 53.5 332.9 51.4 20.91917 304.3 52.5 73.5 255.9 38.9 30.21918 315.6 54.3 69.8 231.7 34.9 33.21919 304.9 52.1 70.1 309.5 46.1 24.61920 312.6 52.9 61.1 314.7 46.2 23.91921 243.5 40.9 70.3 319.0 46.1 19.91922 289.3 48.3 59.5 364.3 51.8 17.31923 313.5 52.2 54.9 364.5 51.1 17.2

248 European Review of Economic History
Table 1A. Continued.
Sweden Netherlands
TotalPJ
Per c.GJ
Trad.%
TotalPJ
Per c.GJ
Trad.%
1924 347.8 57.6 51.4 401.2 55.3 15.61925 327.6 54.1 53.4 418.7 56.9 15.01926 324.3 53.4 53.8 425.8 57.0 14.71927 379.8 62.4 45.4 468.2 61.8 13.31928 362.3 59.3 47.4 481.7 62.8 13.01929 401.8 65.6 43.7 522.6 67.2 11.91930 392.9 64.0 43.5 513.4 65.1 12.11931 387.9 62.9 42.5 510.4 63.8 12.21932 381.3 61.6 42.1 490.5 60.4 12.61933 393.8 63.4 41.4 498.0 60.5 12.41934 422.2 67.7 39.4 504.2 60.4 12.31935 435.6 69.7 38.0 490.1 58.1 12.81936 462.6 73.8 35.3 507.6 55.5 12.51937 505.7 80.5 32.0 553.9 60.3 11.51938 473.3 75.0 33.4 547.0 58.9 11.91939 599.5 94.5 40.9 592.5 63.4 11.21940 480.1 75.4 52.0 455.4 47.2 14.91941 460.0 71.8 58.2 435.7 48.6 15.21942 456.0 70.6 62.1 422.8 46.8 16.31943 485.9 74.5 57.3 422.0 46.4 15.91944 450.3 68.3 61.4 304.4 33.2 21.81945 450.2 67.5 80.0 236.4 25.5 27.91946 421.6 62.3 42.1 459.9 48.8 14.21947 497.5 72.7 31.6 558.0 57.9 11.91948 534.1 77.1 27.3 635.6 64.9 10.91949 491.7 70.4 28.6 641.6 64.5 10.41950 573.7 81.5 24.0 628.0 62.1 9.91951 633.2 89.2 20.7 713.2 35.2 14.51952 642.7 89.9 19.6 716.1 35.1 14.71953 608.8 84.6 19.8 671.1 64.0 9.21954 629.0 86.9 18.7 714.2 67.3 8.81955 720.0 98.8 15.8 738.6 68.7 8.31956 789.1 107.5 13.8 823.3 75.6 7.41957 767.0 103.8 13.7 841.8 76.3 7.21958 754.6 101.6 13.4 803.6 71.8 7.81959 696.9 93.4 13.7 844.6 74.4 7.51960 811.6 108.2 11.4 888.2 77.3 7.11961 805.7 106.8 11.1 861.9 74.1 7.31962 855.8 112.9 9.6 958.2 81.2 6.41963 906.9 118.9 8.6 1,074.0 89.8 5.71964 992.3 129.0 7.6 1,106.3 91.2 5.51965 1,020.9 131.3 6.9 1,139.9 92.7 5.31966 1,136.9 145.0 6.0 1,246.0 100.0 4.91967 1,093.0 138.5 6.0 1,271.2 100.9 4.71968 1,214.1 153.0 5.1 1,439.9 113.1 4.11969 1,319.6 164.9 4.6 1,537.8 119.4 3.8

Energy transition in Europe over 200 years 249
Table 1A. Continued.
Sweden Netherlands
TotalPJ
Per c.GJ
Trad.%
TotalPJ
Per c.GJ
Trad.%
1970 1,444.5 178.7 4.2 1,807.5 138.6 3.31971 1,386.0 170.8 4.1 1,862.6 141.2 3.21972 1,385.5 170.4 4.1 2,063.9 154.8 2.81973 1,445.1 177.4 3.9 2,186.0 162.7 2.71974 1,409.4 172.4 4.0 2,305.3 170.2 2.61975 1,455.2 177.3 3.6 2,051.4 150.1 2.91976 1,511.8 183.6 3.8 2,296.0 166.7 2.71977 1,462.4 176.9 4.2 2,269.8 163.8 2.81978 1,382.5 166.9 4.9 2,358.6 169.2 2.61979 1,572.0 189.3 4.6 2,664.1 189.8 2.31980 1,440.6 173.2 5.5 2,472.7 174.8 2.61981 1,292.0 155.2 6.9 2,216.3 155.6 2.91982 1,276.7 153.3 7.5 2,049.8 143.2 3.11983 1,323.8 158.9 8.0 2,113.4 147.1 3.01984 1,319.0 158.1 8.5 2,312.2 160.3 2.81985 1,442.7 172.6 7.9 2,300.0 158.7 2.81986 1,518.7 181.2 7.5 2,449.5 168.1 2.61987 1,417.7 168.5 7.7 2,400.7 163.7 2.91988 1,508.7 178.4 8.9 2,361.7 160.0 2.91989 1,424.3 167.0 9.1 2,402.1 161.8 2.51990 1,441.3 167.8 11.4 2,429.8 162.5 2.51991 1,428.3 165.2 13.0 2,600.1 172.5 2.41992 1,412.4 162.5 16.4 2,549.7 167.9 2.41993 1,427.8 163.3 14.0 2,514.9 164.5 2.51994 1,442.0 163.6 17.5 2,672.6 173.7 2.31995 1,477.2 167.2 15.1 2,654.0 171.7 2.41996 1,488.4 168.3 15.8 2,916.9 187.8 2.21997 1,495.9 169.1 16.0 2,857.3 183.0 2.21998 1,500.0 169.4 16.6 2,757.1 175.5 2.31999 1,492.7 168.5 16.7 2,695.5 170.5 2.42000 1,485.0 167.2 16.2 2,916.9 183.2 2.2
Table 2A. Total energy consumption (PJ), consumption per capita (GJ)and percentage of traditional carriers in Italy and Spain 1850–2000.
Italy Spain
TotalPJ
Per c.GJ
Trad.%
TotalPJ
Per c.GJ
Trad.%
1850 300.5 20.2 98.41851 303.9 20.3 96.81852 302.4 20.1 96.81853 300.6 19.9 96.81854 298.7 19.6 96.71855 294.7 19.3 96.71856 304.8 19.8 94.6

250 European Review of Economic History
Table 2A. Continued.
Italy Spain
TotalPJ
Per c.GJ
Trad.%
TotalPJ
Per c.GJ
Trad.%
1857 305.4 19.8 94.61858 306.1 19.7 94.61859 303.0 19.4 94.61860 300.5 19.2 94.51861 485.3 18.8 92.8 305.4 19.5 92.71862 480.3 18.5 93.5 306.3 19.5 92.01863 484.5 18.6 93.5 307.0 19.5 91.21864 483.7 18.4 93.7 304.9 19.3 91.51865 490.2 18.5 93.6 305.9 19.3 91.71866 497.3 18.7 93.8 300.4 18.9 91.51867 467.5 17.4 93.1 302.9 19.0 90.91868 466.6 17.3 93.0 306.0 19.2 90.61869 476.3 17.5 93.2 308.2 19.2 90.61870 483.4 17.7 93.1 309.7 19.3 89.51871 478.5 17.3 94.1 306.9 19.1 89.11872 485.5 17.5 93.0 304.8 18.9 88.91873 486.8 17.5 93.4 311.6 19.3 88.41874 501.3 17.9 92.8 302.5 18.6 88.21875 510.9 18.1 92.8 303.1 18.6 87.21876 529.1 18.6 90.9 308.9 18.9 86.21877 515.9 18.0 91.4 314.6 19.2 86.21878 512.8 17.8 91.2 312.0 18.9 86.71879 530.1 18.3 90.1 306.6 18.5 85.21880 546.5 18.8 89.2 318.5 19.1 84.11881 539.3 18.4 87.3 328.9 19.5 80.61882 528.6 17.9 86.0 329.6 19.4 80.01883 551.8 18.6 85.6 327.8 19.2 80.51884 559.4 18.7 84.3 332.2 19.3 80.01885 578.0 19.2 82.8 326.0 18.8 79.31886 574.0 18.9 82.9 327.7 18.8 78.21887 602.8 19.7 80.2 332.1 18.9 77.71888 599.9 19.5 78.7 337.9 19.2 76.21889 597.6 19.3 77.9 340.8 19.2 74.71890 603.9 19.4 76.2 349.0 19.6 73.21891 596.0 19.0 78.2 351.6 19.7 72.21892 594.3 18.8 78.3 361.2 20.1 72.31893 578.4 18.2 78.4 350.5 19.4 71.41894 614.2 19.2 74.7 365.1 20.2 69.61895 594.3 18.4 76.0 361.4 19.9 69.31896 595.3 18.3 77.2 376.0 20.6 68.31897 593.3 18.1 76.2 375.3 20.4 66.01898 599.5 18.2 75.5 379.7 20.6 67.01899 625.7 18.9 74.2 394.1 21.3 63.31900 628.4 18.8 73.7 407.0 21.9 62.01901 646.1 19.3 75.0 423.0 22.6 62.61902 665.3 19.7 73.0 441.2 23.4 63.6

Energy transition in Europe over 200 years 251
Table 2A. Continued.
Italy Spain
TotalPJ
Per c.GJ
Trad.%
TotalPJ
Per c.GJ
Trad.%
1903 658.4 19.5 72.1 426.8 22.5 62.91904 674.9 19.8 71.1 417.4 21.8 59.11905 680.6 19.9 68.7 427.0 22.2 58.71906 729.7 21.2 65.1 438.7 22.6 58.01907 747.1 21.6 63.1 444.5 22.8 57.81908 769.5 22.0 63.2 442.1 22.5 56.61909 805.7 22.9 61.3 448.8 22.7 56.21910 819.4 23.0 61.7 473.1 23.7 57.31911 820.5 22.9 60.4 473.2 23.6 55.61912 844.9 23.4 59.7 503.9 24.9 55.01913 874.7 24.1 58.1 509.1 25.0 53.11914 846.3 22.7 60.9 488.9 23.9 57.01915 845.2 22.4 65.4 464.8 22.5 59.11916 842.4 22.3 65.1 503.7 24.3 56.21917 749.0 20.0 72.1 487.0 23.3 58.61918 795.7 21.6 69.3 510.6 24.3 57.41919 776.1 21.0 70.6 500.6 23.7 60.31920 744.0 20.0 69.9 509.0 23.9 64.71921 811.7 21.7 67.6 499.6 23.2 62.31922 855.0 22.6 64.5 500.0 23.0 62.01923 882.7 23.2 63.8 549.9 25.0 59.21924 956.2 24.9 58.4 559.2 25.2 57.41925 958.4 24.8 59.7 617.9 27.5 60.41926 1,024.1 26.2 56.4 568.2 25.1 57.81927 1,072.7 27.2 53.1 605.8 26.5 53.71928 1,017.4 25.6 54.2 588.5 25.5 53.01929 1,090.3 27.2 50.7 626.9 26.9 50.81930 1,032.5 25.5 51.4 623.0 26.4 51.41931 952.4 23.3 53.4 635.7 26.7 54.01932 875.4 21.3 57.3 617.1 25.7 55.11933 912.4 22.0 54.8 590.2 24.3 58.41934 1,003.6 24.0 48.3 467.9 19.1 46.21935 1,070.6 25.4 45.1 518.4 21.0 45.11936 901.1 21.2 52.21937 1,077.9 25.2 45.81938 1,073.3 24.9 47.11939 1,077.8 24.7 46.81940 1,152.6 26.2 45.3 655.4 25.3 51.21941 1,111.9 25.1 52.6 622.2 23.8 50.21942 1,137.1 25.5 55.2 619.3 23.5 49.51943 957.7 21.4 58.8 604.0 22.8 43.61944 614.6 13.7 71.5 611.0 22.9 43.21945 571.9 12.7 73.6 616.1 22.9 42.91946 776.3 17.1 58.8 651.9 24.0 41.71947 1,030.7 22.5 48.1 660.9 24.2 40.91948 1,040.4 22.5 50.4 687.3 24.9 40.1

252 European Review of Economic History
Table 2A. Continued.
Italy Spain
TotalPJ
Per c.GJ
Trad.%
TotalPJ
Per c.GJ
Trad.%
1949 1,100.8 23.7 47.4 714.6 25.7 38.51950 1,155.7 24.7 45.3 747.3 26.7 38.51951 1,225.8 26.0 37.2 754.7 26.7 38.71952 1,258.2 26.5 36.7 816.8 28.7 36.31953 1,351.1 28.4 34.6 846.6 29.5 34.91954 1,473.4 30.7 31.7 871.2 30.1 34.21955 1,534.4 31.8 30.2 899.4 30.8 33.61956 1,556.1 31.9 29.3 957.7 32.5 31.81957 1,709.3 35.2 26.8 1,052.2 35.4 30.11958 1,643.6 33.6 28.1 1,075.5 35.9 29.91959 1,890.8 38.9 24.6 1,057.6 35.0 30.71960 2,078.0 42.4 22.8 1,036.5 34.1 31.11961 2,314.0 47.1 20.5 1,126.9 36.6 30.01962 2,582.5 52.1 18.5 1,171.2 37.6 29.51963 2,823.8 56.5 17.0 1,205.1 38.3 27.81964 3,049.6 60.5 15.9 1,260.1 39.6 26.11965 3,324.2 65.4 13.7 1,316.9 41.0 24.71966 3,531.2 68.9 13.0 1,409.7 43.4 21.51967 3,854.4 74.6 12.1 1,491.7 45.5 20.91968 4,258.1 81.8 11.1 1,666.8 50.3 18.11969 4,556.0 87.0 10.4 1,723.7 51.4 15.91970 5,128.1 97.2 9.4 1,864.6 55.0 15.01971 5,309.0 99.9 9.1 2,015.3 58.7 13.11972 5,750.3 107.5 8.5 2,075.9 59.7 12.31973 6,109.2 113.4 8.1 2,479.7 70.5 9.71974 6,066.9 111.5 8.1 2,573.9 72.4 9.41975 5,792.9 105.8 8.5 2,613.1 72.7 9.11976 6,202.8 112.6 7.9 2,795.5 77.1 8.41977 6,049.6 109.5 8.1 2,806.4 76.8 8.21978 6,222.4 112.2 7.8 2,881.2 78.0 7.91979 6,421.7 115.5 7.5 3,002.8 80.7 7.71980 6,329.0 113.7 7.6 3,095.7 82.6 7.41981 6,206.7 111.3 7.7 3,016.8 79.3 7.41982 6,017.5 107.5 8.0 3,040.1 79.6 7.61983 5,981.5 106.4 8.0 2,993.4 77.9 7.61984 6,078.0 107.9 7.9 2,988.6 76.2 7.61985 6,173.1 109.3 7.6 3,008.2 76.0 7.61986 6,238.0 109.0 7.6 3,050.2 75.8 7.31987 6,515.4 113.6 7.3 3,113.4 76.8 7.21988 6,651.5 115.8 7.1 3,167.5 77.0 7.21989 6,869.7 119.4 6.9 3,375.3 81.5 6.31990 6,932.6 120.1 6.9 3,486.3 84.2 6.11991 7,005.6 123.4 6.7 3,623.8 87.2 6.21992 7,061.6 124.0 6.7 3,670.2 87.9 6.11993 6,978.2 122.1 6.8 3,619.8 86.2 6.11994 6,852.5 119.7 6.9 3,762.8 89.5 5.7

Energy transition in Europe over 200 years 253
Table 2A. Continued.
Italy Spain
TotalPJ
Per c.GJ
Trad.%
TotalPJ
Per c.GJ
Trad.%
1995 7,200.5 125.7 6.6 3,938.5 93.5 5.71996 7,179.3 124.9 6.6 3,958.1 93.4 5.81997 7,284.8 126.6 6.5 4,249.3 100.3 5.21998 7,468.6 129.6 6.4 4,486.0 105.4 4.91999 7,579.1 131.4 6.3 4,716.9 110.6 4.82000 7,670.9 132.6 6.2 4,941.6 115.3 4.7