Embed Size (px)
Citation preview

By Stuart Shaw and Clare Bailey
Success in the US:Are Cambridge International Assessments Good Preparation for University Study?

FALL 2011 JOURNAL OF COLLEGE ADMISSION | 7WWW.NACACNET.ORG
Success in the US:Are Cambridge International Assessments Good Preparation for University Study?
IntroductionThis article focuses on the research being conducted by University of Cambridge International Examinations (Cambridge) to ensure that its international assessments prepare students as well as Advanced Placement and International Baccalaureate for continued studies in colleges and universities. The primary purpose of the research is to highlight the predictive validity of Cambridge examinations and other students’ characteristics to predict preparedness for and continued academic success at US universities. Predictive validity is a measurement of how well a test predicts future performance and entails the comparison of test scores with some other measure for the same candidates taken some time after the test (see Anastasi 1988, Alderson, et al. 1995). For tests that are used for university selection purposes it is vital to demonstrate predictive validity.
The research reported here uses data collected from three years’
worth of students enrolled at Florida State University (FL).
The data include information about each student’s performance at
high school, ethnicity, gender, and first-year Grade Point Average
(GPA). Multilevel modelling has been applied to the data using
the statistical software package MLwiN to investigate the relation-
ships between the variables, and in particular to determine which
are the best indicators of academic success at university while
taking into account the effects of individual high schools.
High School Acceleration Programs
Advanced Placement (AP) has been a staple in US education
for more than 50 years. Designed to promote excellence in
secondary education, the program desires to allow motivated
students to work at their optimum capability. Nearly 1 million
US students now take at least one AP exam during their sec-
ondary careers. As Harvard (MA), Yale (CT) and Princeton (NJ)
Universities were active participants in the study that led to
the creation of AP, the acceptance of this credential is nearly
universal among American universities.
In the late 1960s the International Baccalaureate (IB) was found-
ed. While initially established as a single program for internation-
ally mobile students, the program has flourished throughout the
world, but nowhere greater than in the United States. By 2005
over 1,000 secondary schools in North America offered the IB
curriculum. The IB had to work diligently to have US universities
provide recognition similar to that provided to AP.
Cambridge provides international qualifications for five to 19-year-
olds. While Cambridge has been offering examinations for 150
years, it is relatively new in offering its curriculum in the United
States. The four-year Cambridge curriculum and exams leading
to an Advanced International Certificate of Education (AICE)
Diploma were introduced in Florida's Bay High School a little more
than 15 years ago. Cambridge is experiencing the same curve of
recognition as IB experienced in the 1970s and 1980s.
The Cambridge Acceleration Program
Cambridge offers the International General Certificate of Sec-
ondary Education (IGCSE), which is a two-year qualification
aimed at 14- to 16-year-olds. Cambridge IGCSE encourages
learner-centered and inquiry-based approaches to learning.
It has been designed to develop learners' skills in creative
thinking, inquiry and problem-solving, giving learners a sound
preparatory basis for the next stage in their education. More
than 70 subjects are available for study, and schools may offer
any combination of these subjects. In some IGCSE subjects,
there are two course levels, known as the Core Curriculum and
the Extended Curriculum. The Extended Curriculum includes
the material from the Core Curriculum, as well as additional,
more advanced material.
Cambridge also offers the international Advanced Subsidiary (AS)/
Advanced (A) Level which is a two-year international qualifica-
tion aimed at the 16–18 age range and is intended to follow the
IGCSE. The A-Level courses are designed to be flexible, and can
be structured in a variety of ways:
Option 1: Candidates can take all papers of the Cambridge Inter-
national A Level course in the same examination session, usually
at the end of the second year of study.
Option 2: Candidates can take a “staged” assessment route—
taking the Cambridge International AS Level in one examination
session and completing the final Cambridge International A Level
at a subsequent session. (The staged assessment route is not
possible in all subjects. For example, the outcomes awarded for
Cambridge International AS Level language syllabi cannot be
carried forward to Cambridge International A Level).

| FALL 2011 JOURNAL OF COLLEGE ADMISSION8 WWW.NACACNET.ORG
Given the increase in
the number of applications
for admission to colleges and
universities for the limited
number of seats in freshmen
classes, students and universities
in the US must consider
all available indicators for
success in higher education.
Option 3: Candidates can take the Cambridge Inter-
national AS Level only, either at the end of a one-
year or two-year course. The Cambridge Interna-
tional AS Level syllabus content is half a Cambridge
International A Level program.
Cambridge awards a Cambridge AICE Diploma to
students who have passed a prescribed number of
subject examinations at A level and/or the AS level.
To qualify for a Cambridge AICE Diploma, students
must pass at least one examination from each of
three subject groups to include mathematics and
sciences, languages (both foreign and first), and arts
and humanities. In the US, Cambridge International
AS and A level examinations are sometimes referred
to as “Cambridge AICE” or “AICE” examinations.
Students passing AS and A level examinations
may be awarded entry-level or intermediary-level
university course credit by examination or advanced
standing at US colleges and universities.
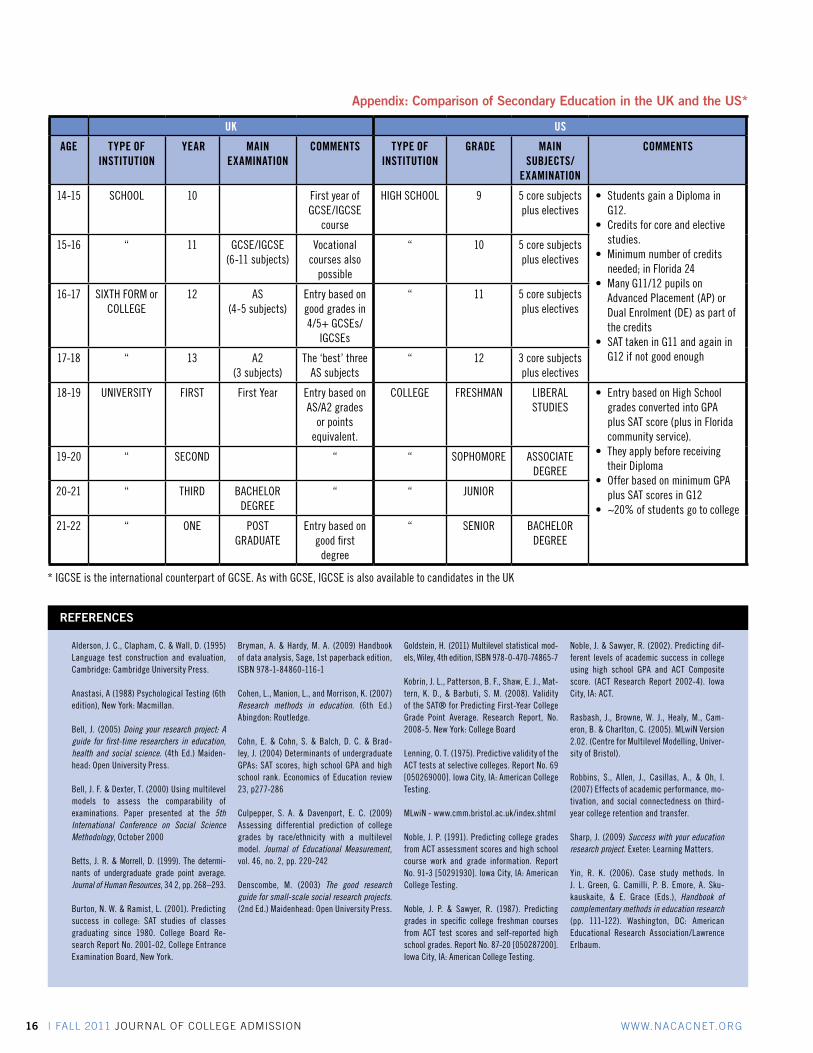
For the benefit of readers who may not be familiar with
the UK secondary school and university system, we
include a tabulated comparison of secondary educa-
tion in the UK and the US as an appendix on page 16.
High School Indicators for Success
Given the increase in the number of applications for
admission to colleges and universities for the limited
number of seats in freshmen classes, students and
universities in the US must consider all available
indicators of success in higher education. There are
many ways students can gain recognition to contribute
towards their university application. The standard
high school exam in the US is the SAT (formerly
known as the Scholastic Aptitude Test) although
in some states an alternative, the ACT (American
College Testing), is more popular. (Concordance
tables are published to find equivalences so that
SAT scores can be used for the minority of students
who take the ACT). In this article we are studying
students in Florida, where the majority take the
SAT exam. Although standardized test scores have
varying significance in the admission decisions of all
students who qualify for admission at universities in
the US, all potential US university students must
submit results of college entrance exams, either SAT
or ACT, in order for an application to be considered
complete in many universities. In addition to this,
students can choose to take other exams, such as
those that are part of the IB, the AP or Cambridge’s
International A level program, AICE.
The College Board encourages universities to use
SAT and high school grades when making admis-
sion decisions. However, high school grades are not
necessarily a good means of comparing students’
experiences and achievements at university. This is
because high school grades reflect the standards
and quality of a particular school or schooling sys-
tem. These standards differ according to school
area or region (e.g., urban or rural) and even in-
dividual schools. Moreover, inter-school effects are
not always reflected in high school grades (Burton
and Ramist 2001).
The primary purpose of the SAT is to measure
a student’s potential for academic success in
college. In this context, a number of studies that
attest to the predictive validity of the SAT have
been undertaken. (For a useful summary relating to
the predictive utility of SAT, ACT and high school
GPA (HSGPA) as indicators of university success
see Cohn, et al. 2004).
Cohn, Manion and Morrison (2004) used SAT
scores, HSGPA and high school class rank to deter-
mine how well these predict college GPA. Data were
collected from 521 students enrolled on Principles
of Economics at the University of South Carolina in
2000 and 2001. They examined the frequency dis-
tribution of key variables and regression analysis (no
multilevel model), with students grouped according
to gender and race. It was found that having a SAT
score of more than 1,100 (out of a possible 1600)
and a class rank of more than 70 gave a predicted
college GPA of around 3.0.
A large-scale national validity study of the revised
SAT (incorporating an additional section in writ-
ing and minor changes in content to the verbal
and mathematics sections) was undertaken by
Kobrin, Patterson, Shaw, Mattern, and Barbuti
(College Board, 2008). Their studies were based

FALL 2011 JOURNAL OF COLLEGE ADMISSION | 9WWW.NACACNET.ORG
on data from 150,000 students entering 110 US four-year col-
leges and universities in the fall 2006 and completing their
first year of college in May/June 2007. The writing section was
shown to be the single most predictive section of the test for
all students. The analyses also found the writing section to be
the most predictive across all minority groups. The studies also
revealed that:
• SAT is a strong predictor of how students perform in their first
year at university
• SAT is a stronger predictor than high school grades for all mi-
nority groups (African American, Hispanic, American Indian,
and Asian)
• the recently added writing section is the most predictive of the
three SAT sections.
Culpepper and Davenport (2009) studied a sample of 32,103
first-year students who were enrolled in one of 30 colleges or uni-
versities in 1995. They compared the attainment of students from
different racial/ethnic backgrounds, and found that an African-
American student with the same HSGPA, SAT or ACT score as a
white student was likely to have a lower college GPA.
However, not all studies have produced evidence that the SAT iden-
tifies the students most likely to succeed at university. Lenning
(1975) carried out three studies to determine whether ACT was as
good a predictor of college grades as SAT for highly-selective in-
stitutions. Although only three such institutions were studied, they
found that ACT scores could be at least as predictive, and likely
more predictive, of college grades at highly selective institutions
than SAT scores.
Noble and Sawyer (1987) considered the ACT scores and HSGPA
for students enrolled at 233 institutions across 2812 courses
in October 1985. They computed regression statistics for each
course. They found that including HSGPA gave a stronger predic-
tion of college GPA.
Noble (1991) conducted a study of 30 colleges, mainly located in
central and southern US, with a higher than representative pro-
portion of public colleges. It was found that ACT is a reasonable
predictor of college success, and that including HSGPA improves
the predictive validity.
A study by Betts and Morrell (1999) also indicated that HSGPA
(as well as SAT scores) are significant predictors of university GPA.
Methodology and Analysis
This study takes a case study approach using data from Florida
State University (FSU). Denscombe (2003) describes the key
characteristics of case study research: spotlight on one instance;
in-depth study; focus on relationships and process; natural setting;
and multiple sources and methods. (For detailed explanations and
discussions of case study research, see Denscombe, 2003; Bell,
2005; Cohen, Manion and Morrison, 2007; and Sharp, 2009).
FSU is a publicly-supported institution located in the state capital
of Tallahassee. FSU is a comprehensive, national graduate research
university with 40,255 students, 8,557 of whom are graduate stu-
dents. FSU is home to the National High Magnetic Field Laboratory
and the arts program—dance, film, music, and theatre—is widely
regarded within the US. Recently FSU added a College of Engineer-
ing and a College of Medicine. It also has a College of Law.
Research Hypotheses
The four principal hypotheses tested in this study may be stated
in the following way:
Hypothesis 1: Students who follow either the AP or IB or the Cam-
bridge AICE or no credit program achieve differentially on first-year
university GPA (given the same SAT scores).
Hypothesis 2: The differences in first-year university GPA between
males and females vary for students who follow each of the four
programs (given the same SAT scores).
Hypothesis 3: The differences in first-year university GPA between
student ethnic groups vary for students who follow each of the four
programs (given the same SAT scores).
Hypothesis 4: The differences in first-year university GPA between
student ethnic groups and between genders vary for students who
follow each of the four programs (given the same SAT scores).
Data and Measurement Issues
The SAT score (total SAT score, SAT-Tot) has been used as the
choice of measure for the high school performance. A point worthy
of note is when students take the SAT. If students take the SAT
late junior year or early senior year, then any additional accelera-
tion program, may have an effect on their score.
The concept of tertiary level academic success used here is deter-
mined by the persistence of a student within the university with a
specific GPA. The definition of university GPA employed is based
on the accumulation of all previous semesters’ work.

| FALL 2011 JOURNAL OF COLLEGE ADMISSION10 WWW.NACACNET.ORG
Recognizing how groups of
individuals can be nested can
help build a more realistic
picture, giving insight into where and
how effects are happening,
and this is what multilevel modelling aims
to do…
To fit the multilevel models we used data based
on records of more than 8,500 students who en-
tered FSU during the academic years 2007–2008,
2008–2009 and 2009–2010.
Four datasets representing secondary educational
programs were obtained from enrollment and ad-
mission staff at the university. The largest data set
(n = 6,382) contained information on students with
only the SAT (or ACT) score (hereafter referred to
as having “no credit”). The three other data sets
contained information on students with Cambridge
AICE credit (n = 144), with AP credit (n = 1,188)
and IB credit (n = 806). Figure 1 shows student
data in terms of relative proportions by race.
Figure 1: Proportion of Students by Race
White, 5,886, 70%
Black, 1,054, 12%
Native Hawaiian,15, 0%
Unreported,88, 1%
Hispanic,1,128, 13%
Native American,53, 1%
Asian, 296, 3%
Column headings for each of the four datasets in-
clude: FSU student number, year enrolled, race,
gender, FSU GPA, high school GPA, SAT verbal,
SAT math, SAT total, ACT (if applicable), high
school attended, type of exam program followed (if
applicable). The explanatory variables are set out
in Table 1.
The four data sets were combined into an overall
matrix. The structure of the data, which contain stu-
dents from (i.e., “nested within”) a number of high
schools, suggests the use of multilevel models. The
multilevel software package MLwiN (Version 2.02
Rasbash, et al. 2005) was therefore used.
Table 1: Explanatory Variables Definition
Generic data requirements
Variable explanation
FSU student number Unique student identifier
Race 1 = white, 2 = black, 3 = Asian, 4 = Native American, 5 = Hispanic, 6 = unreported, 7 = Native Hawaiian/other Pacific Islander
Gender M = male, F = female
FSU GPA Possible values from 0 to 4
High school GPA Possible values from 0 to 4 (or in some cases more than 4)
Matriculation year Year first enrolled at FSU
SAT verbal SAT score for critical reading component
SAT math SAT score for math component
SAT total Total SAT score
ACT composite ACT score
High school code Local high school identifier
Type of credit Exam program followed – Cambridge AICE, AP, IB or no credit
Credit hours Number of hours credit gained on a college course
Multilevel Modelling
Multilevel modelling is a way of finding a line
of regression through different groups, nests
or hierarchies of data (unlike standard multiple
regression techniques which assume that the
observations are independent, which is not the
case here). Multilevel modelling takes account of
the context in which a variable exists. It is often
used in sociological applications because indi-
viduals are affected by or defined by the groups
they belong to. For example, patients receiving
the same treatment for the same condition at dif-
ferent hospitals may experience different patient
outcomes; students in different classes or in dif-
ferent schools may obtain different exam results.
Recognizing how groups of individuals can be
nested can help build a more realistic picture,
giving insight into where and how effects are
happening, and this is what multilevel modelling
aims to do (see Goldstein 2011 or Bryman and
Hardy 2009 for a more detailed description of
multilevel modelling).
FALL 2011 JOURNAL OF COLLEGE ADMISSION | 11WWW.NACACNET.ORG
Not using a multilevel model as a result of failing to recognize
hierarchical structures makes it more likely that a significant dif-
ference is reported when in fact the difference is non-significant
(i.e., a false positive or type 1 error); standard errors of regression
coefficients will be underestimated, leading to an overstatement of
statistical significance.
As the outcome variable (FSU GPA scores—first-year examination
marks) is continuous, the model fitted was:
yij = β0ijx0 + β1xijβ0ij = v0j + ɛ0ij
where yij is the predicted outcome variable (FSU GPA score) for in-
dividual i in high school j, β0ij is a constant, β1 is the independent
contribution of the predictor variable to the dependent variable, xij
is a predictor variable, v0j is high school level residual error and ɛ0ij
is individual level residual error.
Multilevel models have been used in several predictive studies to take
into account the hierarchical structure of educational assessment
data. For example, Bell and Dexter (2000) used multilevel modelling
to investigate the comparability of IGCSE and GCSE (the UK equiva-
lent of IGCSE) and suggested that a wide between-school variation
can make results misleading. However, this is the first study to our
knowledge that uses multilevel modelling to compare the predictive
validity of different types of high school exam programs in the US.
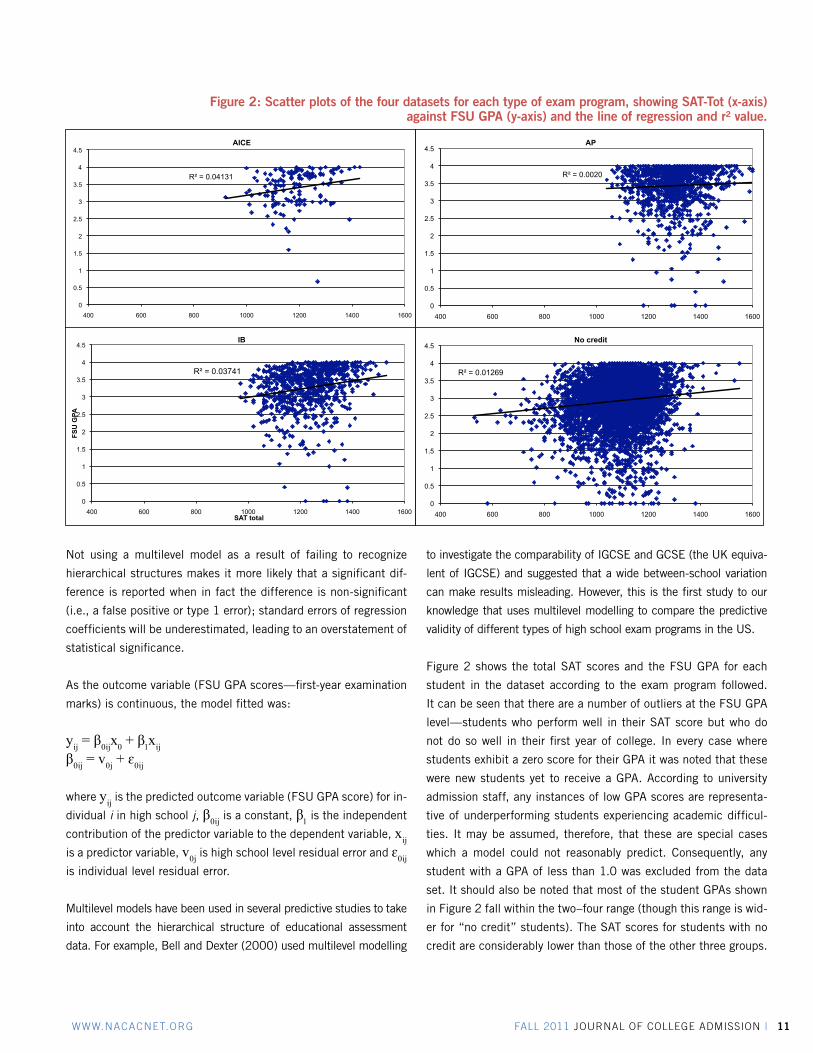
Figure 2 shows the total SAT scores and the FSU GPA for each
student in the dataset according to the exam program followed.
It can be seen that there are a number of outliers at the FSU GPA
level—students who perform well in their SAT score but who do
not do so well in their first year of college. In every case where
students exhibit a zero score for their GPA it was noted that these
were new students yet to receive a GPA. According to university
admission staff, any instances of low GPA scores are representa-
tive of underperforming students experiencing academic difficul-
ties. It may be assumed, therefore, that these are special cases
which a model could not reasonably predict. Consequently, any
student with a GPA of less than 1.0 was excluded from the data
set. It should also be noted that most of the student GPAs shown
in Figure 2 fall within the two–four range (though this range is wid-
er for “no credit” students). The SAT scores for students with no
credit are considerably lower than those of the other three groups.
R² = 0.04131
0
0.5
1
1.5
2
2.5
3
3.5
4
4.5
400 600 800 1000 1200 1400 1600
AICE
R² = 0.0020
0
0.5
1
1.5
2
2.5
3
3.5
4
4.5
400 600 800 1000 1200 1400 1600
AP
R² = 0.03741
0
0.5
1
1.5
2
2.5
3
3.5
4
4.5
400 600 800 1000 1200 1400 1600
FS
U G
PA
SAT total
IB
R² = 0.01269
0
0.5
1
1.5
2
2.5
3
3.5
4
4.5
400 600 800 1000 1200 1400 1600
No credit
Figure 2: Scatter plots of the four datasets for each type of exam program, showing SAT-Tot (x-axis) against FSU GPA (y-axis) and the line of regression and r² value.

| FALL 2011 JOURNAL OF COLLEGE ADMISSION12 WWW.NACACNET.ORG
According to university admissions
staff, any instances of low GPA scores are
representative of underperforming
students experiencing
academic difficulties.
It may be assumed,
therefore, that these are special
cases which a model could not reasonably
predict.
Findings
In each of the tables that follow, regression coeffi-
cients are statistically significant if they equal twice
or more the value of the standard error (shown in
brackets). Statistically significant effects are shown
in bold type. It should be noted that throughout the
analysis school effects appeared to be much smaller
than individual-level effects, in other words, there is
no statistical difference between schools.
Hypothesis 1: Educational Program
Using the refined dataset (excluding FSU GPA
scores less than 1.0 and with the 488, or 5.7 per-
cent of candidates missing SAT-Tot scores replaced
with equivalent ACT) the model investigates the fac-
tors associated with the course of program study
(Table 2a).
Table 2a: Effect of Educational Programon FSU GPA
Base – Cambridge AICe Regression Coefficient (Standard error)
AP 0.061 (0.060)
IB -0.105 (0.063)
no credit -0.478 (0.058)
A student taking Cambridge AICE is predicted to
get, on average, 0.478 higher on their FSU GPA
than a student taking no extra exam program. There
is some evidence that a student taking Cambridge
AICE is predicted to get higher in their FSU GPA
than a student taking IB, but because of the smaller
sample size of the Cambridge AICE cohort, it is dif-
ficult to be certain about this.
The same analysis is performed, but compares the
performance of students who have equivalent SAT
scores. This is known as ‘controlling for SAT score’ and
gives a more reliable picture as it enables us to focus
on the only factors that are affecting the outcome.
Controlling for total SAT score we can see that,
given equivalent SAT scores, the Cambridge AICE
exam is associated with, on average, 0.142 higher
on their FSU GPA than the IB, and 0.389 higher
than having no extra credit (Table 2b).
Table 2b: Effect of Educational Program (given equivalent SAT scores) on FSU GPA
Base – Cambridge AICe Regression Coefficient (Standard error)
AP with SAT -0.026 (0.058)
IB with SAT -0.142 (0.060)
no credit with SAT -0.389 (0.056)
Hypothesis 2: Gender
Table 3a shows that, compared to having no extra
credit, the Cambridge AICE is associated with on
average 0.465 higher FSU GPA, controlling for the
effects of gender. There is some evidence to say
that a male having Cambridge AICE does slightly
better, on average, than a male with IB.
Table 3a: Effect of Gender on FSU GPA
Base – Cambridge AICe, male
Regression Coefficient (Standard error)
AP 0.091 (0.060)
IB -0.095 (0.063)
no credit -0.465 (0.058)
Considering the effect of gender and equivalent SAT
scores on FSU GPA Table 3b shows that the Cam-
bridge AICE is associated with, on average, 0.354
higher GPA than no credit, controlling for gender
and given equivalent SAT scores. It is also associ-
ated with, on average, 0.139 higher GPA than the
IB, after controlling for gender and given equivalent
SAT scores.
Table 3b: Effect of Gender (given equivalent SAT scores) on FSU GPA
Base – Cambridge AICe, male
Regression Coefficient (Standard error)
AP -0.0096 (0.057)
IB -0.139 (0.059)
no credit -0.354 (0.055)
Controlling for gender and SAT score closes the
gap in FSU GPA between males and females for all
groups of exam program.

FALL 2011 JOURNAL OF COLLEGE ADMISSION | 13WWW.NACACNET.ORG
Hypothesis 3: Race
Table 4a shows that black students perform, on average 0.305
points lower on their FSU GPA than white students, after controlling
for examination program.
Controlling for race and SAT score (Table 4b), we see that black
students perform on average 0.25 points less well on their FSU
GPA compared with white students, which is better (a smaller gap in
performance) than when SAT score is not controlled for.
Table 4a: Effect of Race on FSU GPA
Base – Cambridge AICe, white Regression Coefficient (Standard error)
AP 0.072 (0.057)
IB -0.090 (0.059)
no credit -0.433 (0.055)
Black -0.305 (0.020)
Asian -0.115 (0.033)
Native American 0.083 (0.077)
Hispanic -0.060 (0.019)
Unreported -0.041 (0.060)
Hawaiian -0.030 (0.144)
Cambridge AICE students get, on average, 0.12 higher on FSU
GPA than IB students, after controlling for race and SAT score,
which is now significant. Asian and Hispanic students also do less
poorly compared to white students, given equivalent SAT score,
than if SAT score is not considered.
Table 4b: Effect of Race (given the same SAT scores) on FSU GPA
Base – Cambridge AICe, white Regression Coefficient (Standard error)
AP 0.005 (0.056)
IB -0.120 (0.058)
no credit -0.377 (0.054)
Black -0.250 (0.021)
Asian -0.109 (0.033)
Native American 0.101 (0.077)
Hispanic -0.048 (0.019)
Unreported -0.054 (0.060)
Hawaiian -0.014 (0.143)
Controlling for SAT score closes the gap in FSU GPA for all groups
except IB.
Hypothesis 4: Gender and Race
This model shows that black students have an FSU GPA that is
on average 0.319 points lower than that of white students after
controlling for gender (Table 5a), which is a slightly larger gap than
when gender is not considered.
Controlling for gender means Hispanics have a slightly smaller
FSU GPA.
Table 5a: Effect of Gender and Race on FSU GPA
Base – Cambridge AICe, white, male
Regression Coefficient (Standard error)
AP 0.104 (0.056)
IB -0.080 (0.059)
no credit -0.417 (0.054)
Black -0.319 (0.020)
Asian -0.100 (0.033)
Native American 0.072 (0.076)
Hispanic -0.062 (0.019)
Unreported -0.044 (0.059)
Hawaiian -0.061 (0.142)
Controlling for gender, race and SAT score we see that black
students have an FSU GPA that is 0.249 points lower than white
students, which is a smaller gap in performance compared to when
SAT score is not controlled for (Table 5b). Cambridge AICE students
achieve, on average, 0.118 higher on FSU GPA than IB students,
after controlling for race, gender and SAT score. There is also a
smaller gap in performance between Asian and Hispanic students
compared to white students, given equivalent SAT score and after
controlling for gender, than if SAT score is not considered.
Table 5b: Effect of Gender and Race (given the same SAT scores) on FSU GPA
Base – Cambridge AICe, white Regression Coefficient (Standard error)
AP 0.021 (0.055)
IB -0.118 (0.057)
no credit -0.343 (0.053)
Black -0.249 (0.020)
Asian -0.091 (0.033)
Native American 0.092 (0.075)
Hispanic -0.047 (0.019)
Unreported -0.060 (0.059)
Hawaiian -0.044 (0.141)

| FALL 2011 JOURNAL OF COLLEGE ADMISSION14 WWW.NACACNET.ORG
Discussion
The study has explored the link between high
school quality (in terms of the educational pro-
gram followed) to first-year university academ-
ic achievement using data supplied by FSU.
The primary purpose of the research has been
to highlight the predictive power of Cambridge
AICE, and other students’ characteristics in terms
of preparing students for university and predict-
ing freshman student performance at university.
The foregoing analysis has enabled researchers to
test a number of hypotheses. The models show
that following an examination program results
in, on average, a better GPA than not following
any extra credit.
In particular, the study has revealed that:
• there is no evidence of any statistical difference
between Cambridge AICE and AP students on
all of the tests carried out
• after controlling for SAT score, Cambridge
AICE students achieve a higher GPA, on av-
erage, than IB students and students having
no extra credit
• after controlling for gender and SAT score,
Cambridge AICE students achieve a higher
GPA, on average, than IB students and stu-
dents having no extra credit
• after controlling for race and SAT score, white
students achieve a higher GPA than black,
Asian and Hispanic students. Cambridge AICE
students achieve a higher GPA, on average,
than IB students and students having no
extra credit
• after controlling for gender, race and SAT
score, Cambridge AICE students achieve a
higher GPA, on average, than IB students
and students having no extra credit.
Study Limitations
The focus of the research has been a case study.
Although a case study methodology is not without
its criticism (being a bounded investigation
which suggests that outcomes are not readily
generalizable), “compared to other methods, the
strength of the case study method is its ability to
examine, in-depth, a ‘case’ within its ‘real-life’
context” (Yin 2006, 111). Its adoption, therefore,
is justified as a mode of situated inquiry, favoring
uniqueness over generalizability.
The size of the data set was large—more than
8,500 students. This means the significance
we can attach to the findings is increased. Even
where the subsets were small—for example, of
Cambridge AICE students there were 144—they
were still sufficiently large for the analyses to be
carried out. There were some subsets that were
small, for example Native American and Hawaiian,
which increases the risk of Type II errors. (This is
the error of failing to observe a difference when
in truth there is one—a false negative).
A common challenge in studies of this type is
controlling for selection bias. The choice of
educational program is not necessarily random.
High schools have different characteristics and
in mixed Cambridge/non-Cambridge high schools
students may have a choice. Students also may
choose a high school based on its use of program.
It is not clear what determines the choice of
acceleration mechanism. Is choice of educational
program influenced by type of high school, extrinsic
and intrinsic motivational aspects, institutional
ethos, affective characteristics, parental status,
socioeconomic constraints? Clearly information
of this kind would enhance our understanding of
future predictive validity findings.
Future Work
Further multilevel modelling work will include
investigation of other variables that may explain
student performance. One such measure of suc-
cess relates to university enrollment status (as of
the second fall after high school graduation), as
well as university retention, that is, re-enrollment
in a second year at the same institution (Robbins,
et al. 2006). Other measures for consideration
might include class type (whether Cambridge stu-
dents do better with certain types of classes) or if
certain behavioral measures, such as engagement
The foregoing analysis
has enabled researchers to test a number of hypotheses.
The models show that following
an examination program results
in, on average, a better GPA than
not following any extra credit.

FALL 2011 JOURNAL OF COLLEGE ADMISSION | 15WWW.NACACNET.ORG
with research or study abroad, may be enhanced. Apart from
the freshman year cumulative GPA measure of achievement,
other university performance outcomes could be explored, for
example, four-year cumulative GPA scores; freshman year attri-
tion rates; and four-year graduation rates. Additionally, it would
be informative to compare SAT critical reading and SAT math-
ematics scores in the above analyses, as there is some evidence
that one is a better predictor of college success than the other.
All of the variables used for the above analyses come from university
admission records. Student transcripts from the administrative
archives of the university provide information about university
career (type and number of exam passed, frequency of study,
credit hours, etc.) and data relating to some characteristics of the
high schools attended (type of school, final grades). However, a
questionnaire given to students when they enter university would
enable the collection of additional information on the students’
characteristics such as reasons for choice of educational program
and familial socioeconomic status.
A valuable, longitudinal exercise would be to track an entire
cohort of Cambridge students from one particular high school
through to final year of study. Questionnaire surveys together with
interviews throughout the duration of an AICE program of study
could be undertaken in order to determine extent of workload,
attitudes to course/assessment and teachers’/students’ percep-
tions of the course. This would be accompanied by follow-up
interviews with students at university, the findings from which
could be triangulated with GPA scores achieved at the end of the
first year of undergraduate study and also at graduation.
Given the smaller numbers in the AICE, AP and IB groups, the
case study nature of the research and the possible presence
of unknown confounding variables between groups it would be
Before leading a research team in the area of mainstream international examinations, StUARt ShAw worked on a range of Cambridge ESOL products with specific skill responsibilities for writing. He is particularly interested in demonstrating how Cambridge Assessment seeks to meet the demands of validity in their tests.
A background in applied mathematics, ClARe BAIley obtained a Ph.D. in mathematical modelling from Loughborough University, UK. She currently performs analysis and validation on a range of ESOL examinations and is interested in how numbers and data can be used to reveal an underlying picture of behavior.
unwise to draw conclusions about the relative predictive strength
of the three acceleration programs. Further work will be required
to collect more data from FSU and other US universities.
Cambridge has already obtained considerably smaller datasets
from the universities of Maryland, Virginia and Michigan and the
process of data collection is expected to continue over time.
Acknowledgements
We would like to thank John Barnhill (assistant vice president for
enrollment, Florida State University) and Megan Benson (director,
enrollment management operations office of admissions and re-
cords, Florida State University) for providing us with the university
data and for their assistance and advice during the project. Thanks
also to Sherry Reach (Cambridge US regional manager) and Bill
Kolb (Cambridge US recognitions consultant) for their invaluable
contributions throughout the course of this work.
It is not clear what determines the choice of acceleration mechanism. Is choice of educational program influenced by type of high school, extrinsic and intrinsic
motivational aspects, institutional ethos, affective characteristics, parental status,
socioeconomic constraints?
| FALL 2011 JOURNAL OF COLLEGE ADMISSION16 WWW.NACACNET.ORG
Alderson, J. C., Clapham, C. & Wall, D. (1995) Language test construction and evaluation, Cambridge: Cambridge University Press.
Anastasi, A (1988) Psychological Testing (6th edition), New York: Macmillan.
Bell, J. (2005) Doing your research project: A guide for first-time researchers in education, health and social science. (4th Ed.) Maiden-head: Open University Press.
Bell, J. F. & Dexter, T. (2000) Using multilevel models to assess the comparability of examinations. Paper presented at the 5th International Conference on Social Science Methodology, October 2000
Betts, J. R. & Morrell, D. (1999). The determi-nants of undergraduate grade point average. Journal of Human Resources, 34 2, pp. 268–293.
Burton, N. W. & Ramist, L. (2001). Predicting success in college: SAT studies of classes graduating since 1980. College Board Re-search Report No. 2001-02, College Entrance Examination Board, New York.
Bryman, A. & Hardy, M. A. (2009) Handbook of data analysis, Sage, 1st paperback edition, ISBN 978-1-84860-116-1
Cohen, L., Manion, L., and Morrison, K. (2007) Research methods in education. (6th Ed.) Abingdon: Routledge.
Cohn, E. & Cohn, S. & Balch, D. C. & Brad-ley, J. (2004) Determinants of undergraduate GPAs: SAT scores, high school GPA and high school rank. Economics of Education review 23, p277-286
Culpepper, S. A. & Davenport, E. C. (2009) Assessing differential prediction of college grades by race/ethnicity with a multilevel model. Journal of Educational Measurement, vol. 46, no. 2, pp. 220-242
Denscombe, M. (2003) The good research guide for small-scale social research projects. (2nd Ed.) Maidenhead: Open University Press.
Goldstein, H. (2011) Multilevel statistical mod-els, Wiley, 4th edition, ISBN 978-0-470-74865-7
Kobrin, J. L., Patterson, B. F., Shaw, E. J., Mat-tern, K. D., & Barbuti, S. M. (2008). Validity of the SAT® for Predicting First-Year College Grade Point Average. Research Report, No. 2008-5. New York: College Board
Lenning, O. T. (1975). Predictive validity of the ACT tests at selective colleges. Report No. 69 [050269000]. Iowa City, IA: American College Testing.
MLwiN - www.cmm.bristol.ac.uk/index.shtml
Noble, J. P. (1991). Predicting college grades from ACT assessment scores and high school course work and grade information. Report No. 91-3 [50291930]. Iowa City, IA: American College Testing.
Noble, J. P. & Sawyer, R. (1987). Predicting grades in specific college freshman courses from ACT test scores and self-reported high school grades. Report No. 87-20 [050287200]. Iowa City, IA: American College Testing.
Noble, J. & Sawyer, R. (2002). Predicting dif-ferent levels of academic success in college using high school GPA and ACT Composite score. (ACT Research Report 2002-4). Iowa City, IA: ACT.
Rasbash, J., Browne, W. J., Healy, M., Cam-eron, B. & Charlton, C. (2005). MLwiN Version 2.02. (Centre for Multilevel Modelling, Univer-sity of Bristol).
Robbins, S., Allen, J., Casillas, A., & Oh, I. (2007) Effects of academic performance, mo-tivation, and social connectedness on third-year college retention and transfer.
Sharp, J. (2009) Success with your education research project. Exeter: Learning Matters.
Yin, R. K. (2006). Case study methods. In J. L. Green, G. Camilli, P. B. Emore, A. Sku-kauskaite, & E. Grace (Eds.), Handbook of complementary methods in education research (pp. 111-122). Washington, DC: American Educational Research Association/Lawrence Erlbaum.
REFERENCES
UK US
AGe tyPe oF INStItUtIoN
yeAR MAIN eXAMINAtIoN
CoMMeNtS tyPe oF INStItUtIoN
GRADe MAIN SUBJeCtS/
eXAMINAtIoN
CoMMeNtS
14-15 SCHOOL 10 First year of GCSE/IGCSE
course
HIGH SCHOOL 9 5 core subjects plus electives
• Students gain a Diploma in G12.
• Credits for core and elective studies.
• Minimum number of credits needed; in Florida 24
• Many G11/12 pupils on Advanced Placement (AP) or Dual Enrolment (DE) as part of the credits
• SAT taken in G11 and again in G12 if not good enough
15-16 “ 11 GCSE/IGCSE(6-11 subjects)
Vocational courses also
possible
“ 10 5 core subjects plus electives
16-17 SIXTH FORM orCOLLEGE
12 AS(4-5 subjects)
Entry based on good grades in 4/5+ GCSEs/
IGCSEs
“ 11 5 core subjects plus electives
17-18 “ 13 A2(3 subjects)
The ‘best’ three AS subjects
“ 12 3 core subjects plus electives
18-19 UNIVERSITY FIRST First Year Entry based on AS/A2 grades
or points equivalent.
COLLEGE FRESHMAN LIBERAL STUDIES
• Entry based on High School grades converted into GPA plus SAT score (plus in Florida community service).
• They apply before receiving their Diploma
• Offer based on minimum GPA plus SAT scores in G12
• ~20% of students go to college
19-20 “ SECOND “ “ SOPHOMORE ASSOCIATE DEGREE
20-21 “ THIRD BACHELORDEGREE
“ “ JUNIOR
21-22 “ ONE POSTGRADUATE
Entry based ongood first
degree
“ SENIOR BACHELOR DEGREE
Appendix: Comparison of Secondary Education in the UK and the US*
* IGCSE is the international counterpart of GCSE. As with GCSE, IGCSE is also available to candidates in the UK

Copyright of Journal of College Admission is the property of National Association of College Admission
Counseling and its content may not be copied or emailed to multiple sites or posted to a listserv without the
copyright holder's express written permission. However, users may print, download, or email articles for
individual use.


![Homepage [] · Homepage](https://img.dokumen.tips/doc/110x75/60621dae80c0393da026878f/homepage-homepage.jpg)