Embed Size (px)
Citation preview

Technical Report No: ND08 - 08
HYDRAULIC AND KINETIC MODELING OF A
FULL-SCALE MOVING BED BIOFILM REACTOR FOR TERTIARY NITRIFICATION
by
Seth N. Lynne Wei Lin
Dept. of Civil Engineering, North Dakota State University Fargo, North Dakota
November 2008
North Dakota Water Resources Research Institute North Dakota State University, Fargo, North Dakota

Technical Report No: ND08 - 08
HYDRAULIC AND KINETIC MODELING OF A FULL-SCALE MOVING BED BIOFILM REACTOR
FOR TERTIARY NITRIFICATION
by
Seth N. Lynne1 Wei Lin2
WRRI Graduate Research Fellow1 and Associate Professor2
Department of Civil Engineering North Dakota State University
Fargo, ND 58105
November 2008
The work upon which this report is based was supported in part by federal funds provided by the United States of Department of Interior in the form of ND WRRI Graduate Research Fellowship for the graduate student through the North Dakota Water Resources Research Institute. Contents of this report do not necessarily reflect the views and policies of the US Department of Interior, nor does mention of trade names or commercial products constitute their endorsement or recommendation for use by the US government.
Project Period: March 1, 2004 – February 28, 2005 Project Number: 2004ND52B
North Dakota Water Resources Research Institute Director: G. Padmanabhan
North Dakota State University Fargo, North Dakota 58105

ACKNOWLEDGEMENT
Stipend support for the Research Fellow, Seth Lynne, was provided by the North Dakota Water Resources Research Institute. We thank the City of Moorhead, MN, for providing opportunities and additional financial support for this project. We would also like to acknowledge Dr. Zimmerman, City Engineer of Moorhead, and the Moorhead Wastewater Treatment Facility staff for their time, support and assistance.
ABSTRACT
A full‐scale moving bed biofilm reactor (MBBR), utilized for separate stage nitrification, was examined for the first 24 months following system commencement. To evaluate the factors affecting the performance of the MBBR, a monitoring program was developed. Monitoring data revealed that the MBBR process met effluent ammonia design criteria during both cold and warm weather periods. Evaluations indicated that system performance is highly dependent upon the procedures for returning biosolids’ supernatant to the facility headworks. Because of high ammonia concentrations associated with the supernatant, equalized flow was recommended to reduce the variability in influent ammonia loading distributed to the MBBR.
To investigate the hydraulic characteristics of the MBBR basin, tracer analyses were performed. Tracer analyses indicated that the MBBR can be simulated as two continuous flow stirred tank reactors in series with hydraulic deficiencies represented as bypass flow. In addition to the tracer studies, a series of ammonia distribution monitoring was conducted to further evaluate the hydraulic characteristics of the MBBR. Hydraulic analyses demonstrated that basin performance could be improved by optimizing influent flow distribution, thereby reducing the probability for short‐circuiting.
Laboratory bench‐scale analyses, designed to simulate the full‐scale system, were conducted to evaluate nitrification kinetics of the MBBR. Ammonia reduction data from the bench‐scale tests were statistically fit to an attached growth Monod type model. Although the kinetic parameters provided an excellent fit to the observed data, variability existed between the measured kinetic values for each bench‐scale test.
Utilizing the full‐scale monitoring results, the hydraulic simulation, and the kinetic parameters obtained from the bench‐scale analyses, a combined model for the full‐scale MBBR system was developed. Full‐scale model simulations indicated that the MBBR process performance was affected more significantly by basin physical characteristics, as opposed to nitrification kinetics, when considerable hydraulic deficiencies exist. However, when the MBBR system was optimized with respect to hydraulics, the process performance was observed to be highly dependent upon nitrification kinetics. Consideration must be given to both kinetic and hydraulic characteristics to ensure maximum performance for MBBR systems.
Keywords: Moving Bed Biofilm Reactor (MBBR), Nitrification, Ammonia, Kinetic Model
ii

TABLE OF CONTENTS
ACKNOWLEDGEMENT ……………………………………………………………………………………………………………… ii
ABSTRACT ................................................................................................................................... ii
TABLE OF CONTENTS .................................................................................................................. iii
LIST OF TABLES .......................................................................................................................... iv
LIST OF FIGURES ........................................................................................................................ iv
INTRODUCTION .......................................................................................................................... 1
Description of Water Problem Addressed ......................................................................... 1
Objectives ........................................................................................................................... 2
BACKGROUND ............................................................................................................................ 3
Selection of Nitrification Process ....................................................................................... 3
Moorhead MBBR Nitrification System…………………………………………………………………. ......... 4
Previous MBBR Analysis ..................................................................................................... 7
INVESTIGATIVE APPROACH ....................................................................................................... 10
Experimental Design ......................................................................................................... 10
Materials and Methods .................................................................................................... 10
RESULTS AND MODEL DEVELOPMENT ....................................................................................... 12
Analysis of the Full‐Scale MBBR Monitoring Discussion .................................................. 12
Hydraulic Analysis ............................................................................................................. 16
Tracer Studies ............................................................................................................................ 17 NH3‐N Distribution in the MBBR ............................................................................................... 19 Hydraulic Analysis Discussion ................................................................................................... 21
Nitrification Kinetics ......................................................................................................... 21
Full‐Scale MBBR Simulation ............................................................................................. 25
SUMMARY AND CONCLUSIONS ................................................................................................ 32
REFERENCES ............................................................................................................................. 34
iii

iv
LIST OF TABLES Table Page Table 1. Effluent NH3‐N Limits. .............................................................................................. 2 Table 2. MBBR Design Criteria. .............................................................................................. 7 Table 3. Tracer Evaluation Setup. ........................................................................................ 11 Table 4. Seasonal MBBR Performance. ................................................................................ 13 Table 5. MBBR Conditions During Supernatant Return. ...................................................... 15 Table 6. MBBR Flow Conditions During Tracer Analysis. ..................................................... 17 Table 7. Full‐Scale Tracer Analysis Summary. ...................................................................... 18 Table 8. MBBR Conditions During NH3‐N Distribution Analysis. ......................................... 20 Table 9. Summary of Laboratory Bench‐Scale Analysis. ...................................................... 24 Table 10. Full‐Scale MBBR Data for the Date of Each Bench‐Scale Analysis. ...................... 25
LIST OF FIGURES Figure Page Figure 1. Moorhead, MN, WWTF Flow Diagram. .................................................................. 5 Figure 2. Moorhead MBBR Schematic. .................................................................................. 6 Figure 3. Full‐Scale MBBR Influent NH3‐N.............................................................................. 8 Figure 4. Full‐Scale MBBR Effluent NH3‐N. ............................................................................ 8 Figure 5. Previous Full‐Scale Simulation. ............................................................................... 9 Figure 6. MBBR NH3‐N Monthly Average Data. ................................................................... 13 Figure 7. Supernatant Return Flow and MBBR Performance. ............................................. 14 Figure 8. January–March 2004 Supernatant Flow and MBBR Response. ........................... 15 Figure 9. Tracer Test No. 4 Response (at 6.60 MGD and 4,500 scfm). ................................ 18 Figure 10. Effective Volume as a Function of Influent Flow. ............................................... 19 Figure 11. NH3‐N Distribution No. 1 (at 4.40 MGD and 4,500 scfm). .................................. 20 Figure 12. Laboratory Bench‐Scale Data. ............................................................................. 24 Figure 13. Full‐Scale MBBR Model. ...................................................................................... 26 Figure 14. Full‐Scale Simulation, January 2004. .................................................................. 26 Figure 15. Full‐Scale Simulation, June 2004. ....................................................................... 27 Figure 16. Effluent NH3‐N as a Function of Influent NH3‐N and Bypass Flow. .................... 28 Figure 17. Maximum Substrate Utilization Rate Sensitivity, Bypass Flow=0%. ................... 29 Figure 18. Maximum Substrate Utilization Rate Sensitivity, Bypass Flow=30%. ................. 29 Figure 19. Half‐Saturation Constant Sensitivity, Bypass Flow=0%. ..................................... 30 Figure 20. Half‐Saturation Constant Sensitivity, Bypass Flow=30%. ................................... 31

INTRODUCTION
This research sought to identify the factors affecting the performance of a full‐scale moving bed biofilm reactor utilized for nitrification. A monitoring plan was developed to evaluate the parameters affecting the stability of the process. Utilizing the monitoring data, in conjunction with basin hydraulic analyses and kinetic parameters, a model of the process was presented, which can be utilized to examine operational procedures as they relate to a full‐scale nitrifying system.
Description of Water Problem Addressed
High concentrations of ammonia in wastewater discharges have been shown to be toxic to fish and marine biota as well as to cause dissolved oxygen (DO) depletion in receiving streams, especially during periods of low river flow. Because ammonia is also a nutrient, discharge can contribute to algal blooms and eutrophication in aquatic systems. When the City of Moorhead Wastewater Treatment Facility (WWTF) was designed in the early 1980s, no ammonia discharge limit was implemented, and treatment processes were designed without consideration for ammonia removal. Since operation of the Moorhead WWTF began in 1983, the typical discharge concentration of ammonia‐nitrogen (NH3‐N) to the Red River of the North was near 19 milligrams per liter (mg/L).
In the mid‐1990s, the reach of the Red River of the North from the cities of Moorhead, MN, and Fargo, ND, to the confluence with the Buffalo River in Minnesota was identified as impaired for both ammonia and dissolved oxygen (i.e., violating water‐quality standards for these parameters at low river flow) (Zimmerman et al., 2003). In 1994, a workgroup was formed to address this impairment and prepare a Total Maximum Daily Load (TMDL) study to establish allowable loadings of five‐day carbonaceous biochemical oxygen demand (CBOD5) and ammonia discharged from the cities of Fargo and Moorhead wastewater treatment facilities and corresponding permit limits for the treated wastewater discharges. In 1999, the USEPA revised its water quality criterion for ammonia. The previous ammonia criterion was based on dissolved oxygen levels as well as toxicity. The criterion was revised for ammonia toxicity and unrelated to dissolved oxygen impacts associated with ammonia discharges. The Minnesota Pollution Control Agency subsequently adopted a site specific standard for ammonia for the impaired reach of the Red River of the North based on the new criteria and developed a new discharge limit for the City of Moorhead. The limit is seasonal and based on flow in the Red River of the North. Compliance is maintained only during the months of June through September when flow in the Red River is commonly low. Although the effluent NH3‐N concentration limit of 19 mg/L remains constant for all river flows, the mass limit is significantly reduced at low river flows (less than fifty cubic feet per second). Therefore, in addition to effluent NH3‐N concentration, the WWTF must also monitor NH3‐N loading to the Red River. Because the effluent flow from the WWTF is relatively constant during periods of low river flow, the mass loading limitation equates to an effluent NH3‐N concentration of approximately 8 mg/L. The National Pollutant Discharge Elimination System permit for the facility contains the effluent NH3‐N limits shown in Table 1.
A compliance date of September 30, 2003, was also established. The City of Moorhead developed a facility plan and, based on that plan, constructed an innovative process, the attached growth moving bed biofilm reactor (MBBR), to meet the new limits at a cost of $3.3 million in 2002.
1
Table 1. Moorhead Wastewater Treatment Facility Effluent NH3‐N Limits.
Effective Period Applicable River Flow Limit Type Limit
June‐September All river flows Calendar Month Average 19 mg/L
Greater than 1.42 m3/sec (50 cfs1)
Calendar Month Average 647 kg/day (1,427 lb/day)
Less than 1.42 m3/sec (50 cfs1)
Calendar Month Average 108 kg/day (238 lb/day)
1cfs=Cubic feet per second.
At the time of construction, the process was the only full‐scale separate stage nitrifying MBBR in the country. The MBBR process utilizes floating media placed in an aeration basin. In the basin, an aeration system supplies oxygen and provides mixing for the process while the media supply the necessary surface area for attached growth of nitrifying bacteria.
Assessment of this new, innovative process is necessary to evaluate the operational parameters affecting the performance of the MBBR system. A better understanding of the process gained by studying the key parameters via a kinetic model will result in improved operational stability and reduced effluent concentrations of ammonia, thus improving the overall water quality of the Red River of the North.
Research Objectives
The ultimate goal of this research is to identify and evaluate the critical design and operational parameters affecting the nitrification rate in a full‐scale MBBR process. To accomplish this goal, the primary objectives of the research include:
1. collect and evaluate full‐scale monitoring data for the MBBR system under various flow and
ammonia loading conditions; 2. evaluate the hydraulic characteristics of the basin to better understand the flow of
wastewater through the system and select an appropriate hydraulic model; 3. study nitrification kinetics and choose a suitable model to evaluate the pertinent kinetic
parameters of the process; and 4. utilize the monitoring data in combination with the hydraulic and kinetic parameters to
develop an appropriate model for the full‐scale MBBR system. Improved understanding of the tertiary nitrifying MBBR system is necessary to enhance the
operational stability of the full‐scale system and thus, optimize the effluent ammonia concentration discharged to the Red River of the North.
Other benefits included in the study are related to the uniqueness of the process. This research will be widely applicable to the MBBR process in general, and thus, expand the body of current knowledge associated with the new and innovative process. As mentioned earlier, at the time of construction the Moorhead process was the only separate stage nitrifying moving bed biofilm reactor in the country. Attention has been growing with regard to the MBBR process. As a separate stage system, an opportunity is presented to study and evaluate the full‐scale system, and thus, provide valuable operational and design information which may be utilized in similar systems; not only for separate stage systems, but also in combination with activated sludge.
2

BACKGROUND
In this section the history regarding the nitrification studies at the Moorhead WWTF is portrayed and the rationale used by the City of Moorhead to ultimately select MBBR as the treatment system is presented. Previous analysis of the Moorhead MBBR system is also summarized.
Selection of Nitrification Process
The issue of ammonia reduction has been studied extensively by the City of Moorhead WWTF and at North Dakota State University. The City of Moorhead, Minnesota operates an advanced WWTF with a design flow of 22,710 m3/d (6 mgd) and continuous discharge to the Red River of the North. The WWTF serves the communities of Moorhead, Dilworth, and the Town of Oakport, MN. The liquid treatment processes include bar screens, aerated grit tanks, flow equalization, primary clarification, high purity oxygen activated sludge secondary treatment, final clarification, polishing ponds, and chlorination/dechlorination disinfection. Because of low pH and short sludge retention time (SRT) in the high purity oxygen activated sludge system, nitrification was not achievable under the existing treatment system at the Moorhead WWTF.
Klecker (1998) studied the feasibility of using the existing polishing ponds at the Moorhead WWTF for nitrification. The results of Klecker’s study indicated the polishing ponds provided an appropriate detention time, but the low biomass concentration in the ponds limited the removal efficiency of the nitrification process. Klecker recommended that modified operation be evaluated to achieve nitrification on a full‐scale.
Based on Klecker’s study (1998) and the research of Zimmerman (2003), it was determined to convert one of the existing polishing ponds at the Moorhead WWTF to a nitrification basin. Feasibility of the full‐scale nitrification process was evaluated by a pilot‐scale study using a separate stage attached growth process. From the study, Zimmerman et al., (2003) found the addition of the media to the basin allowed for the development of a suitable biomass population. Based on the results of this study, a MBBR was selected for nitrification at the Moorhead WWTF.
The MBBR is an innovative, attached growth process that uses small plastic media to provide a surface for the growth of bacteria. The MBBR system is flexible and can be retrofit into almost any size or shape of tank. Mechanical mixers or aeration systems are utilized for mixing the reactor. Screens are used to contain the media within the reactor. Return flow is unnecessary and backwashing of the screens is not required. Coarse bubble aeration is commonly used in the reactor. Media volume in the reactor is contingent on organic and hydraulic loading, temperature, the oxygen transfer capability of the aeration system, and the required level of treatment. The MBBR process is relatively new, with the first installation in 1990 (Rusten and Neu, 1999). As of 2000, about 100 installations were reported with most of these located in Europe (Water Environment Research Foundation, 2000).
Because return activated sludge flow is not required for the MBBR process, the design is more straightforward than the design of combined attached and suspended growth systems (i.e., integrated fixed‐film activated sludge or IFAS process). The MBBR design can be complicated, to some extent, because there is no generally accepted comprehensive model. Therefore, system design is normally limited to empirical relationships, and often, site‐specific pilot testing.
For typical design, the full‐scale MBBR can achieve 90% ammonia removal at NH3‐N loadings of 1.0 gram per square meter of media surface area per day (g/m2/d) with a dissolved oxygen (DO) concentration greater than 5 mg/L and an effluent NH3‐N concentration greater than 3 mg/L. For
3

90% removal at DO concentrations greater than 5 mg/L, but effluent NH3‐N concentrations less than 3 mg/L, the design loading drops to 0.45 g/m2/d (Ødegaard et al., 1994).
Overall the MBBR process was selected based on a number of considerations. The process was found to be a cost effective alternative in reducing effluent ammonia concentrations. The design served as the most efficient in terms of expansion of the facility because no additional amount of land was required to comply with the ammonia treatment requirements, and the MBBR process also demonstrated the ability to reduce the effluent ammonia concentrations to a limit below the permitted level (Zimmerman et al., 2004).
Moorhead MBBR Nitrification System
In 2003, the Moorhead WWTF was upgraded to include a separate stage full‐scale MBBR nitrification process to comply with the seasonal effluent NH3‐N limits. The MBBR process was constructed by converting the east half of the existing Polishing Pond No. 1 to an aeration basin. A flow diagram for the facility with the new MBBR is shown in Figure 1. A schematic diagram of the MBBR is shown in Figure 2, and design criteria for initial and future (year 2020) conditions are provided in Table 2. The design NH3‐N effluent in Table 2 is based upon effluent mass loading to the Red River, thus explaining the variation in listed effluent concentrations.
A system to bypass the MBBR exists between Polishing Pond No. 1 and Control Structure No. 1. The bypass is automatic at high flows (greater than 7.5 mgd) to avoid flooding the basin. The configuration also allows the WWTF to completely bypass the MBBR and provides the ability to feed only a portion of the total plant effluent flow to the basin. Bypass occurs during periods of high flow when ammonia concentrations are significantly below average due to dilution.
Media in the basin are manufactured by Hydroxyl‐Pac (Hydroxyl Systems, Sidney, British Columbia, Canada). The media elements are made of ultraviolet‐resistant, high‐density polyethylene; have dimensions of approximately 22 mm in diameter by 15 mm in length; and have a specific surface area of 388 m2/m3. The surface area of the media’s outer portion is not considered, due to the lack of nitrifying organisms, as a result of the collisions occurring between the individual media elements within the basin. Therefore, the specific surface area is defined as the surface area of only the inner, protected portion of the media element. The media are buoyant and have a specific density of 0.96 g/cm3.
The Hydroxyl‐Pac media was selected based on the year‐long pilot study that tested performance criteria, the ability to acquire the media, and the installation of a cost‐effective basin with the flexibility to handle future loading. The fill‐fraction of media (volume of the reactor occupied by media) in the basin is about 32%. Future NH3‐N loading conditions can be addressed by the addition of further media (approximately 40% by volume based on the manufacturer’s recommendation).
4

Sub
nata
nt
Was
te A
ctiv
ated
Slu
dge
Prim
ary
Dig
este
r 2P
rimar
yD
iges
ter 1
Gas
Hol
ding
Dig
este
r 3
Thic
kene
dW
.A.S
.
Prim
ary
Cla
rifie
rS
ludg
e
Fina
lC
larif
ier
Effl
uent
Out
fall
toR
ed R
iver
D.A
.F.
Thic
kene
r2
D.A
.F.
Thic
kene
r1
Equ
aliz
atio
nB
asin
3
Equ
aliz
atio
nB
asin
2
Eq.
Bas
in1
Grit 1
Grit 2
Prim
ary
Cla
rifie
r 1
Prim
ary
Cla
rifie
r 2
Hig
h P
urity
Oxy
gen
Act
ivat
ed S
ludg
e 1
Hig
h P
urity
Oxy
gen
Act
ivat
ed S
ludg
e 2
Fina
lC
larif
ier
1
Fina
lC
larif
ier
2
Fina
lC
larif
ier
3
Fina
lC
larif
ier
4
Ret
urn
Act
ivat
ed S
ludg
e
Chlorination/ Dechlorination
Building
Pol
ishi
ng P
ond
1(1
.1 a
cres
)
Pol
ishi
ng P
ond
2(3
.0 a
cres
)
Pol
ishi
ng P
ond
3(4
.9 a
cres
)
Air
Blo
wer
Bld
g.C
l 2C
onta
ct
Cl 2
Chl
orin
eM
ix
Pon
d E
fflue
nt
Sul
fur D
ioxi
de
Nitr
ifica
tion
MB
BR
Bio
solid
sS
tora
ge
Dig
este
d B
ioso
lids
from
Dig
este
r 3
Dec
ant t
o E
qual
izat
ion
Bas
in 1
Land
Ap
plie
dB
ioso
lids
Scr
ewP
umps
Bar
Scr
eens
Influ
ent
Dec
ant f
rom
Bio
solid
s S
tora
ge
Dig
este
d B
ioso
lids
to B
ioso
lids
Stor
age
Figure 1. M
oorhead, M
N, W
WTF Flow Diagram
.
5

Figure 2. Moorhead MBBR Schematic.
6

Table 2. MBBR Design Criteria.
Parameter Initial Annual Average
Initial Maximum Month
2020 Annual Average
2020 Maximum Month
Basin Dimensions (L x W x D), m (ft) 42 x 24.4 x 2.9(138 x 80 x 9.5)
Basin Volume, m3 (ft3) 2,970 (104,880)
Media Volume, m3 (ft3) 950 (33,560)
950 (33,560)
1,604 (57,000)
1,604 (57,000)
Media Volume, % fill 32 32 54 54
Flow, m3/d (mgd1) 18,173 (4.8)
24,610 (6.5)
22,710 (6.0)
34,075 (9.0)
Influent NH3‐N, mg/L 17 17 17 17
Influent NH3‐N, kg/d (lb/day) 308 (680)
417 (920)
385 (850)
578 (1,275)
Influent NH3‐N, g/m2/d 0.84 1.13 0.62 0.93
Predicted removal, % 64.7 74.1 71.8 81.2
Effluent NH3‐N, mg/L 6.0 4.4 4.8 3.2
Effluent NH3‐N, kg/d (lb/day) 108 (238)
108 (238)
108 (238)
108 (238)
Oxygen required, kg/d (lb/day) 1,185 (2,614)
1,428 (3,149)
1,363 (3,006)
2,156 (4,755)
Air for oxygen requirements, standard m3/min (scfm2)
125 (4,418)
151 (5,322)
144 (5,082)
228 (8,038)
1mgd=Million gallons per day. 2scfm=Standard cubic feet per minute. Previous MBBR Analysis
The full‐scale MBBR process was placed into operation on April 1, 2003. At the time, effluent flow from Polishing Pond No. 1 was directed through the MBBR basin. No seed biomass was used for the MBBR start up (Zimmerman et al., 2004). When MBBR effluent NH3‐N concentrations fell to 6.0 mg/L or less, the start up phase was considered complete. Influent and effluent ammonia‐nitrogen, as measured across the MBBR basin since start up in 2003, are shown in Figures 3 and 4, respectively. Design and average monthly concentrations as well as maximum and minimum monthly values (represented by upper and lower bars) are also shown in the figures.
As evident by the effluent NH3‐N data, the system required approximately two months to develop a stable nitrifying biomass (Zimmerman et al., 2004). Although the influent concentrations have been variable and consistently exceeded the design value (17 mg/L), the system has achieved the design effluent concentration during the months when permit limits are applicable. During system start up, Zimmerman et al. (2004) noted that the variability was the result of at least two factors: occasional wet‐weather flow which dilutes influent NH3‐N concentrations and operational procedures for returning supernatant (typical NH3‐N concentrations between 1,500 and 2,000 mg/L) from the biosolids storage facility to the WWTF
7

headworks (refer to Figure 1). Performance was only slightly reduced during colder weather months when permit limits were not in effect (Zimmerman et al., 2004).
0
10
20
30
40
50
60
70
80
Apr‐03
May‐03
Jun‐03Jul‐03
Aug‐03
Sep‐03
Oct‐03
Nov‐03
Dec‐03Jan‐04
Feb‐04
Mar‐04
Apr‐04
May‐04
Jun‐04Jul‐04
Aug‐04
Sep‐04
Oct‐04
Nov‐04
Dec‐04Jan‐05
Feb‐05
Mar‐05
Apr‐05
Influent NH3‐N (mg/L)
Avg Design
Figure 3. Full‐Scale MBBR Influent NH3‐N.
0
10
20
30
40
50
60
70
Apr‐03
May‐03
Jun‐03Jul‐03
Aug‐03
Sep‐03
Oct‐03
Nov‐03
Dec‐03Jan‐04
Feb‐04
Mar‐04
Apr‐04
May‐04
Jun‐04Jul‐04
Aug‐04
Sep‐04
Oct‐04
Nov‐04
Dec‐04Jan‐05
Feb‐05
Mar‐05
Apr‐05
Effluent NH3‐N (mg/L)
Avg Design
Figure 4. Full‐Scale MBBR Effluent NH3‐N.
8

Based upon the results of the pilot‐study, Zimmerman (2003) and his co‐investigators
suggested the nitrification rate of the MBBR could be simulated as an empirical first‐order decay model as shown below.
)1(maxkL
L eRR −−= , (2‐3)
where RL = NH3‐N removal rate at loading L, g/m2/d L = NH3‐N loading, g/m
2/d Rmax = maximum NH3‐N removal rate, g/m2/d k = removal rate coefficient, (g/m2/d)‐1
Based on the data gathered from the pilot study, Rmax and k were found to be 1.30 g/m2/d and
0.93 (g/m2/d)‐1, respectively. The equation was derived from average NH3‐N loadings ranging from 0.45 to 1.58 g/m2/d and for average effluent temperatures ranging from 15 to 21°C. For the full‐scale system, Zimmerman et al., (2004) divided the results into two temperature regimes, one for cold weather periods (11 to 14°C) and one for warm weather periods (17 to 21°C). The results of the model are displayed in Figure 5.
The empirical relationship in Equation (2‐3) implies nitrification in the MBBR is primarily dependent upon NH3‐N loading. However, a number of other parameters were recognized as affecting the process. Further research of the new MBBR process was recommended to resolve unanswered questions regarding the nitrification rate and its relationship to ammonia concentration, dissolved oxygen concentration, basin configuration, and detention time, as well as influent loading (Zimmerman et al., 2004). These parameters, as well as basin alkalinity, temperature, nitrification kinetics, biomass characteristics, and system hydraulics will be explored as they relate to the nitrification efficiency of the MBBR. Developing definitive relationships require evaluation where these parameters are maintained as independent variables.
0.00
0.20
0.40
0.60
0.80
1.00
1.20
1.40
0.00 0.20 0.40 0.60 0.80 1.00 1.20 1.40
NH3‐N Loading (g/m2/d)
NH3‐N Removal (g/m
2 /d)
Pilot (15‐21 C) Actual (17‐21 C) Actual (11‐14 C)100% Removal 80% Removal 60% Removal
o o o
Figure 5. Previous Full‐Scale Simulation.
9

INVESTIGATIVE APPROACH
A description of the monitoring program developed to study the full‐scale MBBR system is presented. Testing procedures as well as hydraulic and kinetic experimental designs and methods are detailed within.
Experimental Design
To effectively monitor the MBBR basin and establish an understanding of the system, a detailed monitoring plan was developed and maintained. The full‐scale system was continuously monitored since operational start up through the present time. Effluent flow rate, as well as airflow and air pressure to the basin has been continuously monitored. Regular monitoring has been carried out for MBBR temperature, DO, pH, CBOD5, soluble CBOD5 (SBOD5), total suspended solids (TSS), total Kjeldahl nitrogen (TKN), NH3‐N, nitrite‐nitrogen (NO2‐N), nitrate‐nitrogen (NO3‐N), and alkalinity. Periodic grab sample analysis, conducted five days per week, has been utilized for temperature, DO, and pH. All other parameters were based on 24 hour flow composite samples and were performed at a rate varying from once per week to four times per week.
To investigate the hydraulic characteristics of the MBBR basin, several dye tests were performed. By analyzing the tracer (dye) concentration present in the basin effluent and fitting theoretical tracer output response curves to the field measured effluent dye data, the hydraulic performance of the MBBR can be determined. The MBBR basin was assumed to perform hydraulically as a series of continuous flow stirred tank reactors (CFSTR).
In addition to the tracer studies, NH3‐N distribution monitoring throughout the basin was conducted to further evaluate the hydraulic characteristics of the MBBR. To determine if the MBBR basin was experiencing zones of poor mixing or short circuiting, NH3‐N concentrations were examined across and throughout the basin.
The nitrification rate kinetics of the MBBR basin were evaluated by conducting several bench‐scale batch analyses. Each kinetic experiment was designed to represent the nitrification process occurring within the full‐scale MBBR. NH3‐N oxidation was analyzed as a function of media specific surface area while keeping all other variables (i.e., temperature and DO) relatively constant. By fitting the NH3‐N reduction in the bench‐scale tests, an appropriate model for the nitrification kinetics occurring in the full‐scale MBBR can be selected.
Materials and Methods
The sample analyses of MBBR temperature, DO, pH, CBOD5, SBOD5, TSS, TKN, NH3‐N, NO2‐N, NO3‐N, and alkalinity were all performed at the Moorhead WWTF laboratory. All analyses were conducted according to the Standard Methods for the Examination of Water and Wastewater (APHA et al., 1998). Where applicable, procedures established for laboratory certification through the Minnesota Department of Health (1990) were also utilized. Quality assurance and quality control procedures were used during all analyses and included at least one reagent blank per analysis set, at least one duplicate analysis per set with at least ten percent of all samples being duplicate analyses, and at least one spiked sample analysis per set with at least ten percent of all samples being spiked sample analyses.
A total of four tracer (dye) studies were conducted to evaluate the hydraulic characteristics of the MBBR basin. Four different influent flow rates and two different air (mixing) flow rates were utilized to evaluate the hydraulic impacts associated with different flow and mixing rates. The
10

tracer evaluations were performed using a pulse input of 208 L (55 gallons) of Rhodamine WT dye (Norlab, Inc., Amherst, Ohio). Dye was added at a single point near the influent pipe in three of the tests. In a fourth test, designed to evaluate influent flow distribution, influent flow was split, as well as dye, and injected into the basin at two points, one at the influent pipe and one directly opposite the influent pipe. Dye was added during normal operation with continuous flow through the MBBR basin for all four tests. After the addition of dye, effluent samples were collected from the MBBR effluent control structure at selected time intervals. The absorbance of filtered effluent samples was measured at a wavelength of 555.6 nm on a spectrophotometer (Hach Company, Loveland, Colorado). The dye concentration was determined based upon a calibration curve for dye concentration versus absorbance (also at a wavelength of 555.6 nm) developed from known dilutions of dye in filtered Polishing Pond No. 1 effluent. Table 3 specifies the set up for each of the four tracer studies. Influent flow is reported for the duration of each test period. Table 3. Tracer Evaluation Setup.
Test No. Influent Flow Rate m3/d (mgd1)
Airflow standard m3/min (scfm2)
Injection Point
1 16,656 (4.40) 127 (4,500) Influent pipe
2 17,942 (4.74) 127 (4,500) Influent pipe & directly opposite
3 20,214 (5.34) 212 (7,500) Influent pipe
4 24,984 (6.60) 127 (4,500) Influent pipe 1mgd=Million gallons per day. 2scfm=Standard cubic feet per minute.
Analysis of NH3‐N distribution within the basin was conducted to further examine the hydraulic characteristics of the MBBR system. Grab samples were collected and analyzed from the basin at ten different sample locations around the perimeter. Refer to Figure 2 for sample locations and identifications. The procedures for the grab sample analyses followed and were conducted according to the provisions of the Standard Methods for the Examination of Water and Wastewater (APHA et al., 1998).
From December 2003 through May 2005, thirteen laboratory bench‐scale batch tests were conducted to evaluate the nitrification rate kinetics of the MBBR process. Samples of media were collected directly from the full‐scale MBBR to ensure an established population of nitrifying biomass. The media was placed in 15 Liter (4 gallon) bench‐scale batch reactors containing non‐nitrified effluent from Polishing Pond No. 1. The media fill fraction in the various tests ranged from less than one percent (<1%) of the bench‐scale reactor liquid volume to about seventy percent (70%) of the bench‐scale reactor liquid volume. Aeration was provided through a diffuser system to supply thorough mixing and to maintain a minimum dissolved oxygen concentration of 6.0 mg/L in the liquid. NH3‐N concentrations in the batch reactors were measured throughout the test at regular intervals, and plotted against time. Temperature and pH were also recorded during each bench scale test.
11

RESULTS AND MODEL DEVELOPMENT
Monitoring and experimental results are provided within to illustrate the design and operational parameters identified as affecting the performance of the full‐scale MBBR system. Full‐scale monitoring, basin hydraulic analysis, and nitrification kinetic testing results and discussions are included.
Analysis of the Full‐Scale MBBR Monitoring Data
The average monthly influent and effluent NH3‐N concentrations from April 2003 to April 2005 are shown in Figure 6. NH3‐N removal efficiency through the MBBR basin is illustrated in the figure. As evident by the removal data in Figure 6, the efficiency of nitrification in the MBBR was reduced during periods (January to March 2005) of high influent TSS and CBOD5 concentrations. When the CBOD5 concentrations were elevated in the MBBR during these periods (>20 mg/L), competition from heterotrophic bacteria reduced the growth and efficiency of nitrifying microorganisms. The periods of elevated TSS and CBOD5 were associated with poor settling in the final clarifiers and activated sludge system upsets.
As indicated by the data in the Figure 6, the influent NH3‐N concentrations to the MBBR basin commonly exceeded the design influent concentration of 17.0 mg/L. Despite the higher than expected influent concentrations, the average effluent NH3‐N was well below the 8.0 mg/L limit permitted during summer months. Table 4 provides a seasonal and overall comparison of the MBBR basin for the first 24 months of operation.
The NH3‐N removal across the MBBR basin was reduced during cold weather months when compared to warmer months. During the cold weather months, the average influent NH3‐N concentrations were slightly elevated, however as the average loading remained relatively unchanged during cold and warm weather months, the data appeared to indicate temperature had an effect on the performance of the MBBR.
The operational procedures and scheduling of biosolids supernatant return flow has been erratic. The return flow of the supernatant to the WWTF headworks appeared to directly affect the performance of the MBBR basin as the NH3‐N concentration of the supernatant was typically between 1,500 and 2,000 mg/L.
12

0
5
10
15
20
25
30
35
Apr‐03
May‐03Jun‐03Jul‐03
Aug‐03
Sep‐03Oct‐03
Nov‐03
Dec‐03Jan‐04
Feb‐04
Mar‐04
Apr‐04
May‐04Jun‐04Jul‐04
Aug‐04
Sep‐04Oct‐04
Nov‐04
Dec‐04Jan‐05
Feb‐05
Mar‐05
Apr‐05
NH3‐N
(mg/L)
0
10
20
30
40
50
60
70
80
90
100
NH3‐N
Removal (%
)
Influent NH3‐N Effluent NH3‐NEffluent NH3‐N Summer Limit (8 mg/L) Influent NH3‐N Design (17 mg/L)NH3‐N Removal
Figure 6. MBBR NH3‐N Monthly Average Data.
Table 4. Seasonal MBBR Performance.
Parameter June‐September (warm weather)
December‐March (cold weather)
Overall (24 months)
Effluent Temperature, °C 18.7 12.0 15.3
Influent NH3‐N, mg/L 20.8 24.4 22.3
NH3‐N Loading, g/m2/d 0.98 0.96 0.97
NH3‐N Removal, % 88.0 63.6 75.2
Effluent NH3‐N, mg/L 2.75 10.0 6.84
As illustrated by the data in Figure 7, periods of supernatant return also correlated with periods of high influent NH3‐N concentrations. The information contained in the following figures sought to provide a clearer understanding of the impact of supernatant return on the performance of the MBBR system. Figure 8 showed the total MBBR basin NH3‐N loading, the portion of the NH3‐N loading contributed by the supernatant, influent and effluent NH3‐N, and headworks supernatant return flow data for the period of January to March 2004. As evident by the data in the figure, the supernatant load represented a significant portion of the total MBBR NH3‐N loading.
13
0
10
20
30
40
50
60
70
80
Apr‐03
May‐03
Jun‐03Jul‐03
Aug‐03
Sep‐03
Oct‐03
Nov‐03
Dec‐03
Jan‐04
Feb‐04
Mar‐04
Apr‐04
May‐04
Jun‐04Jul‐04
Aug‐04
Sep‐04
Oct‐04
Nov‐04
Dec‐04
Jan‐05
Feb‐05
Mar‐05
Apr‐05
NH3‐N (mg/L)
5
10
15
20
25
30
35
40
45
Supernate Flow (GPM)
Influent NH3‐N Effluent NH3‐N Supernate Flow
Figure 7. Supernatant Return Flow and MBBR Performance.
At the beginning of January 2004, the City of Moorhead WWTF was returning biosolids supernatant to the headworks at a rate of approximately 26 gallons per minute (GPM). Coincidently, the NH3‐N loading and influent and effluent concentrations in the MBBR basin were above the previously reported average values (approximately 0.97 g/m2/d, 22 mg/L, and 7.0 mg/L, respectively).
However, when the WWTF ceased supernatant return flow on January 9, 2004 the loading as well as influent and effluent NH3‐N concentrations in the MBBR returned to average levels. January 2004 was also (as previously reported), on average, the coldest month since the operation of the MBBR began, indicating the basin is impacted more profoundly by supernatant return than temperature. In February 2004, supernatant was again flowing and the MBBR basin NH3‐N loading and concentrations responded by increasing above average levels. The flow of supernatant was held relatively constant during the middle of February 2004 and the MBBR basin appeared to acclimate as the effluent NH3‐N concentrations plateau and eventually decline. However, as evident by the data, when supernatant flow was increased throughout March 2004 the NH3‐N again ascended beyond average conditions. The MBBR basin NH3‐N loading and concentrations responded almost immediately once the supernatant return flow was reduced on March 21, 2004.
Because of the low growth rate of nitrifying organisms, the MBBR is not able to respond immediately to the additional NH3‐N loading associated with the supernatant return. However, following periods of consistent, steady return flow rates, it appears the nitrifiers are able to adapt to the increased NH3‐N conditions. It should be noted, the MBBR cannot achieve the same effluent NH3‐N concentrations at lower loadings, when compared to higher loadings, due to lower nitrifier growth rates at reduced loadings (Ødegaard et al., 1994). When supernatant return was occurring during the six month period in 2004, the flow, NH3‐N loading, and NH3‐N influent concentrations for both the MBBR basin and the supernatant are shown in Table 5.
14

0
5
10
15
20
25
30
35
40
45
50
1‐Jan‐048‐Jan‐04
15‐Jan‐04
22‐Jan‐04
29‐Jan‐04
5‐Feb‐04
12‐Feb‐04
19‐Feb‐04
26‐Feb‐04
4‐Mar‐04
11‐Mar‐04
18‐Mar‐04
25‐Mar‐04
NH3‐N (mg/L) and
Supernate Flow (GPM
)
0.0
0.2
0.4
0.6
0.8
1.0
1.2
1.4
1.6
1.8
2.0
NH3‐N Loading (g/m
2 /d)
Supernate Flowrate Influent NH3‐NEffluent NH3‐N Total MBBR NH3‐N LoadingSupernatant NH3‐N Loading
Figure 8. January–March 2004 Supernatant Flow and MBBR Response.
Table 5. MBBR Conditions During Supernatant Return.
Parameter
Total MBBR Conditions
Supernatant Conditions
Flow Minimum Average Maximum
3.53 mgd1 4.22 mgd 8.22 mgd
1.00 gpm2 22.5 gpm 41.0 gpm
Influent NH3‐N Minimum Average Maximum
13.4 mg/L 27.1 mg/L 42.9 mg/L
1,254 mg/L 1,813 mg/L 2,149 mg/L
NH3‐N Loading Minimum Average Maximum
0.57 g/m2/d 1.18 g/m2/d 1.98 g/m2/d
0.13 g/m2/d 0.78 g/m2/d 1.30 g/m2/d
1mgd = Million gallons per day. 2gpm = Gallons per minute.
As evident by the above data, times of supernatant return correlated with periods of NH3‐N loading that exceeded the MBBR design maximum value of 1.13 g/m2/d. The impacts from the additional NH3‐N loading associated with the supernatant return were intentionally excluded during the design of the MBBR. During months when permit limits are enforced, the WWTF established operational procedures to cease supernatant return activities to avoid NH3‐N
15

discharge violations. Although the return of supernatant is temporarily halted when permit limitations are enforced, to improve the operational stability of the MBBR and reduce the overall NH3‐N concentrations discharged to the Red River, the Moorhead WWTF should explore equalized return flow of supernatant.
The Moorhead MBBR basin was monitored under various flow and loading conditions to gain an improved understanding of the system and to evaluate the current operational practices. Flow through the MBBR had varied in response to wet‐weather conditions, but during the remainder of the twenty‐four month period since operation was initiated, the flow remained relatively stable and well within the design conditions. The MBBR demonstrated the criteria of an effective tertiary nitrifying system even though the average influent loading (0.97 g/m2/d) had been consistently greater than average design loading (0.84 g/m2/d). Despite the higher than anticipated NH3‐N loadings, the NH3‐N removal efficiency of the basin was on average 75.2%; more than 10% higher than the predicted rate (refer to Table 2).
Since operation began, the overall performance of the MBBR basin had been variable. Colder temperatures appeared to reduce the nitrification rate in the basin. Although the removal efficiency was reduced in cold weather months the MBBR basin consistently removed more than 64% of the influent NH3‐N received during the colder periods. Therefore, the system has demonstrated the ability to oxidize ammonia even at low temperatures. Because the system rarely experienced pH shifts, the nitrifying organisms within the MBBR appeared to acclimate to the lower than optimum pH condition.
In regard to the full‐scale MBBR basin monitoring, the operational return of supernatant from the biosolids storage facility to the headworks of the WWTF has been shown to have the greatest impact on the overall performance of the MBBR basin. As evident by the data, the supernatant load represents a significant portion of the total MBBR NH3‐N loading. Because of the low growth rate of nitrifying bacteria, the MBBR basin was unable to respond immediately to the elevated NH3‐N loading associated with the supernatant return flow. Because of the variability in influent NH3‐N concentrations and loadings due to the return of supernatant, equalized and regularly scheduled supernatant flow should be implemented at the Moorhead WWTF. The proposed action will result in more consistent loading to the basin and would allow for greater treatment efficiency across the MBBR, due to the observed adaptability of nitrifying bacteria in the system.
Because equalized return flow will only stabilize the NH3‐N loading to the MBBR, side‐stream treatment of the supernatant could also be explored to reduce the potential for overloading the system. Side‐stream treatment will reduce the additional NH3‐N loading associated with the supernatant; however the increased costs to treat the supernatant separately may prohibit this action. The addition of media to the basin could also be explored, as the additional surface area will allow for greater biomass within the MBBR.
Hydraulic Analysis
To examine the hydraulic characteristics and select an appropriate hydraulic model to simulate the full‐scale MBBR system, tracer studies were performed. Additionally, NH3‐N distribution in the MBBR was carried out to evaluate flow‐through the basin and evaluate the potential for basin short‐circuiting and/or dead zones.
16

Tracer Studies
For modeling purposes, an understanding of flow through the MBBR basin was necessary to determine how the reactor behaves hydraulically. To evaluate the hydraulic characteristics of the MBBR basin, a series of pulse‐input tracer studies were performed. A total of four tracer studies were conducted at four influent flow rates and two different air (mixing) flow rates. Various flow rates, measured for the duration of each test, were utilized to evaluate the change in basin hydraulic characteristics associated with flow. Increased mixing was also examined to determine if elevated aeration (mixing) reduced the potential for “dead zones” within the MBBR. In one test, flow was equally split between opposing ends of the inlet side of the MBBR basin to evaluate the impacts associated with improved influent flow distribution. The flow conditions for all four tracer analyses are displayed in Table 6.
Table 6. MBBR Flow Conditions During Tracer Analysis.
Test No.
Operational Conditions
Air (Mixing) Flow (scfm1)
Influent Flow (mgd2)
1 Average daily flow, normal mixing 4,500 4.40
2 Split influent flow, normal mixing 4,500 4.74
3 Elevated aeration (mixing) rate 7,500 5.34
4 Peak flow, normal mixing 4,500 6.60 1scfm=Standard cubic feet per minute. 2mgd=Million gallons per day.
Based upon the effluent tracer data obtained from the studies, the hydraulic characteristics of the MBBR basin were evaluated by assuming the system performed as a number of equal‐volume, continuous‐flow stirred tank reactors (CFSTRs) in series. The trending of tracer data indicated the system behaves more similar to a series of CFSTRs as opposed to a single CFSTR or a plug‐flow reactor. To simulate the tracer response through the series of CFSTRs, the following non‐reactive pulse‐input tracer equation was utilized as suggested by Tchobanoglous and Schroeder (1987).
⎟⎠⎞
⎜⎝⎛ −−
⎟⎠⎞
⎜⎝⎛
−= n
tno
T en
tnCC /
1
/)!1(θ
θ, (4‐2)
where CT = theoretical effluent dye concentration at time t, mL/L Co = initial dye concentration, mL/L t = time, min n = number of CFSTRs in series Θ = hydraulic detention time, min
= total reactor volume/flow rate
Using Equation (4‐2), the actual effluent tracer response curve was statistically fit to a theoretical effluent tracer response curve by adjusting the effective basin volume to minimize the error between the actual and theoretical curves, utilizing the method of least squares. The effective basin volume does not contain the reactor volume associated with stagnant flow, or dead zones (i.e., effective volume = total volume – stagnant volume). As a result, the potential for
17

flow to short‐circuit or bypass the MBBR basin is represented by the dead volume of the basin for each flow rate and mixing condition.
The result of a typical tracer study was presented in Figure 9. The actual full‐scale field measured basin effluent dye concentrations, theoretical tracer response curves for 2 and 3 ideal CFSTRs, and best‐fit tracer response curves with assumed effective volumes were included in the figure. Table 7 summarizes the results of the four full‐scale tracer studies.
0.00
0 50 100 150 200 250 300Time (min)
0.01
0.02
0.03
0.04
0.05
0.06
0.07
0.08
0.09
0.10
Effluent Dye Concentration (mL/L)
Actual 2 CFSTRs 2 CFSTRs, 92% effective volume 3 CFSTRs
Figure 9. Tracer Test No. 4 Response (at 6.60 MGD and 4,500 scfm). Table 7. Full‐Scale Tracer Analysis Summary.
Test No.
Influent Flow
Condition
Air (Mixing) Flow (scfm1)
Influent Flow (mgd2)
Theoretical HDT3
(hours)
Effective Volume (%)
Effective HDT3 (hours)
R²
1 Normal operation 4,500 4.40 4.3 76 3.3 0.86
2 Split flow 4,500 4.74 4.5 85 3.8 0.72
3 Normal operation 7,500 5.34 3.5 81 2.9 0.91
4 Normal operation 4,500 6.60 2.8 92 2.6 0.87 1scfm=Standard cubic feet per minute. 2mgd=Million gallons per day. 3HDT=Hydraulic detention time.
The results of the tracer studies indicated the MBBR basin could be hydraulically modeled as two equal‐volume CFSTRs in series with an effective volume less than the full basin volume. The tracer analysis implied the MBBR basin was subject to some degree of short‐circuiting between
18

the influent pipe and effluent control structure. To further illustrate the degree of short circuiting as it relates to flow through the MBBR, the basin effective volume as a function of flow rate was presented in Figure 10. As evident by the results, a linear relationship existed between basin flow and effective volume for normal operation with respect to influent flow distribution. The split‐flow condition was performed to evaluate the hydraulic impacts associated with improved influent flow distribution, and therefore, was excluded from the relationship calculation.
y = 0.0723x + 0.435R2 = 0.9851
0%
10%
20%
30%
40%
50%
60%
70%
80%
90%
100%
4.0 4.5 5.0 5.5 6.0 6.5Flowrate (MGD)
Effective MBBR Volume (%)
7.0
Normal Operation Split Influent Increased (Air) Mixing
Figure 10. Effective Volume as a Function of Influent Flow.
The short‐circuiting of influent flow to the effluent structure appeared to be related to the inlet piping arrangement which discharges the influent flow in a direction transverse to flow through the MBBR basin. As apparent by the data in Figure 10, higher flow rates, with greater momentums, distributed influent flows further across the influent end of the basin (Figure 2) resulting in better distribution and an increased effective basin volume. Enhanced mixing intensity in the MBBR by increased air flow did not appear to improve the basin effective volume, as shown by the “increased mixing” datum point in Figure 10. By splitting the influent flow between the two opposing sides at the influent end of the MBBR basin, the data indicated an increase in effective volume due to improved influent flow distribution, as evident by the “split influent” datum point in Figure 10.
NH3‐N Distribution in the MBBR
To further examine the hydraulic characteristics of the MBBR, NH3‐N distribution testing was performed. NH3‐N concentrations were examined across and throughout the basin to determine if the MBBR was experiencing zones of poor mixing or short circuiting. The NH3‐N distribution analyses were performed at three separate flow rates and two different aeration (mixing) rates. The elevated mixing scenario was performed to determine if increased aeration lowered the
19

potential for zones of poor mixing within the MBBR. Conditions in the MBBR basin during each of the three NH3‐N distribution tests are listed in Table 8. Table 8. MBBR Conditions During NH3‐N Distribution Analysis. Test No.
Operational Conditions
Air (Mixing)Flow (scfm1)
InfluentFlow (mgd2)
Influent NH3‐N (mg/L)
Basin Temp. (°C)
1 Average daily flow, normal mixing 4,500 4.40 13.9 14.2
2 Elevated aeration (mixing) rate 7,500 5.34 15.5 16.9
3 Peak flow, normal mixing 4,500 6.60 15.5 16.91scfm=Standard cubic feet per minute. 2mgd=Million gallons per day.
One of the NH3‐N distribution results are displayed in Figure 11. The inlet pipe is located at Sample Point 2, and the effluent structure is positioned adjacent to Sample Point 6 in the following figure. The corresponding sample locations are also identified in Figure 2.
East Middle West
012345678
NH3‐N (mg/L)
2
3
4
56
1
10
98
7
Figure 11. NH3‐N Distribution No. 1 (at 4.40 MGD and 4,500 scfm).
All of the distribution data indicated higher NH3‐N concentrations at or near the basin inlet (Sample Point 2). During normal MBBR basin operation at lower influent flow rates, a steep NH3‐N concentration gradient existed at the inlet end transverse to the flow through the MBBR. An increase in aeration (mixing) rate or an increase in influent flow had the propensity to move the highest NH3‐N concentration toward the middle of the influent end indicating a slight improvement with regard to influent distribution. For all three scenarios, a considerable difference in NH3‐N concentrations existed between paired sample points located along the longitudinal sides of the MBBR basin. NH3‐N concentrations, along the longitudinal side of the basin containing the inlet pipe, were measurably greater than those along the opposite (east) side of the basin. The trend confirmed influent flow short‐circuited along the inlet side of the basin and contributed to an increased effluent NH3‐N concentration.
20

Hydraulic Analysis Discussion
To evaluate the design and operational parameters of the full‐scale MBBR, NH3‐N distribution results were used in combination with the hydraulic tracer evaluations. Tracer studies indicated the MBBR system can be simulated as a number of CFSTRs in series with an effective volume less than that of the total basin volume. Recognizing the influent piping arrangement to the MBBR basin discharges flow in a direction transverse to the flow of wastewater through the basin, the NH3‐N distribution results indicated higher flow rates, with elevated velocities and momentum, drove the flow towards the center of the rectangular basin, and therefore, appeared to improve the distribution of flow across the influent end of the basin. By improving the flow distribution, the entire basin volume was more effectively utilized, thereby increasing the effective basin volume and reducing the probability for bypass flow or short‐circuiting.
By improving the distribution of influent flow across the inlet side of the basin and more effectively using the entire basin volume, the nitrification performance of the MBBR could be improved. For the Moorhead MBBR configuration, several alternatives for enhanced influent distribution are available such as the installation of a baffle at the inlet pipe or the introduction of influent at multiple points across the inlet side of the basin. The NH3‐N distribution data revealed increased mixing alone, through the use of higher aeration rates, within the MBBR did not improve the influent flow distribution. However, an increase in mixing focused solely at the inlet was not examined during the project.
The results of the hydraulic evaluations indicated that MBBR systems can be optimized by ensuring even distribution of influent flow to more effectively utilize the entire reactor volume. In addition to improved influent piping arrangements, a reactor with a greater length‐to‐width ratio may also improve influent flow distribution. Caution should be used when designing basins with high length‐to‐width ratios as these ratios may result in elevated flow‐through velocities and thus promote media migration towards the effluent end of the reactor, potentially resulting in an uneven distribution of media throughout the basin.
Nitrification Kinetics
The MBBR is an attached‐growth nitrification system. In attached growth systems, substrate is consumed at the surface of the biofilm (Metcalf and Eddy, 2003). Because of the biofilm layer characteristics on the media, the inner biomass can be considered inactive with respect to the rate of nitrification (Grady and Lim, 1999). Therefore, for analytical purposes, the assumption is implemented that only the surface area of the biofilm present on the media is active and contributing to nitrification.
Data from bench‐scale batch tests can be used to indirectly analyze nitrification kinetics with the following attached‐growth saturation or Monod‐type relationship (Metcalf and Eddy, 2003):
NKN
N
m
+=
μμ , (4‐3)
where μ = nitrifier specific growth rate, d‐1
μm = maximum nitrifier specific growth rate, d‐1 N = NH3‐N concentration, g/m
3
21

KN = half‐saturation constant, g/m3
Based on the above growth kinetics, the nitrification rate in a batch reactor can be written as:
YX
NKNr
dtdN
N
mn +
−==μ , (4‐4)
where rn = nitrification rate, g/m
3/d X = active biomass concentration in the reactor, g/m3
Y = nitrifier yield, g biomass/g substrate utilized For biofilm systems, the active biomass concentration can be written as:
VhA
X ab ××=
ρ, (4‐5)
where A = total media surface area, m2
ρb = biomass density, g/m3 ha = active biomass thickness, m V = volume of the reactor, m3
Assuming the biomass density and active biomass thickness remain relatively constant throughout the batch tests, Equation (4‐4) can be modified to:
sN
m ANK
NrdtdN
+−= ' , (4‐6)
where r’m = maximum substrate utilization rate, g/m2/d
= abm h
Yρ
μ
As = specific media surface area in the reactor, m2/m3
= VA
Based on Equations (4‐4) and (4‐6), rn is a function of the total media surface area in the reactor. Integrating Equation (4‐6) between the initial NH3‐N concentration (No) and the NH3‐N concentration at time t (Nt), the following relationship is developed (Tchobanoglous and Schroeder, 1987):
)(ln' tot
oNsm NN
NNKtAr −+⎟⎟
⎠
⎞⎜⎜⎝
⎛= (4‐7)
Assuming the quantity of active nitrifying biomass was directly related to the media surface
area provided within the reactor, the expression eliminates the need to measure the active
22

nitrifying biomass. Using Equation (4‐7), the bench‐scale NH3‐N data was plotted as a function of time to determine the nitrification kinetic parameters whereby r’m was expressed as g NH3‐N/m2/min. The half‐saturation constant, KN, is commonly reported as 1.0 mg/L for nitrifying systems with average temperatures ranging between 10 and 20°C (USEPA, 1993). Therefore, the half‐saturation constant for the MBBR basin was reasonably assumed as 1.0 mg/L. With this assumption, the r’m value was statistically fit to the observed data from the bench‐scale tests using linear regression techniques.
As previously demonstrated, nitrification within the MBBR basin appears to be affected by temperature. Lower water temperatures inhibit the activity and growth of nitrifying microorganisms (USEPA, 1993). The rate of nitrification has also been shown to be dependent upon temperature by affecting the rate of substrate diffusion to the biomass (Grady and Lim, 1999). Using the following equation (Tchobanoglous and Schroeder, 1987), r’m from the bench‐scale analysis was adjusted to 20°C.
)20(
20 '' TmTm
o
rr −⋅= θ
]
, (4‐8)
where r’m20 = maximum substrate utilization rate at 20°C, g/m2/d r’mT = maximum substrate utilization rate at temperature T, g/m2/d
Θ = temperature coefficient: Θ = 1.047 (4 ≤ T ≤ 20°C) Θ = 1.056 (T > 20°C)
Although most microorganisms grow poorly outside the pH range of 6 to 8, nitrifying bacteria are particularly sensitive (Quinlan, 1984). The rate of nitrification reaches a maximum around a pH of 8.5 and declines for lower values (Grady and Lim, 1999). Conversely, if a system has acclimated to a low pH, r’m is less effected than if the pH is suddenly shifted (USEPA, 1993). The following equation can be utilized to simulate the influence of pH on the maximum substrate utilization rate (Siegrist, 1987):
[ 1)5.6(101'' −−+= pHmom rr , (4‐9)
where r’m = maximum substrate utilization rate at a given pH, g/m2/d
r’mo = maximum substrate utilization rate at an optimum pH of 8.5, g/m2/d
A typical curve for ammonia reduction versus time for one of the thirteen laboratory bench‐scale kinetic analyses is shown in Figure 12. Equation (4‐7) was utilized to fit the observed NH3‐N data to the Monod‐type relationship. Results from all thirteen bench‐scale analyses are summarized in Table 9. The date for each bench‐scale study was intended to represent a relatively steady‐state period of operation for the full‐scale MBBR. To illustrate the operation of the full‐scale MBBR during and preceding the bench‐scale analyses, Table 10 provides full‐scale MBBR data for the day of each analysis.
As indicated by the coefficient of determination (R2) values in Table 9, all of the laboratory bench‐scale data provided an excellent fit to the Monod‐type rate expression. However, the maximum substrate utilization rate, after adjusting to a common temperature and pH, exhibited variation, ranging from 2.024 to 4.418 g/m2/d with an average of 3.370 g/m2/d. A specific investigation into the potential factors causing the variation was not conducted. However, the
23

variation may have been related to the conditions in the full‐scale MBBR at the time each test was conducted (i.e., NH3‐N loading, DO versus NH3‐N rate limiting conditions) and/or the assumption the quantity of active nitrifying biomass was directly related to the media surface area provided within the MBBR basin.
rʹm = 0.0015 g/m2/min
Media Fill = 30% Date = 4/05/2005R2 = 0.9979
0
2
4
6
8
10
12
14
16
0 20 40 60 80 100 120 140
NH3‐N (mg/L)
Time (min)
Batch Data Simulation
Figure 12. Laboratory Bench‐Scale Data. Table 9. Summary of Laboratory Bench‐Scale Analysis.
Date Measured r’m
g/m2/min
MediaFill
Fraction %
r’mT = 20°C pH = 8.5 g/m2/min
r’m
T = 20°C pH = 8.5 g/m2/d
R2
12/08/03 0.0018 <1 0.0030 4.256 0.9874
0.0016 <1 0.0026 3.783 0.9921
09/22/04
0.0011 8 0.0014 2.024 0.9710
0.0013 16 0.0017 2.392 0.9981
0.0015 32 0.0019 2.760 0.9948
09/30/04
0.0021 32 0.0028 4.073 0.9951
0.0019 44 0.0026 3.685 0.9977
0.0019 56 0.0026 3.685 0.9990
0.0020 70 0.0027 3.879 0.9971
04/05/05 0.0015 30 0.0023 3.344 0.9979
05/03/05 0.0018 30 0.0031 4.418 0.9997
05/12/05 0.0012 33 0.0022 3.162 0.9843
0.0009 60 0.0016 2.371 0.9960
24

Table 10. Full‐Scale MBBR Data for the Date of Each Bench‐Scale Analysis.
Date
Flow mgd1
Influent NH3‐N mg/L
Influent NH3‐N g/m2/d
Effluent NH3‐N mg/L
Effluent Temp °C
Effluent DO mg/L
Effluent pH
12/08/03 4.49 12.7 0.59 0.12 13.0 5.4 7.22
09/22/04 4.91 12.1 0.61 0.30 18.3 8.6 7.24
09/30/04 4.61 21.5 1.02 4.90 18.1 6.3 7.13
04/05/05 4.56 14.6 0.68 1.00 16.0 4.3 7.04
05/03/05 4.25 27.5 1.20 7.70 15.0 4.1 6.95
05/12/05 4.62 24.6 1.17 7.50 14.0 5.9 6.911mgd=Million gallons per day. Full‐Scale MBBR Simulation
To further explore and evaluate the critical design and operational parameters of the separate stage nitrifying MBBR, a model of the system was developed utilizing the data from the hydraulic and bench‐scale kinetic studies. A simulation program consisting of two CFSTRs in series with an effective volume less than the total reactor volume could be utilized to simulate the hydraulic characteristics of the MBBR basin. However, to incorporate the results of the kinetic evaluations the model was modified to a system containing two CFSTRs in series with a bypass flow representing hydraulic inefficiencies. Figure 13 contains a visual representation of the combined model.
The average r’m value of 3.37 g/m2/d obtained from the laboratory bench‐scale kinetic analyses
along with the assumed KN concentration of 1.0 mg/L were utilized for model input. To evaluate the unknown bypass flow in the model, two relatively steady‐state periods of operation were selected. One cold weather period (January 2004) and one warm weather period were evaluated (June 2004). To initiate the model, r’m was adjusted from the value of 3.37 g/m2/d (pH = 8.5 and temperature = 20°C) to reflect the actual effluent temperature and pH conditions present in the full‐scale MBBR, using Equations (4‐8) and (4‐9). Simulated effluent NH3‐N concentrations were matched to actual effluent NH3‐N concentrations for the actual influent flow and influent NH3‐N concentration by adjusting bypass flow rates as a percentage of the influent flow. The average bypass flow value was then calculated and input into the model. Effluent concentrations predicted by the model are compared to actual effluent NH3‐N concentrations in Figures 14 and 15, respectively.
25
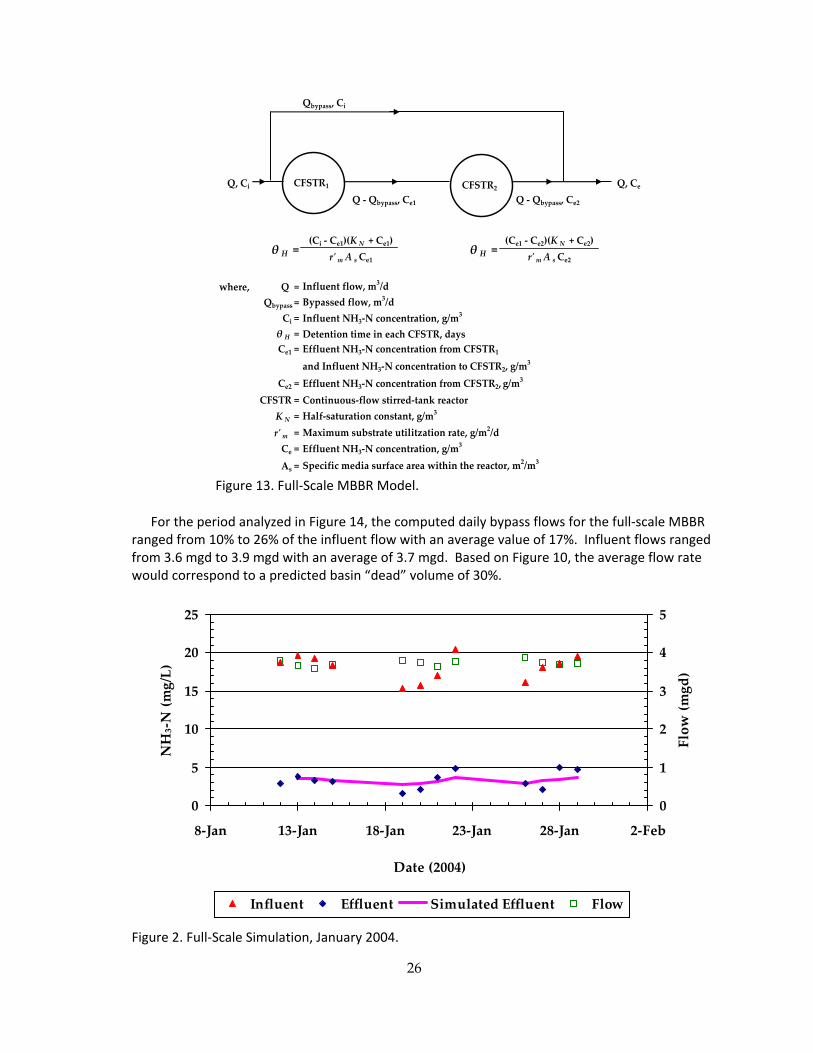
Qbypass, Ci
Q, Ci Q, CeQ ‐ Qbypass, Ce1 Q ‐ Qbypass, Ce2
where, Q = Influent flow, m3/dQbypass = Bypassed flow, m
3/dCi = Influent NH3‐N concentration, g/m
3
θ H = Detention time in each CFSTR, daysCe1 = Effluent NH3‐N concentration from CFSTR1
and Influent NH3‐N concentration to CFSTR2, g/m3
Ce2 = Effluent NH3‐N concentration from CFSTR2, g/m3
CFSTR = Continuous‐flow stirred‐tank reactorK N = Half‐saturation constant, g/m
3
rʹ m = Maximum substrate utilitzation rate, g/m2/d
Ce = Effluent NH3‐N concentration, g/m3
As = Specific media surface area within the reactor, m2/m3
(Ce1 ‐ Ce2)(K N + Ce2)rʹ m A sCe2
θ H = θ H = (Ci ‐ Ce1)(K N + Ce1)
rʹ m A sCe1
CFSTR1 CFSTR2
Figure 13. Full‐Scale MBBR Model.
For the period analyzed in Figure 14, the computed daily bypass flows for the full‐scale MBBR
ranged from 10% to 26% of the influent flow with an average value of 17%. Influent flows ranged from 3.6 mgd to 3.9 mgd with an average of 3.7 mgd. Based on Figure 10, the average flow rate would correspond to a predicted basin “dead” volume of 30%.
0
5
10
15
20
25
8‐Jan 13‐Jan 18‐Jan 23‐Jan 28‐Jan 2‐Feb
Date (2004)
NH3‐N (mg/L)
0
1
2
3
4
5
Flow (mgd)
Influent Effluent Simulated Effluent Flow
Figure 2. Full‐Scale Simulation, January 2004.
26

For the time examined in Figure 15, the range of calculated bypass flows was 0.2% to 2.6% of the influent flow with an average of 1.2%. Influent flows ranged from 4.0 mgd to 4.7 mgd with an average of 4.3 mgd. From Figure 10, the average flow rate would correspond to a basin “dead” volume of 25%. Although a direct correlation was not established, the general trend between influent flow, bypass flow, and MBBR “dead” volume is consistent; whereby higher influent flow rates reduce both the predicted “dead” volume and the computed basin bypass flow.
0
5
10
15
20
25
NH3‐N (mg/L)
0
1
2
3
4
5
Flow (mgd)
7‐Jun 12‐Jun 17‐Jun 22‐Jun 27‐Jun 2‐Jul
Date (2004)
Influent Effluent Simulated Flow
Figure 15. Full‐Scale Simulation, June 2004. By adjusting the average bypass flow as a percentage of the total basin flow, the model
provided an excellent fit to the full‐scale MBBR effluent NH3‐N data. Additionally, the model of the full‐scale MBBR was used to further evaluate the effluent NH3‐N concentrations resulting from improved hydraulic efficiency achieved by improved influent distribution (reduced short‐circuiting or bypass flow percentages). Effluent NH3‐N concentrations were modeled as a function of influent NH3‐N concentration (and loading) for various bypass flow percentages assuming an influent design flow of 4.8 mgd (resulting in a HDT of 3.9 hours), effluent temperature of 15°C, effluent pH of 7.0, KN value of 1.0 mg/L, and the average r’m value of 3.37 g/m
2/d. The full‐scale MBBR is designed to operate at a minimum DO concentration of 5 mg/L. Based
on the reported ratio of 3.2 (Szwerinski et al., 1986) signifying the change between the oxygen and ammonia limiting regime for nitrification, the transition from DO rate limiting conditions to NH3‐N rate limiting conditions was assumed to occur at an effluent NH3‐N concentration, in the second CFSTR, of approximately 1.6 mg/L (refer to Figure 13). The dashed line in the following simulations (Figures 16 to 20) represents the transition point between DO rate limiting conditions and NH3‐N rate limiting conditions. The transition line was developed assuming effluent NH3‐N of 1.6 mg/L was the critical concentration within the model CFSTRs. When bypass was equal to zero (hydraulically ideal conditions), the CFSTR NH3‐N equaled MBBR effluent NH3‐N, and therefore the transition line was vertical at 1.6 mg/L. When bypass flow existed, due to less than ideal hydraulic conditions, the weighted average effluent concentrations, as affected by bypass, was plotted.
The results of the variable bypass simulation were presented in Figure 16. The results indicated hydraulic improvement in the full‐scale MBBR could significantly increase the allowable
27

influent NH3‐N concentration for a given effluent NH3‐N goal. For an effluent NH3‐N goal of 6 mg/L and a bypass flow of 30%, the allowable influent NH3‐N concentration was approximately 20 mg/L (equal to an NH3‐N loading of 1.0 g/m
2/d). For the same effluent goal, the maximum hydraulic improvement (bypass flow of 0%), resulted in an influent NH3‐N concentration of approximately 43 mg/L (equal to an influent loading of 2.2 g/m2/d). However, DO rate limitations would begin to affect performance at approximately 34 mg/L unless DO is increased. With respect to the kinetic parameters characterizing the nitrification process, the hydraulic efficiency of the MBBR has an especially significant impact on overall performance.
0
5
10
15
20
25
30
35
40
45
50
0 2 4 6 8 10 12 14 16 18 20Effluent NH3‐N (mg/L)
Influent NH3‐N (mg/L)
0.0
0.5
1.0
1.5
2.0
2.5
NH3‐N Loading (g/m
2 /d)
Bypass = 0% Bypass = 10% Bypass = 20% Bypass = 30%
NH3‐N Rate Limiting
DO Rate Limiting
Figure 16. Effluent NH3‐N as a Function of Influent NH3‐N and Bypass Flow. Given the variability in the values of r’m collected in the laboratory bench‐scale analyses, and
the significant improvement in process performance realized by improving the hydraulic efficiency of the MBBR, an analysis of the sensitivity of the process with respect to r’m was conducted. Effluent NH3‐N concentrations were modeled as a function of influent NH3‐N concentration (and loading) for various r’m values assuming an influent flow of 4.8 mgd (HDT of 3.9 hours), effluent temperature of 15°C, effluent pH of 7.0, KN value of 1.0 mg/L, and bypass flow percentages of 0% (Figure 17) and 30% (Figure 18). DO rate limiting conditions were noted in each figure.
28

0
5
10
15
20
25
30
35
40
45
50
0 5 10 15 20 25 30 35 40Effluent NH3‐N (mg/L)
Influent NH3‐N (mg/L)
0.0
0.5
1.0
1.5
2.0
2.5
NH3‐N Loading (g/m
2 /d)
1 g/m2/d 2 g/m2/d 3 g/m2/d 4 g/m2/d
DO Rate Limiting
rʹ m =
Figure 17. Maximum Substrate Utilization Rate Sensitivity, Bypass Flow=0%.
0
5
10
15
20
25
30
35
40
45
50
0 2 4 6 8 10 12 14 16 18 20Effluent NH3‐N (mg/L)
Influent NH3‐N (mg/L)
0.0
0.5
1.0
1.5
2.0
2.5
NH3‐N Loading (g/m
2 /d)
1 g/m2/d 2 g/m2/d 3 g/m2/d 4 g/m2/d
NH3‐N Rate Limiting
DO Rate Limiting
rʹ m =
Figure 18. Maximum Substrate Utilization Rate Sensitivity, Bypass Flow=30%.
29

At a bypass flow of 0% (maximum hydraulic efficiency), DO rate limitation controlled all effluent NH3‐N concentrations greater than approximately 1.6 mg/L. For the effluent NH3‐N concentration of 1.6 mg/L, the range of r’m values measured in the laboratory studies predicted allowable influent NH3‐N concentrations of 20 to 40 mg/L (loading of 1.0 g/m2/d to 2.0 g/m2/d). Therefore, with a properly designed system, process performance was very sensitive to r’m. Conversely, with a bypass flow of 30% and an effluent NH3‐N goal of 6 mg/L, the allowable influent NH3‐N concentration would have been approximately 20 mg/L (loading of 1.0 g/m2/d) for the range of r’m values measured in the laboratory studies. The 20 mg/L influent concentration (1.0 g/m2/d loading) condition would place the operation just inside of the DO rate‐limiting regime. With significant bypass flows, process performance is not sensitive to nitrification kinetics, but rather, is governed by the hydraulic operation of the basin.
For r’m values less than those measured in the laboratory studies (≤ 2 g/m2/d), predicted nitrification performance drops off significantly for either bypass scenario (Figures 17 and 18).
To further examine the sensitivity of the model, with respect to nitrification kinetics, the half‐saturation constant was also evaluated. The KN value was varied based on reported ranges for aerobic attached‐growth nitrifying systems (USEPA, 1993). The full‐scale model was evaluated in terms of KN for both ideal and less‐than‐ideal hydraulic conditions. NH3‐N concentrations were modeled as a function of influent NH3‐N concentration (and loading) for various KN values assuming an influent flow of 4.8 mgd (HDT of 3.9 hours), effluent temperature of 15°C, effluent pH of 7.0, r’m value of 3.37 g/m
2/d, and bypass flow percentages of 0% and 30%. The results of the model simulations for both hydraulic situations were presented in Figures 19 and 20, respectively.
0
5
10
15
20
25
30
35
40
45
50
0 5 10 15 20 25 30 35 40Effluent NH3‐N (mg/L)
Influent NH3‐N (mg/L)
0.0
0.5
1.0
1.5
2.0
2.5
NH3‐N Loading (g/m2 /d)
0.5 mg/L 1.0 mg/L 1.5 mg/L 2.0 mg/L
DO Rate Limiting
K N =
Figure 19. Half‐Saturation Constant Sensitivity, Bypass Flow=0%.
30

0
5
10
15
20
25
30
35
40
45
50
0 2 4 6 8 10 12 14 16 18 20Effluent NH3‐N (mg/L)
Influent NH3‐N (mg/L)
0.0
0.5
1.0
1.5
2.0
2.5
NH3‐N Loading (g/m2 /d)
0.5 mg/L 1.0 mg/L 1.5 mg/L 2.0 mg/L
NH3‐N Rate Limiting
DO Rate Limiting
K N =
Figure 20. Half‐Saturation Constant Sensitivity, Bypass Flow=30%. As evident by the modeling results displayed in Figures 19 and 20, the simulation was largely
independent of the half‐saturation constant for the EPA reported values. Utilizing the r’m value of 3.37 g/m2/d obtained from the bench‐ scale analyses, the nitrification in the Moorhead MBBR was generally unaffected by the value of KN as the predicted effluent NH3‐N concentrations varied by less than 3.0 mg/L for both hydraulic scenarios at all simulated influent NH3‐N concentrations. Therefore, the assumed KN value of 1.0 mg/L for the MBBR system is acceptable for modeling purposes.
The model analyses indicated the MBBR process was highly dependent on both hydraulic considerations and the maximum substrate utilization rate, r’m, describing the nitrification process. The laboratory bench‐scale analyses conducted as part of this study indicated accurate measurement of the r’m parameter may have be confounded by several factors including conditions in the full‐scale MBBR at the time of analysis and/or the assumption the quantity of active nitrifying biomass was directly related to the media surface area provided.
31
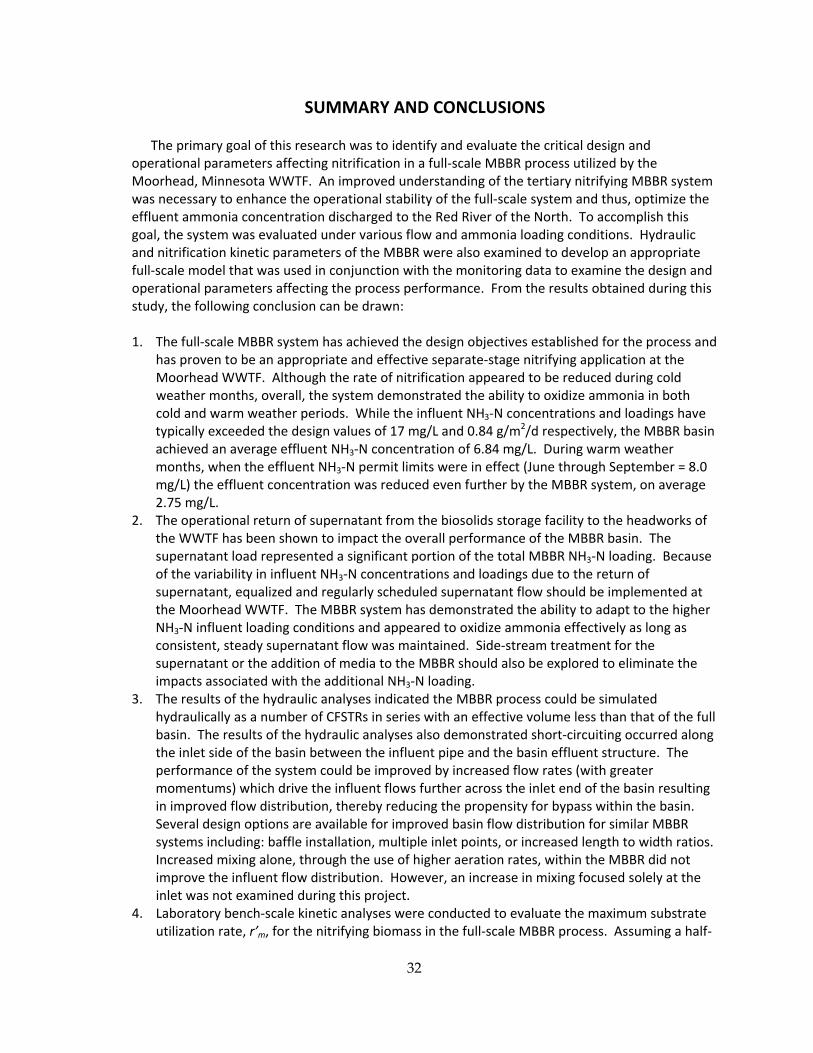
SUMMARY AND CONCLUSIONS
The primary goal of this research was to identify and evaluate the critical design and operational parameters affecting nitrification in a full‐scale MBBR process utilized by the Moorhead, Minnesota WWTF. An improved understanding of the tertiary nitrifying MBBR system was necessary to enhance the operational stability of the full‐scale system and thus, optimize the effluent ammonia concentration discharged to the Red River of the North. To accomplish this goal, the system was evaluated under various flow and ammonia loading conditions. Hydraulic and nitrification kinetic parameters of the MBBR were also examined to develop an appropriate full‐scale model that was used in conjunction with the monitoring data to examine the design and operational parameters affecting the process performance. From the results obtained during this study, the following conclusion can be drawn:
1. The full‐scale MBBR system has achieved the design objectives established for the process and
has proven to be an appropriate and effective separate‐stage nitrifying application at the Moorhead WWTF. Although the rate of nitrification appeared to be reduced during cold weather months, overall, the system demonstrated the ability to oxidize ammonia in both cold and warm weather periods. While the influent NH3‐N concentrations and loadings have typically exceeded the design values of 17 mg/L and 0.84 g/m2/d respectively, the MBBR basin achieved an average effluent NH3‐N concentration of 6.84 mg/L. During warm weather months, when the effluent NH3‐N permit limits were in effect (June through September = 8.0 mg/L) the effluent concentration was reduced even further by the MBBR system, on average 2.75 mg/L.
2. The operational return of supernatant from the biosolids storage facility to the headworks of the WWTF has been shown to impact the overall performance of the MBBR basin. The supernatant load represented a significant portion of the total MBBR NH3‐N loading. Because of the variability in influent NH3‐N concentrations and loadings due to the return of supernatant, equalized and regularly scheduled supernatant flow should be implemented at the Moorhead WWTF. The MBBR system has demonstrated the ability to adapt to the higher NH3‐N influent loading conditions and appeared to oxidize ammonia effectively as long as consistent, steady supernatant flow was maintained. Side‐stream treatment for the supernatant or the addition of media to the MBBR should also be explored to eliminate the impacts associated with the additional NH3‐N loading.
3. The results of the hydraulic analyses indicated the MBBR process could be simulated hydraulically as a number of CFSTRs in series with an effective volume less than that of the full basin. The results of the hydraulic analyses also demonstrated short‐circuiting occurred along the inlet side of the basin between the influent pipe and the basin effluent structure. The performance of the system could be improved by increased flow rates (with greater momentums) which drive the influent flows further across the inlet end of the basin resulting in improved flow distribution, thereby reducing the propensity for bypass within the basin. Several design options are available for improved basin flow distribution for similar MBBR systems including: baffle installation, multiple inlet points, or increased length to width ratios. Increased mixing alone, through the use of higher aeration rates, within the MBBR did not improve the influent flow distribution. However, an increase in mixing focused solely at the inlet was not examined during this project.
4. Laboratory bench‐scale kinetic analyses were conducted to evaluate the maximum substrate utilization rate, r’m, for the nitrifying biomass in the full‐scale MBBR process. Assuming a half‐
32
saturation constant, KN, of 1.0 mg/L, r’m was estimated by statistically fitting the observed data to an attached‐growth Monod rate expression. The data provided an excellent fit to the Monod rate expression. However, the r’m values exhibited variation, ranging from 2.024 to 4.418 g/m2/d with an average of 3.370 g/m2/d. Although a specific investigation into the potential causes for the variation was not conducted, an accurate determination of r’m may be confounded by the conditions in the full‐scale MBBR at the time the analysis was conducted. Assuming the quantity of active nitrifying biomass was directly related to the media surface area may have also led to the variation in r’m.
5. Utilizing the hydraulic simulation and the kinetic parameters obtained from the bench‐scale analyses, a combined model for the full‐scale MBBR system was developed. The hydraulic deficiencies of the system were incorporated in the model as a simulated bypass flow. The model results indicated nitrification performance in the MBBR was highly dependent upon the physical configuration and hydraulic characteristics of the basin. Hydraulic improvements in the full‐scale MBBR can significantly increase the influent NH3‐N capacity of the system for a particular effluent NH3‐N concentration goal. The MBBR process performance was found to be contingent on basin physical characteristics, as opposed to nitrification kinetics, when considerable hydraulic deficiencies exist. However, when the MBBR system was maximized with respect to hydraulics the process performance was governed by nitrification kinetics. In a hydraulically optimized basin, the simulations illustrated MBBR process performance was greatly dependent on, and sensitive to, the maximum substrate utilization rate for nitrifying bacteria, r’m. Appropriate consideration must be given to both kinetic and hydraulic characteristics to ensure maximum performance potential for any MBBR system.
33

34
REFERENCES American Public Health Association, American Water Works Association, Water Environment
Federation. (1998) Standard Methods for the Examination of Water and Wastewater. 20th ed., Washington, D.C.
Grady, Jr., L., and Lim, H. (1999) Biological Wastewater Treatment. New York, New York. Klecker, J. (1998) Feasibility Study of Achieving Ammonia Removal by Nitrification in Polishing
Ponds. Master of Science Thesis, Civil Engineering, North Dakota State University, Fargo, North Dakota.
Metcalf and Eddy, Inc. (2003) Wastewater Engineering: Treatment and Reuse. New York, NY. Minnesota Department of Health. (1990) Laboratories, Accreditation Requirements. State
Registration Minnesota Rules, Chapter 4740, 14, 1874, St. Paul, Minnesota. Ødegaard, H., Rusten, B., and Westrum, T. (1994) A New Moving Bed Biofilm Reactor –
Applications and Results. Water Science Technology, 29, 10/11, 157. Quinlan, A. (1984) Prediction of the Optimum pH for Ammonia‐N Oxidation by Nitrosomonas
Europea in Well‐Aerated Natural and Domestic Wastewaters. Water Resource, 18, 561. Rusten, B., and Neu, K. (1999) Down to Size. Water Environment Technology, 11, 27. Siegrist, T., and Gujer, W. (1987) Demonstration of Mass Transfer and pH Effects on Nitrifying
Bacteria. Water Resource, 21, 1481. Szwerinski, H., and Arvin, E., Harremoës, P. (1986) pH‐Decrease in a Nitrifying Biofilm. Water
Resource, 20, 971. Tchobanoglous, G., and Schroeder, E. (1987) Water Quality. Davis, California. U. S. Environmental Protection Agency. (1993) Nitrogen Control Manual. EPA‐625/R‐93/010,
Office of Research and Development, Washington, D.C. Water Environment Federation. (2000) Aerobic Fixed‐Growth Reactors. Alexandria, Virginia. Water Environment Research Foundation. (2000) Investigation of Hybrid Systems for Enhanced
Nutrient Control. Alexandria, Virginia. Zimmerman, R., Richard, D., Bradshaw, A., and Craddock, P. (2003) Pilot‐Scale Evaluation of
Separate‐Stage Nitrification Using an Attached‐Growth, Moving‐Bed Media Process. Water Environment Research, 75, 422.
Zimmerman, R., Richard, D., and Costello, J. (2004) Design, Construction, Start‐up, and Operation of a Full‐Scale Separate Stage Moving Bed Biofilm Reactor Nitrification Process. Proceedings of the 77th Annual Water Environment Federation Technical Exhibition and Conference [CD‐ROM], New Orleans, Louisiana, Oct. 2‐6, Water Environment Federation, Alexandria, Virginia.
Zimmerman, R., Richard, D., Lynne, S., and Lin, W. (2005) Is Your MBBR Running On All Cylinders? Proceedings of the 78th Annual Water Environment Federation Technical Exhibition and Conference [CD‐ROM], Washington, D.C., Oct. 29‐Nov. 2, Water Environment Federation, Alexandria, Virginia.