Embed Size (px)
Citation preview

North Dakota
Small Community Water System’s
Handbook
on
Developing and Setting Water Rates
Revised Edition

3
Written by Audrey Boe Olsen, Rural Development Specialist
Midwest Assistance Program, Inc. P.O. Box 81
New Prague, MN 56071 612-758-4334
fax: 612-758-4336 www.map-inc.org

4
Table of Contents
CHAPTER I: INTRODUCTION ....................................................................................................... 2
CHAPTER II: IS IT TIME TO EXAMINE YOUR SYSTEM’S RATE STRUCTURE? ...................... 5
CHAPTER III: IS IT TIME FOR A RATE INCREASE?................................................................... 7
DETERMINING FULL AND TRUE COSTS ............................................................................................ 7 THE RATE STUDY PROCESS......................................................................................................... 10 COLLECTING INFORMATION .......................................................................................................... 11 ANALYZING CUSTOMER USAGE .................................................................................................... 12
CHAPTER IV: WHAT TO DO WITH CUSTOMER WATER USAGE INFORMATION................. 16
COST RECOVERY ........................................................................................................................ 17
CHAPTER V: SETTING THE BASE RATE STRUCTURE .......................................................... 20
SETTING THE BASE RATE............................................................................................................. 21 SETTING THE FLOW CHARGE (COST PER 1,000 GALLONS) ............................................................. 21 MODIFYING THE SINGLE BLOCK RATE STRUCTURE........................................................................ 23
CHAPTER VI: RAISING RATES - HOW YOU DO IT MAKES A DIFFERENCE!........................ 25
DO YOUR HOMEWORK ................................................................................................................. 25 STREAMLINE YOUR OPERATION ................................................................................................... 26 EDUCATING YOUR CUSTOMERS ................................................................................................... 26 GETTING THE WORD OUT ............................................................................................................ 28
This document was prepared by Midwest Assistance Program, the Midwestern RCAP, under a contract with the North Dakota Department of Health, 1999.

2
Chapter I: Introduction No community water system governing board wants to raise rates. However, one needs to remember that the goal of every public water system is to provide customers with an uninterrupted supply of safe, dependable, fairly-priced water while operating at breakeven or better financially. In order to meet these goals, the community water system’s rate structure must produce enough revenue to operate the system in a safe, lawful, and financially sound manner. This will help assure the ability of the water utility to maintain and meet future customer needs. Generally the development of water rates involves the following procedures: 1. Rates must be set at a level that covers the full cost of producing,
treating, storing, and distributing water to customers. This includes debt service, financial reserves, operation, maintenance, and all regulatory compliance costs.
2. Rates must be fair and equitable. Fair means the rate is high enough to
cover the full cost of the system. Equitable means that each class of customer is paying its fair share of the costs. (Classes of customers will be defined later.)
3. Water system revenues should not be used to pay for other municipal
services. Using water revenues for other purposes, and not maintaining adequate financial reserves for future expenditures, will certainly increase the costs of operation in the long run.
4. Customers should know what the rates are. Your governing board might
want to post water rates in the water or city office and consider sending them to customers at least once a year.
5. The rate structure for your water utility should be easy to understand. In
general, the rate structure for a small system (under 5,000) should have no more than 1-3-user classifications and 1-5-consumption blocks.
6. Water rates have a short life span. The existing rate structure should be
examined once a year as part of the budget development process to determine if any adjustment should be made.
7. Good rate structures are based on good budgets and good customer
records. It’s tough to develop a fair and equitable rate structure if you’re not sure what your expenses and revenues have been for the past two to three years and how much water you’re selling to each customer.

3
8. The rate structure should be easy to administer. If the rate structure is complex and difficult to administer, chances are it’s going to be hard for customers to understand and support.
The chart on the next page describes the four most common types of rate structures. Study this chart closely to see what type of rate structure your system is using. As you can see, each rate structure has advantages and disadvantages. Your governing body needs to make careful and thoughtful decisions that balance the needs of both small and large users in your service area. If you’re trying to develop or attract industry for example, you might want to select a rate structure that is favorable to large water users. However, you don’t want to do this at the expense of your residential and small volume users. Consider the need to conserve. If your supply is abundant and your treatment costs are relatively low and will remain so even with meeting new drinking water regulatory standards, you might not view conservation as important. However, most financing agencies consider conservation in financing new projects. Conservation can also help in maintaining your level of storage as well as avoiding peak power rates that some electrical companies charge at various times of the day or year. If your system isn’t metered and your water system is using a uniform flat rate, it is strongly recommended installing meters. If your system’s meters are over 10 years old, it is strongly recommended you consider calibrating all meters or consider a plan for replacement of the meters. Meters are the cash registers of your water utility. If the meters are not accurate you are probably losing revenue due the system. Your governing board will want to select a rate structure that is fair and equitable to all ratepayers and produces the revenue necessary to operate the system successfully.

4
TYPES OF RATE STRUCTURES
Definitions User Classifications: Divide customers into groups such as residential, commercial, industrial, agricultural/seasonal. Some systems classify customers by meter size. Many systems have different rates for each classification of customers. Consumption Block: A preset quantity of water at a stated price. An example follows of a rate structure with 4 consumption blocks. $x for the first 2,000 gallons used $x per 1,000 from 2,000 to 6,000 gallons $x per 1,000 from 6,001 to 10,000 gallons $x per 1,000 for everything over 10,000 gallons used UNIFORM FLAT RATE Customers pay the same amount regardless of quantity of water used. Used in unmetered systems. Example: Each customer is charged a flat rate of $x per month.
Advantages: No expense for installing and reading meters. Disadvantages: All customers pay either too much or too little for what they use. Is not based on use. Promotes high consumption. Not recommended.
SINGLE BLOCK RATE Customers are charged a constant price per gallon regardless of the amount of water used. Often coupled with a minimum charge for having service available. Example: $x minimum service or base rate (optional) plus #x per 1,000 gallons used.
Advantages: Easy to administer, may encourage water conservation. Cost to customer is in direct proportion to amount they use. Disadvantages: May discourage high water consuming industries from locating in the service area.
DECREASING BLOCK RATE The price of water declines as the amount used increases. Each succeeding consumption block is cheaper. This structure is based on the assumption that costs decline as consumption goes up. Example: $14 for first 2,000 gallons used, $2.50 per 1,000 from 2,000 – 6,000 gallons. $2.00 per 1,000 from 6,001 – 10,000 gallons, $1.00 per 1,000 for everything over 10,000 gallons.
Advantages: Attractive to large volume users. Disadvantages: Production costs may not decrease with the increase in gallons of water produced. For a limited number of customers, low volume users may be subsidizing large volume users.
INCREASING BLOCK RATE The price of water increases as the amount used increases. Each succeeding consumption block is more expensive. Structure based on the assumption that water rates should promote water conservation. Example: $14 minimum for first 2,000 gallons used. $2.00 per 1,000 from 2,000 – 6,000 gallons, $2.50 per 1,000 from 6,001 – 10,000, $3.00 per 1,000 for everything over 10,000 gallons.
Advantages: Promotes water conservation, especially important in areas of limited water supplies or high treatment costs. Less water use means less wastewater and smaller, less expensive wastewater treatment facilities. Provides a reasonable amount of water at a reasonable price and charges a premium for those using more. Disadvantages: Higher costs for high usage may discourage industry from locating in service area.
5
Chapter II: Is It Time To Examine Your System’s Rate Structure?
“The Governing Board’s job is to keep the water rates down! We’ve always had the lowest rates of any system in this area, and we aim to keep it that way! We’d be voted out if we raise the rates. Besides we have a lot of older folks on fixed incomes who can’t pay more…”
Chances are you’ve heard comments like these before – or said something similar yourself. Well, you’re not alone. Most small community water systems are reluctant to raise water rates. It is never easy. But there is a trend toward reviewing rates annually as part of the budget development process. Small annual increases are easier for customers to handle. Reviewing and adjusting rates annually can also help your system keep pace with increasing operation and regulatory compliance costs. No governing board wants to raise rates. Before you look at raising rates, you must examine the current rate structure. The following questions can help you decide whether a rate adjustment is needed in the future. 1. Did revenue exceed system expenses each of the last three years? 2. Were you able to make scheduled payments on all long-term debt? 3. Is your system in compliance with state drinking water standards and
regulations? 4. Were you able to cover the cost of emergency and preventative maintenance
as needed? 5. Have you had a rate increase in the last three years? If you answered “NO” to any of the above questions, it may be time to examine your rate structure and consider raising rates. There is no way to guarantee overwhelming public support for a rate increase. What has been found by many small systems, however, is that public support increases if customers:
• Have a clear understanding of the proposed rate structure; • Can see that the rate structure is necessary in order to operate the system
on a financially sound basis; and • That each class of customers is paying its fair share of the cost.
Developing a rate structure is more than just raising rates. It is recommended that you not just “add $2 to every bill” or use the “I’ve got a gut feeling” approach to raising rates. Midwest Assistance Program has found in our experience with

6
small systems, these approaches seldom result in fair or equitable rates that users will support. On the other hand, you don’t need to hire an engineer or a certified public accountant to do a rate study or rate analysis of your system. Developing a good rate structure takes some time and work on the part of your governing board and staff. The first rate analysis you do will be the hardest. Future rate studies will be much easier. If you take the time to develop water rates that are fair, equitable and understood by all of your customers, the level of community support may surprise you. If your community water system has a base rate and a per 1,000 gallon charge, what costs are included in the base rate? What costs are covered by the flow charge (the charge per 1,000 gallons)? Research your governing board minutes and records to try to determine what system costs the base rate is supposed to cover. When this question is asked of some systems, they respond that the base rate is the amount recommended by the financing agency or an engineer. All fixed costs should be covered by the base rate. Fixed costs are such expenses as purchased water, loan payments (including interest), billing and collecting expenses, testing, telephone for telemetry reasons, and the various reserves – debt service and capital improvements. This Handbook recommends that the base rate cover fixed costs listed above: purchased water, billing and collecting expense, long term debt, the debt service reserve, and an annual minimal amount be put into a operation, maintenance and replacement reserve. Some may call this last reserve a capital improvement fund. Chapter IV will go further into the discussion of Fixed Costs and Variable Costs. Remember that most of the money to pay for budgeted fixed or variable costs comes from selling water to your customers.

7
Chapter III: Is It Time for a Rate Increase?
If you’ve already put in place all the cost saving measures you can and your system is running efficiently… But system expenses are more than revenues, or you “can’t afford” needed system maintenance and improvements, or there’s not enough money to make scheduled payments on long-term debt after paying other bills, or you have to transfer funds from another city account to make scheduled payments and hope to have enough revenue later to return those funds, then
It may be time for a rate increase! As the governing board, you are responsible for making sure you charge your customers enough to cover all expenses of the system. You are also responsible for spreading those charges fairly and equitably among all the customers served by the system. I’m sure you have heard, “but water is free”! The water may be free, but pumping, treating, storing, distributing, operating and maintaining the system in compliance with state the federal regulations is not free. For most small systems, these costs are going up each year. More and more small systems are finding it useful to review their rate structures every year as part of the annual budgeting process. Many are finding that it is easier for their customers to pay a modest increase each year rather than a large increase every several years or when a crisis hits and there are no financial reserves to cover the cost. Customers want dependable service and are willing to pay a fair price for it. Determining Full and True Costs Before your community water system can determine how much extra revenue might be needed for the next operating year, the governing board must review existing expenses to see that all costs to the water utility are being charged in the expenditures. It is much easier to determine total revenues for a water utility than total expenditures. Included here is a table of expenditures that make up the cost of operating a water utility. This table divides field labor, or operation and maintenance labor, from administrative labor for billing and collecting. Operation and maintenance labor can be further divided into production and distribution costs. You will note these various division on the table.
8
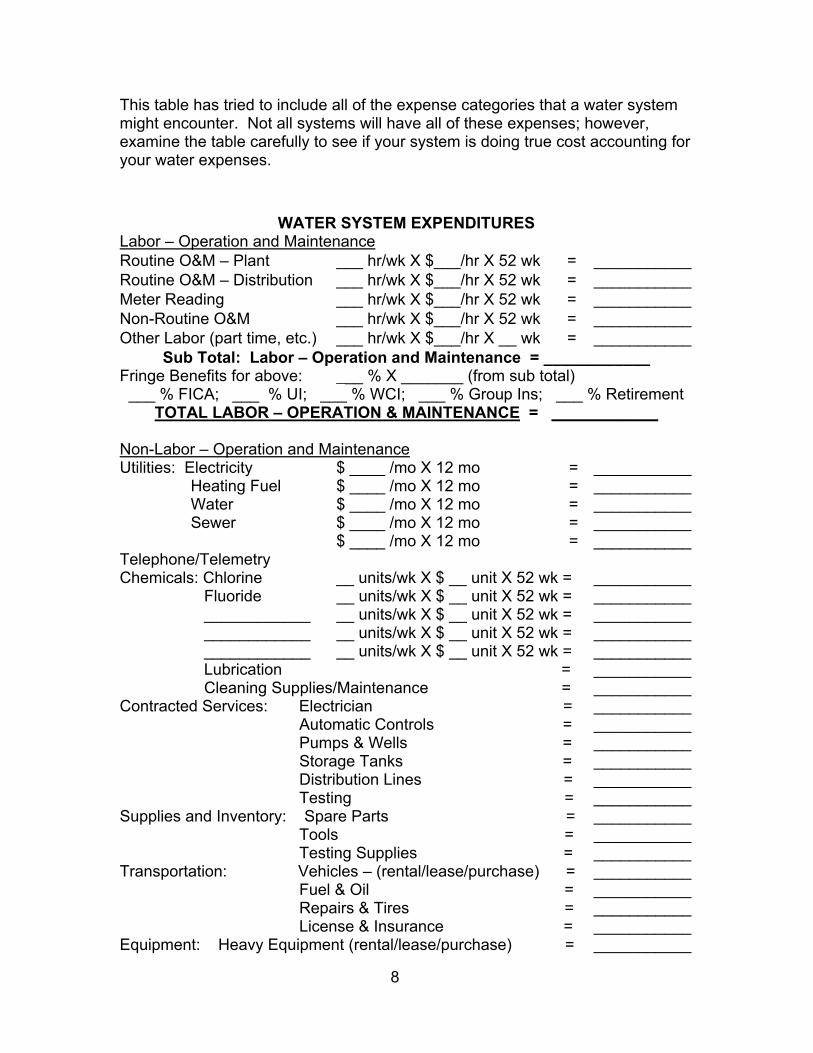
This table has tried to include all of the expense categories that a water system might encounter. Not all systems will have all of these expenses; however, examine the table carefully to see if your system is doing true cost accounting for your water expenses.
WATER SYSTEM EXPENDITURES Labor – Operation and Maintenance Routine O&M – Plant ___ hr/wk X $___/hr X 52 wk = ___________ Routine O&M – Distribution ___ hr/wk X $___/hr X 52 wk = ___________ Meter Reading ___ hr/wk X $___/hr X 52 wk = ___________ Non-Routine O&M ___ hr/wk X $___/hr X 52 wk = ___________ Other Labor (part time, etc.) ___ hr/wk X $___/hr X __ wk = ___________
Sub Total: Labor – Operation and Maintenance = ____________ Fringe Benefits for above: ___ % X _______ (from sub total) ___ % FICA; ___ % UI; ___ % WCI; ___ % Group Ins; ___ % Retirement
TOTAL LABOR – OPERATION & MAINTENANCE = ____________ Non-Labor – Operation and Maintenance Utilities: Electricity $ ____ /mo X 12 mo = ___________ Heating Fuel $ ____ /mo X 12 mo = ___________ Water $ ____ /mo X 12 mo = ___________ Sewer $ ____ /mo X 12 mo = ___________ Telephone/Telemetry
$ ____ /mo X 12 mo = ___________
Chemicals: Chlorine __ units/wk X $ __ unit X 52 wk = ___________ Fluoride __ units/wk X $ __ unit X 52 wk = ___________ ____________ __ units/wk X $ __ unit X 52 wk = ___________ ____________ __ units/wk X $ __ unit X 52 wk = ___________ ____________ __ units/wk X $ __ unit X 52 wk = ___________ Lubrication = ___________ Cleaning Supplies/Maintenance = ___________ Contracted Services: Electrician = ___________
Automatic Controls = ___________ Pumps & Wells = ___________ Storage Tanks = ___________ Distribution Lines = ___________ Testing = ___________
Supplies and Inventory: Spare Parts = ___________ Tools = ___________ Testing Supplies = ___________
Transportation: Vehicles – (rental/lease/purchase) = ___________ Fuel & Oil = ___________ Repairs & Tires = ___________ License & Insurance = ___________
Equipment: Heavy Equipment (rental/lease/purchase) = ___________
9
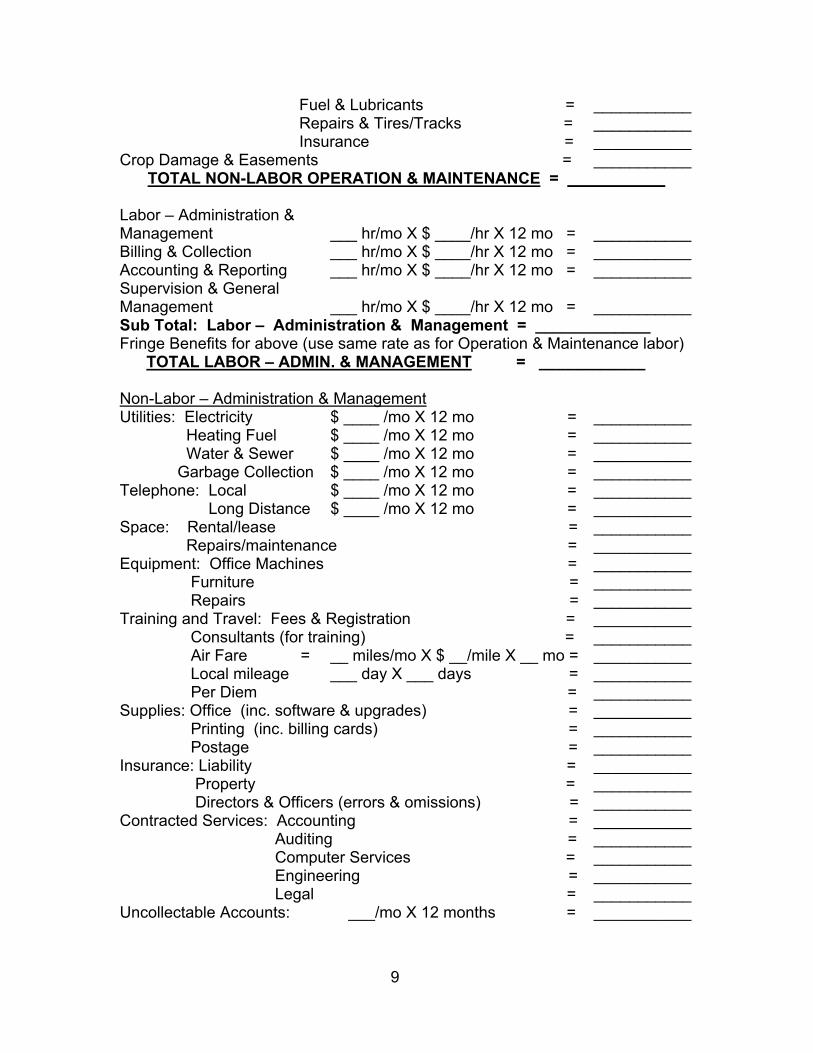
Fuel & Lubricants = ___________ Repairs & Tires/Tracks = ___________ Insurance = ___________
Crop Damage & Easements = ___________ TOTAL NON-LABOR OPERATION & MAINTENANCE = ___________
Labor – Administration & Management
___ hr/mo X $ ____/hr X 12 mo =
___________
Billing & Collection ___ hr/mo X $ ____/hr X 12 mo = ___________ Accounting & Reporting ___ hr/mo X $ ____/hr X 12 mo = ___________ Supervision & General Management
___ hr/mo X $ ____/hr X 12 mo =
___________
Sub Total: Labor – Administration & Management = _____________ Fringe Benefits for above (use same rate as for Operation & Maintenance labor) TOTAL LABOR – ADMIN. & MANAGEMENT = ____________ Non-Labor – Administration & Management Utilities: Electricity $ ____ /mo X 12 mo = ___________ Heating Fuel $ ____ /mo X 12 mo = ___________ Water & Sewer $ ____ /mo X 12 mo = ___________ Garbage Collection $ ____ /mo X 12 mo = ___________ Telephone: Local $ ____ /mo X 12 mo = ___________ Long Distance $ ____ /mo X 12 mo = ___________ Space: Rental/lease = ___________ Repairs/maintenance = ___________ Equipment: Office Machines = ___________ Furniture = ___________ Repairs = ___________ Training and Travel: Fees & Registration = ___________ Consultants (for training) = ___________ Air Fare = __ miles/mo X $ __/mile X __ mo = ___________ Local mileage ___ day X ___ days = ___________ Per Diem = ___________ Supplies: Office (inc. software & upgrades) = ___________ Printing (inc. billing cards) = ___________ Postage = ___________ Insurance: Liability = ___________ Property = ___________ Directors & Officers (errors & omissions) = ___________ Contracted Services: Accounting = ___________ Auditing = ___________ Computer Services = ___________ Engineering = ___________ Legal = ___________ Uncollectable Accounts: ___/mo X 12 months = ___________

10
Board Costs: Stipends ___/mo X __ months = ___________ Meeting Expenses = ___________ Travel (at same rate as Training & Travel above) = __________ TOTAL NON-LABOR – ADMINISTRATION & MANAGEMENT = ___________ Debt Retirement & Replacement Debt Service: Principal = ___________ Interest = ___________ Debt Service Reserve: (10% of annual payment/year) = ___________ Equipment Replacement: Treatment Plant Equipment = ___________ Distribution System = ___________ Storage Tanks = ___________ Wells or Intake & Pumps = ___________ Office (computer, etc.) = __________
TOTAL DEBT & REPLACEMENT = ___________
TOTAL WATER SYSTEM EXPENDITURES = ____________
The Rate Study Process To see if your system will need a rate increase, the governing board needs to ask itself the following questions each year: How much additional revenue will have to be raised next year to cover the full cost of operating our water system? To answer this question, you will need to prepare an accurate budget for the next year. A budget is a financial plan for estimating as accurately as possible your total expenses and total revenues for the upcoming year. When you have completed the budget, compare revenues and expenses. A simple rule of thumb is as follows: If revenues are greater than expenses, your system probably doesn’t need a rate increase. If expenses exceed revenues, then it is probably time for a rate increase. Use the following formula to determine the total amount of additional revenue you need to raise through a rate increase: Total Estimated Expenses
- Total Estimated Revenues = Additional Revenue Needed
Once you decide a rate increase is necessary, ask the following important question: If we have to raise rates, how do we spread the increase fairly among all our customers?

11
While no one likes a rate increase, in MAP’s opinion and experience, customers are less likely to complain if they know the increased cost is being shared fairly among all customers. To make sure the cost of operating your system is being shared fairly, you need to know something about your customer’s water use history. Doing a good rate study takes some time and work. Your governing board may want to appoint a committee to work on this study. Be sure to include your city auditor and/or billing and collection clerk. Midwest Assistance Program also suggests having one or two customers participate on the committee. This will increase public involvement and can help build support for the rate adjustment. While it is not necessary to have a computer to do a good rate study, the computer and a spreadsheet program can make it easier. Collecting Information To determine how much water is used, answer the following question: How many customers use how much water in an average month? This information can be found in your Customer Billing Records or customer meter payment booklets. Since water usage during the year varies according to season, you will want to take this variation of usage into consideration. You can develop an accurate estimate of average monthly water usage with a sample of only four months. The general rule for selecting the months is: the highest use month, the lowest use month, and two medium usage months. If your system charges different rates for residential and commercial customers, you need to calculate “average monthly usage” for each current rate schedule. The city auditor or billing clerk can easily record the necessary information using copies of Chart #1 for each month, and record the usage of customers in groupings. To tally the “# of Customers” in each usage group, use the “tick and cross” method to complete Chart #1. In Chart #1, the usage level stopped at 15,000 gallons. Most small systems find that 10,000 or 15,000 gallons is an acceptable ending point for usage levels. Larger systems may need more levels, sometimes up to 20,000 gallons. Be sure to make copies of Chart #1. Use one copy for each of the four months selected.

12
CHART #1: CALCULATING AVERAGE MONTHLY WATER USAGE
For the Month of ___________ Water Usage for the Month in Gallons
# of Customers Using this Amount of Water
Total # of Customers in Usage Level
Under 1000 _______________________________ = ___________ 1001 – 2000 _______________________________ = ___________ 2001 – 3000 _______________________________ = ___________ 3001 – 4000 _______________________________ = ___________ 4001 – 5000 _______________________________ = ___________ 5001 – 6000 _______________________________ = ___________ 6001 – 7000 _______________________________ = ___________ 7001 – 8000 _______________________________ = ___________ 8001 – 9000 _______________________________ = ___________ 9001 – 10,000 _______________________________ = ___________ 10,001 – 11,000 _______________________________ = ___________ 11,001 – 12,000 _______________________________ = ___________ 12,001 – 13,000 _______________________________ = ___________ 13,001 – 14,000 _______________________________ = ___________ 14,001 – 15,000 _______________________________ = ___________ Over 15,000 _______________________________ = ___________ List actual usage for each customer over 15,000 _______ , ______ , ______ , ______ , ______ , ______ , ______ , ______ , ______ , ______ , ______ , ______ , ______ , _____ , ______ , ______ , ______ , ______ , ______. Note: In Chart #1 we stop our usage level at 15,000 gallons. Most small systems find that 15,000 is an acceptable ending point for usage levels. Larger systems will need more levels, sometimes up to over 20,000. The City Auditor will have the best understanding of how many high use customers you have and can usually decide how many usage levels need to be established for recording information. The general rule is that the last usage level (the over X gallons) should be approximately 2% of the customers. In this last category, you will need to record the number of customers and the actual number of gallons used by each customer. Analyzing Customer Usage When the usage from all customers has been recorded for each month in Chart #1, this information needs to be summarized to establish the General Customer Profile, which is Chart #2. If your system has separate rate schedules for residential and commercial customers, you will need to complete a separate Chart #2 for each one. Use the four months that you have selected to analyze in columns A, B, C and D.

13
Instructions for completing the entries in Chart #2 1. Columns A through D: Enter the number of customers counted on the
respective monthly sheets from Chart #1. 2. Column E: For each different usage level, add the numbers entered in
columns A through D and enter the total on the same line in Column E. 3. Column F: Divide each number in Column E by 4 and enter the answer on
the same line in Column F. After completing all the entries in Column F, add up the numbers in column F and enter the total at the bottom of the column.
4. Column G: For each usage level, divide the number in Column F by the total of Column F. Enter the answer in Column G.
5. Column H: The values shown in this column represent the midpoint of each usage level. Experience is that the midpoint is an accurate estimate for medium usage. For the last line (the over 15,000 gallons), enter the average usage of all these high usage customers. To calculate the average usage for these customers, add all the monthly usages recorded on the monthly sheets for these customers and divide by the total number of customers recorded. Enter in Column H next to *.
6. Column I: Multiply the number in each line in Column F by the amount in Column H (F x H = I) and enter the answer on the same line in Column I. After completing the entries in each line, add up the numbers in the column. Enter the total at the bottom of Column I.
7. Column J: Divide each number of entries in Column I by the total of Column I. Enter your answer on the same line in Column J.

14
CHART #2: GENERAL CUSTOMER PROFILE Number of Customers from Chart #1
High Use
Low Use
Month 3 Month 4 Total
Avg. # of Customers
Cust. % of Total
Avg. Use Average Total Water
Use
Use % of Total
Water use per month in gallons
A B C D E F G H I J Under 1000 500
1001-2000 1500
2001-3000 2500
3001-4000 3500
4001-5000 4500
5001-6000 5500
6001-7000 6500
7001-8000 7500
8001-9000 8500
9001-10,000 9500
10001-11,000 10500
11001-12,000 11500
12001-13,000 12500
13001-14,000 13500
14001-15,000 14500
Over 15,000 *____
* (Average use over 15,000 gallons) Total _______ Total ________ Total ______

15
Interpreting the Information The information in Chart #2 will provide you with important information about your customer’s water usage. For example, if you look at Column G, you will probably find that most of your customers, commonly 50% or more, have an average usage of less than 4,000 gallons of water each month.
What percent of your customers use an average of less than 4,000 gallons a month?
Answer: ________ [Look at Column G (Customer % of Total) for your answer.]
Next, look at Column J. You will probably find that these same customers use a small portion of the total water used for the entire system, commonly less than 11% of the total.
What percent of the total water used in your system, goes to customers using less than 4,000 gallons a month? Answer: _________ [Look at Column J (Use % of Total Water Use) for your answer]
Now look at the high usage customers; refer to the bottom of Column G. What percent of your customers are in your highest usage level? Beginning at the bottom of Column G (Customer % of Total), work your way up Column G, adding the percentages until you reach 10%. These will be your highest use customers. Now move across to Column J to determine what percent of all water is used by this small group (about 10% of users). Commonly, this group will use 25% or more of the water. Chart #2 helps explain why coming up with a satisfactory rate structure is so difficult. A large proportion of your customers use a small percentage of the water, and a small proportion of your customers use a large percentage of the water. Who benefits and who pays? Continue to study Chart #2. What else can you learn about your customer’s water usage? Notes: ________________________________________________________________
________________________________________________________________
________________________________________________________________
________________________________________________________________
________________________________________________________________
________________________________________________________________

16
Chapter IV: What To Do with Customer Water Usage Information
When you have to raise water rates, “equity” is the art of spreading unhappiness fairly among your customers. Often the governing board can’t entirely control the total cost of producing, treating, storing and distributing safe water to your customers. But you can – and should – make sure all customers are paying their fare share – not too much, not too little. Target Revenue is:
the amount each customer class pays stated as a percent of all water sold, or the fair share amount each customer pays of overall water costs.
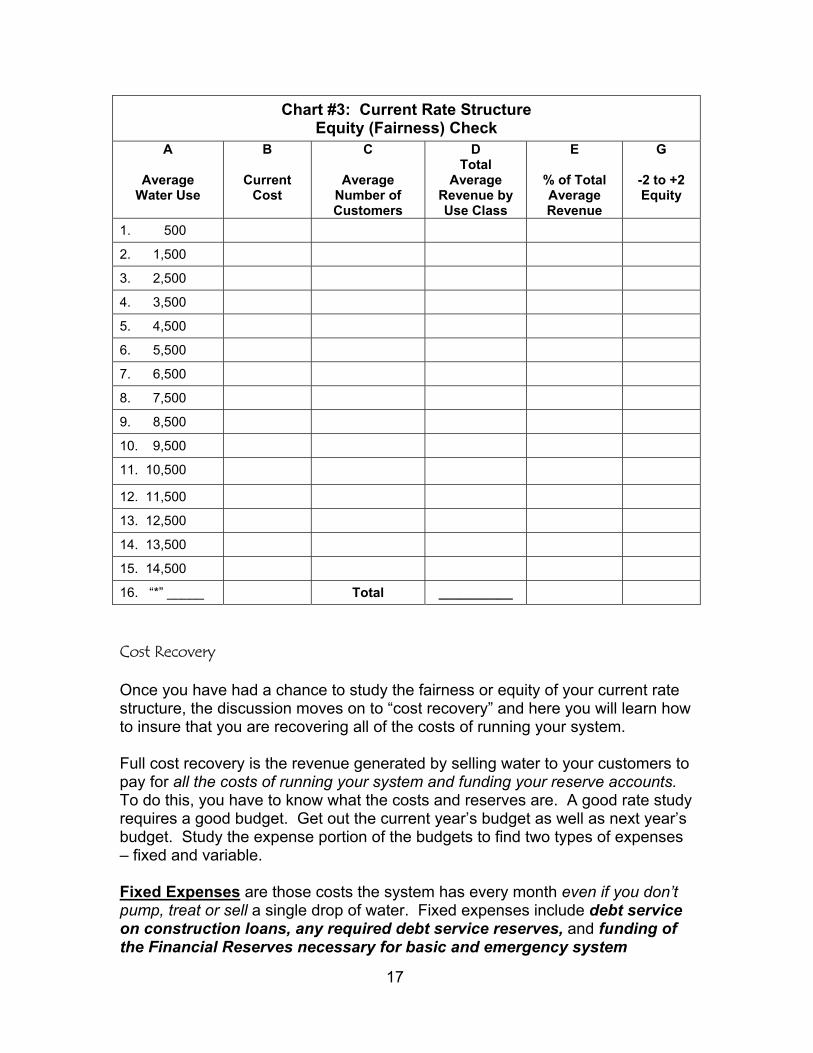
Chart #3 will allow you to calculate equity of your current rate structure. We will use some of the information you gathered in Chart #2 to see how fair your current rate structure is. Fill in Chart #3 by following the instructions below: 1. Column A: From Chart #2 Column H: Average Water Use. The numbers in
this column represent the average for each usage level. If you added usage levels above 15,000 gallons you will need to modify this column to match the usage levels used in Chart #2. Substitute the average use in your highest use category for the line marked with the “*”.
2. Column B: Current Cost. Have the City Auditor use your current rate structure to calculate how much you have charged a customer using each of the amounts of water listed in Column A.
3. Column C: Average Number of Customers in each usage level is taken from Chart #2, Column F.
4. Column D: Total Revenue by Use Class. Multiply the dollar amount in each line in Column B times the average number of customers in the same line in Column C, (B x C = D).
5. Column E: % of Total Average Revenue. Divide each line in Column D by the total of Column D and place your answer on the same line in Column E.
6. Column G: Subtract each line in Column E from the same line in Column F and place the answer in Column G. If your current rate structure spreads the cost of providing water equitably, the numbers in each line of Column G will be between –2% and +2%. If some of the numbers are larger or smaller than –2 to +2%, the customers in that user class are paying too much or not enough for their water.
How fair is your current rate structure? Which users pay too much? Who pays too little? If a lot of your user classes are being charged too much or too little you may want to consider changing the type of rate structure you use.
17
Chart #3: Current Rate Structure Equity (Fairness) Check
A
Average Water Use
B
Current Cost
C
Average Number of Customers
D Total
Average Revenue by Use Class
E
% of Total Average Revenue
G
-2 to +2 Equity
1. 500
2. 1,500
3. 2,500
4. 3,500
5. 4,500
6. 5,500
7. 6,500
8. 7,500
9. 8,500
10. 9,500
11. 10,500 12. 11,500
13. 12,500
14. 13,500
15. 14,500
16. “*” _____ Total __________ Cost Recovery Once you have had a chance to study the fairness or equity of your current rate structure, the discussion moves on to “cost recovery” and here you will learn how to insure that you are recovering all of the costs of running your system. Full cost recovery is the revenue generated by selling water to your customers to pay for all the costs of running your system and funding your reserve accounts. To do this, you have to know what the costs and reserves are. A good rate study requires a good budget. Get out the current year’s budget as well as next year’s budget. Study the expense portion of the budgets to find two types of expenses – fixed and variable. Fixed Expenses are those costs the system has every month even if you don’t pump, treat or sell a single drop of water. Fixed expenses include debt service on construction loans, any required debt service reserves, and funding of the Financial Reserves necessary for basic and emergency system
18
maintenance. We also recommend that fixed expenses include the cost to bill and collect for the utility (postage, billing cards, postage). Some experts also recommend that testing expenses and insurance be included in fixed costs. For this handbook, we are putting testing and insurance in with the variable expenses. When the terms “fixed expenses” and/or “fixed costs” are used in this handbook, they mean the same thing. Variable Expenses are those expenses that change from month to month depending on how much water you pump, treat, and sell. All costs of operating your utility, including salaries, chemicals, utilities, repairs, etc., are considered variable expenses. Chart #4 is provided to help you divide your budget into fixed and variable expenses. Chart #4 is provided to list our your budget expenses. Refer back to the Water System Expenses worksheet, which begins on page 6, to help you list our all of your fixed and variable expenses. Use the lines under Section II to list all of your variable expenses. Most of the money to pay for budgeted Fixed and Variable system expenses comes from selling water to your customers. How your system charges customers for water is set out in your Rate Structure. Your City Auditor uses your Rate Structure to calculate each customer’s monthly bill. Rate Structures are generally divided into two parts. • A Minimum Customer Charge or “Base Rate”. The minimum charge or
base rate is the amount a customer pays to have water available on demand. Systems often set the minimum charge to include the first 1,000 or 2,000 gallons of water used.
• A Flow Charge or “Cost per 1,000 Gallons”. The flow charge is based on the amount of water used by a customer.

19
Chart #4: Allocation of Budget Expenses
I. Fixed Expenses (Fixed Costs) Annual Monthly (Annual / 12) Debt Service (outstanding loans) 1. _______________________________
_ 2. _______________________________
_ Debt Service Reserve 1. _______________________________
_ 2. _______________________________
_ Financial Reserves 1. Capital Equipment/Plant Reserve 2. Operation & Maintenance Reserve Billing & Collecting Expenses Total Fixed Expenses
$ _____________ _____________ _____________ _____________ _____________ _____________ _____________ $ _____________
$ ___________ ___________ ___________ ___________ ___________ ___________ ___________ $ ___________
II. Variable Expenses Annual Monthly (Annual / 12) 1.
2.
3.
4.
5.
6.
7.
8.
9.
10.
11.

20
Chapter V: Setting the Base Rate Structure In the last chapter, you separated next year’s budget into Fixed Expenses and Variable Expenses in Chart #4. Now it is time to determine how the fixed and variable costs can be spread fairly among your customers. You will start by determining how much each customer needs to pay toward your system’s fixed costs. To do this, divide the Monthly Fixed Expenses (from Chart #4) by the Total Number of Customers (Chart #2, Column F) to get the Monthly Fixed Costs per customer. $ ________ divided by ________ = $ ____________ Monthly Total # of Fixed costs per fixed costs customers customer The Fixed Costs per customer represents each customer’s fair share of the cost of financing construction and ongoing capital expenses of your water system. Now it is time to determine the average amount your system will need to charge per 1,000 gallons of water to recover your Variable Expenses. First, determine the Total Average Water Use (Chart #2, Column I total). Divide the Total Average Water use by 1,000. Next, determine the Total Monthly Variable Expenses from Chart #4. Divide the Total Monthly Variable Expenses by the Total Average Water Use to determine the Variable Cost per Thousand Gallons. $ _________ divide by ___________ = $ ___________ Total monthly Total average Variable cost variable water use per 1,000 expenses (divide by 1000) gallons Your Variable Expenses, or cost per 1,000 gallons, represents your system’s average cost of producing 1,000 gallons of water. Note: ** If your system includes 1,000 or 2,000 gallons of water in the base rate, this handbook highly recommends that your base rate include the cost of this water. The reason for including the cost of the water in the base rate is that there is operation and maintenance costs to produce the first 1,000 gallons just as there is to produce the seventh thousand gallons used. Or, increase the cost per 1,000 gallons slightly to cover these gallons of water included in the base rate. Now you will use the Monthly Fixed Cost per Customer and the Variable Cost per 1,000 Gallons to develop a basic rate structure.

21
Setting the Base Rate The basic rule is: Try to recover all of your system’s Fixed Costs in the Minimum Customer Charge or Base Rate portion of the rate schedule. The Fixed cost per customer that you calculated earlier represents each customer’s fair (equal) share of having water available whenever they want it. If your base rate includes a minimum amount of water, (example 1,000 gallons) you need to include the cost in the Minimum customer charge. You do this by multiplying your Variable Cost per Thousand Gallons by the number of units of water included in the minimum. (1 unit = 1,000 gallons). $ ________ + ($ _____ X ______) = $ __________ Fixed cost Variable cost Minimum per per 1000 X # customer customer of 1000 gallons charge included in minimum Setting the Flow Charge (cost per 1,000 gallons) The basic rule is: Try to recover your Variable Expenses in the Flow Charge portion of the rate schedule. It is recommended that small systems begin with a Flow Charge based on the Variable Cost per 1,000 gallons. This allows you to build a rate structure that divides costs fairly among customers regardless of the amount of water used. Once the base Flow Charge is calculated, and you have had a chance to study the overall rate structure, you may wish to modify it in response to local conditions and considerations. Instructions for completing Chart #5: 1. Column A: From Chart #2. Use the same number of usage level in this chart
as you used in Chart #2. 2. Column B: Average # of Customers in each Usage Level is taken from Chart
#2, Column F. 3. Column C: Average Usage (expressed by 1,000 gallon units) is the same as
the Average Use in Chart #2, Column H, divided by 1,000. Thus, 500 gallons average use becomes .5 and 1,500 becomes 1.5.
4. Column D: Revenue from Minimum Customer Charges. Write in the
Minimum Customer Charge (or base rate) you calculated above: $ _____ . Multiply each number in Column B above by your Minimum Customer Charge

22
and enter your answer on the same line in Column D. Add up the numbers in Column D and enter your total at the bottom of the column.
5. Column E: Variable Charge per 1000 gallons. Write in the Variable Cost
per 1,000 Gallons you calculated earlier on page20: $ _____ . Next multiply this dollar value times the number of units of water (1 unit = 1000 gallons) include in your Minimum Customer Charge and write your answer here: $_____ .
Now multiply each number in Column B of the chart by your Variable Charge per 1,000 Gallons, subtract the dollar amount for water included in your Base Rate and enter your answer on the same line in Column E. When finished, add the numbers in Column E and enter your total at the bottom of the column. 6. Add the Total from columns D and E and enter your answer here: $ _______ .
This is the estimated total revenue your new rate structure will produce. Check it against your Expense Budget for next year.
This rate structure should produce enough revenue to cover budgeted expenses. If you are unsure that your Budgeted Expenses are accurate, you may want to increase the expenses you estimated in your budget by 5-7% and refigure your Fixed and Variable costs to provide a small “revenue cushion” for your system. Or, if your system does have a five year Capital Improvement Plan, use the capital expenditure projections in your Fixed Costs in the previous charts. The Rate Structure we just completed is considered a Single Block Rate. In this type of rate structure, the fixed costs are divided evenly among all the customers. The cost of water to the customer is in direct proportion to the amount used.

23
Chart #5: Calculating a Basic Flow Charge
A Water Usage/
Month in Gallons
B Average
# of Customers
C Average Usage
(in 1000 gallon units)
D Revenue from
Minimum Customer Charges
E Revenue from
Variable Charges Per 1000 gallons
0 - 1000 .5 1001 – 2000 1.5 2001 – 3000 2.5 3001 – 4000 3.5 4001 – 5000 4.5 5001 – 6000 5.5 6001 – 7000 6.5 7001 – 8000 7.5 8001 – 9000 8.5
9001 – 10,000 9.5 10,001 – 11,000 10.5 11,001 – 12,000 11.5 12,001 – 13,000 12.5 13,001 – 14,000 13.5 14,001 – 15,000 14.5
Over 15,000 * ______ • Average use over 15,000 gallon units Total $ ________ Total $ ________ Modifying the Single Block Rate Structure The primary purposes of a rate study is to insure that rates are set high enough to cover both fixed and variable expenses and to ensure the costs are spread fairly among the system’s customers. However, local conditions sometimes require that other factors be considered in the rate making process. Listed below are examples of local consideration that may require modification of the Single Block Rate Structure. 1. Limits on the amount of water available to the system may require a rate
structure that encourages conservation and charges a premium for wasting water or high water usage.
2. Limited treatment and water storage capacity of the system might necessitate
a rate structure that encourages conservation.
24
3. A community whose wastewater treatment facility is at, or very near, capacity may choose to modify the water rate structure to discourage water use in order to avoid the expense of expanding its wastewater facilities.
4. If your system was financed using Revenue Bonds, there may be certain
bond requirements (covenants) that must be met. 5. Some systems want to minimize the cost to low-income/elderly/fixed income
customers by shifting a greater portion of the cost to larger users. 6. Some systems want to minimize the cost to larger commercial/industrial
customers in order to attract new businesses to your community and choose to shift a greater portion of the cost to residential customers.
If your system has more than two classes of customers, or if you have larger commercial or industrial users who are to be given special consideration in water rates, it is recommended that you consider seeking qualified outside guidance to modify the Single Block Rate Structure.

25
Chapter VI: Raising Rates - How You Do It Makes A Difference!
Remember how you felt a couple of years ago when you went to the local gas station to get gasoline for your vehicle and the price had gone up 25 percent? Didn’t that shock make you mad? Did you feel ripped off? Like you were being taken advantage of? Did the explanations that came after the price hike sound more like excuses than good reasons? The lesson for small community water system governing boards is don’t surprise your customers with a water rate increase. The customers will get mad! They will complain. Explanations after you have already raised the price are likely to sound like excuses. And, you will have lost support you could have had if you would have educated customers beforehand. The decision to raise rates is never an easy one. In the last five chapters, this handbook have taken you through the steps of developing an equitable (fair) rate structure that will cover the full costs of operating your community water system. Now, some ideas for gaining customer support for needed increases are given. Do Your Homework Prepare customers well in advance to any rate adjustment. No surprises. Getting ready for a rate increase starts with the governing board doing its homework. Doing your homework means honestly assessing the physical and financial conditions of your water system. If you haven’t toured your complete water system in the last six months, do it now. If your entire board has not toured the system in over a year – set a date for next week! Review each part of the system with your operator: how it works, what preventative maintenance is being done to keep it in good shape, and when it will need to be replaced. Make a list of both the good and bad parts of the system operation. Carefully identify any system improvements you plan to make and pay for with a rate increase. Be ready to explain why this is necessary. Look at the last inspection report from the State Health Department to see that all recommended and necessary improvements have been made or are included on your list. Review next year’s budget. Identify exactly what costs are going up. For example, if the cost of electricity and chemicals used in the plant have gone up, let your customers know. The customers will understand that you have no choice but to pass these costs along to those who use the water. You will know that you have done your homework when you can answer the one question that is most important to your customers, “Why do we need a rate increase?” It is easier for customers to support a rate increase if they know specifically what the money will be spent on.

26
Streamline Your Operation Before your board increases the water rates, be sure you have done everything possible to cut back on expenses. Be sure your system is being well managed. Don’t ask customers to pay for inefficiency and waste. Be prepared to point to cost-saving measures you have already put into place to ensure customers that the system is being run efficiently. Below is a list of some questions to ask:
• Have you minimized your system’s water loss? Have you found and repaired all leaks?
• Do all customers have meters? • Are all meters in working order? When was the last time meters were
calibrated or checked? • Is your collections policy strictly enforced? • Have you increased fees and service charges to reflect annual cost of
performing the service? (i.e. – reconnect charges, hook-up fees, etc.) • Do you enforce penalties for people who cheat the system? • Are you earning the highest possible interest on your utility’s bank
account? • Are you purchasing chemicals or supplies in quantity, or is it possible
to share the cost of purchase of these items with a nearby system to get volume breaks?
• Do you have good internal financial controls to eliminate errors and fraud?
Streamlining your operations and related financial management issues are discussed in a companion handbook. Please refer to this companion handbook for more information. Educating Your Customers Your program to educate customers should include three points: 1. The proposed increase will ensure the system can comply with new
regulations to protect the health and welfare of the community.
Safe drinking water has both a personal and community impact. Clean water affects the community because it means growth and economic development can take place. Businesses will not locate where they can’t be assured of clean water for their employees, manufacturing or processing needs. The Environmental Protection Agency (EPA) continuously updates the list of harmful contaminants and the North Dakota State Health Department sets regulations to keep our drinking water safe and to protect our environment. As the list of contaminants harmful to humans and regulations to protect our

27
water supplies expand, so will the cost of treating water. Additional money will be needed to pay for the new technologies to keep your system in compliance.
2. The rate structure you have developed is as equitable and fair as possible – in other words, each class of customers is paying its fair share of the costs.
Customers who understand the rate structure and believe that it is equitable to all classes of customers – or that all customers are treated equally – are more willing to support the needed increase. The board needs to stress how the proposed rate structure is as fair and equitable as possible. No rate structure is going to be 100% fair to all customers because each community has different priorities. Your board might want to encourage industry or agricultural processors by setting lower commercial rates. Or your community may want to protect fixed income residents by setting their rates lower. Whatever principal you have followed in setting the rate structure, make sure you can explain it to the public. Post the rate structure, and be sure people understand it.
3. The rate increase is needed to cover the full cost of producing, treating, storing and distributing water to the customers.
Explain to your customers that the system must be self-supporting and that revenue from the sale of water must cover the full cost of producing, treating, storing and distributing water to all customers. Utilities are enterprise funds. They must be self-sufficient. In order to pay for itself, your water system must rely on user fees (the amount you charge your customers). As a member of the governing board, you are responsible for keeping the public informed about the financial condition of your system and what it costs to provide safe, dependable water. Invite the public to take part in the budget-making process, and once it is complete, don’t keep it a secret. Remember, no surprises. Customer education should be an ongoing part of your water system’s operation. Your system belongs to the customers. As a governing board member, and as the board as a whole, you work for them. One of the best times for educating customers is while you are developing the annual budget. Let the public know when you are working on budgets. Post special notices inviting them to attend budget meetings. Let the residents of the community know that you have nothing to hide. The more your customers know about what it takes to provide the safe drinking water they take for granted, the more likely they will be to support a rate increase.

28
Getting the Word Out
As soon as you know a rate increase in coming, start getting the word out. Primary responsibility for obtaining customer support for a rate increase belongs to the governing board. To be effective each member of the governing board needs to understand the operation and needs of the system in order to communicate effectively. Make sure your operator and City Auditor understand the need for the rate increase. Let them know that you expect their support. But remember, you as the governing board are the people responsible to educate the customers. This isn’t a job you leave to city employees. Think about your community and how best to get the word out. Divide up the responsibility among the governing board members. Think about the following:
• How can we use any local newspaper or radio coverage to help? • What civic, business or church groups need to be informed? • Would support of key community leaders help? • Can you send information home with school age children? • Does your monthly billing process allow for additional information? Or
should the board do a separate mailing to all customers? • What other ways can you use to provide customers with information
supporting the need for a rate increase? Finally we want to suggest three basic rate increase strategies for your consideration: Small increases are better than large increases: This goes without saying. Small is better. Don’t wait until your system is in such deep financial trouble or when a major repair is at hand to start thinking about a rate increase. Scheduled small increases are even better: Decide now to review your water rates every year as part of your annual budget process. Small annual increases are less painful for customers to absorb than large increases every three or four years. Scheduled increases that don’t happen are best of all! Once you get in the habit of reviewing rates each year you may find that some years it won’t be necessary to raise the rates at all. Let your customers know when you don’t have to raise rates. When a rate increase is necessary don’t be afraid to do the right thing. Customers are willing to pay a fair price for an uninterrupted supply of safe

29
quality drinking water they can depend upon. You were elected to make the tough decisions.