Embed Size (px)
Citation preview

North Central London
Sustainability and Transformation Plan – Case for ChangeSeptember 2016
North Central London Sustainability and
Transformation Plan

Sustainability and Transformation Plan2
3
ContentsNorth Central London
Sustainability and Transformation Plan
Foreword ................................................................................................................. 4
Executive summary ................................................................................................. 6
Context..... ............................................................................................................. 10
Health and wellbeing ..................................................................................................... 123.1. People in NCL are living longer but in poor health ............................................................ 12
3.2. There are different ethnic groups with differing health needs .......................................... 13
3.3. There is widespread deprivation and inequalities .............................................................. 13
3.4. There is significant movement into and out of NCL .......................................................... 14
3.5. There are high levels of homelessness and households in temporary housing .................. 15
3.6. Lifestyle choices put local people at risk of poor health and early death ........................... 16
3.7. There are poor indicators of health for children ............................................................... 17
3.8. There are high rates of mental illness amongst adults and children................................... 18
3.9. There are differing levels of health and social care needs .................................................. 19
Care and quality .................................................................................................... 224.1. There is not enough focus on prevention ........................................................................ 22
4.2. Disease and illness could be detected and managed much earlier .................................... 23
4.3. There are challenges in provision of primary care in some areas ....................................... 23
4.4. Lack of integrated care and support for those with a long term condition ........................ 24
4.5. Many people are in hospital beds who could be cared for closer to home ........................ 26
4.6. Hospitals are finding it difficult to meet increasingly demanding emergency standards ..... 28
4.7. There are differences in the way planned care is delivered ................................................ 30
4.8. There are challenges in mental health provision ............................................................... 32
4.9. There are challenges delivering services for people with learning difficulties ..................... 34
4.10.There are challenges in the provision of cancer care ........................................................ 364.11. There are workforce challenges ..................................................................................... 38
4.12. Some buildings are not fit for purpose ........................................................................... 42
4.13. Information technology needs to better support integrated care .................................... 42
Financial challenge ................................................................................................ 44
Next steps .............................................................................................................. 45
Appendix 1: data segmentation methodology .................................................. 47
Endnotes ............................................................................................................... 48
2
3
4
5
6
1

Sustainability and Transformation Plan4
Foreword
On behalf of all our health and social care partners in North Central London, we present our Case for Change, which tells the story of where we are now. It is important that we recognise our current situation, because we take pride in the services we provide, and it will help us understand where services need to be improved.
We know that there are differences across North Central London; waiting times for services and health outcomes vary, and the quality of care and patient experience of health and social services is sometimes not as good as it could be. This Case for Change is the first step in understanding what is not working so well, and where improvements can be made.
Local doctors, nurses and care workers are committed to working together to ensure we continue to improve. Never before has there been this opportunity to work so closely together to address the most important issues; to plan and deliver health and care for local people, with a strong focus on keeping people well.
In this document we describe the changing health and care needs of local people, and the key issues facing health and care services in North Central London. This document does not contain solutions but will be used to guide our understanding of where we need to transform local services over the next five years. We will work together to address the issues raised and to make sure we are able to provide high value and quality services to all.
We have come together as the North Central London STP Clinical Cabinet – a group of senior doctors, nurses and care professionals to work together to improve care and quality and make local services better. We believe that every person in North Central London should receive the same high quality standard of care. We recognise that we will need to work with all local partners, patients, carers and professionals to achieve this.
Signed by
Dr Richard Jennings, Co-Chair North Central London STP Clinical Cabinet (and Medical Director, Whittington Hospital NHS Trust)
Dr Jo Sauvage, Co-Chair North Central London STP Clinical Cabinet (and Chair, Islington CCG)
5
On behalf of the North Central London Clinical Board:
Dr Debbie Frost, Chair, Barnet CCG
Dr Caz Sayer, Chair, Camden CCG
Dr Mo Abedi, Chair, Enfield CCG
Dr Peter Christian, Chair, Haringey CCG
Dr Jonathan Bindman, Medical Director, BEH Mental Health NHS Trust
Dr Vincent Kirchner, Medical Director, Camden and Islington NHS Foundation Trust
Dr Joanne Medhurst, Medical Director, CLCH NHS Trust
Dr Alex Lewis, Medical Director, CNWL NHS Foundation Trust
Dr Cathy Cale, Medical Director, NMUH NHS Trust
Dr Stephen Powis, Medical Director, Royal Free NHS Foundation Trust
Dr Geoff Bellinghan, Medical Director, UCLH NHS Foundation Trust
Dr Matthew Shaw, Medical Director, Royal National Orthopaedic Hospital NHS Trust
Flo Panel Coates, Chief Nurse, UCLH NHS Foundation Trust
Helen Donovan, Executive Nurse Lead, Barnet CCG
Clare Johnston, Director of Nursing and People, Camden and Islington NHS Foundation Trust
Dr Julie Billett, Director of Public Health, Camden and Islington Council
Ray James, Director of Adult Social Services, Enfield Council
Jon Abbey, Director of Adult and Children’s Services, Haringey Council
North Central London Sustainability and
Transformation Plan
Sustainability and Transformation Plan6
Executive summary
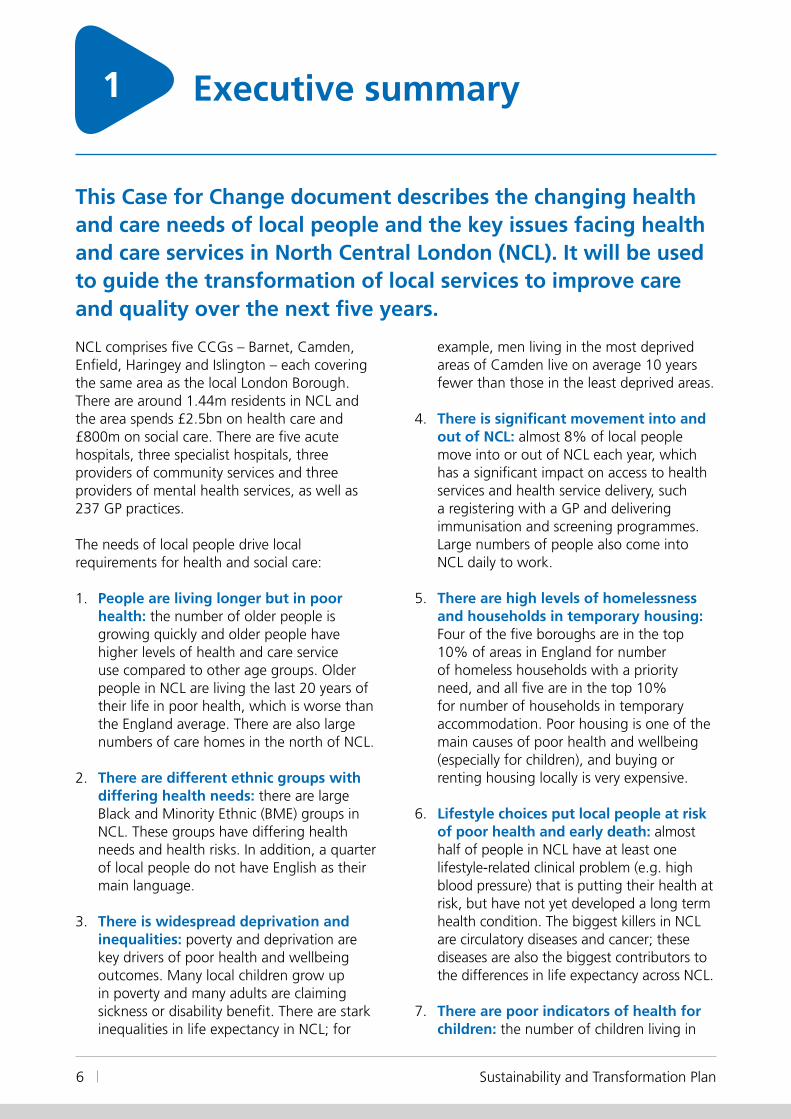
This Case for Change document describes the changing health and care needs of local people and the key issues facing health and care services in North Central London (NCL). It will be used to guide the transformation of local services to improve care and quality over the next five years.
NCL comprises five CCGs – Barnet, Camden, Enfield, Haringey and Islington – each covering the same area as the local London Borough. There are around 1.44m residents in NCL and the area spends £2.5bn on health care and £800m on social care. There are five acute hospitals, three specialist hospitals, three providers of community services and three providers of mental health services, as well as 237 GP practices.
The needs of local people drive local requirements for health and social care:
1. People are living longer but in poor health: the number of older people is growing quickly and older people have higher levels of health and care service use compared to other age groups. Older people in NCL are living the last 20 years of their life in poor health, which is worse than the England average. There are also large numbers of care homes in the north of NCL.
2. There are different ethnic groups with differing health needs: there are large Black and Minority Ethnic (BME) groups in NCL. These groups have differing health needs and health risks. In addition, a quarter of local people do not have English as their main language.
3. There is widespread deprivation and inequalities: poverty and deprivation are key drivers of poor health and wellbeing outcomes. Many local children grow up in poverty and many adults are claiming sickness or disability benefit. There are stark inequalities in life expectancy in NCL; for
example, men living in the most deprived areas of Camden live on average 10 years fewer than those in the least deprived areas.
4. There is significant movement into and out of NCL: almost 8% of local people move into or out of NCL each year, which has a significant impact on access to health services and health service delivery, such a registering with a GP and delivering immunisation and screening programmes. Large numbers of people also come into NCL daily to work.
5. There are high levels of homelessness and households in temporary housing: Four of the five boroughs are in the top 10% of areas in England for number of homeless households with a priority need, and all five are in the top 10% for number of households in temporary accommodation. Poor housing is one of the main causes of poor health and wellbeing (especially for children), and buying or renting housing locally is very expensive.
6. Lifestyle choices put local people at risk of poor health and early death: almost half of people in NCL have at least one lifestyle-related clinical problem (e.g. high blood pressure) that is putting their health at risk, but have not yet developed a long term health condition. The biggest killers in NCL are circulatory diseases and cancer; these diseases are also the biggest contributors to the differences in life expectancy across NCL.
7. There are poor indicators of health for children: the number of children living in
1

7Executive summary
poverty is high, particularly in Camden and Islington. Childhood obesity is high, whilst immunisation levels are low.
8. There are high rates of mental illness amongst both adults and children: rates of mental illness are high in Enfield, Haringey and Islington, and many mental health conditions go undiagnosed. For example, up to a third of people with dementia in Camden and Enfield are thought to be undiagnosed. People with mental health conditions are also more likely to have poor physical health.
9. There are differing levels of health and social care needs: the majority of people are largely healthy, but there is high use of health and social care by those with long term conditions, severe mental illness, learning disabilities and severe physical disabilities, dementia and cancer.
This suggests that the priority groups for focus are people with mental illness and people at risk of poor mental or physical health. It is also important to make sure high quality services are available when required for the majority of local people who are not high users of services. Consideration needs to be given to reducing health inequalities, the requirements of different ethnic groups and the significant movement of people into and out of NCL.
There are challenges in the delivery of care and quality:1. There is not enough focus on
prevention across the whole NCL system (including health, social care and the wider public sector): many people in NCL are healthy and well, but still at risk of developing long term health conditions. There is therefore an important opportunity for prevention of disease among these people. However, only 3% of health and social care funding is spent on public health in NCL. Between 2012 and 2014, around 20% (4,628) of deaths in NCL could have been prevented. In addition, the wider determinants of health such as poverty, housing and employment have a significant impact on individuals’ health and well-being. There are opportunities for greater integration across the NCL health and care
system to enable a focus on prevention and early intervention.
2. Disease and illness could be detected and managed much earlier: there are people in NCL who are unwell but do not know it. For example, there are thought to be around 20,000 people who do not know they have diabetes, while 13% of local people are thought to be living with hypertension. There are opportunities for better, more systematic management and control of long term health conditions in primary care, in line with evidence-based care standards.
3. There are challenges in primary care provision in some areas: there are low numbers of GPs per person in Barnet, Enfield and Haringey, and low numbers of registered practice nurses per person in all CCGs, but particularly in Camden and Haringey. Satisfaction levels and confidence in primary care is mixed across NCL. As referenced above, there are high levels of undiagnosed long term conditions in NCL. There are also high levels of A&E attendances across NCL compared to national and peer averages, and very high levels of first outpatient attendances, suggesting that there may be gaps in primary care provision.
4. Lack of integrated care and support for those with long term conditions: levels of non-elective admissions are similar in NCL to other areas of London. However, there are high levels of hospitalisation for the elderly and those with chronic conditions. Many people with long term health conditions – over 40% in Barnet, Haringey and Enfield – do not feel supported to manage their condition. The lack of available social care services in some parts of NCL may contribute to high levels of hospitalisation for some groups.
5. There are many people in hospital beds who could be cared for at home: the majority of people who stay for a long time in hospital beds are elderly. Staying longer than necessary in hospital is often harmful to health, and not what people want. Delayed discharges are high in some hospitals in NCL and hundreds of people

Sustainability and Transformation Plan8
could potentially be cared for closer to home or in their home. There is also a large number of people whose admission to hospital might have been avoided.
6. Hospitals are finding it difficult to meet increasingly demanding emergency standards: three of the five acute hospitals in NCL do not meet the 16-hour consultant presence standard at the weekend. Within A&E, there are shortages of middle grade doctors. Local hospitals are not meeting key quality standards for people admitted as emergencies.
7. There are differences in the way planned care is delivered: variation in the delivery of planned care may be because of the levels of patient need, or because of differences in clinical practice. The number of people seen as outpatients is high and there is variation in the number of referrals between consultants in the same hospital, the number of follow-up outpatient appointments and the proportion of planned care that is done as a day case.
8. Challenges in mental health provision: there is still a lot of stigma associated with having a mental illness, and many people either do not know how, or do not want, to access mental health services. Information on help and support within local communities is not available everywhere. Demand for mental health services has increased due to social pressures related to reduced funding for public services, increasing numbers of people, higher public expectations and changes to legislation. There are very high levels of mental illness in NCL, and high rates of early death, particularly in Haringey and Islington. Community based teams cannot manage people with the most serious issues and therefore high numbers of people are admitted to hospital – many under the Mental Health Act. Many people receive their first diagnosis of mental illness in Emergency Departments. There is variable access to liaison psychiatry, perinatal psychiatry and child and adolescent mental health services (CAMHS) within urgent care. There is also no high quality health-based place of safety in NCL.
9. Challenges in the provision of cancer care: there are many opportunities to save lives and deliver cancer services more efficiently. Late diagnosis of cancers is a particular issue, as is low levels of screening for cancer and low awareness of the symptoms of cancer in some groups of people. Waiting times to see a specialist and for diagnostics are long, with referrals to specialists having almost doubled in five years. There is a huge shortfall in diagnostic equipment and workforce, and a lack of services in the community, particularly at the weekend. A further issue is that some hospitals are seeing small numbers of patients with some types of cancer, in some cases less than two per week.
10. Workforce challenges: there are a number of workforce challenges in NCL. There is a significant shortfall predicted in GPs, nurses, allied healthcare professionals with an aging workforce and increasingly attractive career opportunities outside London. Many people are leaving the NHS entirely. There is a high vacancy and turnover rate locally in health and social care. The number of GPs and practice nurses per person in parts of NCL is low, especially Haringey.
11. Some buildings are not fit for purpose: many of the local buildings are old and not fit for purpose, although there have recently been a number of major developments locally. Good quality buildings that are fit for purpose reduce infection and the length of time people stay in hospital, make it easier for staff to do their jobs and are a more pleasant environment for people in hospital and reduce costs. It is estimated that 15% of NHS building space is not being used, incurring £20-25m a year in running costs. A large number of primary care buildings are also not fit for purpose – around 33% of GP premises in London need replacing.
12. Information technology needs to better support integrated care: the level of digital maturity of providers across NCL is variable, with most below the national average for digital capabilities, particularly their capability to share information with others. There is no NCL-wide governance structure or leadership team to implement

9Executive summary
digital transformation, and individual organisations continue to operate independently within their own areas with resultant fragmentation, lack of joined up information flows and duplication of effort.
13. Financial challenge: there is a substantial financial challenge facing health
organisations in NCL. Health commissioners and providers in NCL are already £121m in deficit in 2015/16 and, if nothing changes, will be £876m in deficit by 2020/21. This does not include the health budget impact of the local authority financial challenge, which has not been calculated.
In summary, this suggests the following areas for focus:
1. Health promotion, particularly focusing on those who are healthy and well but are at risk of developing long term health conditions.
2. Early detection and management of disease and illness, especially through more systematic management and control of long term health conditions in primary care.
3. The quality of primary care provision and the primary care workforce. It also suggests a focus on reducing variation between practices. This may reduce Emergency Department attendances, short stay admissions and first outpatient attendances.
4. Better integration of care for those with long-term conditions, and ensuring that suitable and sufficient social care is available. There also needs to be a focus on people in residential and nursing homes.
5. Reducing the length of stay and avoidable admissions in acute hospitals, in partnership with social care.
6. The delivery of emergency services in hospitals in NCL.
7. Understanding the differences between hospitals in the delivery of planned care in greater detail.
8. The provision of mental health services, particularly the physical health of those with a mental illness, early diagnosis and access to integrated services.
9. Recruiting and retaining the workforce, particularly where there are high vacancy and turnover rates or shortages in staff, and a focus on new roles and developing the existing workforce through new skills and ways of working, as well as adapting roles to changing requirements.
10. The cancer pathway across primary and acute providers.
11. Buildings that are old, expensive to run and not fit for purpose, and developing buildings that support patient and clinical needs.
12. Developing system-wide governance and leadership to support the implementation of integrated information sharing and technology.
13. Addressing the projected financial deficit.

Sustainability and Transformation Plan10
Context
North Central London (NCL) comprises five CCGs – Barnet, Camden, Enfield, Haringey and Islington – each coterminous with the local London Borough.
The number of people living in NCL is approximately 1.44 million, and the area has a £2.5 billion health budget and £800 million social care budget. There are four acute trusts: The Royal Free London NHS Foundation Trust (sites in scope including Barnet Hospital, Chase Farm hospital and the Royal Free Hospital in Hampstead), University College London Hospitals NHS Foundation Trust (sites in scope including University College Hospital1), North Middlesex University Hospital NHS Trust, and the Whittington Health NHS Trust. In addition, there are three single specialist hospitals: Moorfields Eye Hospital NHS Foundation Trust, Great Ormond Street Hospital for Children NHS Foundation Trust and the Royal National Orthopaedic Hospital NHS Trust.
Community services are provided by Central and North West London NHS Foundation Trust (St Pancras hospital site), the Whittington Health NHS Trust, and Central London Community Healthcare NHS Trust (sites in scope including
Edgeware community hospital and Finchley memorial hospital). Mental health services are provided by the Tavistock and Portman NHS Foundation Trust (sites in scope include the Tavistock clinic, the Portman clinic and Gloucester House day unit), Camden and Islington NHS Foundation Trust (sites in scope including Highgate Mental Health Centre and St Pancras Hospital), and Barnet, Enfield and Haringey Mental Health Trust (sites in scope including St Ann’s Hospital, Edgeware Community Hospital, Chase Farm Hospital, Barnet Hospital and St Michael’s Hospital).
In addition, there are 237 GP practices, and the out-of-hours services contract was recently awarded to the London Central and West Unscheduled Care Collaborative.
Some information about the local health and social care landscape is shown in Exhibit 1 overleaf.
1 UCLH also have a number of specialist hospitals including the Royal London Hospital for Integrated Medicine, the National Hospital for Neurology and Neurosurgery, the Royal National Throat, Nose and Ear Hospital, and the Eastman Dental Hospital
2

11Context
Enfield CCG / Enfield Council~320k GP registered pop~324k resident pop49 GP practices
Barnet CCG / Barnet Council~396k GP registered pop~375k resident pop62 GP practices
Haringey CCG / Haringey Council~296k GP registered pop ~267k resident pop45 GP practices
Islington CCG / Islington Council~233k GP registered pop~221k resident pop34 GP practices
Camden CCG / Camden Council~260k GP registered pop~235k resident pop35 GP practices
London Ambulance Service East of England Ambulance Service
Total health spend £2.5bn
Total care spend £800m
Primary care spend
£~180m
Spec. comm. spend
£~730m
NHS England
BEH Mental Health NHS Trust (main sites, incl Enfield community)
Camden and Islington NHS FT (and main sites) North Middlesex University Hospital NHS Trust The Royal Free London NHS FT University College London Hospitals NHS FT Whittington Health NHS Trust (incl Islington and
Haringey Community) Central and North West London NHS FT (Camden
Community) Central London Community Healthcare NHS Trust
(Barnet Community) Specialist providers
Other specialist providers out of scope: GOSH; MEH; TPFT; RNOH Note: registered pop data shows 2014 figures. Source:ONS
Exhibit 1 – NCL overview
Note: registered pop data shows 2014 figures. Source: ONS

Sustainability and Transformation Plan12
Health and wellbeing
3.1. People in NCL are living longer but in poor healthAs shown in Exhibit 2, older people (aged 65+) are the fastest growing group of people in NCL, although in total numbers1 this age group will remain the second smallest in 2020, after children aged 0-4 years old. Older people have much higher levels of health and care service use compared to other age groups, particularly hospital admissions and use of community services; the rates of most long-term health conditions also significantly rise with age2.
Exhibit 2 – Growth in numbers of people in NCL and England
12% 7%38
8
3
20
20 to 64
65 to 84
85+
5 to 19
3
27
11
12
16
8 0 to 4
NCL CCGs
Population‘000s
Growth%
England
Population‘000s
Growth%
2012 2020 2012 2020
Source: Population Projections Unit, Office for National Statistics, 2012. The data shows similar growth rates for 2016-2021
Whilst overall life expectancy is increasing for all NCL residents, people in NCL on average live the last 20 years of their lives in poor health; for Islington this is much worse than the rest of England3.
There are also large numbers of care home beds in the north of NCL; for example, Barnet and Enfield have 13% of London’s care home beds but have only 8% of its people4. This presents a substantial challenge to the health and care system, and an opportunity for improvements in quality and sustainability, which could lead to reductions in the cost of admissions to hospitals from care homes and improvements in the quality of life of residents.
3

13Health and wellbeing
3.2. There are different ethnic groups with differing health needs5 Levels of ethnic diversity vary across NCL, ranging from 32% of people in Islington from a Black and Minority Ethnic (BME) group to 42% in Enfield. The largest BME communities in NCL are Turkish, Irish, Polish and Asian (Indian and Bangladeshi) people. There are also high numbers of people from Black Caribbean and African communities, in particular in Haringey and Enfield. The number of people from BME communities is much greater in younger age groups.
Health needs vary across BME communities. For example, there is a greater risk of diabetes, stroke or renal disease for some BME people compared to White English people; and people from some BME communities, including Black Caribbean, African and Irish, use more hospital services6. The number of BME people across NCL is expected to increase slightly from 37% in 2012 to 38% in 20207. The biggest increases in BME communities are forecast in Barnet and Enfield. The fastest growing ethnic communities across NCL are the Chinese and Other group followed by Black Other and Asian ethnic groups.
The different health needs for different ethnic groups
“They know how to eat well but their husband complain if they don’t serve traditional food all the time” (Bangladeshi young women) [sic]
Source: Healthwatch Camden
Overall, around a quarter of people in NCL do not have English as their main language. This diversity presents challenges, both in addressing potentially new and complex health needs, and delivering accessible healthcare services.
What good looks like: Care planning for type 2 diabetes patients in Tower Hamlets
Tower Hamlets has a high prevalence of type 2 diabetes. This is partially due to the large Bangladeshi resident population, who are more susceptible to developing this condition. Since 2010, GPs have been providing patient centred care plans to patients which allow individuals to manage their own conditions and prevent the onset of other conditions. By 2014, diabetes patients on a care plan in Tower Hamlets had achieved the highest levels of blood pressure and cholesterol control in the country and had better control of their own condition.
Learning from local best practice examples is part of the NCL STP process. We have the opportunity to roll out successful care programmes such as care planning for diabetes patients across all the boroughs, to ensure every individual can access the high quality care they need.
Source: Tower Hamlets JSNA, 2015
3.3. There is widespread deprivation and inequalitiesThere is a wide spread of deprivation across NCL, but people tend to be younger and more deprived in the east and south, and older and more affluent in the west and north. Deprivation across NCL is shown in Exhibit 3.

Sustainability and Transformation Plan14
Exhibit 3 – Deprivation levels across NCL
Poverty and deprivation are key causes of poor health outcomes. Higher levels of deprivation are linked to many health problems, such as prevalence of long term health conditions. 30% of NCL children grow up in child poverty8, with 6% living in households where no-one works9. More than 40,000 working age adults in NCL are claiming sickness or disability related out-of-work benefits10, and the gap in the employment rate for those in contact with more specialised mental health services and the overall employment rate is 63%11. There are stark inequalities in life expectancy; for example, men in the most deprived areas of Camden live on average 10 years fewer than those in the least deprived areas12.
What good looks like: addressing the social determinants of health
The Mental Health Working service supports people with a long term mental health problem to make the journey back into work through training, education, employment or volunteering. It also supports those who are already in work, to help them remain in employment. Experienced advisors work with each individual to develop a personalised support plan identifying barriers to work, career goals and steps needed to find, remain in or return to work. The advisors then provide ongoing advice and guidance. The programme is jointly commissioned by the London Boroughs of Camden and Islington.
If replicated throughout NCL this could improve and maintain public mental health whilst increasing the levels of employment.
Source: mind.org.uk
3.4. There is significant movement into and out of NCL13
All boroughs in NCL experience significant population inflows and outflows. In 2014, on average 20,000 people moved into each of the NCL boroughs from other areas of England and Wales, whilst just under 23,000 moved out to other parts of the country. This is illustrated in Exhibit 4. Camden, Islington and Haringey experienced the highest population churn, with around 10% of people in these boroughs moving out in 2014. The pattern of people moving in and out is different across age groups. In Islington and Camden, more people aged 15 to 29 from other areas move in. For other all other age
Source: IMD 2015 by LSOA, ONS release
IMD 2015 - National Quintile 20% most deprived (219) (225) (156) (143) 20% least deprived (45)

15Health and wellbeing
groups, more people move out to other areas. However, in contrast, for all NCL boroughs there are more people from outside the UK moving in than leaving. This contributes to a demographic profile that has a high level of non-native inhabitants.
Large numbers of people also come into NCL every day to work. These people sometimes use health and social care services, particularly urgent care, whilst being registered with a GP outside NCL.
This high level of movement of people into and out of NCL has a significant impact on access to health services and health service delivery, such a registering with a GP and delivering immunisation and screening programmes.14
Exhibit 4 – Internal migration into and out of NCL
0
5000
10000
15000
20000
25000
30000
Enfield Haringey Islington
NNuumm
bbeerr oo
ff ppeeoo
ppllee
In Out
Barnet Camden
Source: ONS mid-year population estimates, 2014
3.5. There are high levels of homelessness and households in temporary housing There is a growing demand for housing in NCL, and increasing levels of homeless households15. People and families who are homeless or in temporary housing require support from numerous local public services. Housing is often one of the main causes of poor health and wellbeing, especially for children, and buying or renting housing locally is very expensive.
Homelessness and temporary housing
‘I became homeless and had a nervous breakdown. My family is a single parent family. I got a place at University, but I became home sick and wanted to come home to London. When I came back I went to my GP who diagnosed me. Finding accommodation was really hard on a low income. I couldn’t afford a deposit and I was street homeless for a while. I was diagnosed in the London Borough of Barnet and went through IAPT [Improving Access to Psychological Therapies]. I had no family or friends and no help from anyone. I felt lost. As I am under 35 I was not eligible for single accommodation and had to take shared accommodation. I then went to a homeless charity, but they did not have the expertise to understand what I needed.
Source: Healthwatch Islington
All of the NCL boroughs except Camden are in the top 10% of areas in England for homeless

Sustainability and Transformation Plan16
households with a priority need, and all are in the top 10% for households in temporary accommodation (Barnet, Enfield and Haringey are in the top 3%)16. This is shown in Exhibit 5.
Exhibit 5 – Homeless acceptances and households accommodated by authority per 1,000 households 5
Source: www.gov.uk/government/statistical-data-sets/live-tables-on-homelessness
4.68
0.63
4.796.03
3.972.4
5.1
19.05
4.8
21.84
27.51
9.11
2.58
14.04
0
5
10
15
20
25
30
Barnet Camden Enfield Haringey Islington England London
Number accepted as homeless per 1,000 households
30 Rank (out of 326) - homeless acceptances per 1,000 households
Number accommodated by authority per 1,000 households
30 Rank (out of 326) - number accommodated by
authority per 1,000 households
30
270
2613
43
9
21
2
5
34
What good looks like: integrated care for the homeless
Central London Community Healthcare (CLCH) provides services to homeless people from Great Chapel Street Medical Centre. A fully integrated model, delivered using a multidisciplinary team which includes primary care, social care and mental health practitioners delivers services including dentistry, vaccinations and mental health support. The services have been designed around the needs of the homeless population. A case management approach is taken for patients with multiple, complex needs. Outreach clinics for people who are harder to engage, phased in two parts, also operate from the medical centre: a nurse led targeted outreach clinic and a winter enhanced outreach service offers which provides health assessments and advice at Cold Weather Shelters. The outreach teams also work with acute providers to train staff in the areas of health and social care entitlements for the homeless.
This service could be scaled up as part of the NCL STP process, to ensure the homeless population are better supported by our health and care services.
Source: Great Chapel Street Medical Centre website, accessed August 2016
3.6. Lifestyle choices put local people at risk of poor health and early deathLifestyle behaviours such as smoking, alcohol consumption, physical inactivity, poor diet and being overweight cause poor health, worsening of disease, multiple illnesses and early death . Almost half of people in NCL have at least one lifestyle-related clinical problem (e.g. high blood pressure) that is putting their health at risk, but have not yet developed a long term health condition18.

17Health and wellbeing
Risk factors among different age groups
“Older women smoke but won’t admit to it!”
Source: Healthwatch Camden
Within NCL, the number of overweight children aged 10 to 11 years is much higher than the England average in three of the five boroughs – Enfield, Haringey and Islington19. It is likely that being overweight is partly responsible for more than a third of all long term health conditions in NCL20. Smoking cuts lives short and is partly responsible for around one in six early deaths of local people21. Alcohol-related hospital stays are much higher than average in Islington22. Among older people, Camden, Haringey and Islington have much higher numbers of people who fall resulting in serious injury23. Importantly, lifestyle and clinical risk factors tend to cluster in the same individuals and groups of people.
As shown in Exhibit 6, the biggest killers in NCL are circulatory diseases and cancer; these diseases are also the biggest contributors to the differences in life expectancy across NCL.
Exhibit 6 – Breakdown of male and female life expectancy gap by cause of death
35% 33% 32%24% 22%
28%23%
13%24% 27%
10%16%
19%22%
14%
6%5%
8%
7%
4%
7% 9%10%
8%
6%
6% 5%26%
4%
10%
6% 9%
6%
9%
16%9%
2%
0%
10%
20%
30%
40%
50%
60%
70%
80%
90%
100%
Barnet Enfield Haringey Camden Islington
Source: LHO segment tool, May 2016
Breakdown of the life expectancy gap between the most deprived quintile and least deprived quintile within each borough, by percentage cause of death, 2012-2014
Male Female
23%
41% 42%
23%32%
26%
16%
0%
25%15%
9%
12%
26%22%
3%
7%
4%14%
4%
6%
5%
16%
2%
5%
2%
2%
7% 2%
25%
14%13%
12%22% 6%
0%6%
0%10%
Barnet Enfield Haringey Camden Islington
<28 Days
Other
Mental and behaviouralExternalcausesDigestive
Respiratory
Cancer
Circulatorydisease
3.7. There are poor indicators of health for children Supporting children to have the best start in life is very important to their future health and life opportunities. However, a third of children in NCL do not reach a good level of development by age 524, and there are numerous opportunities to improve the health and wellbeing of children during these important early years.
Sustainability and Transformation Plan18
Exhibit 7 – Childhood prevention indicators
IndicatorBarnet CCG
Camden CCG
EnfieldCCG
HaringeyCCG
IslingtonCCG
England Average
London Average
19.9
32.6
80
74
20.3
34.3
86
80
23.4
41.4
89
86
22.9
37.1
87
84
22.1
38.1
94
90
21.9
33.2
92
92
22.2
37.2
87
81
15.8
2.5
85.1
2.6
27.6
2.9
90.5
4.1
25.5
2.7
86.7
4.6
24.4
3.1
90.9
3.4
32.4
3.5
88.2
2.3
18.6
2.9
74.3
4.0
21.8
3.2
86.1
3.8
Source: PHE 2015, HSCIC 2015. 1: Public Health Outcomes Framework Data Tool, Public Health England
Excess weight in 4-5 year olds (2014-15)
Excess weight in 10-11 year olds (2014-15)
Vaccination coverage MMR (2 yrs) (2014-15)
Vaccination coverage MMR (5 yrs) (2014-15)
Children in poverty (2013)1
Low birth weight at full term, % (2014)1
Breastfeeding initiation at 48hrs, % (2014-15)1
Infant mortality rate, per 1000 live births (2011-13)1
Better than England average
Worse than England average
Not significantly different than
England average
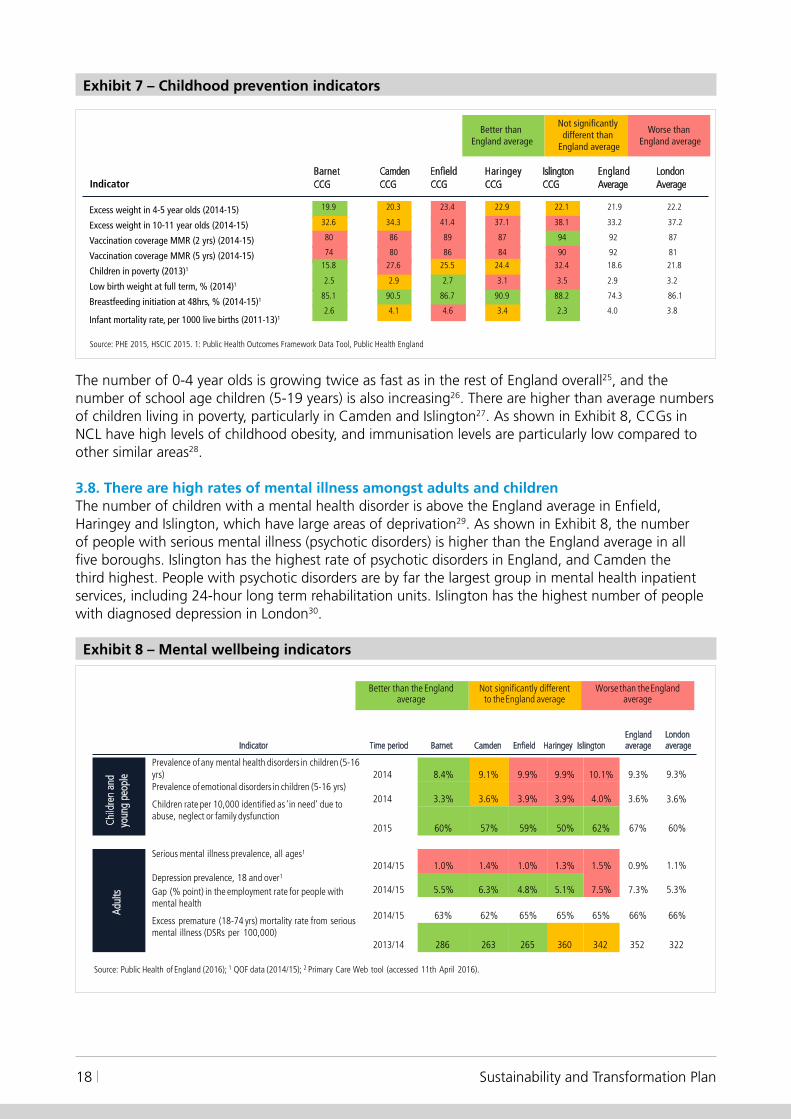
The number of 0-4 year olds is growing twice as fast as in the rest of England overall25, and the number of school age children (5-19 years) is also increasing26. There are higher than average numbers of children living in poverty, particularly in Camden and Islington27. As shown in Exhibit 8, CCGs in NCL have high levels of childhood obesity, and immunisation levels are particularly low compared to other similar areas28.
3.8. There are high rates of mental illness amongst adults and childrenThe number of children with a mental health disorder is above the England average in Enfield, Haringey and Islington, which have large areas of deprivation29. As shown in Exhibit 8, the number of people with serious mental illness (psychotic disorders) is higher than the England average in all five boroughs. Islington has the highest rate of psychotic disorders in England, and Camden the third highest. People with psychotic disorders are by far the largest group in mental health inpatient services, including 24-hour long term rehabilitation units. Islington has the highest number of people with diagnosed depression in London30.
Exhibit 8 – Mental wellbeing indicators
Source: Public Health of England (2016); 1 QOF data (2014/15); 2 Primary Care Web tool (accessed 11th April 2016).
Time period Barnet Camden Enfield Haringey IslingtonEngland average
London average
Child
ren
and
y oun
g pe
ople 2014 8.4% 9.1% 9.9% 9.9% 10.1% 9.3% 9.3%
2014 3.3% 3.6% 3.9% 3.9% 4.0% 3.6% 3.6%
2015 60% 57% 59% 50% 62% 67% 60%
Adul
ts
2014/15 1.0% 1.4% 1.0% 1.3% 1.5% 0.9% 1.1%
2014/15 5.5% 6.3% 4.8% 5.1% 7.5% 7.3% 5.3%
2014/15 63% 62% 65% 65% 65% 66% 66%
Indicator
Prevalence of any mental health disorders in children (5-16 yrs)Prevalence of emotional disorders in children (5-16 yrs)
Children rate per 10,000 identified as 'in need' due to abuse, neglect or family dysfunction
Serious mental illness prevalence, all ages1
Depression prevalence, 18 and over1
Gap (% point) in the employment rate for people with mental health
Excess premature (18-74 yrs) mortality rate from serious mental illness (DSRs per 100,000)
2013/14 286 263 265 360 342 352 322
Worse than the England average
Not significantly different to the England average
Better than the England average

19Health and wellbeing
People with mental health conditions are more likely to have a lifestyle that may lead to poor physical health. For example, almost half of adults with severe mental illness are smokers, compared to less than a quarter of people without a severe mental illness31. It is well established that people with a mental illness often also have poor physical health. There is also a high rate of psychoactive substance use in people with mental illnesses.
The number of people with undiagnosed dementia is higher than the London average in two of the five boroughs. As shown in Exhibit 9, nearly a third of people with dementia across NCL are thought to be undiagnosed, with a particularly high proportion in Camden and Enfield32. Even where diagnosis rates are higher, as in Barnet, Haringey and Islington CCGs, there are thought to be many more people remaining undiagnosed33. This indicates that there is a need to increase detection of dementia in primary care, focusing on practices with relatively low diagnosis rates and those with a significant challenge due to a large list size. Diagnosed mental health conditions, particularly dementia, are likely to increase, due to an ageing population and increased identification of dementia sufferers.
Dementia care
Jenny, 93, has dementia and a mental health condition. Her daughter telephoned to say she is finding it very difficult as her carers service was stopped three weeks ago. Haringey Council have asked her mother to go in to see them, but her mother doesn’t comprehend what is going on and the daughter doesn’t have a wheelchair. There is also a need for respite.
Source: Healthwatch Haringey
Exhibit 9 – Dementia indicators, April 2016
Source: NHS England Dementia Diagnosis Monthly Workbook
2877
1171
1913
117510601086
637
1084
394163
0
500
1000
1500
2000
2500
3000
3500
NHS Barnet CCG NHS Camden CCG NHS Enfield CCG NHS Haringey CCG NHS Islington CCG
75.6% 67.9% 66.7% 79.1% 90.2%
90.2%
Dementia Diagnoses (aged 65+)Apr-2016
Gap - Number of addition people who could benefit from diagnosis (all ages)
Diagnosis Rate E.A.S.1 CFAS II (aged 65+) Apr-2016
72%
66.4%
London average
National estimated diagnosis rate
3.9. There are differing levels of health and social care needsOne way of understanding the needs of local people is to break down the population into different groups. This can be done by grouping people of a similar age and with similar health needs. The analysis can then be used to identify how work across health and social care can achieve a greater impact, and estimate the potential benefits that can be achieved through interventions targeting particular groups.
Exhibit 10 shows that there are around 1.1m people (78% of the population) in NCL who are mostly healthy and use an estimated 37% of health and social care. However, there are around 247,000

Sustainability and Transformation Plan20
(17%) people with one or more long-term conditions, who use an estimated £764m (35%) of health and social care; the estimated 71,000 older people with long term conditions are particularly high users of health and social care (c. £4,300 per person per annum).
There are an estimated 21,000 people in NCL with severe mental illness who are individually very high cost (for example, c. £16k per person per year for those over 70) as are those with learning disabilities and severe physical difficulties; an estimated £246m is spent on fewer than 14,000 adults with a physical and learning disabilities (c. £17,000 per person per year).
Reported dementia affects an estimated 5,400 people, with an estimated spend of around £105m per year spent on this group (an average of nearly £20,000 per person per year). There are also around 17,000 people with cancer, costing an estimated £120m per year in total.
The calculation used to generate these figures is shown in more detail in Appendix 1.
Exhibit 10 – NCL health and care segmentation, 2014-15
Population (k) Total spend, £m Spend per head
NCL
258.3 314.2 9.4 16.9 7.2 27.4 0.0 0.0 0.1 1.6 1.2 9.1 - - 276.2 369.1
818.1 386.0 166.9 285.5 12.3 119.2 0.4 3.8 8.4 43.3 5.0 88.9 - - 1011.0 926.5
21.8 56.1 70.5 302.9 1.7 28.1 5.4 104.8 9.3 74.5 9.0 156.9 - - 117.7 723.4
Total 1098.2 756.2 246.8 605.3 21.2 174.7 5.8 108.5 17.8 119.4 15.1 254.8 - - 1404.8 2,019.0
-
High needsPhysical or learning
disability (PD/LD)Total
-
-
CancerMostly Healthy Chronic conditionsSevere and enduring
mental illnesses (SEMI)
Dementia
-
-Children0 -15
Adults16-69
Elderly70+
-
-
Children withPD/LD
Vulnerablechildren
MMoossttllyy hheeaalltthhyycchhiillddrreenn
Children withchronic conditions
Children withSEMI
MMoossttllyy hheeaalltthhyyaadduullttss
Adults withchronic conditions
Adults withSEMI
Adults withcancer
MMoossttllyy hheeaalltthhyyeellddeerrllyy
Elderly withcancer
Adults withdementia
Elderly withdementia
Elderly withPD/LD
Elderly withchronic conditions
Elderly withSEMI
Children withcancer
Adults withPD/LD
Adults withLearn. disabilities
Elderly withLearn. disabilities
16,317 19,3174 297, 8,034 17,5272 577,
472 1,711 9,716 10,400 5,145 17,711
7,82716,7273,8041,7941,216
1. Children with LD/PD figure does not include spend on education2. Does not include NHS England specialised commissioning spend, meaning total is less that that given in Exhibit 1
Source: CCG 14/15 spend by POD, Monitor Ready Reckoner Tool, Carnall Farrar analysis

21Health and wellbeing
Exhibit 11 shows the same information in a different format. It shows that, in NCL, around 22% of local people use 63% of health and social care.
Exhibit 11 – Use of health and social care by different groups, 2014-15
78%
37%
18%
30%
2%
9%
0%
5%
1%
6%
1%
13%
Population Spend
PD/LD
Cancer
Dementia
SEMI
Chronic conditions
Mostly healthy
Source: CCG 14/15 spend by POD. Monitor Ready Reckoner Tool, Carnall Farrar analysis
This suggests that the priority groups for focus are people with mental illness and people at risk of poor mental or physical health. It is also important to make sure high quality services are available when required for the majority of local people who are not high users of services. Consideration needs to be given to reducing health inequalities, the requirements of different ethnic groups and the significant movement of people into and out of NCL

Sustainability and Transformation Plan22
Care and quality
4.1. There is not enough focus on prevention Many people in NCL are healthy and well – around 40% of adults locally have a healthy weight, do not smoke and do not have any clinical problems34. Empowering people, families and communities to stay healthy, including having good mental health, will help ensure they need less health and social care in future. However, many of these people, especially those aged 40+, are at risk of developing long term health conditions such as obesity, raised cholesterol and high blood pressure35. There is therefore an important opportunity for prevention of disease among these people.
Only 3% of health and social care funding is spent on public health in NCL36. Smoking is thought to cause over 9,000 stays in hospital amongst NCL residents each year37. However, in 2014/15, of the estimated 227,567 smokers in NCL, only 4% (10,979) received support through NHS stop smoking services, but of those, 52% (5,669) successfully quit smoking at four weeks.
Much of the ill health, poor quality of life and health inequalities across NCL could be prevented. Between 2012 and 2014, around 20% (4,628) of deaths in NCL were considered preventable38. Exhibit 12 shows that Haringey, Islington and Camden have particularly high levels of avoidable deaths, with around a quarter of deaths considered preventable.
Exhibit 12 – Preventable deaths in NC
Source: ONS
905 766 763 1,071 1,1230%
10%
20%
30%
40%
Haringey Islington Camden Enfield Barnet
Preventable deaths, NCL, 2012-14
NCL: 4,628
Levels of avoidable deaths may be linked to the fact that NCL CCGs are in the bottom quintile for a number indicators relating to health and wellbeing, including the number of local people with chronic kidney disease and coronary heart disease39.
In addition, the wider determinants of health such as poverty, housing and employment have a significant impact on individuals’ health and well being.
4

23Care and quality
This suggests a focus on health promotion, particularly focusing on those who are healthy and well but are at risk of developing long term health conditions.
4.2. Disease and illness could be detected and managed much earlierMany people (including children) in NCL are unwell but do not know it, meaning they have undiagnosed conditions. For example, there are thought to be around 20,000 people who do not know they have diabetes40 and, in one area of NCL, a quarter of people attending A&E because of chronic obstructive pulmonary disease (COPD) did not know they had the condition41. The level of undiagnosed conditions varies by borough and by GP practice, which may be caused by differences in approaches to care42.
There are also opportunities for better, more systematic management and control of long term health conditions in primary care, in line with evidence-based standards. For example, within NCL in 2014/15 rates of blood glucose control for people with diabetes (important for preventing a worsening of the condition) ranged from 50% to 92% across GP practices43, and 22% of all people with detected high blood pressure did not reach the required blood pressure levels (≤150/90 mmHg), putting them at risk of stroke and other acute problems44.
A focus on prevention and early intervention is very important in improving health and wellbeing for local people, reducing the need for health and care services both now and in the future.
This suggests a focus on early detection and management of disease and illness, especially through more systematic management and control of long term health conditions in primary care.
4.3. There are challenges in provision of primary care in some areasAs shown in Exhibit 13, there are low numbers of GPs per person in Barnet, and Enfield and Haringey and low numbers of registered practice nurses per person in all CCGs, but particularly in Camden and Haringey45.
Exhibit 13 – NCL levels of primary care staff compared to national levels
Number of practice nurses per 1,000 registered patients
0.71
Number of GPs per 1,000 registered patients
0.89
0.60.67
0.84
Barnet CCG Camden CCG Enfield CCG Haringey CCG Islington CCG
0.110.09
0.12
0.09
0.14
Barnet CCG Camden CCG Enfield CCG
Source: HSCIC, General Practice Census 2014 at Practice Level. Populations are unweighted.
Haringey CCG Islington CCG
National top decile threshold National top quartile threshold National median
National top decile threshold
National top quartile threshold
National median

Sustainability and Transformation Plan24
Satisfaction levels and confidence in primary care among local people is mixed across NCL – there are issues across NCL around confidence in practice nurses and in Haringey with confidence in GPs46. Performance against quality indicators in primary care is lower than London and national averages, particularly in Haringey47. There are issues within NCL in accessing primary care during routine and extended hours, and only 75% of people in NCL have a named GP to provide continuity of care48.
There are high levels of A&E attendances across NCL compared to other similar areas49, and also very high levels of first outpatient attendances50, suggesting that there may be gaps in primary care provision. Within CCGs, there are significant variations in levels of emergency activity, A&E attendances, planned care and outpatient referrals between practices51. There are also high levels of A&E attendances and high numbers of short-stay admissions in the over-75s compared to other similar areas52.
This suggests that a priority area for focus is the quality of primary care provision and the primary care workforce. It also suggests a focus on reducing variation between practices. This may reduce A&E attendances, short stay admissions and first outpatient attendances.
4.4. Lack of integrated care and support for those with a long term conditionLevels of emergency admissions are similar in NCL to other areas of London53. However, there are many people with long term health conditions who end up in hospital, especially in Islington54. As shown in Exhibit 14, many people with long term health conditions – over 40% in Barnet, Haringey and Enfield, compared to 35% nationally – do not feel supported to manage their condition55. In addition, health related quality of life for people with long term conditions is much lower in Islington than the England average56.
Insufficiently joined up services for older people
Arthur is 78 and lives alone. After falling at home and injuring his knee, he spent two nights in hospital before being discharged with no further support. Two weeks later, Arthur fell in the shower and fractured his hip. Unable to live independently, he was forced to move into a residential home after some initial rehabilitation in hospital.
Source: submitted by Barnet Integrated Locality Team
Exhibit 14 – NCL long-term conditions support perception vs national benchmark
57.90%
63.80%
57.70% 58.30%
64%
56%
58%
60%
62%
64%
66%
68%
70%
54%
52%Barnet Camden
Source: Office for National Statistics, HSCIC CCG Indicators, 2014/15
Enfield Haringey Islington
Proportion of people who feel supported to deal with their conditions (%)
National top decile
National top quartile
National median
Once people leave hospital, access to social care reablement is lower in Haringey and Camden, while there is a high number of people being readmitted to hospital within 91 days of discharge into community rehabilitation services for people in Enfield57. This is shown in Exhibit 15.

25Care and quality
Exhibit 15 – Indicators for provision of social services
5.50%
2.30%
3.90%
2.30%
5.70%
0%
1%
2%
3%
4%
5%
6%
Barnet CCG Camden CCG Enfield CCG Haringey CCG Islington CCG
71.90%
97.60%82.30% 87.60% 91.20%
0%
20%
40%
60%
80%
100%
Barnet CCG
Source: ASCOF 2013/14
Camden CCG Enfield CCG Haringey CCG Islington CCG
Older people receiving reablement services after leaving hospital, 2013-14
Proportion of elderly (65+) who were still at home 91 days after discharge from hospital into rehabilitation/ reablement services, 2013-14
London average
England average
London averageEngland average
There are also differing levels of admissions to care homes across NCL for older people. In particular, Exhibit 16 shows there are very high levels of permanent admissions to residential and nursing homes in Islington58. Reasons for this include the advice offered by doctors during hospital stays, and the availability of community-based support when people are ready to leave hospital
What good looks like: integrated services for older people
The Barnet Integrated Locality Team (BILT) aims to address these issues by coordinating care for older residents with complex medical and social care needs, as well as providing support to carers. The aim is to enable health and social care staff to help people stay healthy and independent. BILT offers a phone service to people who need it and can arrange for access to physiotherapy to assist elderly people regaining their mobility or home modifications such as the installation of a chairlift or a handrail in the shower.
As the number of elderly people in NCL increases, the demands on the health and care system are likely to increase. Services such as BILT can help keep people independent and well for longer, keeping them in their homes and helping them get back to normal life after spending time in hospital.
Source: submitted by Barnet Integrated Locality Team

Sustainability and Transformation Plan26
Exhibit 16 – Long-term admissions to residential and nursing care homes per 100,000 people
17 17 4 9 13 14 11
623
767
478
588540
669
492
0
100
200
300
400
500
600
700
800
Barnet Camden Enfield Haringey Islington England London
Number of long-term admissions to residential and nursing care homes, per 100,000 population (younger adults)
Number of long-term admissions to residential and nursing care homes, per 100,000 population (older adults)
Note: Islington data is 15/16, as there was an error in the 14/15 submission to HSCIC which means 14/15 data cannot be used. The figures are not expected to be significantly different from 14/15 to 15/16.Source: ASCOF (Adult Social Care Outcomes Framework) , HSCIC
Long-term admissions to residential and nursing care homes per 100,000 population, 2014-15
This suggests that a priority area for focus is better integration of care for those with long-term conditions, and ensuring that suitable and sufficient social care is available. There also needs to be a focus on people in residential and nursing homes.
4.5. Many people are in hospital beds who could be cared for closer to homeMost people who stay for a long time in hospital beds are elderly. Exhibit 17 shows that in 2013/14, while 41% of people admitted to hospital in an emergency were aged 65 and over, they used 67% of the beds59. While the analysis is now slightly out of date, there is unlikely to have been significant changes to these activity patterns since 2013-14.
Exhibit 17 – Emergency activity in NCL by age
20,61037,723
92,095
189,080
121,198
0-19 20-39 40-64 65-84 85+
29,91337,408
46,59853,073
25,181
0-19 20-39 40-64 65-84 85+
Source: NCL 5yr Planning Activity & Cost Analysis – 2013/14 actual data
142,390
196,558
148,769
73,807
22,923
0-19 20-39 40-64 65-84 85+
A&E attendances by age 2013/14
2012/13 to 2013/14 Emergency Admissions (NEL)
Emergency IP Bed Days (NEL) by Age 2013/14

27Care and quality
More time spent in hospital does not necessarily mean better outcomes – often the reverse – and many people could be cared for sooner, at home. Longer stays are not always driven by medical need and can be seriously harmful to health – the longer the stay, the greater the risk of getting infections, muscle decline, becoming less able to walk or do everyday tasks, less able to return home and more likely to need residential or nursing care60. Also, fewer than 40% of people who die in NCL are able to do so at home61 even though, given a choice, most declare their home to be their preferred place of death.
Delayed discharges (people who have been declared medically fit to leave hospital but have not been discharged) are high in some hospitals in NCL62, but these numbers only show people who have actually been declared fit for discharge. The real number of people who could leave if services were available elsewhere is probably much higher63. As an example, a recent audit of people at Plymouth Hospital found that 27% (200) beds had people in them who were medically fit to leave64. This would mean around 600 people in local NCL hospitals if a similar pattern was found. Similarly, if 90% of all local people aged 65 and over were able to be discharged home after no more than 10 days in hospital, this would translate to 340 people every day who could be cared for closer to home65. Ensuring services are available outside hospital would mean people are able to go home at the right time and be cared for safely in their own homes. It would support people to get back to normal life more quickly, reduce their risk from staying in hospital too long and enable hospitals to work more efficiently to care for sicker people.
Insufficiently joined up services for care homes
Edna is 84 years old and lives in a residential care home. She was unable to see a GP after contracting a chest infection, due in part to difficulties getting to the GP practice and the lack of availability of the GPs to conduct home visits. Edna was admitted to hospital as suitable support was not available in the care home. After leaving hospital, the lack of coordination between care services in the community and primary care meant Edna did not receive the support she needed to assist her recovery and she was readmitted to hospital 10 days later.
Source: ICAT care home services
There are also a large number of people in local hospital beds whose admission to hospital might have been avoided altogether. Although the numbers of people who go into hospital in an emergency in NCL are similar to the England average66, evidence from elsewhere suggests that 25-40% of these emergency admissions could be avoided if other care was available outside hospital67. Exhibit 18 summarises a selection of the key international evidence.
Exhibit 18 – International evidence of impact of integrated care
A review of the evidence base on integrated care shows a potential impact of 25–40% in cost reduction, for example
• 15–30% cost reduction through care coordination
• 50% reduction in acute admissions to hospital for patients with diabetes, through case-level care-planning and active disease management
• 23–40% reduction in admissions for CHD through best practice early management
Selected examples of integrated care
• Significant cost reductions and higher levels of productivity • 26% reduction in costs in districts with outsourced management • 76% increase in hospital productivity• 91% patient satisfaction rates
• ChenMed has 30% fewer emergency admissions than other primary care networks in the same geography
• Compared to national averages for the population group, ChenMed reports 18% lower hospitalisation rate and 17% lower readmissions rates
• The number of patients with a care package in place within 28 days of assessment increased by 45%
• Non-elective inpatient bed use in over-65s population reduced by 29%; length of stay reduced by 19%
• Delayed transfers of care from hospital significantly reduced
• Reduction in A&E visits and unscheduled patient admissions• 24% lower than avg hospitalisation; 38% shorter than avg hospital stays • 60% lower than average amputation rate among diabetics• 56% reduction in CHF hospital admits in 3 months• 50% reduction in renal hospital admission rates in 5 months
1 Dorling & Richardson, “McKinsey Evidence Base of Integrated Care”, 2014

Sustainability and Transformation Plan28
There are also already a number of places in NCL where services provide ‘hospital’ care outside of the hospital. These services are integrated across community services and social care, and provide proactive person-centred care. This can empower people to better manage their own health and wellbeing. However, there are differences in the availability of these services across NCL, and it is important to ensure that the services that work well are made available more widely.
This suggests that a priority area for focus is reducing the length of stay and avoidable admissions in acute hospitals, in partnership with social care.
What good looks like: in-reach services for care homes
An ‘in-reach’ team focused on supporting people to remain well in residential care (such as the Integrated Community Ageing Team, or ICAT) act as a liaison between community and acute hospital services. An ICAT is a consultant led multidisciplinary team (MDT) which specializes in geriatric assessment. With knowledge of each patient, and specialising in the care of elderly patients, the team is able to ensure that the needs of patients such as Edna are met upon returning to residential care homes from a spell in hospital. The team also helps to arrange appropriate palliative care to ensure that when the time comes, patients can die in their place of choice.
Demand for these types of services is likely to increase as the population ages, and NCL has an opportunity to build on examples of existing teams, such as those at the Whittington and UCLH, as part of the STP process.
Source: ICAT care home services
4.6. Hospitals are finding it difficult to meet increasingly demanding emergency standardsLocal hospitals are finding it difficult to meet increasingly demanding clinical quality standards for emergency services. For example, as shown in Exhibit 19, according to a self-assessment conducted in 2015 the number of specialties where people are seen by consultants within 14 hours ranges from 20% in one hospital to 90% in another68. Three of the five acute hospitals in NCL do not provide 16-hour consultant presence in Emergency Departments at the weekends69. Within Emergency Departments there are shortages of middle grade doctors70. However, there are likely to have been improvements in adherence to the standards since the self-assessment was carried out; for example, at the Whittington Intensive Therapy Unit (ITU) patients are reviewed at least twice daily.

29Care and quality
Exhibit 19 – Assessment of four London priority national seven day service standards
Note - this data was submitted to the national self-assessment in 2015. An updated self-assessment against these standards is being carried out for the NCL STP.
Standard MeasureBarnetHospital
North Middlesex Hospital
Royal Free Hospital
The WhittingtonHospital
University College Hospital
NCL total
Standard 2: Time to Consultant Review
Percentage of specialties where patients are seen by consultants within 14 hours
50% 30% 80% 20% 90% 45%
Standard 5: Access to Diagnostics
Percentage of diagnostic services available 7 days per week
100% 71% 79% 79% 93% 87%
Standard 6: Access to Consultant-directedInterventions
Percentage of consultant-directed interventions available 7 days per week
89% 67% 100% 100% 100% 76%
Standard 8:Ongoing review
(Where applicable) Percentage of areas in which patients are seen and reviewed by a consultant twice daily
100% 100% 100% 25% 100% 88%
Source: National Seven Day Services Self-Assessment, 2015
Areas included:
Standard 2 - Cardiology, General Medicine, General Surgery, Geriatric Medicine, Gynaecology, Intensive Care, Obstetrics, Paediatrics, Psychiatry, Respiratory
Medicine, Trauma and Orthopaedics
Standard 5 - Biochemistry, Bronchoscopy, Chemical Pathology, Computerised Tomography, Echocardiography, Haematology, Histopathology, Magnetic
Resonance Imaging (MRI), Microbiology, Radiology, Lower GI Endoscopy, Upper GI Endoscopy, Ultrasound, Xray,
Standard 6 - Cardiac pacing, Critical Care, Emergency General Surgery, lnterventional Endoscopy, lnterventional Radiology, Percutaneous Coronary Intervention
(PCI), Renal ReplacementTherapy, Thrombolysis, Urgent Radiotherapy
Standard 8 - Acute medical unit, acute surgical unit, intensive care unit and other high dependency units
In April 2016 none of the five Emergency Departments within NCL were consistently meeting the access standard to see people within 4 hours of arrival, as summarised in Exhibit 20 below. In particular, North Middlesex University Hospital (NMUH) had been recently issued with a Warning Notice by the Care Quality Commission that it needed to significantly improve the treatment of people attending the Emergency Department71. In April NMUH was seeing between 65-75% of A&E patients within 4 hours and was challenged in achieving key quality standards within emergency care. This was shown by the poor satisfaction ratings at NMUH; almost half of people attending the Emergency Department at the hospital would not recommend the Emergency Department to friends and family72.
However since April 2016, considerable progress has been made at NMUH. The launch of the Safer, Better, Faster programme in May 2016 has led to improvements in ED staffing at NMUH; the development of a ‘home first approach’ to support earlier discharge of medical patients who need home care; increase patient flow through assessment units; and reduced delays for patients waiting for tablets to take away. Waiting time performance at A&E in NMUH has improved steadily as a result rising to over 90% of patients seen within 4 hours in early August 2016.

Sustainability and Transformation Plan30
Access to secondary care
Sara had a cyst and she is still waiting for the local hospital to give her an appointment for the operation. Her English is limited and her children have to help her in interpretation, but she does not think that the hospital is giving her the best care.
Her son is helping her navigate the health services, but she feels shy having to be examined by a doctor in front of him. Especially as this cyst is on her uterus and the treatment is possibly a hysterectomy making me more anxious. Sara finds it difficult to talk about women’s illnesses when there are men present, and it is especially hard when her son is also there and she has to explain everything to him. It takes a long time to get an appointment, and services need to improve the improve interpreting services available or hire some doctors who know different languages.
Source: Healthwatch Islington, Diverse Communities Health Voice
Exhibit 20 – Key A&E performance indicators
A&E waits – 4 hours (%)
87.998.491.385.9
Trust result
Source: A&E Waiting Time Analysis, April 2016; Friends and Family Test, April 2016
UCL Hospitals
Royal Free FT
North Middlesex University Hospital
The Whittington Hospital
88.7
72.6
84.1
England Quartiles (type 1 A&E)
100.0079.8
NationalMedian
NationalLower
Quartile Threshold
NationalUpper
Quartile Threshold
NationalBest
NationalWorst
Trust Performance
Metric, unit of measure
Friends and family trust – A&E1, Yes Recommendation % 86.193.394.583.349.4 89.9
Metric, unit of measure
National medianN. Middlesex
Royal FreeLondon
UCLWhittington
Health
National top quartile threshold
2 14 3
National quartiles
This suggests a need to focus on the delivery of emergency services in hospitals in NCL, addressing variation and, in particular, continuing attention to the Emergency Department at North Middlesex University Hospital. This should be underpinned by a NCL-wide approach to supporting all organisations to deliver, with a strong focus on the development of improving access to primary care.
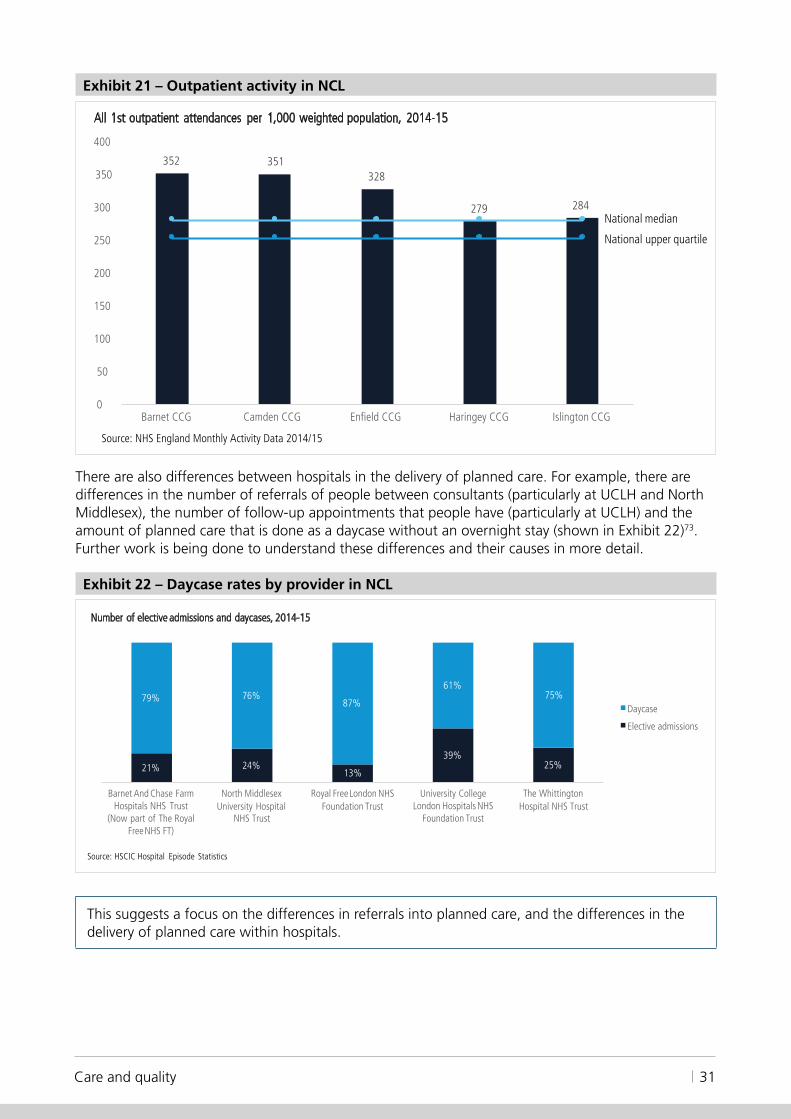
4.7. There are differences in the way planned care is deliveredThere are differences in the way planned care is delivered across NCL. This may reflect different levels of patient need, or it may be due to differences in clinical practice between doctors and nurses at any point where care is given. For example, as shown in Exhibit 21, the number of people seen as outpatients in Barnet, Camden and Enfield is high compared to other similar areas and when compared to the England average. This could be for a number of reasons, including differences in the health needs of local people, the skills and experiences of GPs, or the ability of GPs to get a specialist opinion or access diagnostics in primary care.
31Care and quality
Exhibit 21 – Outpatient activity in NCL
Source: NHS England Monthly Activity Data 2014/15
352 351328
279 284
50
0
350
300
250
200
150
100
Barnet CCG Camden CCG Enfield CCG Haringey CCG Islington CCG
All 1st outpatient attendances per 1,000 weighted population, 2014-15
400
National median
National upper quartile
There are also differences between hospitals in the delivery of planned care. For example, there are differences in the number of referrals of people between consultants (particularly at UCLH and North Middlesex), the number of follow-up appointments that people have (particularly at UCLH) and the amount of planned care that is done as a daycase without an overnight stay (shown in Exhibit 22)73. Further work is being done to understand these differences and their causes in more detail.
Exhibit 22 – Daycase rates by provider in NCL
21% 24%13%
39%25%
79% 76%87%
61%75%
North Middlesex University Hospital
NHS Trust
Royal Free London NHS Foundation Trust
University College London Hospitals NHS
Foundation Trust
The Whittington Hospital NHS Trust
Daycase
Elective admissions
Number of elective admissions and daycases, 2014-15
Source: HSCIC Hospital Episode Statistics
Barnet And Chase Farm Hospitals NHS Trust
(Now part of The Royal Free NHS FT)
This suggests a focus on the differences in referrals into planned care, and the differences in the delivery of planned care within hospitals.

Sustainability and Transformation Plan32
4.8. There are challenges in mental health provisionThere are very high levels of mental illness in NCL, both serious mental illness and common mental health problems, with high rates of premature mortality, particularly in Haringey and Islington, as shown in Exhibit 23. While the causes of premature mortality are broader than just mental health conditions, the links between poor mental health and premature mortality are well-established.
Exhibit 23 – Premature (<75) mortality in adults with serious mental illness, rate per 100,000 people, 2013-14
Source Public health outcomes framework 2013/14
263 265286
342360
There is still a lot of stigma associated with having a mental illness, and many people either do not know how, or do not want, to access mental health services. Information on help and support within local communities is not available everywhere. There are groups of people who are at higher risk of having a mental illness, such as people who are in debt, unemployed, homeless, have a long term condition, or have drug and alcohol problems.
Demand for mental health services has increased, due to social pressures related to reduced funding for public services, increasing numbers of people, higher public expectations and changes to legislation. Community-based teams cannot manage people with the most serious issues and therefore high numbers of people are admitted to hospital. During a crisis, service users prefer to be helped by teams who they know rather than being referred to a new team. Camden and Islington have amongst the smallest community mental health services per person in England74. Community teams reduce the number of people with a mental illness ending up in hospital.
Most mental health problems are managed within primary care, and psychological therapies (IAPT) services are in place to manage mild to moderate mental health problems. However, mental health services based in primary care with specialist workers who can manage moderate to severe mental illnesses are only just beginning to develop in NCL and are limited in who they can treat. Without this expertise in primary care, more people are referred to hospital-based services who might otherwise have been managed within the community.

33Care and quality
Access to psychological therapies
‘There is a need for psychological therapies that have less restriction on who they can see, as IAPT are unable to see clients who have suicidal thoughts, have a history of drugs or alcohol abuse, or a history of longer-term mental health issues.’ (Carer)
Source: Healthwatch Enfield
In recent years there has been a big increase in the numbers of people receiving a first diagnosis of a serious mental health condition in A&E, and around 38% of people admitted to inpatient hospital wards in Camden and Islington are new to mental health services75. These issues are partly related to the large number of people moving in and out of NCL, with significant differences between daytime and night time populations. This creates a burden on both mental health and A&E services, and indicates that prevention and early detection of mental health conditions needs to improve, along with greater capacity to manage these conditions in the community. There is no high quality health-based place of safety in NCL to receive people detained by the police under Section 136.
There is variable access to liaison psychiatry, perinatal psychiatry and child and adolescent mental health services (CAMHS) within urgent care. For example, most of the liaison psychiatry and CAMHS services in hospitals in NCL do not see children within one hour at weekends and overnight76.
What good looks like: improving access to psychological therapies
Yorkshire and Humber Commissioning Support worked on review and redesign of Hull’s Improving Access to Psychological Therapies (IAPT) services and access to mental health services. A revised IAPT+ service, known as the Depression and Anxiety Service, improved choice and access to Psychological Therapies. The service involves timely, evidence-based interventions according to the needs of individuals and does not require individuals to be referred through secondary mental health services to be able to access these services. The new service model is tariff-based and incentivises both patient choice at every point on the pathway and the achievement of demonstrable clinical outcomes.
The improvements other regions have made to their IAPT services are likely to provide learning opportunities for NCL to improve the accessibility and effectiveness of its IAPT services as well.
Source: Yorkshire and Humber Commissioning Support
Although all five boroughs achieve dementia diagnosis rates above the national average, there is great variability across NCL77. There is the expertise in NCL to achieve high diagnosis rates, as demonstrated by Islington. The availability of post-discharge treatment and support services for people with dementia varies greatly despite the good evidence for their effectiveness.
This suggests a focus on the provision of mental health services, particularly the physical health of those with a mental illness, early diagnosis, access to integrated services and child and adolescent mental health services.

Sustainability and Transformation Plan34
4.9. There are challenges delivering services for people with learning difficultiesAs shown in Exhibit 24, the number of adults with learning disabilities varies across NCL from 0.41% of people in Islington, to 0.24% in Camden. Often people are not recorded as having learning difficulties, especially when they are mild.
As elsewhere in England, the number of people with learning disabled is increasing, partly due to the rising numbers of young people with complex needs surviving into adulthood, and also due to the increased life expectancy of the learning disabled population. The rate of increase is estimated to range from 1.2% to 5.1% (average 3.2%) per year78.
Exhibit 24 – Number of people with a learning disability, registered population, 2014/15
1,337
1,154
1,016955
641
N/A N/A0.00%
0.05%
0.10%
0.15%
0.20%
0.25%
0.30%
0.35%
0.40%
0.45%
0.50%
0
200
400
600
800
1,000
1,200
1,400
1,600
Barnet Enfield Haringey Islington Camden London England
Numbers PrevalenceSource: QOF 2014/15
People with learning disabilities tend to have poorer health than the rest of the population, much of which could be prevented. This is partly because of the barriers faced by people with learning disabilities in accessing timely, appropriate and effective health care. As well as having a poorer quality of life, people with learning disabilities die at a younger age than the general population79. Men die, on average, 13 years younger than other people and women die 20 years younger.
People with learning disabilities are more likely to have specific health issues including epilepsy, sensory impairment, respiratory disease, coronary heart disease and mental illness80.
Annual health checks for these individuals are have been shown to be effective in identifying and helping to manage previously undetected health problems. As shown in Exhibit 25, the number of adults in NCL with learning disabilities who have had a health check is higher or similar to the England average; nonetheless, around half have not had one.

35Care and quality
Exhibit 25 – Percentage of eligible adults with a learning disability having a GP health check
54%
48%
57%
50%
44%
0%
50%
40%
30%
20%
10%
70% 66%63%
60%
Barnet Enfield Haringey Islington Camden London England
Source: Public Health England, learning disability profiles
Suitable, local accommodation with care and support is required to make sure people withlearning disabilities can remain part of their communities and get the health care theyneed. This includes accommodation that is self-contained and is suitable for people who also have physical disabilities, and young adults with complex health care needs.
As shown in Exhibit 26, the number of adults with learning disabilities receiving long term support who live in unsettled accommodation, meaning the person might be required to leave at short notice, is much higher in Barnet and Islington compared to the England average, whereas for Camden it is lower.
Exhibit 26 – Percentage of adults with learning disabilities receiving long term support living in unsettled accommodation, 2014/15
51%
19%
32%
27%
0%
40%40%
29%30%
20%20%
10%
60%
50%
Islington Camden London England Barnet Enfield Haringey
Source: Public Health England, learning disability profiles
In October 2015, a national plan (‘Building the Right Support’) and a national service model for learning disability services was published. This was intended to help Transforming Care Partnerships (TCPs) meet national commitments to reduce the length of stay in hospitals and reduce admissions

Sustainability and Transformation Plan36
to assessment and treatment units (such as the former Winterbourne Unit) for people with learning disabilities. The NCL TCP implementation plan is currently being developed, to be in place by July 2016 for delivery by March 2019.
This suggests a focus on prevention services for the learning disabled population, such as annual health checks, and provision of more suitable accommodation for people with learning disabilities.
4.10. There are challenges in the provision of cancer careThere are many opportunities to save lives and deliver cancer services more efficiently in NCL. Cancer is a major cause of death, with around 29% of deaths caused by cancer in England81. One-year survival rates in NCL are similar to other parts of London82, as shown by Exhibit 27. However, compared to other countries such as Sweden, the UK has much lower survival rates, suggesting that improvements could be made83.
Exhibit 27 – One-year survival rates across London for all cancers, 2013 diagnoses
Source: ONS, Index of cancer survival for CCGs in England
London averageEngland average
58%
60%
62%
64%
66%
68%
70%
72%
74%
76%
Late diagnosis of cancers is a particular issue that contributes to lower one-year survival rates. Exhibit 28 indicates that the percentage of cancers detected at an early stage is low, especially in Haringey, Camden and Islington, although Islington has improved significantly between 2013 and 201484.
Exhibit 28 – Percentage of cancers detected at stage 1 and 2 in London, 2013-14
Source: HSCIC
England average 2014 England average 2013
0%
10%
20%
30%
40%
50%
60%
70%
2013 2014
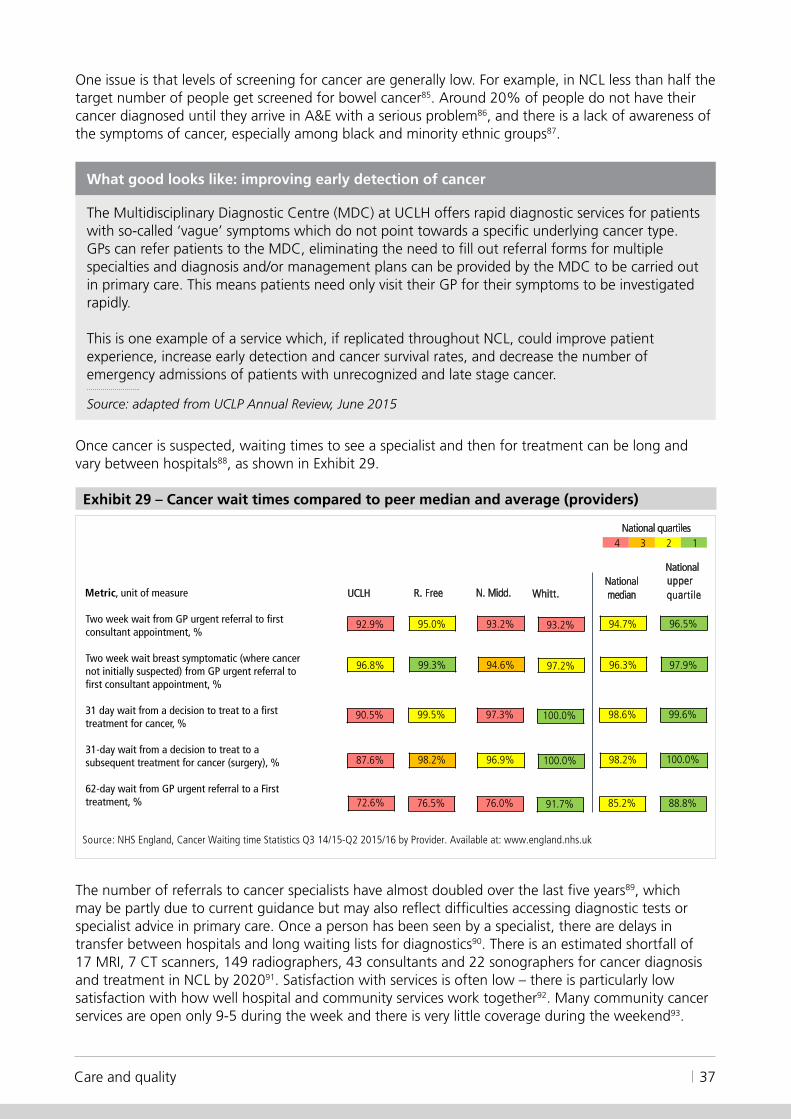
37Care and quality
One issue is that levels of screening for cancer are generally low. For example, in NCL less than half the target number of people get screened for bowel cancer85. Around 20% of people do not have their cancer diagnosed until they arrive in A&E with a serious problem86, and there is a lack of awareness of the symptoms of cancer, especially among black and minority ethnic groups87.
What good looks like: improving early detection of cancer
The Multidisciplinary Diagnostic Centre (MDC) at UCLH offers rapid diagnostic services for patients with so-called ‘vague’ symptoms which do not point towards a specific underlying cancer type. GPs can refer patients to the MDC, eliminating the need to fill out referral forms for multiple specialties and diagnosis and/or management plans can be provided by the MDC to be carried out in primary care. This means patients need only visit their GP for their symptoms to be investigated rapidly.
This is one example of a service which, if replicated throughout NCL, could improve patient experience, increase early detection and cancer survival rates, and decrease the number of emergency admissions of patients with unrecognized and late stage cancer.
Source: adapted from UCLP Annual Review, June 2015
Once cancer is suspected, waiting times to see a specialist and then for treatment can be long and vary between hospitals88, as shown in Exhibit 29.
Exhibit 29 – Cancer wait times compared to peer median and average (providers)
Source: NHS England, Cancer Waiting time Statistics Q3 14/15-Q2 2015/16 by Provider. Available at: www.england.nhs.uk
Nationalmedian
96.5%
UCLH R. Free N. Midd. Whitt.
Nationalupper quartile
92.9% 95.0% 93.2% 94.7% 93.2%
97.9% 96.8% 99.3% 94.6% 96.3% 97.2%
99.6% 90.5% 99.5% 97.3% 98.6% 100.0%
100.0% 87.6% 98.2% 96.9% 98.2% 100.0%
88.8% 76.5% 76.0% 85.2% 91.7%
2 14 3National quartiles
72.6%
Two week wait from GP urgent referral to first consultant appointment, %
Two week wait breast symptomatic (where cancer not initially suspected) from GP urgent referral to first consultant appointment, %
31 day wait from a decision to treat to a first treatment for cancer, %
31-day wait from a decision to treat to a subsequent treatment for cancer (surgery), %
62-day wait from GP urgent referral to a First treatment, %
Metric, unit of measure
The number of referrals to cancer specialists have almost doubled over the last five years89, which may be partly due to current guidance but may also reflect difficulties accessing diagnostic tests or specialist advice in primary care. Once a person has been seen by a specialist, there are delays in transfer between hospitals and long waiting lists for diagnostics90. There is an estimated shortfall of 17 MRI, 7 CT scanners, 149 radiographers, 43 consultants and 22 sonographers for cancer diagnosis and treatment in NCL by 202091. Satisfaction with services is often low – there is particularly low satisfaction with how well hospital and community services work together92. Many community cancer services are open only 9-5 during the week and there is very little coverage during the weekend93.

Sustainability and Transformation Plan38
Improving early detection of cancer
Anne, 56, visited her GP complaining of abdominal pain and unexplained weight loss, and was then referred to a number of different specialties without a successful diagnosis. Four months later, she attended A&E with symptoms including jaundice, vomiting, fever and itching. After a series of tests, she was diagnosed with pancreatic cancer.
Source: adapted from UCLP Annual Review, June 2015
There a number of issues with hospitals seeing small numbers of some types of cancer patients, lower than NICE guidelines of 150 minimum cases per year94. For example, as shown in Exhibit 30, Whittington Health provides the second smallest breast cancer service in London, with under two patients a week on average. In addition, North Middlesex provides the second smallest lung cancer service95, also seeing less than two patients a week on average.
Exhibit 30 – Number of new breast cancer patient treated in London cancer services
Source: Public Health England, 2014
515 504
417
216188
149
92 85
0
100
200
300
400
500
600
Barts Health NHS Trust
Royal Free London NHS FT (incl. Barnet
and Chase Farm Hospital)
Barking, Havering and Redbridge
University Hospitals NHS Trust
Princess Alexandra Hospital NHS Trust
North Middlesex University Hospital
NHS Trust
University College London Hospitals
NHS FT
Whittington Health NHS Trust
Homerton University Hospital
NHS FT
This suggests a focus on the cancer pathway across primary and acute providers.
4.11. There are workforce challengesThere are a number of workforce challenges in NCL. These include attracting the right health and care professionals to NCL, retaining the existing workforce, and shortfalls in GPs, practice nurses and social workers.
Attracting healthcare professionals to NCL There is predicted to be a 22% shortfall in nurses and a 14% shortfall in allied healthcare professionals (AHPs) across NCL by 202096, as shown in Exhibit 31. The high and increasing cost of living in NCL makes it difficult to attract and retain the required workforce.

39Care and quality
Exhibit 31 – Supply and demand for nurses and AHPs
9422 9539 977011424 11564 11682 11817 11925
0
5,000
10,000
April 2014 April 2015 February 2016 April 2016 April 2017 April 2018 April 2019 April 2020
SIP Demand
2112 2221 2306 2488 2521 2556 2600 2624
0
1,000
2,000
3,000
April 2014 April 2015 February 2016 April 2016 April 2017 April 2018 April 2019 April 2020
SIP DemandSource: NCL aggregated 2015/16 workforce planning data
Nursing, all branches excluding midwifery
15,000
Allied health professionals
Retaining the existing NHS workforceThe ageing of the workforce, and increasingly attractive career opportunities outside the NHS or outside London, make the recruitment and retention of staff one of the biggest challenges. Many people leave not only the local workforce but the NHS altogether, the majority being well under retirement age. For example, Exhibit 32 shows that 26% of adult nurses and 29% of speech and language therapists left the NHS entirely between 2010 and 201597.
Exhibit 32 – Destinations of adult nurses and speech and language therapists
63%
6% 3%
29%
0%
10%
20%
30%
40%
50%
60%
70%
SLT - London SLT - outside London Other NHS occupation Left NHS
63%
4% 6%1%
26%
0%10%20%30%40%50%60%70%
Adult nurse -London
Adult nurse -outside London
Other occupation -London
Other occupation -outside London
Left NHS
Destinations of adult nurses, 2010-2015
Destination of speech and language therapists (SLTs), 2010-2015
Source: Workforce Migration tool, 2015
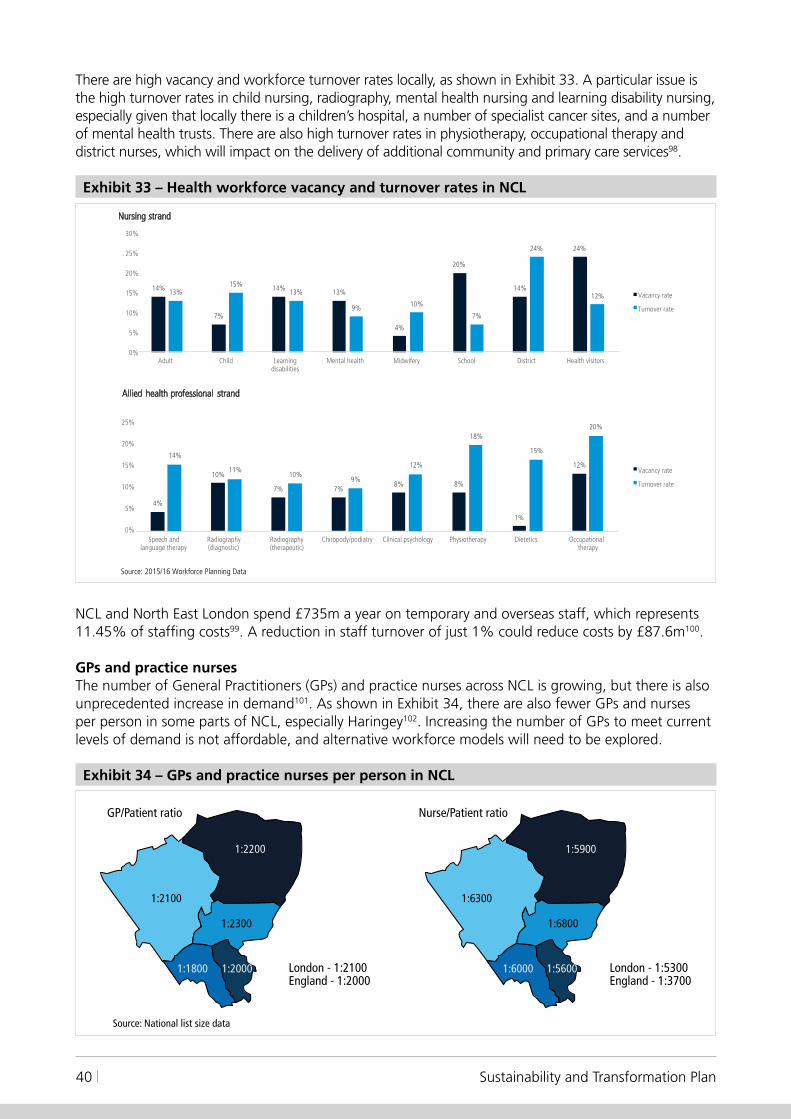
Sustainability and Transformation Plan40
There are high vacancy and workforce turnover rates locally, as shown in Exhibit 33. A particular issue is the high turnover rates in child nursing, radiography, mental health nursing and learning disability nursing, especially given that locally there is a children’s hospital, a number of specialist cancer sites, and a number of mental health trusts. There are also high turnover rates in physiotherapy, occupational therapy and district nurses, which will impact on the delivery of additional community and primary care services98.
Exhibit 33 – Health workforce vacancy and turnover rates in NCL
4%
10%
7% 7%8% 8%
1%
12%14%
11%10%
9%
12%
18%
15%
20%
0%
5%
15%
10%
25%
Speech and language therapy
Radiography (diagnostic)
Radiography (therapeutic)
Chiropody/podiatry Clinical psychology Physiotherapy Dietetics Occupational therapy
Vacancy rate
Turnover rate
Source: 2015/16 Workforce Planning Data
Nursing strand
Allied health professional strand
20%
14%
7%
14% 13%
4%
20%
14%
24%
13%15%
13%
9% 10%
7%
24%
12%
0%
5%
10%
15%
20%
25%
30%
Adult Child Learning disabilities
Mental health Midwifery School District Health visitors
Vacancy rate
Turnover rate
NCL and North East London spend £735m a year on temporary and overseas staff, which represents 11.45% of staffing costs99. A reduction in staff turnover of just 1% could reduce costs by £87.6m100.
GPs and practice nursesThe number of General Practitioners (GPs) and practice nurses across NCL is growing, but there is also unprecedented increase in demand101. As shown in Exhibit 34, there are also fewer GPs and nurses per person in some parts of NCL, especially Haringey102. Increasing the number of GPs to meet current levels of demand is not affordable, and alternative workforce models will need to be explored.
Exhibit 34 – GPs and practice nurses per person in NCL
London - 1:2100England - 1:2000
Source: National list size data
London - 1:5300England - 1:3700
GP/Patient ratio Nurse/Patient ratio
1:2100 1:6300
1:2200 1:5900
1:2300 1:6800
1:1800 1:60001:2000 1:5600

41Care and quality
Social care workersThere are 35,000 people working in social care in NCL, with 1,500 staff in regulated professions (such as social workers) and 25,000 others providing direct care. As shown in Exhibit 35, vacancy rates across the regulated professions are around 23.5%, higher than any NHS staff group103. This shortfall of staff contributes to delays in discharge for people in hospital beds. There are also large differences in pay and conditions for the social care workforce, with 43% of the workforce on zero-hour contracts and many personal assistants employed directly by service users.
Exhibit 35 – Social care vacancy rates
10%
15%
20%
25%
Managerial Regulated profession Direct care Other
Vaca
ncy
rate
5%
0% All job roles
Source: HSCIC
Junior doctors and consultantsBetween 2009 and 2014, the number of consultants in the London workforce increased by an average of 20.1% against a national average of 17.8%, and the number of Certificate of Completion of Training (CCT) holders continues to rise. As shown in Exhibit 36, London has a similar consultant workforce to the rest of the country, but a lower number in some specialties, particularly general practice104.
Exhibit 36 – Proportion of the consultant workforce by selected specialty compared to England
Source: HSCIC
9%
15%
5%8% 8%
39%
8%13%
4%6%
9%
45%
0%5%
10%15%20%25%30%35%40%45%50%
Anaesthetic specialties
Medical specialties Paediatric specialties Psychiatry specialties Surgical specialties General Practice
London National
Over the next six years, there will be a large increase in the number of CCT holders105. It will be important to consider how these doctors are used to deliver more care in out of hospital settings.
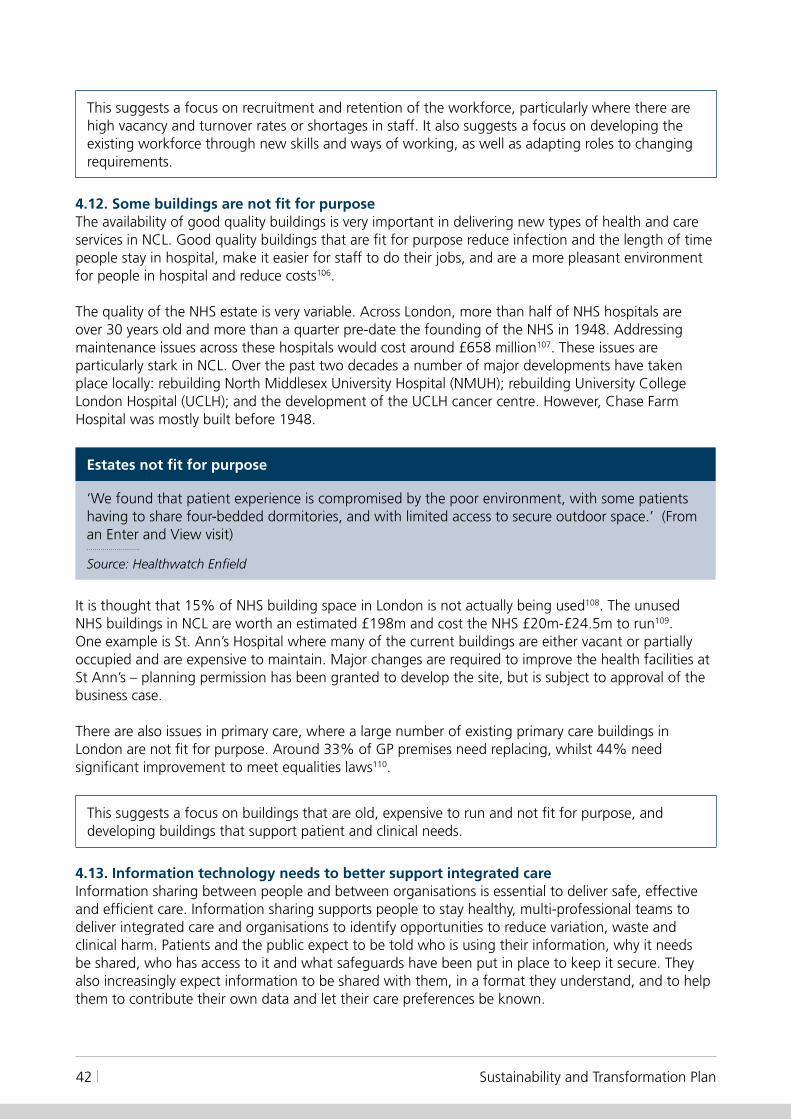
Sustainability and Transformation Plan42
This suggests a focus on recruitment and retention of the workforce, particularly where there are high vacancy and turnover rates or shortages in staff. It also suggests a focus on developing the existing workforce through new skills and ways of working, as well as adapting roles to changing requirements.
4.12. Some buildings are not fit for purposeThe availability of good quality buildings is very important in delivering new types of health and care services in NCL. Good quality buildings that are fit for purpose reduce infection and the length of time people stay in hospital, make it easier for staff to do their jobs, and are a more pleasant environment for people in hospital and reduce costs106.
The quality of the NHS estate is very variable. Across London, more than half of NHS hospitals are over 30 years old and more than a quarter pre-date the founding of the NHS in 1948. Addressing maintenance issues across these hospitals would cost around £658 million107. These issues are particularly stark in NCL. Over the past two decades a number of major developments have taken place locally: rebuilding North Middlesex University Hospital (NMUH); rebuilding University College London Hospital (UCLH); and the development of the UCLH cancer centre. However, Chase Farm Hospital was mostly built before 1948.
Estates not fit for purpose
‘We found that patient experience is compromised by the poor environment, with some patients having to share four-bedded dormitories, and with limited access to secure outdoor space.’ (From an Enter and View visit)
Source: Healthwatch Enfield
It is thought that 15% of NHS building space in London is not actually being used108. The unused NHS buildings in NCL are worth an estimated £198m and cost the NHS £20m-£24.5m to run109. One example is St. Ann’s Hospital where many of the current buildings are either vacant or partially occupied and are expensive to maintain. Major changes are required to improve the health facilities at St Ann’s – planning permission has been granted to develop the site, but is subject to approval of the business case.
There are also issues in primary care, where a large number of existing primary care buildings in London are not fit for purpose. Around 33% of GP premises need replacing, whilst 44% need significant improvement to meet equalities laws110.
This suggests a focus on buildings that are old, expensive to run and not fit for purpose, and developing buildings that support patient and clinical needs.
4.13. Information technology needs to better support integrated careInformation sharing between people and between organisations is essential to deliver safe, effective and efficient care. Information sharing supports people to stay healthy, multi-professional teams to deliver integrated care and organisations to identify opportunities to reduce variation, waste and clinical harm. Patients and the public expect to be told who is using their information, why it needs be shared, who has access to it and what safeguards have been put in place to keep it secure. They also increasingly expect information to be shared with them, in a format they understand, and to help them to contribute their own data and let their care preferences be known.

43Care and quality
As shown in Exhibit 37, the level of digital maturity of provider organisations across NCL is variable, with most below the national average for digital capabilities and particularly poor in terms of their capability to share information with others and adoption of national standards111. Data collection in primary care is much more developed than other areas of the NHS, but the quality of data and information still varies between practices, and the number of people digitally accessing their own GP records remains low112. Local authorities mainly have stand-alone systems, with limited ability to digitally share information with NHS providers or with other boroughs.
Exhibit 37 – Digital maturity assessment
100%
90%
80%
70%
60%
50%
40%
30%
20%
10%
0%
80%
53%
77%
60%
64%
87%
44%
55%
30%
61%
27%24%
43%
13%
45%
59%
78% 80% 80%
30%
70%
52%
46%
64%
52%50%
5%
- - - National average -infrastructure
National average - capabilities
National average -readiness
Camden andIslington
CNWL Barnet,Enfield andHaringey
North Moorfields Royal Free Tavistockand Portman
UCLH Middlesex
Readiness Capabilities infrastructure
Source: NHS England Digital Maturity Assessment 2015
WhittingtonAcute
WhittingtonCommunity
55%52%
34%
The workforce needs to be connected all day, every day. They need to be able to access people’s data and tools to assist clinical decision making in real time and collect and view data wherever they are working. While the use of mobile devices to view and capture data is gradually improving, there are still many areas where the workforce across NCL is not properly informed and supported113.
The current situation has mainly been developed because of the need to meet regulatory requirements. More recently, integrated digital care records have been created to facilitate integrated care within individual CCGs in Camden and Islington. However, there is no NCL-wide governance structure or leadership team to implement digital transformation across NCL, and individual organisations continue to operate independently within their own areas with resultant fragmentation, lack of joined up information flows and duplication of effort.
This suggests that a priority area for focus is developing system wide governance and leadership to support the implementation of integrated information sharing and technology.

Sustainability and Transformation Plan44
Financial challenge
Funding increases in NCL of £269m over the next 5 years will not meet the likely increases in numbers of local people and growth in demand for health services of £426m, plus increases in the cost of delivering health care of £461m.
This means that there is a substantial financial challenge facing health organisations in NCL. Health commissioners and providers are already £121m in deficit in 2015/16 and, if nothing changes, will be £876m in deficit by 2020/21. This includes £137m in relation to specialised commissioning.
The health budget impact of the local authority financial challenge has not been calculated and so is not included in the ‘do nothing’ financial gap. Exhibit 38 summarises the ‘do nothing’ financial gap for NCL.
Exhibit 38 – NCL forecast financial gap
200
(200)
(400)
(600)
(800)
(1,000} 15/16 FOT Allocation
growth - CCGs Growth/cost
pressures/investmentCCGs
Provider- net cost
pressures
NHSE spec comm 20/21 Do Nothing financial
challenge
(121) (426)
(461)
(137)
269
(876)
Source: NCL finance base case analysis
The consequence of doing nothing is that local health and social care services would not be maintained. A new way of providing services is needed, that can be delivered within the funding available. This cannot be done by one organisation, but needs to be done across health and social care, with everyone working together.
5
45Next steps
Next steps
Recognising the significant scale of the challenges faced, and the urgency with which they need to be addressed, NCL has come together as a strategic planning group to create a 5-year Sustainability and Transformation Plan (STP). The aim of the STP is to meet the challenges outlined in this Case for Change, delivering clinical and financial sustainability for health and social care in NCL and, most importantly, improving the quality of care and outcomes for local people.
Leaders representing all aspects of health and social care in NCL – people that work in health commissioning, hospitals and local authorities, local GPs, and people that represent patients and the public – are working together to tackle the issues. They recognise that something radically different needs to be done in order to make sure local people have access to care when they need it, in the most appropriate place. This about promoting independence, health and wellbeing for everybody in NCL, whether they live in Enfield or Islington. It can only be done by working together, building trust between organisations that aren’t necessarily used to doing so, and considering solutions across NCL. There may be things that can be done to improve health and care which are better delivered at a local, neighbourhood level. But it is important that there is a common vision across NCL in order to deliver maximum possible impact.
There is already lots of good work to build on in NCL. For example, UCLH and the Royal Free have set up an innovative joint venture with The Doctors Laboratory to run pathology services, which is at the cutting edge of new partnerships in health. There are existing schemes in NCL that could be further developed: the first Multidisciplinary Diagnostic Centre for cancer in England opened at UCLH, for example, and GP practices across NCL are already working together in GP Federations, meaning that they can deliver more services than they would be able to alone. Nationally,
two ‘vanguard’ sites have been established in NCL – one looking at how hospitals can work together better, and one looking at what can be done to improve the end-to-end experience for people with cancer, from prevention to recovery. In addition, the Haringey devolution pilot, focusing on prevention, is exploring the licensing and planning powers needed to shape healthy environments; and support for people with mental health conditions who are on sickness absence but not yet unemployed114. In individual boroughs, great work has been done to meet the needs of local people and bring together health and care into a seamless service. This includes strengthening the role of the voluntary sector in providing services and caring for people and their families.
Local leaders are currently establishing the key pieces of work that will really make a difference and have a positive impact on lives in NCL. The ideas being explored include: • developing new models of care for particular
groups of people, making sure that they are tailored to the particular groups’ needs;
• working with people from an early age through schools and communities to prevent them from getting sick;
• investing in primary care to make sure that people get to see a GP when they need and that more care can take place in the community, closer to home;
• addressing the issues that are present in hospitals, such as high infection rates and long waiting times;
• making sure that mental health and physical health are considered together and that this is reflected in the way that people with mental health problems are treated; and
• making sure that hospital treatments are delivered safely and efficiently.
The impact of these pieces of work will mean that people stay healthier for longer, and are able to play more of an active role in their own care if they want to. It will mean that more care can be provided at home or in the community, and that interactions with health
6

Sustainability and Transformation Plan46
and care professionals will be different. In some cases, people might want contact with a named professional who knows them. In other cases, they might want access to a GP or the ability to make an appointment online. When people do need to go to hospital, they will only be there for as long as they need to be, and the connection between hospital professionals and community care professionals will make sure people are supported when they go home – making sure they have some food in the fridge when they get back, for example. All of this should reduce complications or difficulties that are caused from confusion, bureaucracy and lack of communication, meaning that people are less likely to end up in hospital when it could have been prevented.
Local leaders are also looking at ways to reduce avoidable costs through improving productivity and efficiency across NCL; for example, by bringing together administrative functions. This will mean that hospitals will have more money to spend on patients and care. Finally, the programme will consider what is required to deliver change. Examples of this include using technological advances to improve care, such as improving access to the latest diagnostic tools which pick up cancer at an early stage, or providing people with an electronic patient record that they can share with any health and care professionals they come into contact with so that their full history is known. Local leaders will also review the health and care buildings across NCL, identifying those that are not fit for purpose or not being used fully, and finding the best way to get maximum value out of these in order that they support new ways of working – or developing new, accessible buildings that are paid for by the money released from unsuitable sites. It will also be essential to develop the leaders of tomorrow – making it attractive and affordable for talented people to live and work in NCL, rather than depending on temporary staff, who can often be expensive.
The initial, high-level Sustainability and Transformation Plan will be developed by the end of June 2016, and further work at a more detailed level will continue to the end of 2016. Improvements will start to be made immediately, and completed by 2020/21. To get this right, patients, people who use services, carers and local residents will be involved in producing this plan. This Case for Change provides a platform for transformation, and will be referred back to over the coming years to ensure any proposed change is heading in the right direction. The data analysed in this document represents a point in time, and will be updated as required. Should new key issues, themes or gaps in care be identified as a result of this, local leaders will work together to respond to these.

47Next steps
Inputs
• Population by year and age band (ONS)• Distribution of condition by age band (Monitor tool)• Prevalence of health conditions in the locality (QOF)• Mapping of conditions by age band making use of Monitor peer group
and QOF• CCG spend by POD for 2015/16• LA spend by ASC
Appendix 1: data segmentation methodology
Method• Use Monitor Care Spend Tool as the structure of model, which allocates
spend to cluster and then across age and condition bands• Splits spend by POD by age band• Assigns each individual to a condition in descending rank order of intensity• Applies pattern of resource consumption intensity by segment based on
previous applications of matched patient-level data sets
Outputs• Breakdown by age and condition at with population, spend per capita,
total spend plus breakdown by POD and segment for per capita and total spend
• Locality level output dependent on data availability
Limitations• Monitor peer group analysis limited to set age bands, does not have
perfect match for the locality population and is therefore based on archetypal comparator areas
• The analysis excludes children’s social care• Is not actual patient level data specific to the locality

Sustainability and Transformation Plan48
1 An estimated 181,000 in total in NCL by 2020, an additional 26,000 over 5 years
2 https://www.gov.uk/government/uploads/system/uploads/attachment_data/file/198033/National_Service_Framework_for_Older_People.pdf
3 PHE 2015, HSCIC 2015
4 CQC care directory
5 All numbers from ONS unless otherwise referenced.
6 http://patient.info/doctor/diseases-and-different-ethnic-groups
7 GLA 2014 Round SHLAA Capped Ethnic Group Borough Projections (October 2015)
8 Census 2011
9 Census 2011
10 Nomis official labour market statistics, November 2015
11 Public Health Profiles Data Tool, PHE, 2014/15
12 IMD 2015, ONS
13 All numbers from ONS unless otherwise referenced.
14 http://www.lse.ac.uk/geographyAndEnvironment/research/London/pdf/populationmobilityandserviceprovision.pdf
15 https://www.gov.uk/government/statistical-data-sets/live-tables-on-homelessness
16 https://www.gov.uk/government/statistical-data-sets/live-tables-on-homelessness
17 https://www.gov.uk/government/uploads/system/uploads/attachment_data/file/216096/dh_127424.pdf
18 Camden and Islington GP Linked Dataset projected to NCL level
19 Public Health Profiles Data Tool, PHE, 2014-15
20 Local analysis using Camden and Islington GP Dataset, 2012
21 http://ash.org.uk/files/documents/ASH_107.pdf
22 http://www.phoutcomes.info/public-health-outcomes-framework#page/3/gid/1000042/pat/6/par/E12000007/ati/102/are/E09000019/iid/91414/age/1/sex/4
23 http://www.phoutcomes.info/public-health-outcomes-framework#page/3/gid/1000042/pat/6/par/E12000007/ati/102/are/E09000019/iid/22401/age/27/sex/4
24 Public Health Profiles Data Tool, PHE, 2014-15
25 2014 Round of Demographic Projections - SHLAA-based population projections, Capped Household Size model, short-term migration scenario
26 ONS, mid-year population estimates
27 Public Health Outcome Data Tool, PHE, 2013
28 Public Health England 2015
29 Public Health England 2014
30 QOF 2014-15
31 http://www.ash.org.uk/current-policy-issues/health-inequalities/smoking-and-mental-health/the-stolen-years
32 NHS England Dementia Diagnosis Monthly Workbook, April 2016
33 NHS England Dementia Diagnosis Monthly Workbook, April 2016
34 Camden and Islington GP Linked Dataset, 2015, projected to NCL level
35 Camden and Islington GP Linked Dataset projected to NCL level
36 Based on 2015/16 public health budget of each NCL council
37 http://www.tobaccoprofiles.info
38 Public Health Profiles Data Tool, PHE, 2012-14
39 NHS Right Care, 2015 NHS Atlas of Variation
40 APHO modelled expected prevalence (2011)
41 Local audit of hospital admissions at the Whittington
42 APHO modelled expected prevalence (2011)
43 Quality and outcomes framework, 2014-15,
44 Quality and outcomes framework, 2014-15,
45 HSCIC, General Practice Census 2014 at Practice Level. Populations are unweighted.
46 GP Patient Survey (Q4; 2014-15
47 NCL Primary Care Joint Committee, March 2016
48 NCL Primary Care Joint Committee, March 2016
49 RightCare Atlas of Variation in Healthcare, September 2015
50 NHS England Monthly Activity Data 2014-15
51 SLAM Data (2014/15); provided by NEL CSU (analysis undertaken for Enfield CCG only)
52 NHS Right Care, 2015 NHS Atlas of Variation
53 HES 2013-14
54 Office for National Statistics, HSCIC CCG Indicator 2.6, 2014-15
55 Office for National Statistics, HSCIC CCG Indicators, 2014-15
56 Office for National Statistics, HSCIC CCG Indicators, 2014-15
57 ASCOF 2013-14
58 ASCOF 2013-14, HSCIC 2014-15
59 NCL 5yr Planning Activity and Cost Analysis – 2013-14 actual data
60 For example, regional geriatric programme of Toronto
Endnotes

49End notes
61 People who die in their usual place of residence, ONC, 2014-15
62 NHS England Delayed Transfers of Care Data, 2014-15
63 Carter Review, 2016
64 Devon acuity audit, October 2015
65 SUS 2014/15. 10-day trim applied to all NCL CCG patients aged 65 and over staying more than 10 days. 90% bed occupancy assumed based on actual average bed occupancy 2014-15.
66 NHS England HES Data 2013-14
67 McKinsey evidence base of integrated care 2014
68 Assessment of 4 London priority National Seven Day Service standards, 2015
69 Urgent and emergency care service stocktake, July 2015, NHSE (London)
70 NCL clinical workshop, 20 April 2016
71 https://www.cqc.org.uk/content/north-middlesex-university-hospital-nhs-trust-told-improve-services-emergency-department. Full report to follow.
72 Friends and Family Test, January 2016
73 HSCIC Hospital Episode Statistics 2014-15
74 Walker, S and Page, Z (2016), Mental Health data & intelligence for Camden and Islington, Benchmarking Network, Manchester
75 Kirchner, V et al. (2016), Clinical Strategy 2016-2021: A vision for the transformation of mental health services, Camden and Islington NHS Foundation Trust, London
76 Mental health crisis care ED audit, NHS England (London), 2015
77 NHS England Dementia Diagnosis Monthly Workbook, April 2016
78 Emerson E and Hatton C, Estimating future need for social care among adults with learning disabilities in England: an update. 2011
79 http://fingertips.phe.org.uk/profile/learning-disabilities
80 Emerson E and Baines S, Health inequalities and people with learning disabilities in the UK. 2010
81 ONS, national population projections, 2015
82 ONS, Index of cancer survival rates, 2012 diagnosis
83 International cancer benchmarking partnership 2000-2 to 2005-7
84 39.4% in Haringey and 38.9% in Islington in 2013 compared to 46.7% in Barnet, HSCIC CCG outcome indicator set 1.18: percentage of cancers detected at stage 1 and 2.
85 Open Exeter / national screening service, December 2014
86 For example, over 25% of people with colorectal cancer in UCLH Vanguard diagnosed in an emergency presentation between 2006 and 2013: NCIN, Public Health England
87 http://www.cancerresearchuk.org/sites/default/files/public_awareness_of_cancer_in_britain_dh_report.pdf
88 NHS England, Cancer Waiting time Statistics Q3 14-15-Q2 15-16 by Provider
89 National cancer intelligence network, 2009-10 to 2014-15
90 UCLH cancer vanguard: imaging demand and capacity, 2020 Delivery, December 2015
91 UCLH cancer vanguard: imaging demand and capacity, 2020 Delivery, December 2015
92 National patient experience survey, 2014
93 As at 31 March 2014. A review of specialist palliative care provision and access across London, September 2015, London Cancer Alliance (Appendix 4)
94 NICE guidance
95 Number of new lung cancer patients treated (patient first seen in 2013), Lucada
96 NCL aggregated 2015-16 workforce planning data
97 Workforce Migration tool, Health Education England 201
98 Workforce Planning Data, Health Education England, 2015-16
99 An economic analysis of the North Central and North East London workforce, Health Education England 2016
100 An economic analysis of the North Central and North East London workforce, Health Education England 2016
101 General Practice and Workforce statistics, Health and Social Care Information Centre workforce data, Sept 2015
102 General Practice and Workforce statistics, Health and Social Care Information Centre workforce data, Sept 2015
103 Workforce Census, Skills for Care, July 2015
104 General Practice and Workforce statistics, Health and Social Care Information Centre workforce data, Sept 2015
105 HEE (London) trainee numbers, February 2016
106 For example, Health and Care Infrastructure Research and Innovation Centre, 2010
107 RIC returns, 2014-15 - significant, high and moderate risk backlog maintenance
108 http://www.londonhealthcommission.org.uk/wp-content/uploads/Unlocking-the-value-of-NHS-estates-in-London-.pdf
109 Carnall Farrar, 2016, based on 14-15 ERIC data for acute/MH and 12-13 data for community
110 Better Health for London
111 NHS England Digital Maturity Assessment 2015
112 NHS England Digital Maturity Assessment 2015
113 NHS England Digital Maturity Assessment 2015
114 London Health and Care Devolution Bulletin, June 2016

North Central London Sustainability and
Transformation Plan