Embed Size (px)
Citation preview

NORTH AMERICAN VETERINARY LICENSING EXAMINATION (NAVLE®)
VETERINARY PROFESSION PRACTICE ANALYSIS 2017

NAVLE VETERINARY PROFESSION PRACTICE ANALYSIS 2017
Table of Contents
I. Background and Overview ........................................................................................................................ 1
II. Survey Development ................................................................................................................................ 4
III. Survey Sampling and Administration ..................................................................................................... 8
IV. Supplemental Practice Analysis Activities ........................................................................................... 11
V. Results .................................................................................................................................................... 16
VI. Implications for Test Design/Test Blueprint ........................................................................................ 30
Appendix A – Blueprint and Diagnosis Counts Based on Species .............................................................. 34
Appendix B – Blueprint Based on Competencies ....................................................................................... 35
Appendix C – Foundational Science Coding ............................................................................................... 36
Appendix D – Key Project Staff ................................................................................................................... 37
Appendix E – NAVLE Practice Analysis: Demographic and Practice Questions .......................................... 38
Appendix F – NAVLE Practice Analysis Subject Matter Expert Meetings, November 11, 2015 Focus Group, Card-sorting Participants, Basic Science Topic Weighting Activity Participants ............................. 42
Appendix G – References ........................................................................................................................... 45

1
I. BACKGROUND AND OVERVIEW
The role of practice analysis in the development of credentialing examinations is well
documented in the assessment literature (APA, Kane 1982, Raymond & Luecht 2013). Given
the importance of licensing examinations—to prospective veterinarians, to veterinary
medicine in general, to both animal and human health, as well as to the public—it is
imperative, for both legal and scientific reasons, that such examinations are job-related. This
is ensured by developing examination content specifications that are based on practice
analysis. Valid practice analysis results guide test design activities such as determining the
knowledge and skills required for successful performance, selecting appropriate assessment
methods and approaches, designing the best-practice–related examination items and other
assessment tasks, and defining score categories that serve as the basis for feedback. In other
words, a high-quality, valid practice analysis will inform key decisions about test blueprints
and content for an examination such as the NAVLE and thus become the cornerstone of a
professional licensing system.
To ensure that licensure examinations required for the practice of veterinary medicine
remain highly job-related, the International Council for Veterinary Assessment (ICVA) has
periodically conducted practice analyses, with the most recent completed in 2003 and 2010.
Those studies administered questionnaires to large samples of North American veterinarians
regarding the types of diagnoses they typically encounter and the frequency with which they
perform various activities. The present analysis updates previous studies by asking an even
larger, more representative sample of North American veterinarians about the species they
see in their practices and the diagnoses in cases they are required to manage. In addition,
the present study extends previous practice analyses in two important ways: (1) by
incorporating elements of competency modeling and (2) by systematically identifying the
basic science knowledge foundational to all of veterinary medicine. Each is briefly described
below.
Over the past two decades, competency modeling has gained prominence as a way for
businesses to guide activities related to personnel selection, training, and other human

2
resource functions. That influence recently has extended into professional associations in
disciplines such as accounting, engineering, medicine, nursing, psychology, as well as
veterinary medicine. For example, the Royal Veterinary College (Bachelor of Veterinary
Medicine Day One Skills, 2007) published a list of competencies required of veterinarians at
entry into practice. More recently, the North American Veterinary Medical Education
Consortium (NAVMEC 2013), composed of leading organizations in the profession, published
a comprehensive list of clinical and professional core competencies required at entry into
and across the whole career span of veterinary practice.
The practice analysis questionnaires developed for the present study included multiple
competencies obtained from numerous documents created by various organizations since
2007 (Appendix G). The current analysis sought to determine the frequency with which these
competencies were required in work/practice and their importance to successful outcomes.
The current study also investigated the relationships among competencies to determine a
useful framework or model for organizing them.
Additionally, the current study extended previous efforts by beginning the process of
confirming how foundational sciences are incorporated and required for successful
veterinary practice. To this end, an extensive search of relevant textbooks and veterinary
curricula was completed and formatted into a list of academic disciplines, as well as some
specific topics within each discipline. This list will be used by the NAVLE Examination
Committee and other groups of subject matter experts (SMEs) when coding new NAVLE
content. NBME staff will track the proportion of content covering each of these topics.
Ultimately, when considering content coverage on the exam, NAVLE collaborators will use
this information to help inform decisions about the degree of emphasis to allocate to various
basic science disciplines (eg, microbiology, parasitology, anatomy) and specific topics within
disciplines (eg, bacteriology, virology, nematodes, anterior cruciate ligament).
Survey Rationale
The current analysis obtained information about the following characteristics of
veterinary practice: (a) work context, (b) animal species and diagnoses managed, (c) clinical

3
and professional competencies required for success, and (d) foundational and basic
veterinary sciences knowledge required to effectively perform the responsibilities of
effective practice. Each of these characteristics provides important considerations when
designing and developing an examination’s blueprint and overall content.
A key challenge in creating and conducting a large survey that produces information
about each of these characteristics is keeping the survey concise enough so that participants
will respond to and complete the entire questionnaire. The 2010 job analysis had a less-than-
ideal, although acceptable, response rate of 13.8%.
The present study employed two strategies to optimize response and completion rates.
The first was to split the survey into multiple sections such that no one person would see all
sections. For any given section, only those groups most qualified to provide the type of
information sought were targeted. The second strategy was to develop the longest part of
the survey—animal species and diagnoses managed—such that respondents would
complete only those diagnoses relevant to their practice. This was done by administering an
online, web-based survey that used logic algorithms to route respondents only to certain
sections: If, for example, clinicians indicated that they work primarily with canine and feline
patients, they would complete only those diagnoses associated with those species.
With the above as an introduction and overview, the remainder of this report is
organized as follows: The next section explains the survey methodology by describing
questionnaire development, sampling, and survey administration. Then, key results are
presented, followed by a discussion of their implications for design and content of NAVLE.

4
II. SURVEY DEVELOPMENT
ICVA representatives met with NBME staff in December 2014 to discuss the components
and logistics of a high-quality professional practice analysis, to articulate its goals, and to
begin the planning process. The group then spent January and February 2015 developing a
detailed project plan. Project staff spent the next several months reviewing the relevant
literature to assist with developing the sections of the practice analysis survey instrument.
Key documents used to develop the survey included the NAVMEC (2013) report
“Enduring Contributions,” the OIE (World Organisation for Animal Health), and the current
NAVLE diagnoses lists, as well as activity codes and various demographic appraisals and
labor market reports published by the American Veterinarian Medical Association (AVMA).
Key publications used as reference materials are included in Appendix G.
A meeting was scheduled for May 11-12, 2015, to establish a panel of Subject Matter
Experts (SMEs) to outline and design various sections of the large survey instrument.
Appendix F lists the SMEs who participated in both the meeting and the activities leading
up to it. Key Project Staff (Appendix D) and SMEs collaborated via a secure online portal in
advance of the meeting to develop rough drafts of the content required for the different
survey sections.
Three groups of SMEs worked independently during the first day of the meeting refining
the content to be addressed in the individual sections of the survey. Each of the groups
presented their sections to the larger group on the second day of the meeting in order to
gather additional comments and further refine the content of the survey.
At the end of the meeting, draft lists of diagnoses by species and competencies were
shared with the whole team of SMEs via a secure online portal. The SMEs worked with
project staff over the next few months to finalize the content to be administered in the
pilot, after which a draft survey for pilot testing was provided to and approved by the ICVA
board in October 2015.

5
Survey Structure and Content
The final practice analysis survey consisted of three sections: Demographics and Practice
Characteristics, Species and Diagnoses, and Clinical and Professional Competencies. These
sections are described below in further detail. Each respondent was asked to evaluate
specific species and/or competency statements based on their responses to demographic
questions at the beginning of the survey. In the interest of brevity, a decision was made not
to include any foundational veterinary science components in the main survey instrument
but to address the basic veterinary sciences in a later supplemental activity.
Demographics and Practice Context
The purpose of the first section was to gather relevant individual participant
demographic and practice information in order to (1) route respondents to specific sections
of the questionnaire based on practice sector and particular types of species encountered;
(2) gather required information for validity, generalizability, and data interpretation, that is,
to verify that the sample is comparable to known US and Canadian veterinary
demographics; and (3) to compare groups of participants based on practice type, gender, or
other factors. The demographic questions included on the survey are included in Appendix
E.
Animal Species and Diagnoses
The purpose of the second section was to evaluate individual species and diagnoses in
order to estimate how often veterinarians in clinical practice encounter particular
diagnoses. This section of the survey contained a total of 1,034 diagnoses spanning 23
animal species. The species considered by the survey are listed in Table 1. Within each
species, diagnoses were further categorized by organ system (eg, cardiovascular,
gastrointestinal).

6
Table 1
Species and Other Animal Patients
Species Aquatics Hamsters Bovine Iguanas Camelids Mice Canine Ovine Caprine Pet Birds Cervidae Porcine Chelonians Poultry Chinchilla Primates Equine Rabbits Feline Rats Ferrets Snakes Guinea Pigs
Respondents were also asked to indicate the frequency with which they encountered a
diagnosis in the practice of veterinary medicine. The possible frequency response options
were Daily, Weekly, Monthly, Rarely, and Never.
The frequency with which a diagnosis was encountered serves as one indicator of the
importance of including a diagnosis in an assessment blueprint. However, it is also
necessary to consider the criticality of a diagnosis and its impact on a patient or client. That
is, a diagnosis may be common but have minimal impact because it is uncomplicated or
requires minimal or no treatment. Conversely, a rarely seen diagnosis can have enormous
consequences if it is missed (eg, rabies, foot and mouth disease, terminal malignancy).
Therefore, the study also obtained judgments about the criticality or level of importance of
each diagnosis for competent practice. As described later in this report in “IV. Supplemental
Practice Analysis Activities,” these judgments were obtained from an independent panel of
SMEs through a separate exercise.
Clinical and Professional Competencies
This section of the survey gathered data to determine the relative contribution of
distinct competencies for safe and effective practice. Competency models have been

7
proposed by various veterinary groups, but to date there is limited objective data to
support which clinical and professional competencies are required of veterinarians as they
perform their daily responsibilities.
This section consisted of 103 work activities spanning both clinical and professional
behaviors. The competencies were initially organized into eight groups based on similarity
of content.
Table 2
Major Categories of Clinical and Professional Behavior
Professional Activities Clinical Activities Communication Professionalism
Leadership Health Management Lifelong Learning One Health Concepts
Practice Management Epidemiology
Respondents were asked to indicate the response that most closely reflected the
frequency with which he or she performed each behavior as they practiced veterinary
medicine. The response options were Daily, Weekly, Monthly, and Quarterly or Less.
Respondents could also indicate “I do not do this.”
As with diagnoses, “frequency of performing an activity” is just one indicator of its
overall importance; it is also necessary to consider the impact of an activity on competent
performance. Therefore, these same 103 activities were later evaluated by an independent
panel of SMEs who were asked to rate each activity in terms of its criticality for veterinary
practice. This exercise is described in a later section, “IV. Supplemental Practice Analysis
Activities.”

8
III. SURVEY SAMPLING AND ADMINISTRATION
Pilot Survey
Sample
The AVMA provided project staff with a random sample of 200 veterinarians to use for
the pilot test. An additional 65 veterinarians volunteered to assist with piloting the survey.
The Practice Analysis Survey was piloted during the fall of 2015. This pilot was used to
confirm that the routing logic was working appropriately and to determine the amount of
time required to complete the survey. The programming logic of the survey assigned some
respondents to the diagnoses section and some others to the competencies section. For
those routed to the diagnoses section, the logic also ensured that they received questions
only about species relevant to their practice. Veterinarians who reported that they did not
work with animals directly were routed to respond to rate competencies only.
Analysis of the pilot responses showed that respondents were spending less time rating
competencies than originally estimated. Adjustments were then made to add the rating of
competencies to respondents who worked with two or fewer species. Some other minor
modifications were also made to some of the survey elements as a result of the pilot.
Live Survey Sampling and Administration
Canadian Sample
In March 2016, the Canadian Veterinarian Medical Association (CVMA) contacted 3,564
of its members to complete the survey on behalf of the ICVA. The sample size of CVMA
members was selected to provide stable estimates while reflecting the larger population
with respect to age, gender, location, and practice characteristics. The survey and all
communications (survey invitation and two reminders) were translated into French in order
to include French-speaking veterinarians.
US Sample
The AVMA provided contact information for 16,000 of its members. This sample
included 15,000 individuals selected to reflect the current population of veterinarians in the

9
United States with respect to age, gender, location, and practice characteristics. The AVMA
also provided an additional sample of 1,000 veterinarians who had graduated from
veterinary school in the last five years.
Administration
During late April 2016, the ICVA sent initial e-mail invitations to the sample alerting
participants that a survey would be sent out. In early May 2016, a link to the web-based
survey was sent. All respondents had until May 20, 2016, to complete the survey. During
this time frame, non-responders received up to three reminders.
The web-based survey used the responses from the demographic questions to tailor the
content to respondents’ areas of practice so no respondent was exposed to the whole
survey instrument. Any respondents who indicated that they did not work with animals
directly were asked to rate all of the competency statements.
Those respondents who worked with only one or two species were asked to rate the
diagnoses for those species, as well as the competency statements. Respondents who
worked with three or more species were randomly assigned either to complete one of those
species and the competency statements or to score diagnoses for those three species. The
survey logic randomly selected the species to present, if a respondent indicated that they
worked with more than three species. Since the competencies had not been part of any
previous practice analysis, there was particular interest in ensuring that that section was
completed by a very large and representative subsample; therefore, approximately half of
all respondents were randomly assigned to provide ratings on the competencies.
Including the responses from piloting activities, a total of 6,975 responses were
determined to be sufficiently complete to contribute to survey analysis. Additional
information about the sample and the response rate can be found in Table 3. The overall
usable response rate for this practice analysis was 35%, significantly higher than previous
practice analyses conducted for NAVLE.

10
Table 3 Response Rates for Practice Analysis Survey Including the Pilot Study
Respondent Group (N)
Canadian United States Total
Invitations Sent 3,564 16,265 19,829
Total Respondents 1,719 6,086 7,805
Usable Responses 1,385 5,590 6,975
Response Rate 39% 34% 35%
11
IV. SUPPLEMENTAL PRACTICE ANALYSIS ACTIVITIES
Some critical information required for developing the new NAVLE blueprint was not
gathered through the practice analysis survey. A few supplemental survey activities were
completed, and an additional SME meeting was convened to assist with finalizing
recommendations for NAVLE specifications. Those activities are described below.
Survey of Competency Criticality Activity
The purpose of the survey of competency criticality was to gather expert opinion on the
potential impact of the activities that appeared in the clinical and professional
competencies section of the practice analysis survey. This information would later be used
in conjunction with the frequency information obtained through the practice analysis
survey to determine content coverage for the new NAVLE competency-based blueprint.
Invitations to participate in this electronic survey were sent via e-mail in early July 2016
to 25 subject matter experts who are familiar with the ICVA and the purpose of the NAVLE.
This group consisted of current Examination Development Advisory Board (EDAB) members
and current ICVA board members.
Unlike the practice analysis survey, the competency statements were not presented in
groups based on similarity. The 103 competencies were broken into ten groups and were
randomly ordered within each group. The random ordering enabled us to present each
respondent with a unique sequence of competencies to reduce autocorrelation or order
effects.
Each respondent was asked to rate the criticality or importance of each competency to
the well-being of animal patients, clients, and people in the work area, as well as to public
health and environmental impact. Figure 1 shows the question and response options that
accompanied each group of competencies.

12
Figure 1. Criticality of competency question stem and response options
Card-sorting Activity
SMEs also engaged in a sorting exercise to judge the similarity among the 103 activities.
Similarity judgments served as the basis for a framework to organize the competencies. The
same 25 SMEs described above were also asked to evaluate each of the competency
statements and to sort them into meaningful groups based on perceived similarity. The
results of the sorting exercise were subjected to multivariate analyses (cluster analysis or
factor analysis) and SME review to develop a competency framework to serve as input for
the NAVLE blueprint.
Criticality of Diagnoses by Species Survey
In designing the NAVLE, the importance of including a particular diagnosis is impacted
by the frequency of that diagnosis in practice, as well as its criticality. The criticality of each
diagnosis was not evaluated during the initial survey. The supplemental survey activity was
used to evaluate the criticality of diagnosis by species to ensure that our veterinary practice
analysis study reflects the most accurate level of importance for each diagnosis potentially
encountered by an entry-level veterinarian.
A panel of 130 SMEs known to the ICVA was used for this activity. This group consisted
of current and former Examination Development Advisory Board (EDAB) members, item
writers, form review participants, and board members. Five additional SMEs in certain
species were contacted to provide an adequate number of respondents for each species.
The diagnoses presented in the survey were the same 1,034 diagnoses organized by the
23 species and organ systems evaluated as part of the practice analysis. Respondents were
13
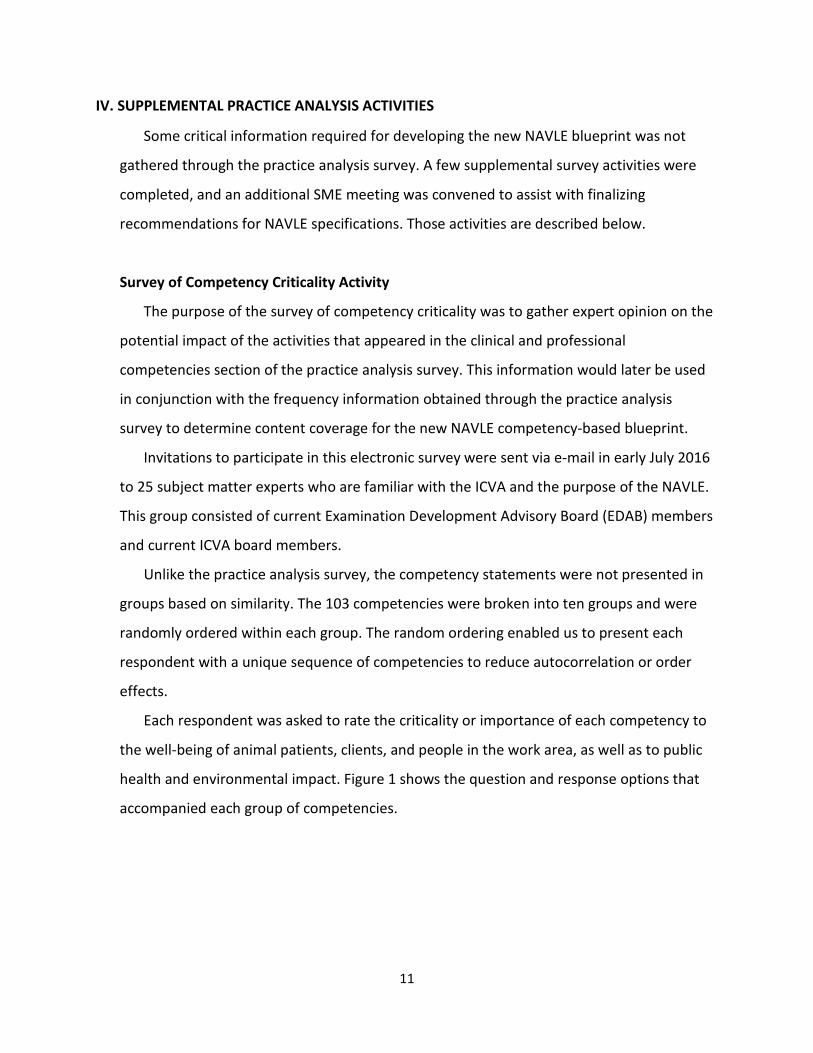
first asked to select the species for which they were comfortable providing an opinion; then
they were routed to evaluate diagnoses for some or all of their selected species and were
asked to rate the significance or consequence of each diagnosis. Significance or
consequence is defined by the potential public health impact,the economic magnitude of
overlooking a diagnosis or neglecting to make one, or an adverse patient outcome, such as
mortality. Figure 2 shows the question and response options that accompanied the
diagnoses and activities.
Figure 2. Criticality of diagnosis question stem and response options
Foundational Science Knowledge and Skills
There is a need to determine how much emphasis should be allocated to each of the
various foundational science disciplines covered on the NAVLE blueprint. However, we
recognize that obtaining judgments regarding the importance of different knowledge
domains is also a challenging and tedious activity that is prone to positive response bias. We
determined that the best way to address this would be to identify a group of SMEs currently
employed in academic settings who would be asked to review the foundational science
disciplines identified by SMEs in May of 2015.
ICVA worked with faculty at AVMA-accredited veterinary schools to identify a group of
SMEs who represented all of the foundational science disciplines. These individuals were
asked to evaluate the foundational science topics to determine how much content should
be allocated to each of the content areas on a future assessment to be used for licensure.

14
This foundational science information was partitioned into ten major academic
disciplines with two to four subtopics within each discipline. The list was formatted into a
hierarchical, two-stage questionnaire. At stage 1 respondents are asked to rate the
importance of each major discipline by assigning a percentage such that the percentages
sum to 100 across all 10 major disciplines. At stage 2 respondents indicate the percentages
for each of the specific topics within each major discipline.
June 2017 SME Meeting
An additional meeting of 11 SMEs was convened in Philadelphia, PA on June 7-8, 2017,
and was attended by most of those who participated in the SME meeting in May of 2015.
The primary objective of this meeting was to build consensus around the high-level
blueprint for the diagnosis and competency dimensions. This meeting was also used to flesh
out the details regarding what diagnoses to include on the NAVLE, the emphasis of the
diagnoses, and to further refine competencies.
The main activity of the first day of the meeting was to review and finalize the list of
diagnoses by species, looking for any duplicates or topics that could be combined. The SMEs
also were asked to evaluate and grade each of the diagnoses. The scale used for this activity
was “A” – Essential: include items covering this diagnosis on every test form; “B” –
Important: cover on some test forms; or “C” – Less important: keep on test blueprint but
not essential to include items on test forms.
The SMEs also reviewed the proposed draft blueprint for the diagnosis dimension. Each
SME was asked to provide input relative to what the content distribution should be on the
new NAVLE. SMEs were given the draft blueprint based on the data resulting from the
survey to assist them with this activity. SMEs felt that there was a missing category from
this proposed blueprint on the species dimension: multi-species or non-species specific.
The second day of the meeting focused on the clinical and professional competencies.
SMEs reviewed each of the competencies and were asked to add any content that may have
been missed during initial development. They were also asked to determine what
competencies can be assessed by the current multiple choice question (MCQ) assessment

15
format and what competencies may need to be addressed by other assessment item types
in the future.
At the conclusion of the June meeting, staff worked to incorporate revisions and
develop a final proposed blueprint based on the species, organ system, and the clinical and
professional competency domains. This blueprint was shared with the ICVA board on June
24, 2017.

16
V. RESULTS
Demographics
Experience
The purpose of a valid practice analysis is to provide a systematic approach to help
shape and enhance the current assessment process and examination for entry-level
veterinarians. The activities of those who were recently licensed are of particular interest
because they most accurately reflect the activities of newly licensed veterinarians.
However, data from more experienced veterinarians were also collected in order to
examine any shifts in practice that may have occurred either in the natural course of gained
experience for a veterinarian or as a result of any recent shifts in the veterinarian practice
environment. Recently licensed veterinarians were defined as those with up to 10 years of
experience. This included those who were initially licensed between 2006 and 2016
(n=2,709). Experienced veterinarians were defined as practitioners with more than 10 years
of experience or those who were initially licenced before 2006 (n=4,074). All analyses for
the main survey in this report will present results for recently licensed veterinarians,
experienced veterinarians, and the total group.
Table 4
Breakdown by Experience Classification
N %
Recently Licensed 2,709 38.8
Experienced Veterinarians 4,074 58.4
Missing License Year 192 2.8
Total 6,975
17
Gender
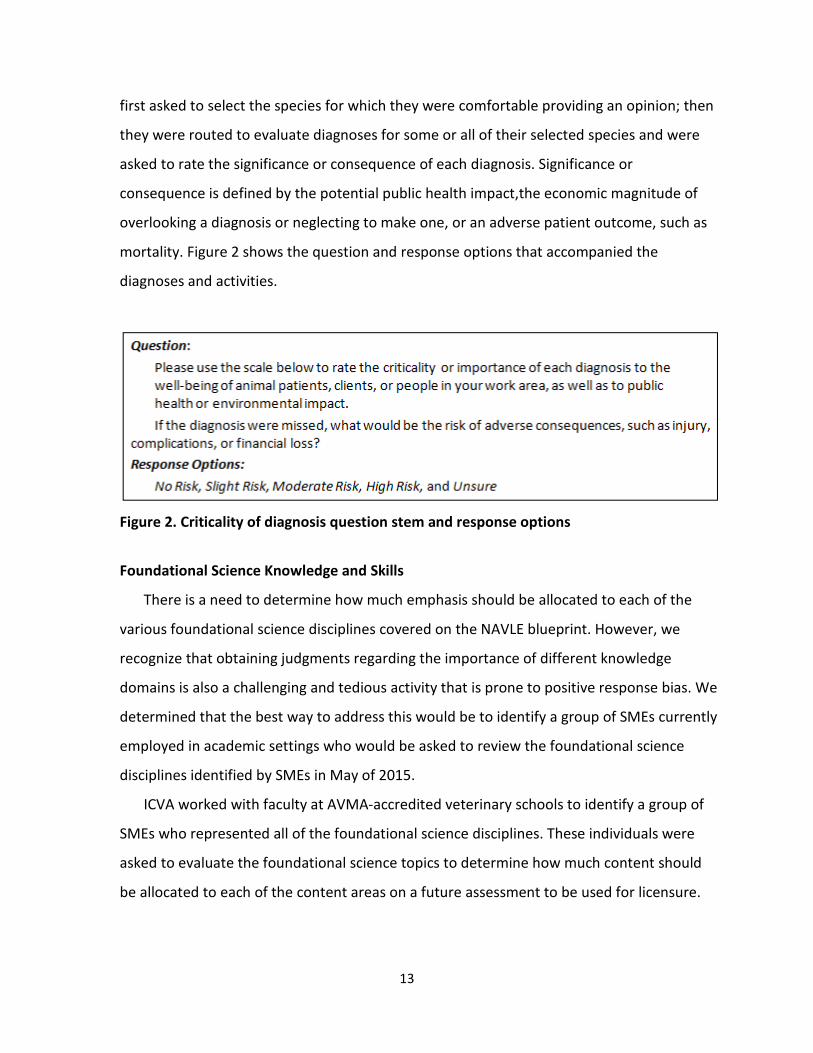
Among the 6,975 participants, the percentage of respondents specifying their gender as
male was 42%, the same as for the combined population of US and Canadian veterinarians.
Similar to the results of the 2013 US Veterinary Workforce Study conducted by the AVMA,
the percentage of female respondents was higher for those who were recently licensed.
Table 5
Gender by Experience Level
Gender (N)
Experience Level (%)
(N=6,963)
Experienced Veterinarians Recently Licensed Total
Female (4,015) 52 67 58
Male (2,902) 47 33 42
Different identity (1) 0 >1 >1
I prefer not to answer (45) 1 1 1

18
Age
The average age of respondents was 46 years. This is a slightly younger population than
reported in the workforce study report, for which the average age was 53. The age
distribution of the respondents is displayed in Figure 3. Please note that 267 individuals did
not respond to this question.
Figure 3. Age distribution of practice analysis respondents
553
1137
912
737 708 706
821
679
455
0
200
400
600
800
1000
1200
<30 30-34 35-39 40-44 45-49 50-54 55-59 60-64 65+
Num
ber o
f Res
pond
ents
Age Bracket

19
Racial or Ethnic Group
The last demographic question on the survey asked respondents to indicate the racial or
ethnic group with which they most closely identify. A response to this question was not
required, but approximately 5,100 respondents answered (Table 6). A majority of the total
group of respondents identified as white (89%). Any differences between experienced
veterinarians and those who were recently licensed were negligible for all categories.
Table 6
Race/Ethnicity by Experience Level
Experience Level (%) (N=5,085)
Total Race/Ethnicity Experienced
Veterinarians Recently Licensed
Asian 2 5 3
Black or African American 2 2 2
Middle Eastern/Arab <1 <1 <1
Hispanic, Latino, or Spanish origin 3 4 3
Native American or Alaskan Native 1 1 1
Native Hawaiian or Other Pacific Islander <1 <1 <1
White 90 87 88
Other 2 1 1
I prefer not to respond 3 3 3 Note: Respondents were instructed to select all that apply.

20
Practice Context Hours Worked
Overall, about 70% of respondents indicated that they worked 40 or more hours per
week. That percentage increases to 80% for all of those who were recently licensed and
88% for men who were recently licensed (Figure 4). For both the recent and the
experienced groups, women are more likely than men to work fewer than 40 hours per
week.
Figure 4. Hours worked by experience level and gender. Please note that the sum of the percentages may not add up to 100 due to rounding.

21
Employment Sector
Respondents estimated the amount of time they spent working in different
employment sectors (Table 7). Respondents who spent 75% or more of their time in one
sector were classified as having a primary employment sector. Private practice (58%) was
the most common employment sector, followed by academia (16%). The current
respondent group is similar to what was reported by the AVMA in 2015, which showed 60%
of US veterinarians in private practice. Those who were recently licensed were much more
likely to work in private practice (74%) when compared with experienced veterinarians
(50%).
Table 7 Practice Analysis Respondents by Primary Employment Sector
(N=6,975)
Experience Level (%)
Total
Primary* Employment Sector
Experienced Veterinarians
Recently Licensed
Private Practice 50 74 58
Academia 18 12 16
Commercial/Industry 10 3 8
Government 9 4 7
Other Sector 4 2 3
Multiple Sectors 4 2 3
Not for Profit 3 3 3
Military 1 2 1 *Primary indicated by 75% or more of time in a particular sector. The sum of the columns may not add up to 100 due to rounding.

22
Primary Clinical Practice Area
Overall, the majority of respondents (86%) indicated that they worked directly with
animals.Those who were recently licensed were more likely to work with animals (92%)
when compared with experienced veterinarians (83%). Those respondents who worked
with animals were asked to identify their primary clinical practice area (Table 8). Over half
of respondents (55%) described their practice as companion animals only.
Table 8 Clinical Practice Classification
(N=6,923)
Self-classification
Experience Level (%)
Total Experienced
Veterinarians Recently Licensed
Companion animals only 51 64 55
Food animals only 7 5 6
Mixed animals 13 17 15
Equine only 4 4 4
Other* 25 11 20 *Other responses were classified into Laboratory Animal, Regulatory, Academia, Pathology, Industry, Wildlife, and Other. The sum of the columns may not add up to 100 due to rounding.

23
Time Spent by Species
Respondents also provided estimates of the amount of time spent with different
species. Using the criteria outlined by the AVMA to classify veterinarians by species, 70% of
respondents were classified as predominantly or exclusively companion animal
veterinarians (Table 9). This is greater than the 59% reported by the AVMA.
Table 9
Classification of Respondents by Time Spent with Species
(n=5,944)
Experience Level (%)
Total Classification by time Experienced
Veterinarians Recently Licensed
Companion animal, exclusively 60 69 63
Companion animal, predominantly 6 7 7
Food animal, exclusively 9 5 8
Food animal, predominantly 4 3 3
Mixed animal 5 6 6
Equine 6 5 6
Not classified* 10 5 7 *More than half (60%) of those unclassified respondents spent the majority of their time with laboratory animals. An additional 15% of the unclassified respondents spent the majority of their time with species not listed on the questionnaire.
Summary of Demographic and Practice Characteristics Based on a comparison of the present data to population estimates from other sources
(eg, AVMA, other workforce studies), the sample of respondents for the practice analysis is
generally representative and comparable to the population of veterinarians in terms of
gender, employment sector, and clinical practice areas. The present sample differs from the
population of veterinarians in some respects, in that it includes a higher proportion of

24
younger veterinarians, owing in part to the intentional over-sampling of more recent
graduates. This, in turn, may affect other statistics such as the proportion who work
primarily with companion animals.

25
Practice Analysis Activities Related to Species and Diagnoses Managed
Species Classification
Clinical activities were grouped by species and organ system within species, for most
species. Similar species were grouped together for the purposes of analyses. Table 10
presents the way in which species were combined and the number of diagnoses for each
species group.
Table 10
Species Groups for Analyses
Species Group Included Species
Number of Diagnoses
Rated Canine Canine 172
Equine Equine 157
Feline Feline 142
Other Small Animals Chinchillas, Ferrets, Guinea Pigs, Hamsters, Primates, Rabbits, Rats, Mice
108
Bovine Bovine 107
Camelids/Cervidae Camelids, Cervidae 89
Porcine Porcine 76
Ovine/Caprine Ovine, Caprine 53
Pet Birds Pet Birds 44
Reptiles Iguanas, Snakes, Chelonians 37
Poultry Poultry 36
Aquatics Aquatics 13

26
Table 11 shows the number of respondents per species for the criticality evaluation
exercise that occurred in the spring of 2017. The average criticality for each species group is
also provided. Consideration of the criticality information for each diagnosis was part of the
SME exercise for the June 7-8 meeting. SMEs used this information in conjunction with the
frequency information to evaluate the individual diagnoses within each organ system to
further refine the species diagnoses with the goal of setting targets within organ systems.
Note how criticality scores were relatively consistent across species.
Table 11
Number of Respondents and Average Criticality Ratings by Species Group
Species Group Number of
Respondents Average
Criticality Canine 23 3.3
Feline 26 3.3
Equine 13 3.4
Bovine 21 3.1
Porcine 8 3.1
Other Small Animals 6 3.1
Ovine/Caprine 10 3.3
Camelids/Cervidae 4 2.9
Pet Birds 5 3.1
Poultry 5 3.2
Reptiles 4 3.1
Aquatics 2 3.3 Note: Criticality ratings range from 1 to 4, with 4 being the “most critical”

27
Clinical and Professional Competencies
Table 12 Competency Domains Resulting from the Card-sorting Activity
Major Domain Number of
Competencies Domain Number of
Competencies
Clinical Practice 28 Clinical Practice 28
Communication 31 Communications with Clients 19
Communications with Veterinary and Other Professionals
12
Professionalism, Practice Management, and Wellness 20
Professional Development and Lifelong Learning
9
Veterinary Practice Management 11
Preventive Medicine and Animal Welfare 24
Animal Welfare Issues and Concerns
6
Environmental Health and Safety 8
Veterinary Public Health 10
28
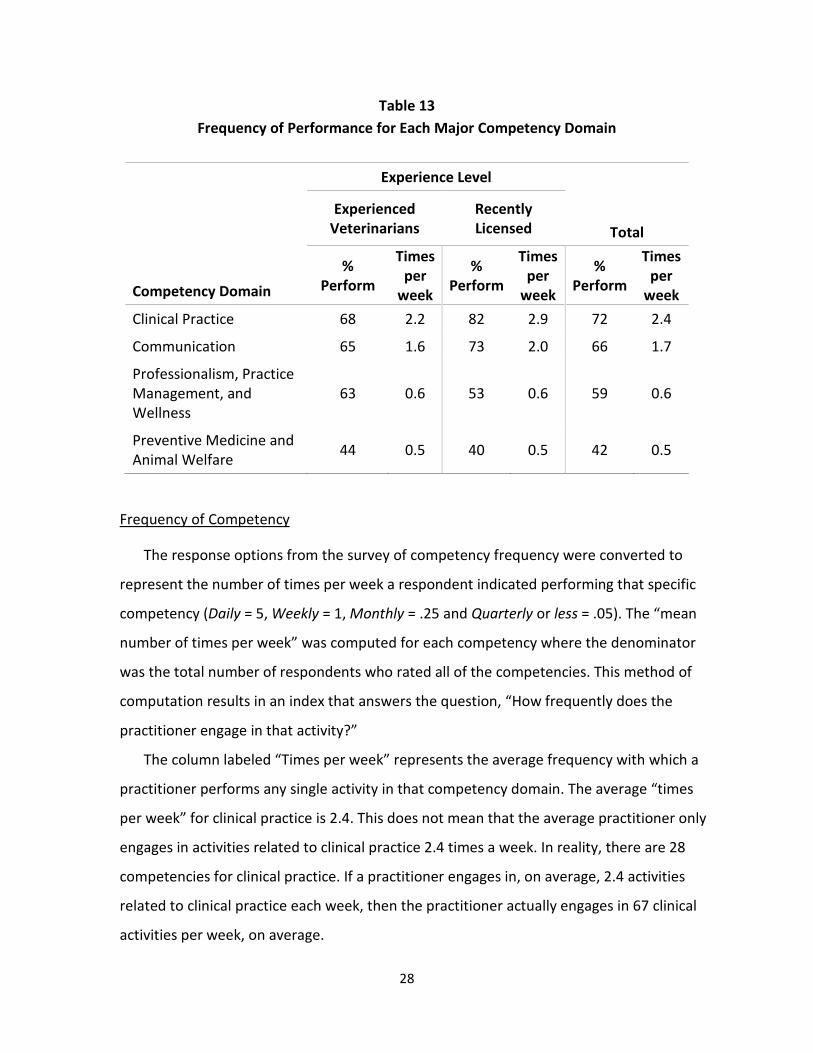
Table 13 Frequency of Performance for Each Major Competency Domain
Experience Level
Total
Competency Domain
Experienced Veterinarians
Recently Licensed
% Perform
Times per
week
% Perform
Times per
week
% Perform
Times per
week Clinical Practice 68 2.2 82 2.9 72 2.4
Communication 65 1.6 73 2.0 66 1.7
Professionalism, Practice Management, and Wellness
63 0.6 53 0.6 59 0.6
Preventive Medicine and Animal Welfare 44 0.5 40 0.5 42 0.5
Frequency of Competency
The response options from the survey of competency frequency were converted to
represent the number of times per week a respondent indicated performing that specific
competency (Daily = 5, Weekly = 1, Monthly = .25 and Quarterly or less = .05). The “mean
number of times per week” was computed for each competency where the denominator
was the total number of respondents who rated all of the competencies. This method of
computation results in an index that answers the question, “How frequently does the
practitioner engage in that activity?”
The column labeled “Times per week” represents the average frequency with which a
practitioner performs any single activity in that competency domain. The average “times
per week” for clinical practice is 2.4. This does not mean that the average practitioner only
engages in activities related to clinical practice 2.4 times a week. In reality, there are 28
competencies for clinical practice. If a practitioner engages in, on average, 2.4 activities
related to clinical practice each week, then the practitioner actually engages in 67 clinical
activities per week, on average.

29
Similar to the previously presented results, those who were recently licensed are more
likely to perform activities related to clinical practice (82%) than are more experienced
veterinarians (68%). The same relationship holds with respect to competencies related to
communication. Activities within the other two competency domains were performed with
considerably less frequency by both experienced veterinarians and those who were recently
licensed.
Table 14
Criticality of Competencies by Domain
Major Domain Average
Criticality Clinical Practice 3.5
Communication 3.1
Professionalism, Practice Management, and Wellness 2.3
Preventive Medicine and Animal Welfare 3.2
Criticality of Competency
Average criticality ratings (ranging from 1 to 4) show that the competencies comprising
the clinical practice domain are viewed as the most critical (average = 3.5). Closely following
the clinical practice domain are the preventive medicine and animal welfare (average = 3.2)
and the communication (average = 3.1) domains. Professionalism, practice management,
and wellness competencies were considered to be less critical (average = 2.3).

30
VI. IMPLICATIONS FOR TEST DESIGN/TEST BLUEPRINT
Based on the activities described above, project staff developed a draft for the future
NAVLE blueprint. This draft blueprint can be described as “problem-based,” where each test
item corresponds to a particular problem that a veterinarian is called upon to address. Most
problems can be described in terms of three facets: (1) the diagnosis presented in the item
and the species within which it occurs (eg, equine aspergillosis), (2) the primary competency
required to solve that problem (eg, diagnostic acumen; communication skills), and (3) the
requisite foundational science knowledge (eg, pathology).
Accordingly, the proposed blueprint consists of three dimensions: diagnoses (nested
within species), competency, and foundational science. Every test item can receive three
codes, one for each dimension. While it is often possible to give an item more than one
code for each dimension, as a practical matter in dealing with the mechanics of building test
forms, we need to assign it just one primary code.
Based on the results of the practice analysis survey and subsequent activities, project
staff drafted a blueprint for two of the three dimensions: diagnosis and competency. This
draft blueprint was reviewed and further refined by SMEs and ICVA board members during
meetings held in June 2017. These deliberations resulted in a final high-level blueprint that
identifies the major categories for each dimension and the amount of emphasis (number of
test items) allocated to each category.
Proposed Blueprint for Species
As a consequence of the practice analysis, early drafts of the blueprint for species
consisted only of specific classes of animals. Two concerns were expressed about this early
draft. The first concern was that the blueprint could not accommodate test items that were
about diagnoses that affect multiple species or test items that were not about any
particular disease or species (eg, items about basic sciences or disease outbreaks). After
receiving additional feedback from SMEs and the ICVA board, this shortcoming was
addressed by adding a category called “non-species specific.”

31
The second potential limitation was that the species dimension of the newly proposed
blueprint did not explicitly include a separate category for public health. Since public health
has its own category on the current blueprint, this was considered a problem. However, it
was explained that test items about public health would get covered under the competency
dimension. In particular, such content is covered by the domains called “veterinary public
health” and “environmental health and safety,” both of which fall under the major domain
of “preventive medicine and animal welfare.” In addition, the major competency domain of
“clinical practice” includes activities related to public health. For example, a test item about
a disease outbreak affecting commercial layer flocks would get coded under the
competency dimension of “preventive medicine and animal welfare” and under “poultry.”
The addition of the “non-species specific” category to the “species” dimension also helped
address this problem in that those public health items that are trans-species can be coded
under “non-species specific.”
Topic weights for each species category were based on multiple sources of empirical
information and SME judgements, including: the percentage of veterinarians who work with
each species, the percentage of time a veterinarian spends with each species, the frequency
with which each diagnosis is encountered in practice, and the criticality of each diagnosis. In
addition, the weights for the current test blueprint were also considered. SMEs were asked
to integrate this information and assign weights as part of a two-stage exercise completed
during the meeting in June 2017. Project staff considered all of these results and proposed
the weights as summarized in the right-most column of Table 15 and in Appendix A.
Other notable adjustments were to combine Camelids and Cervidae into one category,
similar to how Ovine and Caprine are currently combined, and to separate the current
“other small animal” category into two separate groups: mammals and reptiles. The new
blueprint will also incorporate a new content area to address aquatics.

32
Table 15
Current and Recommended Blueprint for Species
Species Current
Blueprint (%)
Recommendation Based on Practice
Analysis Results (%)
Recommendation Based on SME Activity in June
2017 (%) Final Blueprint
(%) Canine 23.3 26.7 26 25.6 Feline 22.7 25 25 24.3 Equine 15.7 15 15 14.7 Bovine 15 13.3 13.7 13.3 Porcine 5.7 5 4.8 5.0 Other Small Animals 3.3 3.3 3.6 3.3 Ovine/Caprine 3.3 3.3 3.3 3.3 Camelids/Cervidae 1.4 1.7 1.8 1.7 Pet Birds 3.3 1.7 2.3 2.3 Poultry 2 1.7 2 2 Reptiles N/A 1.7 1.5 1.5 Fish N/A 1.7 1 1 Non-Species Specific 2 N/A N/A 2
Proposed Blueprint for Competencies
Topic weights for the competency domains were based on a combination of empirical survey results and SME decisions. The specific sources of empirical information included the frequency with which the competency activity is performed and the criticality rating. Given those results, SMEs completed a competency rating activity during the June 2017 meeting. In addition, weights from the current test blueprint were estimated. These estimates were gross approximates in some instances because the current blueprint is not based on the same competencies as the proposed new blueprint. Based on these various sources of information and on the ability of the test-item bank to support each content area, staff proposed the blueprint topic weights summarized in the right-most column of Table 16 and in Appendix B.
The most notable difference between the proposed new blueprint and the results of the practice analysis and SME decisions is for the “communication” domain. At present, and for the near future, the NAVLE is a multiple-choice test. It is generally recognized that communication and related skills are not adequately assessed with multiple-choice items; thus it was necessary to limit the number of test items allocated to that domain for the near future. The ICVA Board

33
of Directors has undertaken an exploratory effort to ensure that such skills are addressed as part of the licensure process in the years ahead.
Table 16
Competency Specifications
Competency Domain Current
Blueprint
Practice Analysis
Proposed %
SME Proposed
% Final %
Clinical Practice* 88 49 53 70
Data Gathering and Interpretation 43 25 __ 35
Health Maintenance and Prevention 43 24 __ 35
Communication 4 37 27 8
Communication with Clients — 25 17 5 Communication wth Veterinary and Other Professionals — 12 10 3 Professionalism, Practice Management, and Wellness 3 7 7 7 Professional Development and Lifelong Learning — 3 4 3
Veterinary Practice Management — 4 3 4
Preventive Medicine and Animal Welfare 5 7 13 15
Environmental Health and Safety — 3 4 5
Veterinary Public Health — 2 3 4
Animal Welfare Issues and Concerns — 2 6 6 *Clinical Practice was not subdivided at the time of the June 2017 SME meeting
34
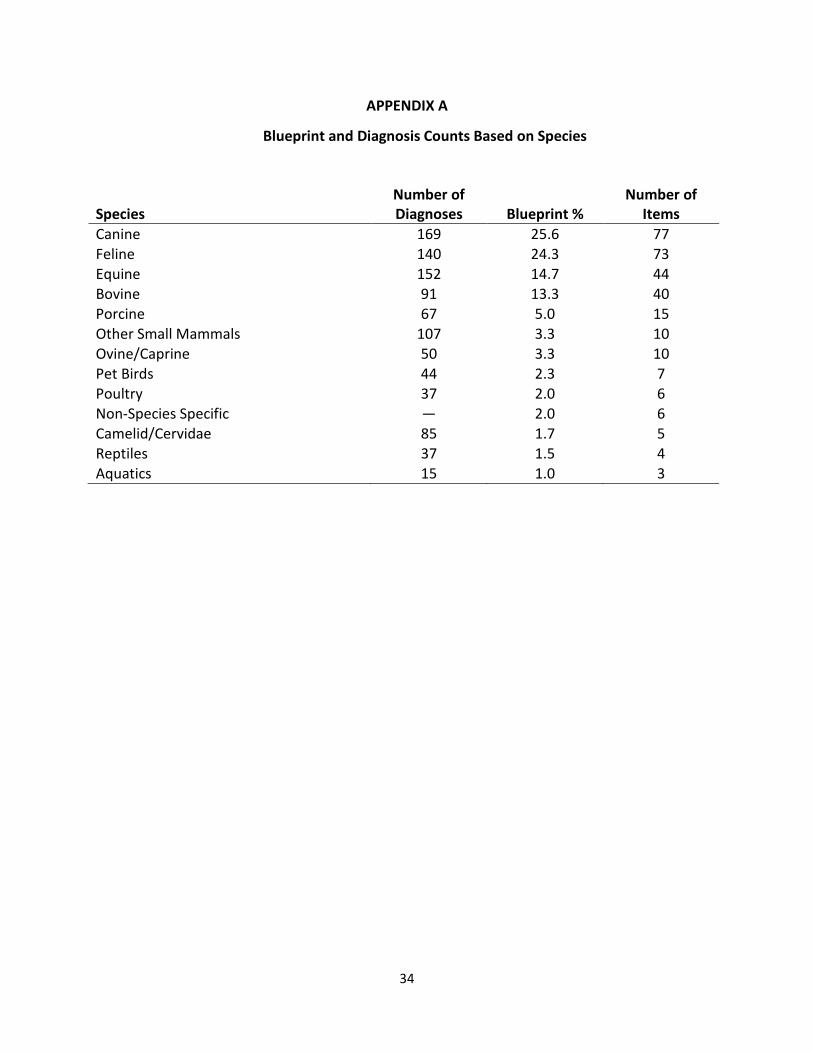
APPENDIX A
Blueprint and Diagnosis Counts Based on Species
Species Number of Diagnoses Blueprint %
Number of Items
Canine 169 25.6 77 Feline 140 24.3 73 Equine 152 14.7 44 Bovine 91 13.3 40 Porcine 67 5.0 15 Other Small Mammals 107 3.3 10 Ovine/Caprine 50 3.3 10 Pet Birds 44 2.3 7 Poultry 37 2.0 6 Non-Species Specific — 2.0 6 Camelid/Cervidae 85 1.7 5 Reptiles 37 1.5 4 Aquatics 15 1.0 3

35
APPENDIX B
Blueprint Based on Competencies
Competency Domain Number of
Competencies Blueprint
% Number of Items
Clinical Practice 38 70 210 Data Gathering and Interpretation 19 35 105 Health Maintenance and Prevention 19 35 105 Communication 33 8 24 Communication with Clients 21 5 15 Communication with Veterinary and other Professionals 13 3 9
Professionalism, Practice Management, and Wellness 21 7 21 Professional Development and Lifelong Learning 9 3 9 Veterinary Practice Management 21 4 12 Preventive Medicine and Animal Welfare 26 15 45 Environmental Health and Safety 8 5 15 Veterinary Public Health 11 4 12 Animal Welfare Issues and Concerns 7 6 18

36
APPENDIX C
Foundational Science Coding
1. Gross Anatomy 2. Microscopic Anatomy (Histology) 3. Embryology 4. Cellular & Molecular Biology 5. Cytology 6. Hematology 7. Immunology 8. Genetics 9. Physiology 10. Neurology 11. Endocrinology 12. Bacteriology 13. Virology 14. Mycology 15. Pathology 16. Parasitology 17. Pharmacology 18. Toxicology 19. Nutrition/Metabolism 20. Biochemistry 21. Epidemiology/Biostatistics

37
APPENDIX D
Key Project Staff
While numerous ICVA Board and Committee members contributed to the project, key project
staff included the following individuals from ICVA and NBME:
ICVA Heather Case, DVM, MPH, DACVPM, CAE, advisor and veterinary liaison Gary Gackstetter, DVM, MPH, PhD, DACVPM, Co-Principal Investigator
NBME Amy Baker, Analyst Melissa Billings, Editorial Consultant Amy Crowe, Project Assistant Gerry Dillon, PhD, NBME Advisor Melissa Dudlick, Editorial Consultant Janine Hawley, Project Director Janet Mee, Measurement Consultant and Data Analyses Mark Raymond, PhD, Co-Principal Investigator

38
APPENDIX E
NAVLE Practice Analysis: Demographic and Practice Questions
Introduction to demographic questions necessary for analyses: The first section of this survey is designed to gather information that will facilitate meaningful comparisons among respondents. Your responses to the following questions will also help to make sure that veterinarians with different backgrounds are adequately represented in the results. 1. How do you describe yourself?
o Female o Male o Different identity o I prefer not to answer.
2. In what year were you born? • Drop down list from 1910 - 2000
3. Are you currently licensed to practice veterinary medicine? o Yes → Go to question 5, then question 7 o No → Go to question 4 o Unsure
4. Have you ever been licensed to practice veterinary medicine? o Yes → Go to question 5, then question 6 o No o Unsure
5. In what year did you first obtain your license to practice veterinary medicine? o Drop down list from 1930 – 2015
6. In what year did you cease to have a license to practice veterinary medicine?
o Drop down list from 1930 – 2015 7. Are you currently certified by a specialty board?
o Yes o No

39
8. About how many hours per week do you work in veterinary medicine? • Less than 20 • 20 – 39 • 40 or more • not presently employed in veterinary medicine
9. Where do you do most of your work as a veterinarian?
o Canada o United States o Outside of North America
10. In which of the following regions do you do most of your work as a veterinarian? o Canada
o Alberta o British Columbia o Manitoba o New Brunswick
o Newfoundland and Labrador o Northwest Territories o Nova Scotia o Ontario
o Prince Edward Island o Quebec o Saskatchewan o Yukon
o United States
o New England (Connecticut, Maine, Massachusetts, New Hampshire, Rhode Island, Vermont)
o Middle Atlantic (New Jersey, New York, Pennsylvania) o East North Central (Indiana, Illinois, Michigan, Ohio, Wisconsin) o West North Central (Iowa, Kansas, Minnesota, Missouri, Nebraska, North Dakota,
South Dakota) o South Atlantic (Delaware, District of Columbia, Florida, Georgia, Maryland, North
Carolina, South Carolina, Virginia, West Virginia) o East South Central (Alabama, Kentucky, Mississippi, Tennessee) o West South Central (Arkansas, Louisiana, Oklahoma, Texas) o Mountain (Arizona, Colorado, Idaho, Montana, Nevada, New Mexico, Utah,
Wyoming) o Pacific (Alaska, California, Hawaii, Oregon, Washington) o Caribbean Territories o Pacific Territories
o Outside of North America
o Africa o Australia, New Zealand o Asia
40
o Caribbean o Central America o Europe o Middle East o South America
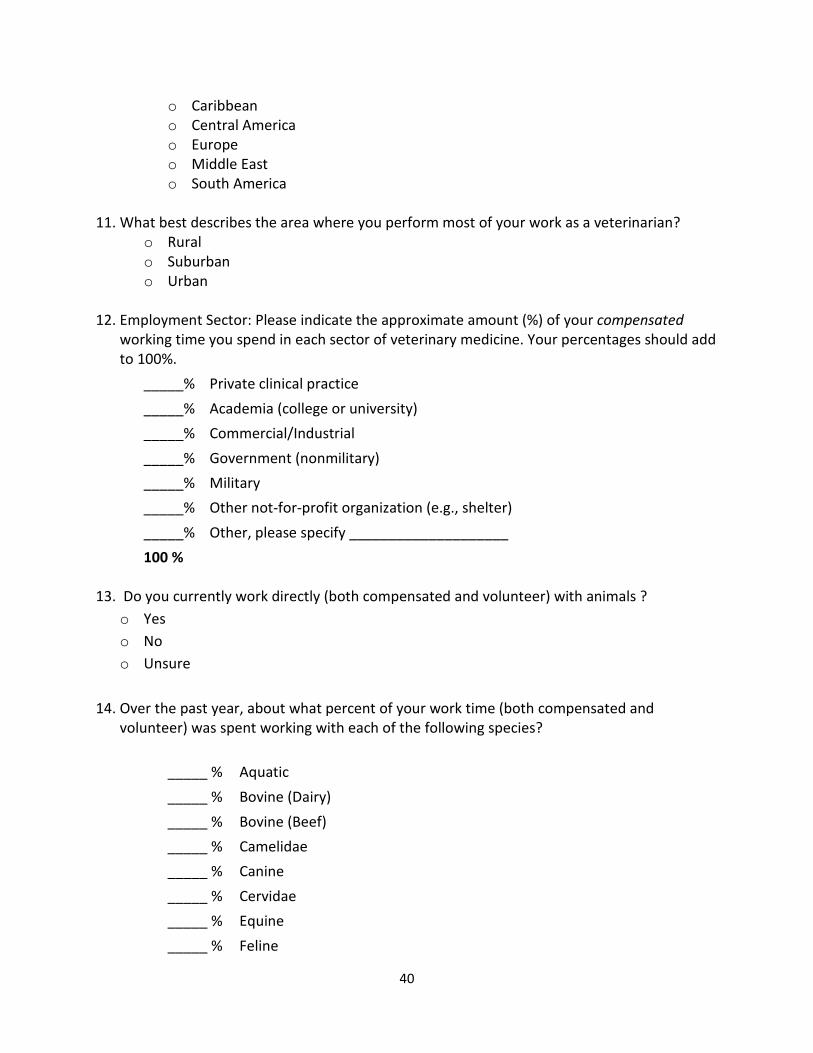
11. What best describes the area where you perform most of your work as a veterinarian?
o Rural o Suburban o Urban
12. Employment Sector: Please indicate the approximate amount (%) of your compensated
working time you spend in each sector of veterinary medicine. Your percentages should add to 100%.
_____% Private clinical practice _____% Academia (college or university) _____% Commercial/Industrial _____% Government (nonmilitary) _____% Military _____% Other not-for-profit organization (e.g., shelter) _____% Other, please specify ____________________
100 % 13. Do you currently work directly (both compensated and volunteer) with animals ?
o Yes o No o Unsure
14. Over the past year, about what percent of your work time (both compensated and
volunteer) was spent working with each of the following species?
_____ % Aquatic _____ % Bovine (Dairy) _____ % Bovine (Beef) _____ % Camelidae _____ % Canine _____ % Cervidae _____ % Equine _____ % Feline

41
_____ % Laboratory animals _____ % Other small animals (e.g., rabbits, ferrets,
hamsters, mice, Guinea pigs, snakes, iguanas, primates)
_____ % Ovine/Caprine _____ % Pet birds _____ % Porcine _____ % Poultry _____ % Wildlife not specified above _____ % Other _______________(specify) _____ % Other _______________(specify)
100 %
15. Please select all of the species with which you have worked in the past year. � Chinchillas � Ferrets � Fish � Guinea Pigs � Hamsters � Iguanas � Primates � Rabbits � Rats/Mice � Snakes � Turtles
Research Question The following questions will be used for research purposes only. Responses will be analyzed in an aggregated format only. What is your race or ethnic origin? Select all that apply.
o Asian o Black or African American o Middle Eastern / Arab o Hispanic, Latino or Spanish origin o Native American or Alaskan Native o Native Hawaiian or Other Pacific Islander o White o Not listed, Other __________________________ o I prefer not to respond

42
APPENDIX F
NAVLE Practice Analysis Subject Matter Expert Meeting May 11-12, 2015
Dr. Heather Case, ICVA CEO Dr. Benjamin J. Darien, EDAB, Equine Dr. Gary Gackstetter, ICVA Board, Public Health Dr. William B. Epperson, AVMA COE, Pathobiology/Population Medicine Dr. Cary Hashizume, Canadian NEB, Companion Animal Dr. Norman LaFaunce, EDAB, Bovine/Food Animal Dr. Robert Lester, AAVMC, Leadership, Communication, and Practice Management Dr. Katie Steneroden, EDAB, Public Health Dr. Rick Tubbs, EDAB, Swine Dr. Helen Tuzio, EDAB, Feline Dr. Julia Wilson, AAVSB, Equine
November 11, 2015 Focus Group Dr. Ken Andrews, Meeting Facilitator Dr. Heather Case, ICVA CEO Dr. Kristin Chaney, AAVMC Dr. Vito DelVento, AAVSB Dr. Gary Gackstetter, ICVA Board/PA Co-Principal Investigator Dr. Marty Greer, AAVSB Dr. Lizette Hardie, AAVMC Dr. Kent Hecker, AAVMC Dr. Jennifer Hodgson, AAVMC Dr. Jan Ilkiw, AAVMC Dr. John King, AAVSB Dr. Mark Nunez, AAVSB Dr. Jan Robinson, AAVSB
NAVLE Practice Analysis Subject Matter Expert Meeting June 7-8, 2017
Dr. Heather Case, ICVA Dr. Benjamin J. Darien, EDAB, Equine Dr. Gary Gackstetter, ICVA Board, Public Health Dr. Cary Hashizume, Canadian NEB, Companion Animal Dr. Norman LaFaunce, EDAB, Bovine/Food Animal Dr. Robert Lester, AAVMC, Leadership, Communication, and Practice Management Dr. Karen Rosenthal, Avian/Exotics/Reptiles

43
Dr. Katie Steneroden, EDAB, Public Health Dr. Rick Tubbs, EDAB, Swine Dr. Helen Tuzio, EDAB, Feline Dr. Patricia Wakenell, Poultry Dr. Julia Wilson, AAVSB, Equine
Card-sorting Participants Dr. Rebecca Archer, Canadian NEB Dr. Jon Betts, ICVA Board, Companion Animal Dr. Mike Chaddock, ICVA Board, Public Health/Food Animal Dr. Kristin Chaney, AAVMC, Equine Dr. Bob Cherenson, ICVA Board, Bovine/Small Ruminant/Cervidae Dr. Allan Corber, Feline/Canine/Companion Animal Dr. Benjamin Darien, Equine Dr. Cheryl Dhein, Companion Animal/Pet Bird Dr. Julie Fixman, Companion Animal Dr. Gary Gackstetter, ICVA Board, Public Health Dr. Meg Glattly, CVAGC Chair, Companion Animal Dr. Marty Greer, AAVSB, Canine Dr. Cary Hashizume, Canadian NEB, Companion Animal Dr. Jay Hedrick, ICVA Board, Companion Animal Dr. Mark Hilton, EDAB, Bovine Dr. Jennifer Hodgson, Microbiology Dr. Norman LaFaunce, EDAB, Bovine/Food Animal Dr. Karen Lehe, ICVA Board, Porcine Dr. Bruce Louderback, ICVA Board, Companion Animal Dr. Fernando Marques, EDAB, Equine Dr. Katie Steneroden, EDAB, Public Health Dr. Rick Tubbs, EDAB, Swine Dr. Jack Wilson, ICVA Board, Companion Animal
Basic Science Topic Weighting Activity Participants
Dr. Marie-Odile Benoit-Biancamano, Pathology Dr. Guraa Bergkvist, Anatomy Dr. John Bolton, Large Animal Medicine Dr. Jennifer Burr, Pharmacology Dr. Pete Christopherson, Pathology Dr. David Cross, Anatomy Dr. John Dodam, Physiology & Pharmacology Dr. Kathy Earnest-Koons, Microbiology Dr. Julie Engiles, Microbiology

44
Dr. Virginia Fajt, Pharmacology Dr. Mat Gerard, Anatomy Dr. Kenitra Hammac, Microbiology Dr. James Herman, Physiology Dr. Jennifer Hodgson, Microbiology Dr. Megan Jacob, Microbiology Dr. Gagandeep Kaur, Physiology Dr. Wael Khamas, Anatomy Dr. Martha Littlefield, Anatomy Dr. Puliyur Mohan Kumar, Physiology Dr. Sheba Mohan Kumar, Pharmacology Dr. Mandy O’Hara, Pathology Dr. Leticia Reyes, Microbiology Dr. Wayne Schwark, Pharmacology Dr. Teresa Southard, Pathology Dr. Greg Weiland, Pharmacology

45
APPENDIX G
References
Standard Definitions. American Association for Public Opinion Research Web site. http://www.aapor.org/AAPOR_Main/media/publications/Standard-Definitions20169theditionfinal.pdf. Revised 2016. Accessed December 19, 2016.
Market Research Statistics: U.S. Veterinarians 2015. American Veterinary Medical Association Web site. https://www.avma.org/KB/Resources/Statistics/Pages/Market-research-statistics-US-veterinarians.aspx. Accessed December 19, 2016.
American Veterinary Medical Association. AVMA Job Analysis Study for the Step 3 Examination (Basic and Clinical Science Exam) for the ECFVG Program (Rep.). 2012. Retrieved from https://www.avma.org/ProfessionalDevelopment/Education/Foreign/Documents/JobTaskAnalysis.pdf.
Andrews K. Roadmap for Veterinary Medical Education in the 21st Century: Responsive, Collaborative, Flexible (Rep.). North American Veterinary Medical Education Consortium. 2011. Retrieved from http://www.aavmc.org/data/files/navmec/navmec_roadmapreport_web_single.pdf.
Royal Veterinary College. Bachelor of Veterinary Medicine Day One Skills (Rep.). London: Royal Veterinary College. 2007. Retrieved from http://www.live.ac.uk/Media/LIVE/PDFs/day_one_handbook.pdf.
Statistics. Canadian Veterinary Medical Association Web site. http://www.canadianveterinarians.net/media-centre/statistics. Accessed December 20, 2016.
American Association of Equine Practioners. Core Competencies for New Veterinary School Graduates in Equine Practice (Rep.). (n.d.).
DeHaven R, El-Sukhon SN, Lekeux P, et al. OIE Day One Veterinary Competencies . World Organisation for Animal Health. 2012. http://www.oie.int/fileadmin/Home/eng/Support_to_OIE_Members/Vet_Edu_AHG/DAY_1/DAYONE-B-ang-vC.pdf. Accessed on April 6, 2015.
Dicks MR, Bain B, Knippenberg R. 2015 AVMA Report on the Market for Veterinarians (Veterinary Economics Division, Rep.). American Veterinary Medical Association. 2015.

46
Dicks M, Dall T, Storm M, Gallo P, Koory R, Gillula J, et al. 2013 U.S. Veterinary Workforce Study: Modeling Capacity Utilization (Rep.). The Center of Health Workforce Studies. 2013.
Kane MT. The validity of licensure examinations. American Psychologist. 1982;37: 911-918. North American Veterinary Medical Education Consortium. NAVMEC Final Report Roadmap for the Future of Veterinary Medical Education. http://www.aavmc.org/NAVMEC/NAVMEC-Final-Report-Roadmap-for-the-Future-of-Veterinary-Medical-Education.aspx. Accessed December 15, 2014. North American Veterinary Medical Education Consortium. NAVMEC Enduring Contributions. 2013. http://www.aavmc.org/NAVMEC-Future/NAVMEC-Contributions.aspx. Accessed December 15, 2014. A North American Study of the Entry-Level Veterinary Practitioner (Rep.). National Board of Veterinary Medical Examiners. 2003.
Raymond MR, Luecht RL. Licensure and certification testing. In: KF Geisinger ed. APA Handbook of Testing and Assessment in Psychology. Washington, DC: American Psychological Association; 2013;391-414.