Embed Size (px)
Citation preview
North African Jewish and non-Jewish populations formdistinctive, orthogonal clustersChristopher L. Campbella,1, Pier F. Palamarab,1, Maya Dubrovskyc,d,1, Laura R. Botiguée, Marc Fellousf, Gil Atzmong,h,Carole Oddouxa, Alexander Pearlmana, Li Haoi, Brenna M. Hennj, Edward Burnsg, Carlos D. Bustamantej, David Comase,Eitan Friedmanc,d, Itsik Pe’erb, and Harry Ostrera,h,2
Departments of aPathology, gMedicine, and hGenetics, Albert Einstein College of Medicine, Bronx, NY 10461; bDepartment of Computer Science, ColumbiaUniversity, New York, NY 10027; cSusanne Levy Gertner Oncogenetics Unit, Danek Gertner Institute of Human Genetics, Chaim Sheba Medical Center, Tel-Hashomer 52621, Israel; dSackler School of Medicine, Tel Aviv University, Ramat Aviv 69978, Israel; eInstitute of Evolutionary Biology, Consejo Superior deInvestigaciones Cientificas, Universitat Pompeu Fabra, 08003 Barcelona, Spain; fCochin Institute, Institut National de la Santé et de la Recherche Médicale 567,75014 Paris, France; iCenter for Genome Informatics, New Jersey Medical School, University of Medicine and Dentistry of New Jersey, Newark, NJ 07101;and jDepartment of Genetics, Stanford University, Stanford, CA 94305
Edited* by Arno G. Motulsky, University of Washington, Seattle, WA, and approved July 3, 2012 (received for review March 23, 2012)
North African Jews constitute the second largest Jewish Diasporagroup. However, their relatedness to each other; to European,Middle Eastern, and other Jewish Diaspora groups; and to theirformer North African non-Jewish neighbors has not been welldefined. Here, genome-wide analysis of five North African Jewishgroups (Moroccan, Algerian, Tunisian, Djerban, and Libyan) andcomparison with other Jewish and non-Jewish groups demon-strated distinctive North African Jewish population clusters withproximity to other Jewish populations and variable degrees ofMiddle Eastern, European, and North African admixture. Twomajor subgroups were identified by principal component, neigh-bor joining tree, and identity-by-descent analysis—Moroccan/Algerian and Djerban/Libyan—that varied in their degree of Euro-pean admixture. These populations showed a high degree of en-dogamy and were part of a larger Ashkenazi and Sephardic Jewishgroup. By principal component analysis, these North Africangroups were orthogonal to contemporary populations from Northand South Morocco, Western Sahara, Tunisia, Libya, and Egypt.Thus, this study is compatible with the history of North AfricanJews—founding during Classical Antiquity with proselytism of lo-cal populations, followed by genetic isolation with the rise ofChristianity and then Islam, and admixture following the emigra-tion of Sephardic Jews during the Inquisition.
Jewish genetics | population genetics | North African genetics |identical by descent sharing | deep ancestry
Jews lived in multiple communities in North Africa for >2,000 y(1). Successive waves of migration from the Middle East and
Europe, as well as conversion and admixture of local populations(mostly thought to be Berber and here termed “Maghrebi”),contributed to the formation of Jewish communities (2). Al-though termed “Sephardic,” the formation of these communitiesantedated the presence of Jews in the Iberian Peninsula withsignificant admixture occurring only after the expulsions fromSpain and Portugal in 1492 and 1497, respectively (2). From thattime up to their migration to current Israel starting in the 1940sand more massively in the 1950s, each of these populations livedin relative seclusion and was endogamous (3, 4). This separationled to their developing the characteristics of genetic isolates,such as high frequencies of founder mutations for Mendeliandisorders and limited repertoires of mitochondrial and Y chro-mosomal haplotypes (5–7).The relatedness of these Jewish groups to each other, to Eu-
ropean and Middle Eastern Jews, and to their non-Jewish NorthAfrican neighbors has been addressed in only a fragmentaryfashion in prior studies (8–14). Most studies were limited to oneor two North African groups. One study challenged the story lineof Judean migrants, Berber tribesmen, and Sephardic Jewishrefugees contributing to the formation of these groups by dem-onstrating shared ancestry between Libyan Jews and Yemenite
and Ethiopian Jews—groups that are thought to have limitedMiddle Eastern Jewish ancestry (15).Previously, using genome-wide SNP and copy number varia-
tion data, we demonstrated that Sephardic (Greek and Turkish),Ashkenazi (Eastern European), and Mizrahi (Iranian, Iraqi, andSyrian) Jews with origins in Europe and the Middle East weremore related to each other than to their non-Jewish contempo-rary neighbors (16). We showed that this relatedness could beexplained on the basis of sharing DNA segments identical bydescent (IBD) within and between populations. Here, we buildon this understanding of the Jewish Diasporas by extending ouranalyses to members of the Jewish communities in Morocco,Algeria, Tunisia, Djerba, Libya, Ethiopia, Yemen, and Georgiaand to members of non-Jewish communities from the sameregions. We present a comprehensive population genetic analysisof North African Jews, a group that comprises the third majorgroup of World Jewry, following European and Middle EasternJews. In addition, we extend these analyses to Georgian, Yem-enite, and Ethiopian Jews, thus developing a more comprehen-sive genetic map for Jewish population genetics.
ResultsNorth African Jewish Populations Form Distinctive Clusters withGenetic Proximity to Each Other and to European and MiddleEastern Jewish Groups. SNP data were generated for 509 un-related individuals (60.5% female) from the 15 Jewish pop-ulations (Table 1). These SNP data were merged with selecteddatasets from the Human Genome Diversity Project (HGDP) toexamine the genetic structure of Jewish populations in bothglobal and regional contexts (Fig. 1 and SI Appendix, Fig. S1).The first two principal components of worldwide populationsshowed that the North African Jewish populations clustered withthe European and Middle Eastern Jewish groups and Europeannon-Jewish groups, but not with the North African non-Jewishgroups, suggesting origins distinctive from the latter (Fig. 1A).Georgian Jews formed part of this cluster, whereas Yemeniteand Ethiopian Jews did not. When compared only to the Euro-pean, Middle Eastern, and North African Jewish and non-Jewishpopulations, the North African Jewish populations formeda common but distinctive cluster—observed by principal com-ponents 1 and 2—that was overlapping with the Greek and
Author contributions: C.L.C., P.F.P., M.D., L.R.B., M.F., G.A., C.O., A.P., L.H., B.M.H., E.B.,C.D.B., D.C., E.F., I.P., and H.O. designed research; C.L.C., P.F.P., M.D., L.H., I.P., and H.O.performed research; C.L.C., P.F.P., M.D., L.H., I.P., and H.O. analyzed data; and C.L.C.,P.F.P., M.D., L.R.B., G.A., B.M.H., I.P., and H.O. wrote the paper.
The authors declare no conflict of interest.
*This Direct Submission article had a prearranged editor.1C.L.C., P.F.P., and M.D. contributed equally to this work.2To whom correspondence should be addressed. E-mail: [email protected].
This article contains supporting information online at www.pnas.org/lookup/suppl/doi:10.1073/pnas.1204840109/-/DCSupplemental.
www.pnas.org/cgi/doi/10.1073/pnas.1204840109 PNAS | August 21, 2012 | vol. 109 | no. 34 | 13865–13870
POPU
LATION
BIOLO
GY
Dow
nloa
ded
by g
uest
on
Janu
ary
22, 2
022
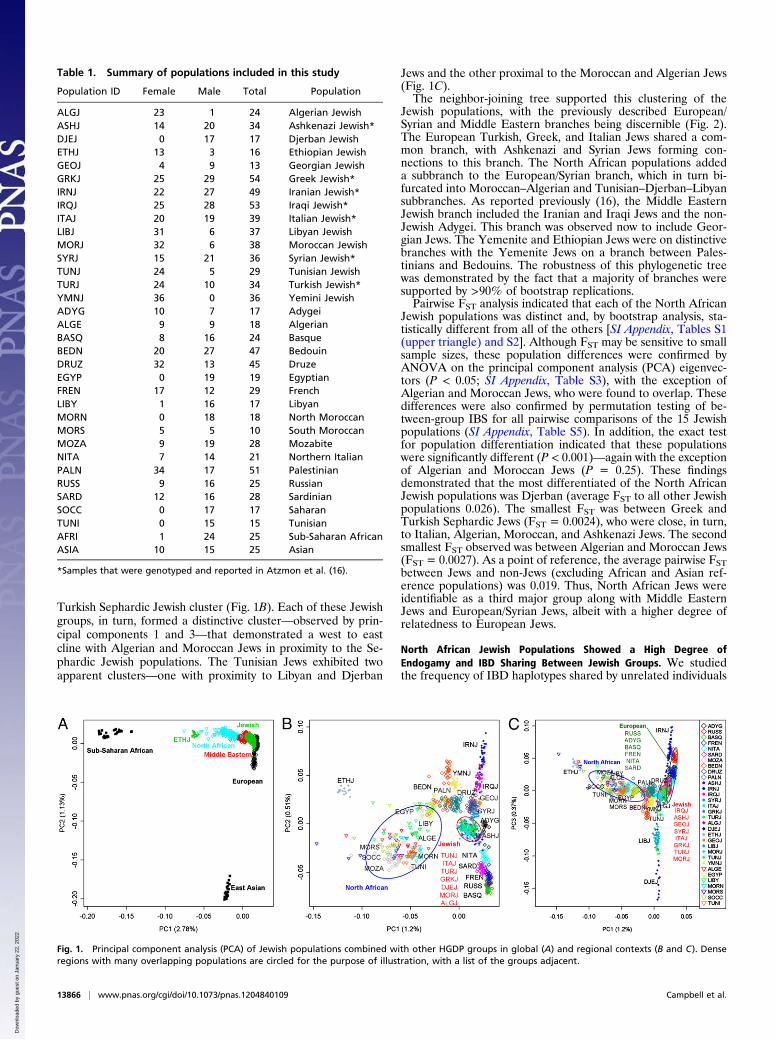
Turkish Sephardic Jewish cluster (Fig. 1B). Each of these Jewishgroups, in turn, formed a distinctive cluster—observed by prin-cipal components 1 and 3—that demonstrated a west to eastcline with Algerian and Moroccan Jews in proximity to the Se-phardic Jewish populations. The Tunisian Jews exhibited twoapparent clusters—one with proximity to Libyan and Djerban
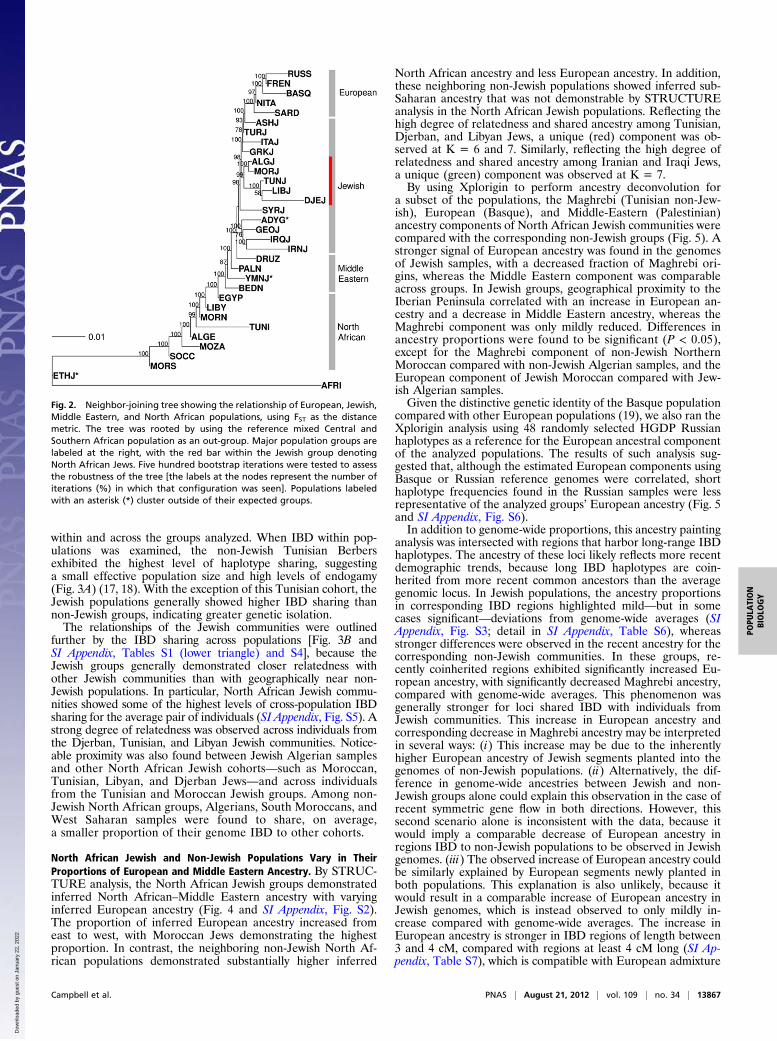
Jews and the other proximal to the Moroccan and Algerian Jews(Fig. 1C).The neighbor-joining tree supported this clustering of the
Jewish populations, with the previously described European/Syrian and Middle Eastern branches being discernible (Fig. 2).The European Turkish, Greek, and Italian Jews shared a com-mon branch, with Ashkenazi and Syrian Jews forming con-nections to this branch. The North African populations addeda subbranch to the European/Syrian branch, which in turn bi-furcated into Moroccan–Algerian and Tunisian–Djerban–Libyansubbranches. As reported previously (16), the Middle EasternJewish branch included the Iranian and Iraqi Jews and the non-Jewish Adygei. This branch was observed now to include Geor-gian Jews. The Yemenite and Ethiopian Jews were on distinctivebranches with the Yemenite Jews on a branch between Pales-tinians and Bedouins. The robustness of this phylogenetic treewas demonstrated by the fact that a majority of branches weresupported by >90% of bootstrap replications.Pairwise FST analysis indicated that each of the North African
Jewish populations was distinct and, by bootstrap analysis, sta-tistically different from all of the others [SI Appendix, Tables S1(upper triangle) and S2]. Although FST may be sensitive to smallsample sizes, these population differences were confirmed byANOVA on the principal component analysis (PCA) eigenvec-tors (P < 0.05; SI Appendix, Table S3), with the exception ofAlgerian and Moroccan Jews, who were found to overlap. Thesedifferences were also confirmed by permutation testing of be-tween-group IBS for all pairwise comparisons of the 15 Jewishpopulations (SI Appendix, Table S5). In addition, the exact testfor population differentiation indicated that these populationswere significantly different (P < 0.001)—again with the exceptionof Algerian and Moroccan Jews (P = 0.25). These findingsdemonstrated that the most differentiated of the North AfricanJewish populations was Djerban (average FST to all other Jewishpopulations 0.026). The smallest FST was between Greek andTurkish Sephardic Jews (FST = 0.0024), who were close, in turn,to Italian, Algerian, Moroccan, and Ashkenazi Jews. The secondsmallest FST observed was between Algerian and Moroccan Jews(FST = 0.0027). As a point of reference, the average pairwise FSTbetween Jews and non-Jews (excluding African and Asian ref-erence populations) was 0.019. Thus, North African Jews wereidentifiable as a third major group along with Middle EasternJews and European/Syrian Jews, albeit with a higher degree ofrelatedness to European Jews.
North African Jewish Populations Showed a High Degree ofEndogamy and IBD Sharing Between Jewish Groups. We studiedthe frequency of IBD haplotypes shared by unrelated individuals
Table 1. Summary of populations included in this study
Population ID Female Male Total Population
ALGJ 23 1 24 Algerian JewishASHJ 14 20 34 Ashkenazi Jewish*DJEJ 0 17 17 Djerban JewishETHJ 13 3 16 Ethiopian JewishGEOJ 4 9 13 Georgian JewishGRKJ 25 29 54 Greek Jewish*IRNJ 22 27 49 Iranian Jewish*IRQJ 25 28 53 Iraqi Jewish*ITAJ 20 19 39 Italian Jewish*LIBJ 31 6 37 Libyan JewishMORJ 32 6 38 Moroccan JewishSYRJ 15 21 36 Syrian Jewish*TUNJ 24 5 29 Tunisian JewishTURJ 24 10 34 Turkish Jewish*YMNJ 36 0 36 Yemini JewishADYG 10 7 17 AdygeiALGE 9 9 18 AlgerianBASQ 8 16 24 BasqueBEDN 20 27 47 BedouinDRUZ 32 13 45 DruzeEGYP 0 19 19 EgyptianFREN 17 12 29 FrenchLIBY 1 16 17 LibyanMORN 0 18 18 North MoroccanMORS 5 5 10 South MoroccanMOZA 9 19 28 MozabiteNITA 7 14 21 Northern ItalianPALN 34 17 51 PalestinianRUSS 9 16 25 RussianSARD 12 16 28 SardinianSOCC 0 17 17 SaharanTUNI 0 15 15 TunisianAFRI 1 24 25 Sub-Saharan AfricanASIA 10 15 25 Asian
*Samples that were genotyped and reported in Atzmon et al. (16).
Fig. 1. Principal component analysis (PCA) of Jewish populations combined with other HGDP groups in global (A) and regional contexts (B and C). Denseregions with many overlapping populations are circled for the purpose of illustration, with a list of the groups adjacent.
13866 | www.pnas.org/cgi/doi/10.1073/pnas.1204840109 Campbell et al.
Dow
nloa
ded
by g
uest
on
Janu
ary
22, 2
022
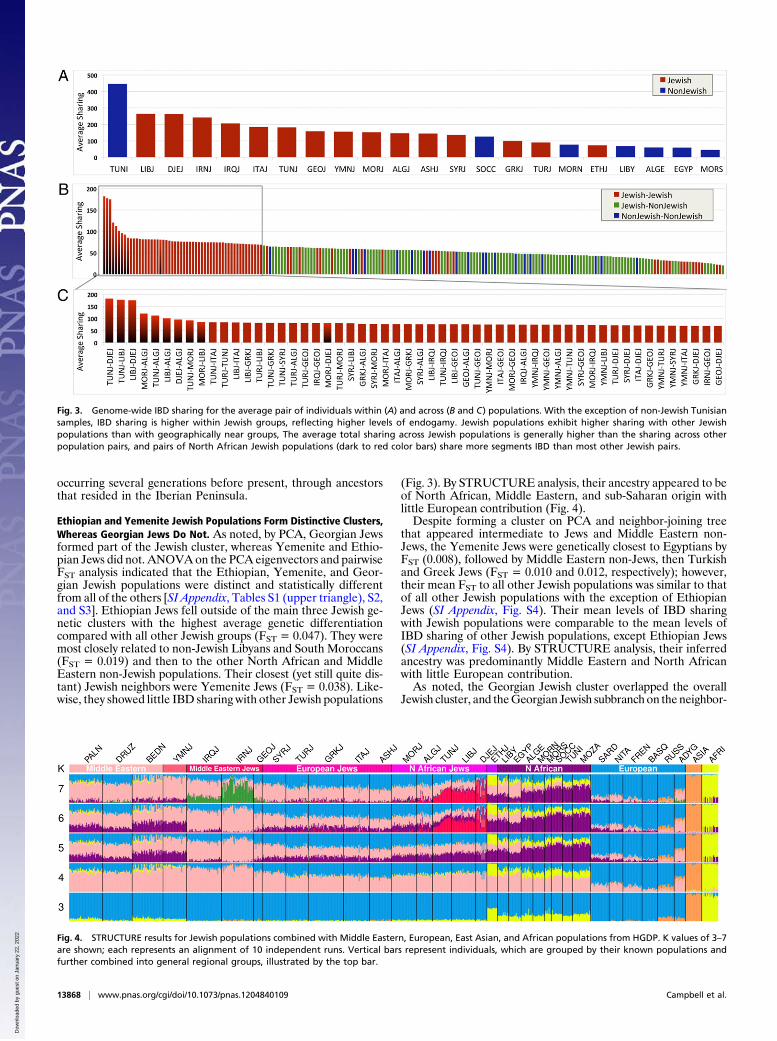
within and across the groups analyzed. When IBD within pop-ulations was examined, the non-Jewish Tunisian Berbersexhibited the highest level of haplotype sharing, suggestinga small effective population size and high levels of endogamy(Fig. 3A) (17, 18). With the exception of this Tunisian cohort, theJewish populations generally showed higher IBD sharing thannon-Jewish groups, indicating greater genetic isolation.The relationships of the Jewish communities were outlined
further by the IBD sharing across populations [Fig. 3B andSI Appendix, Tables S1 (lower triangle) and S4], because theJewish groups generally demonstrated closer relatedness withother Jewish communities than with geographically near non-Jewish populations. In particular, North African Jewish commu-nities showed some of the highest levels of cross-population IBDsharing for the average pair of individuals (SI Appendix, Fig. S5). Astrong degree of relatedness was observed across individuals fromthe Djerban, Tunisian, and Libyan Jewish communities. Notice-able proximity was also found between Jewish Algerian samplesand other North African Jewish cohorts—such as Moroccan,Tunisian, Libyan, and Djerban Jews—and across individualsfrom the Tunisian and Moroccan Jewish groups. Among non-Jewish North African groups, Algerians, South Moroccans, andWest Saharan samples were found to share, on average,a smaller proportion of their genome IBD to other cohorts.
North African Jewish and Non-Jewish Populations Vary in TheirProportions of European and Middle Eastern Ancestry. By STRUC-TURE analysis, the North African Jewish groups demonstratedinferred North African–Middle Eastern ancestry with varyinginferred European ancestry (Fig. 4 and SI Appendix, Fig. S2).The proportion of inferred European ancestry increased fromeast to west, with Moroccan Jews demonstrating the highestproportion. In contrast, the neighboring non-Jewish North Af-rican populations demonstrated substantially higher inferred
North African ancestry and less European ancestry. In addition,these neighboring non-Jewish populations showed inferred sub-Saharan ancestry that was not demonstrable by STRUCTUREanalysis in the North African Jewish populations. Reflecting thehigh degree of relatedness and shared ancestry among Tunisian,Djerban, and Libyan Jews, a unique (red) component was ob-served at K = 6 and 7. Similarly, reflecting the high degree ofrelatedness and shared ancestry among Iranian and Iraqi Jews,a unique (green) component was observed at K = 7.By using Xplorigin to perform ancestry deconvolution for
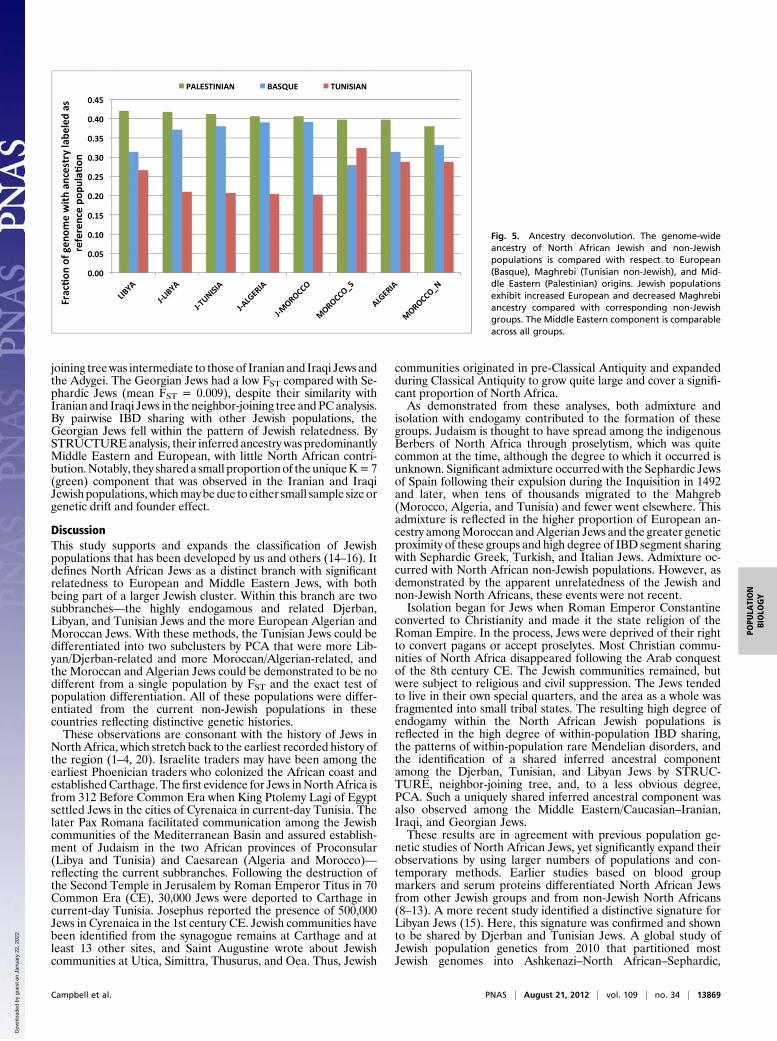
a subset of the populations, the Maghrebi (Tunisian non-Jew-ish), European (Basque), and Middle-Eastern (Palestinian)ancestry components of North African Jewish communities werecompared with the corresponding non-Jewish groups (Fig. 5). Astronger signal of European ancestry was found in the genomesof Jewish samples, with a decreased fraction of Maghrebi ori-gins, whereas the Middle Eastern component was comparableacross groups. In Jewish groups, geographical proximity to theIberian Peninsula correlated with an increase in European an-cestry and a decrease in Middle Eastern ancestry, whereas theMaghrebi component was only mildly reduced. Differences inancestry proportions were found to be significant (P < 0.05),except for the Maghrebi component of non-Jewish NorthernMoroccan compared with non-Jewish Algerian samples, and theEuropean component of Jewish Moroccan compared with Jew-ish Algerian samples.Given the distinctive genetic identity of the Basque population
compared with other European populations (19), we also ran theXplorigin analysis using 48 randomly selected HGDP Russianhaplotypes as a reference for the European ancestral componentof the analyzed populations. The results of such analysis sug-gested that, although the estimated European components usingBasque or Russian reference genomes were correlated, shorthaplotype frequencies found in the Russian samples were lessrepresentative of the analyzed groups’ European ancestry (Fig. 5and SI Appendix, Fig. S6).In addition to genome-wide proportions, this ancestry painting
analysis was intersected with regions that harbor long-range IBDhaplotypes. The ancestry of these loci likely reflects more recentdemographic trends, because long IBD haplotypes are coin-herited from more recent common ancestors than the averagegenomic locus. In Jewish populations, the ancestry proportionsin corresponding IBD regions highlighted mild—but in somecases significant—deviations from genome-wide averages (SIAppendix, Fig. S3; detail in SI Appendix, Table S6), whereasstronger differences were observed in the recent ancestry for thecorresponding non-Jewish communities. In these groups, re-cently coinherited regions exhibited significantly increased Eu-ropean ancestry, with significantly decreased Maghrebi ancestry,compared with genome-wide averages. This phenomenon wasgenerally stronger for loci shared IBD with individuals fromJewish communities. This increase in European ancestry andcorresponding decrease in Maghrebi ancestry may be interpretedin several ways: (i) This increase may be due to the inherentlyhigher European ancestry of Jewish segments planted into thegenomes of non-Jewish populations. (ii) Alternatively, the dif-ference in genome-wide ancestries between Jewish and non-Jewish groups alone could explain this observation in the case ofrecent symmetric gene flow in both directions. However, thissecond scenario alone is inconsistent with the data, because itwould imply a comparable decrease of European ancestry inregions IBD to non-Jewish populations to be observed in Jewishgenomes. (iii) The observed increase of European ancestry couldbe similarly explained by European segments newly planted inboth populations. This explanation is also unlikely, because itwould result in a comparable increase of European ancestry inJewish genomes, which is instead observed to only mildly in-crease compared with genome-wide averages. The increase inEuropean ancestry is stronger in IBD regions of length between3 and 4 cM, compared with regions at least 4 cM long (SI Ap-pendix, Table S7), which is compatible with European admixture
Fig. 2. Neighbor-joining tree showing the relationship of European, Jewish,Middle Eastern, and North African populations, using FST as the distancemetric. The tree was rooted by using the reference mixed Central andSouthern African population as an out-group. Major population groups arelabeled at the right, with the red bar within the Jewish group denotingNorth African Jews. Five hundred bootstrap iterations were tested to assessthe robustness of the tree [the labels at the nodes represent the number ofiterations (%) in which that configuration was seen]. Populations labeledwith an asterisk (*) cluster outside of their expected groups.
Campbell et al. PNAS | August 21, 2012 | vol. 109 | no. 34 | 13867
POPU
LATION
BIOLO
GY
Dow
nloa
ded
by g
uest
on
Janu
ary
22, 2
022
occurring several generations before present, through ancestorsthat resided in the Iberian Peninsula.
Ethiopian and Yemenite Jewish Populations Form Distinctive Clusters,Whereas Georgian Jews Do Not. As noted, by PCA, Georgian Jewsformed part of the Jewish cluster, whereas Yemenite and Ethio-pian Jews did not. ANOVAon the PCA eigenvectors and pairwiseFST analysis indicated that the Ethiopian, Yemenite, and Geor-gian Jewish populations were distinct and statistically differentfrom all of the others [SI Appendix, Tables S1 (upper triangle), S2,and S3]. Ethiopian Jews fell outside of the main three Jewish ge-netic clusters with the highest average genetic differentiationcompared with all other Jewish groups (FST = 0.047). They weremost closely related to non-Jewish Libyans and South Moroccans(FST = 0.019) and then to the other North African and MiddleEastern non-Jewish populations. Their closest (yet still quite dis-tant) Jewish neighbors were Yemenite Jews (FST = 0.038). Like-wise, they showed little IBD sharing with other Jewish populations
(Fig. 3). By STRUCTURE analysis, their ancestry appeared to beof North African, Middle Eastern, and sub-Saharan origin withlittle European contribution (Fig. 4).Despite forming a cluster on PCA and neighbor-joining tree
that appeared intermediate to Jews and Middle Eastern non-Jews, the Yemenite Jews were genetically closest to Egyptians byFST (0.008), followed by Middle Eastern non-Jews, then Turkishand Greek Jews (FST = 0.010 and 0.012, respectively); however,their mean FST to all other Jewish populations was similar to thatof all other Jewish populations with the exception of EthiopianJews (SI Appendix, Fig. S4). Their mean levels of IBD sharingwith Jewish populations were comparable to the mean levels ofIBD sharing of other Jewish populations, except Ethiopian Jews(SI Appendix, Fig. S4). By STRUCTURE analysis, their inferredancestry was predominantly Middle Eastern and North Africanwith little European contribution.As noted, the Georgian Jewish cluster overlapped the overall
Jewish cluster, and theGeorgian Jewish subbranch on theneighbor-
Fig. 3. Genome-wide IBD sharing for the average pair of individuals within (A) and across (B and C) populations. With the exception of non-Jewish Tunisiansamples, IBD sharing is higher within Jewish groups, reflecting higher levels of endogamy. Jewish populations exhibit higher sharing with other Jewishpopulations than with geographically near groups, The average total sharing across Jewish populations is generally higher than the sharing across otherpopulation pairs, and pairs of North African Jewish populations (dark to red color bars) share more segments IBD than most other Jewish pairs.
Fig. 4. STRUCTURE results for Jewish populations combined with Middle Eastern, European, East Asian, and African populations from HGDP. K values of 3–7are shown; each represents an alignment of 10 independent runs. Vertical bars represent individuals, which are grouped by their known populations andfurther combined into general regional groups, illustrated by the top bar.
13868 | www.pnas.org/cgi/doi/10.1073/pnas.1204840109 Campbell et al.
Dow
nloa
ded
by g
uest
on
Janu
ary
22, 2
022
joining treewas intermediate to those of Iranian and Iraqi Jews andthe Adygei. The Georgian Jews had a low FST compared with Se-phardic Jews (mean FST = 0.009), despite their similarity withIranian and Iraqi Jews in the neighbor-joining tree and PCanalysis.By pairwise IBD sharing with other Jewish populations, theGeorgian Jews fell within the pattern of Jewish relatedness. BySTRUCTUREanalysis, their inferred ancestry was predominantlyMiddle Eastern and European, with little North African contri-bution.Notably, they shared a small proportionof theuniqueK=7(green) component that was observed in the Iranian and IraqiJewishpopulations, whichmaybedue to either small sample size orgenetic drift and founder effect.
DiscussionThis study supports and expands the classification of Jewishpopulations that has been developed by us and others (14–16). Itdefines North African Jews as a distinct branch with significantrelatedness to European and Middle Eastern Jews, with bothbeing part of a larger Jewish cluster. Within this branch are twosubbranches—the highly endogamous and related Djerban,Libyan, and Tunisian Jews and the more European Algerian andMoroccan Jews. With these methods, the Tunisian Jews could bedifferentiated into two subclusters by PCA that were more Lib-yan/Djerban-related and more Moroccan/Algerian-related, andthe Moroccan and Algerian Jews could be demonstrated to be nodifferent from a single population by FST and the exact test ofpopulation differentiation. All of these populations were differ-entiated from the current non-Jewish populations in thesecountries reflecting distinctive genetic histories.These observations are consonant with the history of Jews in
NorthAfrica, which stretch back to the earliest recorded history ofthe region (1–4, 20). Israelite traders may have been among theearliest Phoenician traders who colonized the African coast andestablishedCarthage. The first evidence for Jews inNorthAfrica isfrom 312 Before Common Era when King Ptolemy Lagi of Egyptsettled Jews in the cities of Cyrenaica in current-day Tunisia. Thelater Pax Romana facilitated communication among the Jewishcommunities of the Mediterranean Basin and assured establish-ment of Judaism in the two African provinces of Proconsular(Libya and Tunisia) and Caesarean (Algeria and Morocco)—reflecting the current subbranches. Following the destruction ofthe Second Temple in Jerusalem by Roman Emperor Titus in 70Common Era (CE), 30,000 Jews were deported to Carthage incurrent-day Tunisia. Josephus reported the presence of 500,000Jews in Cyrenaica in the 1st century CE. Jewish communities havebeen identified from the synagogue remains at Carthage and atleast 13 other sites, and Saint Augustine wrote about Jewishcommunities at Utica, Simittra, Thusurus, and Oea. Thus, Jewish
communities originated in pre-Classical Antiquity and expandedduring Classical Antiquity to grow quite large and cover a signifi-cant proportion of North Africa.As demonstrated from these analyses, both admixture and
isolation with endogamy contributed to the formation of thesegroups. Judaism is thought to have spread among the indigenousBerbers of North Africa through proselytism, which was quitecommon at the time, although the degree to which it occurred isunknown. Significant admixture occurred with the Sephardic Jewsof Spain following their expulsion during the Inquisition in 1492and later, when tens of thousands migrated to the Mahgreb(Morocco, Algeria, and Tunisia) and fewer went elsewhere. Thisadmixture is reflected in the higher proportion of European an-cestry amongMoroccan andAlgerian Jews and the greater geneticproximity of these groups and high degree of IBD segment sharingwith Sephardic Greek, Turkish, and Italian Jews. Admixture oc-curred with North African non-Jewish populations. However, asdemonstrated by the apparent unrelatedness of the Jewish andnon-Jewish North Africans, these events were not recent.Isolation began for Jews when Roman Emperor Constantine
converted to Christianity and made it the state religion of theRoman Empire. In the process, Jews were deprived of their rightto convert pagans or accept proselytes. Most Christian commu-nities of North Africa disappeared following the Arab conquestof the 8th century CE. The Jewish communities remained, butwere subject to religious and civil suppression. The Jews tendedto live in their own special quarters, and the area as a whole wasfragmented into small tribal states. The resulting high degree ofendogamy within the North African Jewish populations isreflected in the high degree of within-population IBD sharing,the patterns of within-population rare Mendelian disorders, andthe identification of a shared inferred ancestral componentamong the Djerban, Tunisian, and Libyan Jews by STRUC-TURE, neighbor-joining tree, and, to a less obvious degree,PCA. Such a uniquely shared inferred ancestral component wasalso observed among the Middle Eastern/Caucasian–Iranian,Iraqi, and Georgian Jews.These results are in agreement with previous population ge-
netic studies of North African Jews, yet significantly expand theirobservations by using larger numbers of populations and con-temporary methods. Earlier studies based on blood groupmarkers and serum proteins differentiated North African Jewsfrom other Jewish groups and from non-Jewish North Africans(8–13). A more recent study identified a distinctive signature forLibyan Jews (15). Here, this signature was confirmed and shownto be shared by Djerban and Tunisian Jews. A global study ofJewish population genetics from 2010 that partitioned mostJewish genomes into Ashkenazi–North African–Sephardic,
Fig. 5. Ancestry deconvolution. The genome-wideancestry of North African Jewish and non-Jewishpopulations is compared with respect to European(Basque), Maghrebi (Tunisian non-Jewish), and Mid-dle Eastern (Palestinian) origins. Jewish populationsexhibit increased European and decreased Maghrebiancestry compared with corresponding non-Jewishgroups. The Middle Eastern component is comparableacross all groups.
Campbell et al. PNAS | August 21, 2012 | vol. 109 | no. 34 | 13869
POPU
LATION
BIOLO
GY
Dow
nloa
ded
by g
uest
on
Janu
ary
22, 2
022
Caucasus–Middle Eastern, and Yemenite subclusters demon-strated that an Ethiopian subcluster was close to the local pop-ulation, in accordance with what was observed here (14). Aprevious study of monoallelic matrilineal inheritance demon-strated limited mitochondrial lineages in Tunisian and LibyanJews, but not in Moroccan Jews, which was observed in this studyas a high degree of extended IBD sharing among the more en-dogamous Tunisian and Libyan populations (5).The observations for Georgian and Ethiopian Jews met his-
torical expectations—Georgian Jews are an outgrowth from theIranian and Iraqi Jewish communities, and Ethiopian Jews arean ancient community that had relatively few, if any, Jewishfounders from elsewhere and existed in isolation for >2,000years. Nonetheless, the low FST between Sephardic and Geor-gian Jews suggests that the latter may have had significant con-tact with Turkish or Syrian Jews. The observations for theYemenite Jews are even more surprising. Like the EthiopianJews, this population was founded >2,000 y ago and was thoughtto be comprised mostly of local proselytes, which is reflected inthe distinctive clustering of the population away from otherJewish groups and the mostly Middle Eastern ancestry present inthis group. However, the observation of comparable FST andIBD sharing with other Jewish communities implies significantcommon Jewish founders in the absence of more recent geneticflow into the community. Thus, although Jewishness was trans-mitted by the flow of ideas and genes, both appear to have beenunder selection for long periods of time.
Materials and MethodsMore detailed methods are described in SI Appendix, SI Materialsand Methods.
Genotype Data. A total of 509 Jewish samples from 15 populations weregenotypedontheAffymetrix6.0array(Affyv6).Thesewerecombinedwith114non-Jewish individuals from sevenNorthAfrican populations (17) by using thesame array and 365 samples genotyped in the HGDP (21), by using Illumina
HumanHap650K Beadchips. After merging and quality-control filtering, a to-tal of 163,199 high-quality SNPs were available for downstream analyses.
PCA, FST, and Phylogeny. The SMARTPCA program from the EIGENSOFTpackage (Version 3.0) (22) was used to perform outlier removal and PCA.FST values were calculated for each population pair by using Genepop(23). A bootstrap method, sampling all markers with replacement for 500iterations, was used to estimate FST confidence intervals and to generatea consensus tree using the neighbor-joining method from PHYLIP (Ver-sion 3.69) (24). Genepop was also used to perform an exact test ofpopulation differentiation.
Population Structure. Population ancestry proportions were inferred by usingthe program STRUCTURE (Version 2.3) (25, 26). A selection of 5,113 markerswas used, selected for high differences in allele frequency between pop-ulations and low linkage disequilibrium.
IBD Discovery. Following computational phasing with BEAGLE (27), sharedIBD segments were detected by using the GERMLINE software package (28).Only non-Jewish populations from North Africa and Jewish populationswere analyzed, allowing a higher-density set of 598,260 SNPs to be used.
Ancestry Deconvolution. The Xplorigin software package was used to performancestry deconvolution on a subset of North African groups, by using de-scribed procedures (29, 30). Samples of North African origins were analyzedwith respect to their Maghrebi, Middle Eastern, and European ancestry byusing 36 non-Jewish Tunisian Berber, 48 Palestinian, and 48 Basque refer-ence haplotypes, respectively. Data are available upon request.
ACKNOWLEDGMENTS. We thank Anmol Tiwari for contributions to thepermutation testing; Alon Keinan, Yongzhao Shao, and Simon Gravel foruseful technical discussions; Lanchi U, Malka Sasson, Bridget Riley, JidongShan, and David Reynolds for technical contributions; and Lawrence Schiff-man, Aron Rodrigue, and Harvey Goldberg for informative historical discus-sions. This work was supported in part by the Lewis and Rachel RudinFoundation, the Iranian-American Jewish Federation of New York, the US–Israel Binational Science Foundation, National Institutes of Health Grant 5U54 CA121852, and Ruth and Sidney Lapidus. L.R.B. and D.C. were supportedby Ministerio de Ciencia e Innovación Grant CGL2010-14944/BOS.
1. Baron SW (1952) A Social and Religious History of the Jews (Columbia Univ Press, New
York), 2nd Ed.2. Stillman NA (1979) The Jews of Arab Lands: A History and Source Book (Jewish
Publication Society of America, Philadelphia), 1st Ed.3. Hirschberg HZ (1974) A History of the Jews in North Africa (Brill, Leiden), 2nd Rev. Ed.4. Chouraqui A (1968) Between East and West: A History of the Jews of North Africa
(Jewish Publication Society of America, Philadelphia), 1st Ed.5. Behar DM, et al. (2008) Counting the founders: The matrilineal genetic ancestry of the
Jewish Diaspora. PLoS ONE 3:e2062.6. Ostrer H (2001) A genetic profile of contemporary Jewish populations. Nat Rev Genet
2:891–898.7. Manni F, et al. (2005) A Y chromosomal portrait of the population of Djerba (Tu-
nisia) to elucidate its complex demographic history. Bull Mem Soc Anthropol Paris
17:1–12.8. Bonné-Tamir B, Ashbel S, Bar-Shani S (1978) Ethnic communities in Israel: The genetic
blood markers of the Moroccan Jews. Am J Phys Anthropol 49:465–471.9. Bonné-Tamir B, Ashbel S, Modai J (1977) Genetic markers in Libyan Jews. Hum Genet
37:319–328.10. Carmelli D, Cavalli-Sforza LL (1979) The genetic origin of the Jews: A multivariate
approach. Hum Biol 51:41–61.11. Karlin S, Kenett R, Bonné-Tamir B (1979) Analysis of biochemical genetic data on
Jewish populations: II. Results and interpretations of heterogeneity indices and dis-
tance measures with respect to standards. Am J Hum Genet 31:341–365.12. Kobyliansky E, Micle S, Goldschmidt-Nathan M, Arensburg B, Nathan H (1982) Jewish
populations of the world: Genetic likeness and differences. Ann Hum Biol 9:1–34.13. Livshits G, Sokal RR, Kobyliansky E (1991) Genetic affinities of Jewish populations. Am
J Hum Genet 49:131–146.14. Behar DM, et al. (2010) The genome-wide structure of the Jewish people. Nature 466:
238–242.15. Rosenberg NA, et al. (2001) Distinctive genetic signatures in the Libyan Jews. Proc Natl
Acad Sci USA 98:858–863.
16. Atzmon G, et al. (2010) Abraham’s children in the genome era: Major Jewish diasporapopulations comprise distinct genetic clusters with shared Middle Eastern ancestry.Am J Hum Genet 86:850–859.
17. Henn BM, et al. (2012) Genomic ancestry of North Africans supports back-to-Africamigrations. PLoS Genet 8:e1002397.
18. Wright S (1931) Evolution in Mendelian populations. Genetics 16:97–159.19. Rodríguez-Ezpeleta N, et al. (2010) High-density SNP genotyping detects homoge-
neity of Spanish and French Basques, and confirms their genomic distinctiveness fromother European populations. Hum Genet 128:113–117.
20. Gubbay L, Levy A (1992) The Sephardim: Their Glorious Tradition from the BabylonianExile to the Present Day (Carnell Limited, London).
21. Rosenberg NA, et al. (2002) Genetic structure of human populations. Science 298:2381–2385.
22. Patterson N, Price AL, Reich D (2006) Population structure and eigenanalysis. PLoSGenet 2:e190.
23. Rousset F (2008) genepop’007: A complete re-implementation of the genepop soft-ware for Windows and Linux. Mol Ecol Resources 8:103–106.
24. Felsenstein J (1989) PHYLIP: Phylogeny inference package (version 3.2). Cladistics 5:164–166.
25. Falush D, Stephens M, Pritchard JK (2003) Inference of population structure usingmultilocus genotype data: Linked loci and correlated allele frequencies. Genetics 164:1567–1587.
26. Pritchard JK, Stephens M, Donnelly P (2000) Inference of population structure usingmultilocus genotype data. Genetics 155:945–959.
27. Browning SR, Browning BL (2007) Rapid and accurate haplotype phasing and missing-data inference for whole-genome association studies by use of localized haplotypeclustering. Am J Hum Genet 81:1084–1097.
28. Gusev A, et al. (2009) Whole population, genome-wide mapping of hidden re-latedness. Genome Res 19:318–326.
29. Velez C, et al. (2011) The impact of Converso Jews on the genomes of modern LatinAmericans. Hum Genet.
30. Bonnen PE, et al. (2010) European admixture on the Micronesian island of Kosrae:Lessons from complete genetic information. Eur J Hum Genet 18:309–316.
13870 | www.pnas.org/cgi/doi/10.1073/pnas.1204840109 Campbell et al.
Dow
nloa
ded
by g
uest
on
Janu
ary
22, 2
022