Embed Size (px)
Citation preview

IMAGING IN SURGERY

Normal Anatomy

Appendix Normal appendix
A thin walled tubular structure that may be collapsed or filled with air, fluid or contrast.
Normally does not exceed 6mm diameter and has a sharp contour defined by homogeneous low-density mesenteric fat.
Originates between the ileocecal valve and the cecal apex on the same side as the valve. (1/3 course inferomedially from the cecum and 2/3 are retrocecal).
Tips for finding the appendix: trace the colon from the anus to the cecum. The appendix will be located along the cecum on the opposite side of the ileocecal valve from the ascending colon.
Normal air-filled appendix (arrow)

Appendicitis Demographics:
Any age, most commonly 10-30 years old
Slightly more common in males (1.4 : 1)
Clinically: Abdominal pain, often RLQ Nausea Vomiting Fever Note enlargement of the appendix (arrows),
intraluminal fluid, and adjacent inflammatory stranding

Possible findings in acute appendicitis
Enlarged appendix, > 6 mm in diameter
Appendiceal wall thickening Appendiceal wall enlargement Periappendiceal fat stranding Focal cecal apical thickening Detection of an appendicolith - appearing
as a ringlike or homogeneous calcification (viewing the CT with bone windows aids in detection).

Normal Bowel ImagingLarge bowel has haustra scattered all along the colon. The colon also has epiploicae (fat filled tags) on its surface. These haustra and epiploicae separate the large from the small intestine. Colon is filled with feces which has bubbly appearance The small bowel is located in the center of abdomenFairly narrow about 2.5 cm tube like structure winds compactly back and forth within the abdominal cavityThe small intestine is identified by valvulae circulares or circular folds on oral contrast study.

SBO: Postop and paralytic ilues
Demograpics: Patients who are postop, have
a malignancy, Crohn’s, or hernia.
Patients on narcotics
Clinically: Constipation, Nausea, and
vomiting Abdominal fullness/excessive
gas Pain and cramps in stomach
area
Axial CT scan through the lower abdomen showsmultiple fluid-filled and dilated loops of small bowel (white arrows) and collapsed right colon (red arrow) consistent with a mechanical small bowel obstruction.

SBO: Radiograph Multiple dilated small
bowel loops are seen (white arrowheads).
There is fecal material in the right and left colon(arrows).
Air is seen in the rectum. The surgical staples
indicate recent abdominal surgery. (black arrowheads).
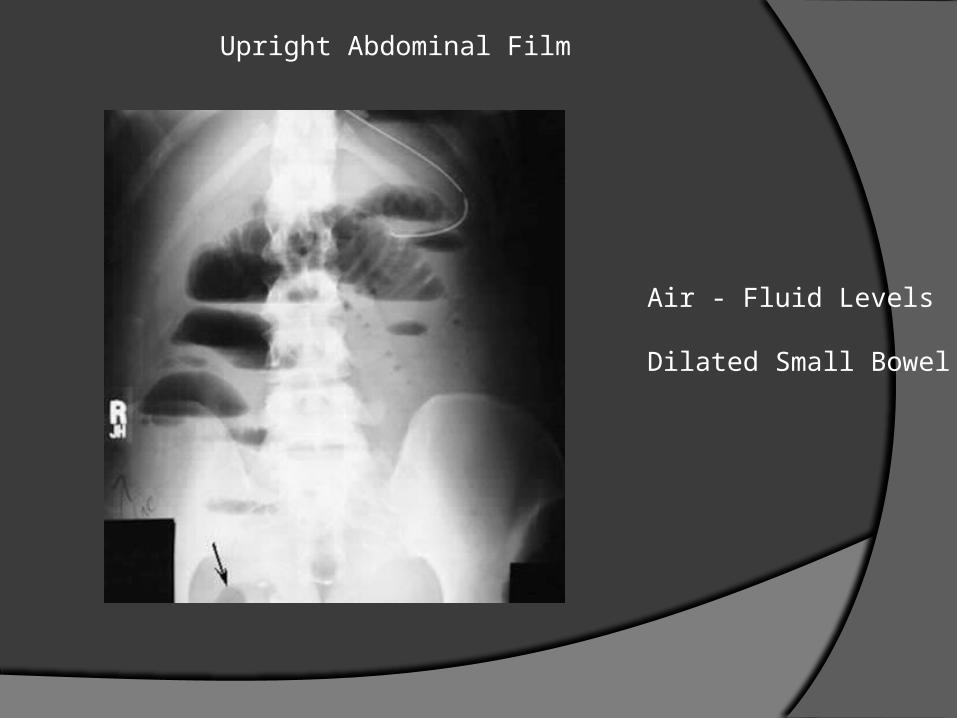
Air - Fluid Levels
Dilated Small Bowel
Upright Abdominal Film


Large Bowel Obstruction
Dilated bowel loops proximal to the obstruction.Arrow points to the etiology of obstruction.
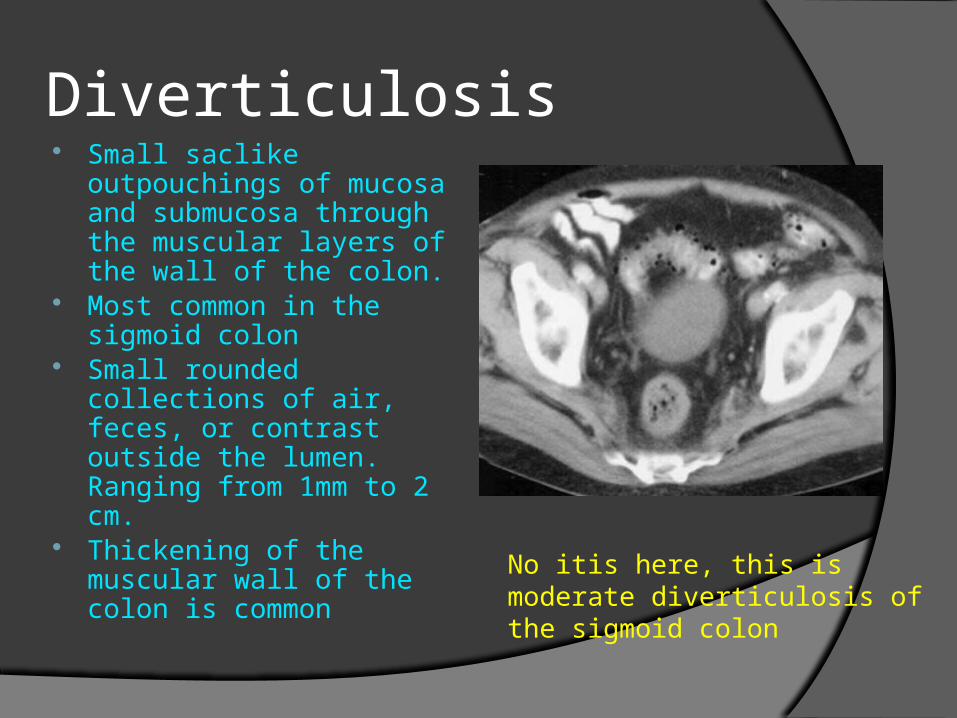
Diverticulosis Small saclike
outpouchings of mucosa and submucosa through the muscular layers of the wall of the colon.
Most common in the sigmoid colon
Small rounded collections of air, feces, or contrast outside the lumen. Ranging from 1mm to 2 cm.
Thickening of the muscular wall of the colon is common
No itis here, this is moderate diverticulosis of the sigmoid colon

Diverticulosis Demographics:
Rare before age 40 Incidence increases with age May be associated with low-
fiber diet
Clinically: Most often asymptomatic,
diagnosed incidentally May be associated with lower
abdominal discomfort, bloating, constipation
Arrowheads point to multiple diverticula arising from the recto sigmoid. The contrast in diverticula is left over from previously administered GI contrast.

Diverticulosis- Radiograph
This radiograph shows scattered diverticula throughout the abdomen. On the right is a magnified view of the left lower quadrant of the same radiograph. Notice the many scattered diverticula throughout the sigmoid and descending colon (arrows).

Diverticulitis
• Demographics:• See Diverticulosis
• Clinically:• Abdominal pain, often LLQ• Nausea• Vomiting• Constipation or diarrhea• Fever
Note wall thickening in the sigmoid colon (arrows) and adjacent inflammatory changes in the pericolic fat
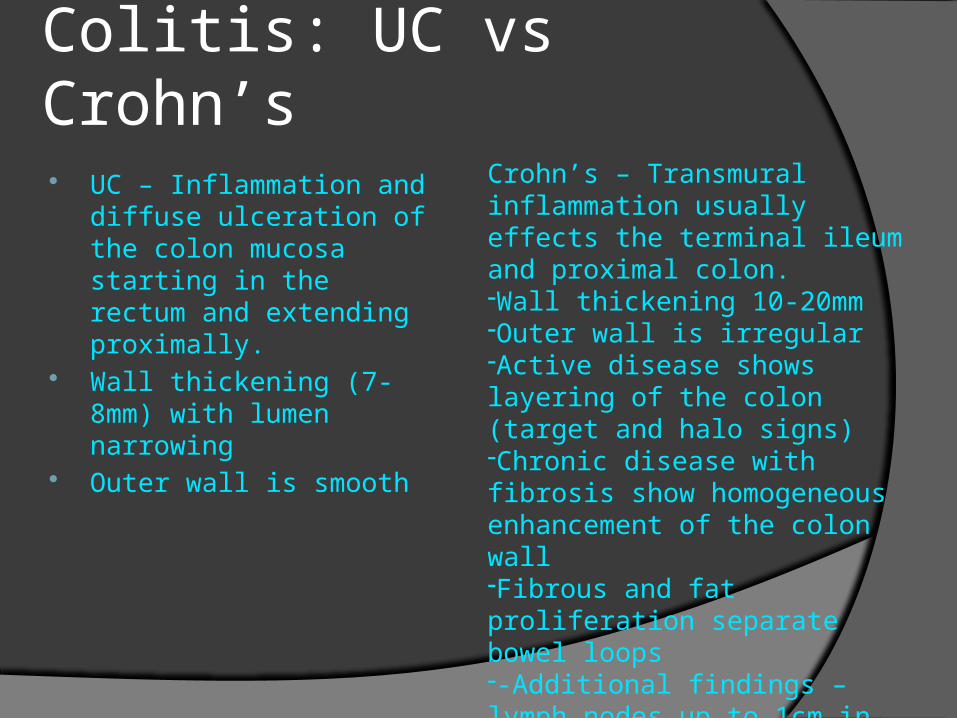
Colitis: UC vs Crohn’s
UC – Inflammation and diffuse ulceration of the colon mucosa starting in the rectum and extending proximally.
Wall thickening (7-8mm) with lumen narrowing
Outer wall is smooth
Crohn’s – Transmural inflammation usually effects the terminal ileum and proximal colon. -Wall thickening 10-20mm-Outer wall is irregular-Active disease shows layering of the colon (target and halo signs)-Chronic disease with fibrosis show homogeneous enhancement of the colon wall -Fibrous and fat proliferation separate bowel loops--Additional findings – lymph nodes up to 1cm in mesentary, fistulas, sinus tracts, abscesses, phlegmons

Ulcerative Colitis Demographics:
Peak incidence between 15 – 30 years old
Equal incidence in males and females
Clinically: Diarrhea (can be > 10
loose stools / day), often bloody
Rectal bleeding Passage of mucus with
defecation Abdominal pain Constipation Fever
Note diffuse thickening of the sigmoid colon (arrows) and minimal adjacent inflammatory stranding

Example of Ulcerative colitis CT scan of a patient
with long-standing ulcerative colitis shows a submucosal halo of fat within the rectum (arrow). There is also perirectal fibrofatty proliferation (*).

Crohn’s Disease Demographics:
Two peaks of incidence: 15 – 30 and 50 – 80 years old
Equal incidence in males and females
Clinically: Abdominal pain Diarrhea (usually non-
bloody) Steatorrhea Fatigue Oral ulcers
Note thickening of the terminal ileum (curved arrow) and cecum (straight arrow) and inflammatory changes in the adjacent fat

Example of Crohns White attenuation:
enhancement in ileal Crohn disease. On an intravenous contrast-enhanced CT scan, the enhanced thickened wall of the small bowel (solid arrows) is slightly higher attenuation than the inferior vena cava (open black arrow). The vasa recta are dilated (arrowhead) and separated by increased fat deposition ("creeping fat sign"). Open white arrow = enlarged mesenteric node.

Colitis: Infectious Pseudomembranous colitis (C. Diff) –
Cytotoxic entertoxin ulcerates the mucosa and creates pseudomembranes of mucin, fibrin and inflammatory cells Pancolitis or segmental with irregular wall thickening up to 30
mm with shaggy endoluminal contour. Submucosal edama creates an “accordian pattern”

Colitis: Ischemic Usually occurs in setting of low cardiac
output in pts w/ extemsove. But nonocclusive vascular disease.
Affects watershed areas most: splenic flexure and rectosigmoid region.
Produces halo sign in postcontrast scans, stranding and inflammation in pericolic fat
Complications: hemorrhage, pneumatosis,

Example of Diffuse ischemic colitis CT scan obtained with
oral and intravenous contrast material shows diffuse, low-attenuation thickening of the colonic wall (arrows). This is an example of the water halo sign.
Water halo sign: diffuse, low-attenuation thickening of the colonic wall (arrows)

Pseudomembranous colitis
Return to Table of Contents
Note diffuse wall thickening throughout the colon (arrows), and pericolic inflammation
Demographics: Most commonly caused
by C.diff overgrowth following treatment with antibiotics
Advanced age is risk factor
Clinically: Watery diarrhea (5-10x
per day) Abdominal cramps Hematochezia Fever
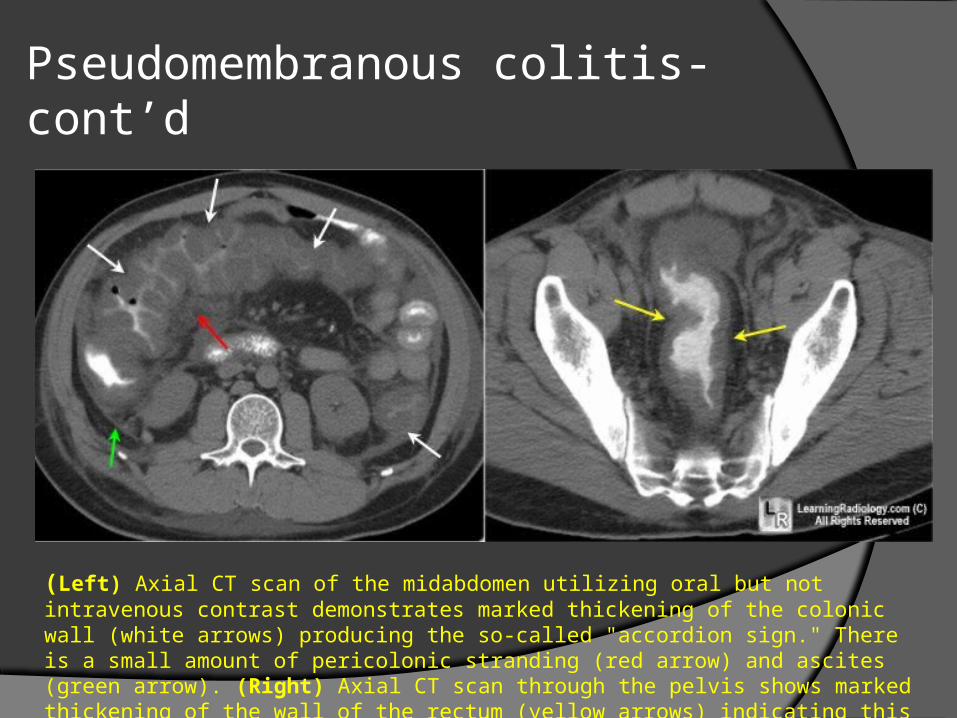
Pseudomembranous colitis- cont’d
(Left) Axial CT scan of the midabdomen utilizing oral but not intravenous contrast demonstrates marked thickening of the colonic wall (white arrows) producing the so-called "accordion sign." There is a small amount of pericolonic stranding (red arrow) and ascites (green arrow). (Right) Axial CT scan through the pelvis shows marked thickening of the wall of the rectum (yellow arrows) indicating this is a pan-colitis.
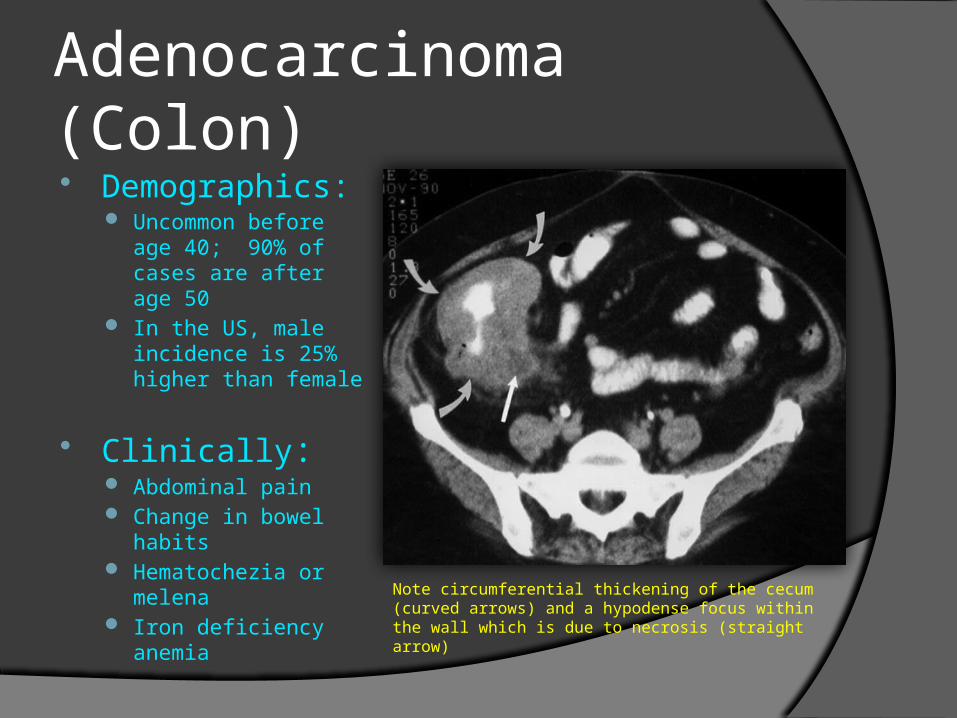
Adenocarcinoma (Colon) Demographics:
Uncommon before age 40; 90% of cases are after age 50
In the US, male incidence is 25% higher than female
Clinically: Abdominal pain Change in bowel habits Hematochezia or
melena Iron deficiency anemia
Note circumferential thickening of the cecum (curved arrows) and a hypodense focus within the wall which is due to necrosis (straight arrow)

Major complication of many types of colitis: Toxic megacolon Dilation> 5cm w/
thinning of colon wall, pneumatosis and perforation

Colonic volvulus (Usually diagnosed on
x-ray)
Twisting of folding of an intraperitoneal segment of the colon
Sigmoid volvulus – apex points toward the left lower quadrant
Cecal volvulus – apex points toward the right lower quadrant.
Swirl sign of SigmoidVolvulus in a 5 yo >

The Liver - anatomy and pathology

Liver- Anatomy The Couinaud classification of liver anatomy divides the liver into eight functionally indepedent segments. Each segment has its own vascular inflow, outflow and biliary drainage.In the center of each segment there is a branch of the portal vein, hepatic artery and bile duct.In the periphery of each segment there is vascular outflow through the hepatic veins.

http://www.ctisus.com/
Couinaud classification of liver anatomy

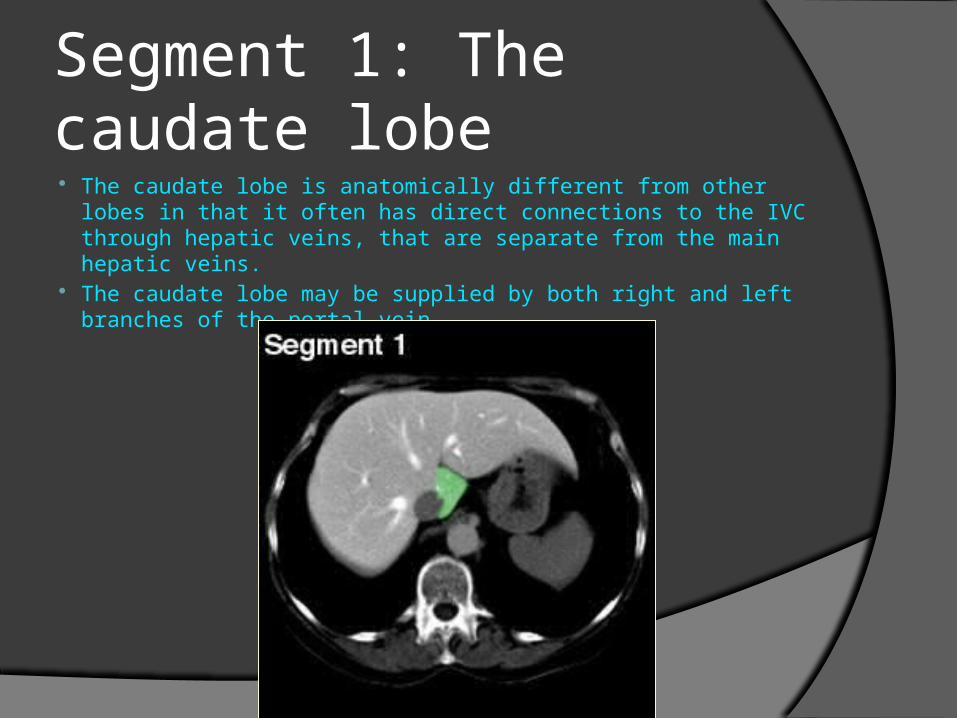
Segment 1: The caudate lobe The caudate lobe is anatomically different from other lobes in
that it often has direct connections to the IVC through hepatic veins, that are separate from the main hepatic veins.
The caudate lobe may be supplied by both right and left branches of the portal vein.

Identifying segments
The first step in correctly identifying the remaining segments is to is to locate the portal vein.
The arrow is pointing to the portal vein and, in this image, is at the junctions between the upper and lower segments.
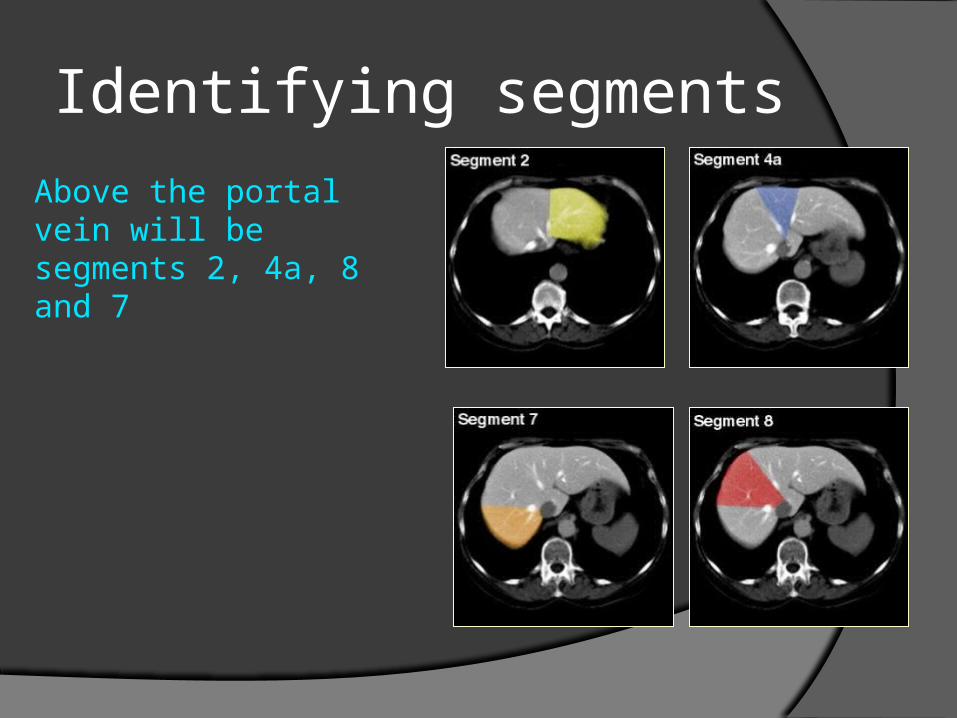
Identifying segments
Above the portal vein will be segments 2, 4a, 8 and 7

Identifying Segments
Below the portal vein will be segments: 3,4b, 5 and 6

Identify the branches of the hepatic vein Right hepatic vein: divides the right lobe into anterior and
posterior segments. Middle hepatic vein: divides the liver into right and left lobes. This
plane runs from the inferior vena cava to the gallbladder fossa. Left hepatic vein: divides the left lobe into a medial and lateral part.

Right lobe
Identify the right hepatic vein which divides the right lobe into anterior (segment 8 & 5) and posterior segments ( segment 6 & 7). Anterior lobe:
○ Segment 8 is located superior to the the portal vein.
○ Segment 5 is Located inferior to the portal vein Posterior Lobe :
○ Segment 7 is located superior to the portal vein○ Segment 6 is Located inferior to the portal vein

Left Lobe The left lobe is divided into medial and
lateral segments by the left hepatic vein.To the left of the left hepatic vein are segments
2 & 3. ○ Segment 2 is located superior to the portal vein.○ Segment 3 is located inferior to the portal vein.
To the right of the left hepatic vein are segments 4a & 4b○ Segment 4a is located superior to the portal
vein.○ Segment 4b is located inferior to the portal vein.

Normal liver, unenhanced CTNote the areas of hypodensity (arrows), which are normal hepatic and portal veins coursing through the liver.
Photo, Armstrong et al, 2004
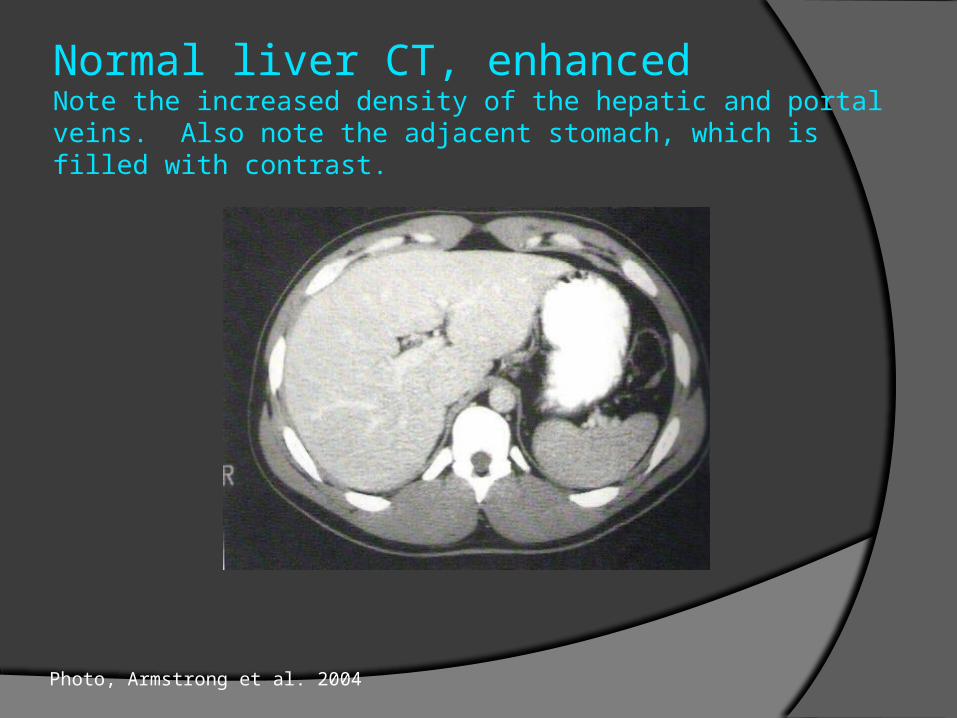
Normal liver CT, enhancedNote the increased density of the hepatic and portal veins. Also note the adjacent stomach, which is filled with contrast.
Photo, Armstrong et al. 2004

Homogeneity – Hepatic Neoplasms Knowing which lesions are hypervascular
(hyperintense) and which are hypovascular (hypodense) can help identify the type of neoplasm, but the key thing is that they are of a different density than the surrounding liver parenchyma. Hypervascular examples: carcinoid tumor mets,
hepatocellular carcinomaHypovascular examples: colon cancer mets,
cholangiocarcinoma
Most mets, as opposed to primary tumors, are rounded and well demarcated from surrounding parenchyma on enhanced scans.

Appearance of various liver neoplasms during early arterial phase
Carcinoid tumor metastasis is hypervascular
Primary hepatocellular carcinoma is hypervascular (hypodense area is necrosis)
Hypovascular metastasis due to colon cancer
Hypovascular primary cholangiocarcinoma
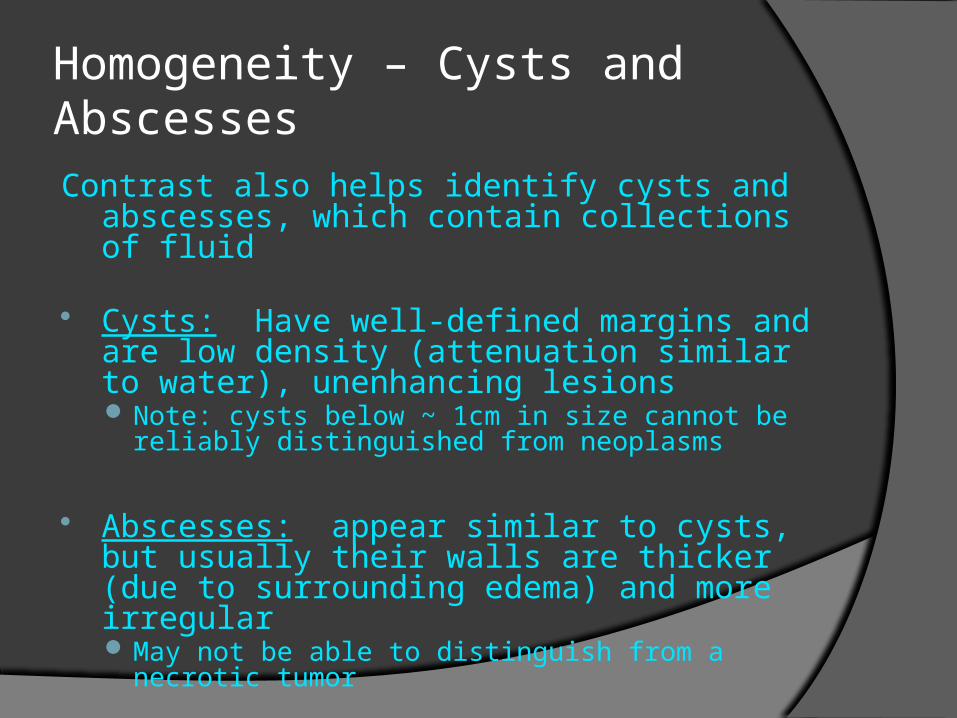
Homogeneity – Cysts and AbscessesContrast also helps identify cysts and abscesses,
which contain collections of fluid
Cysts: Have well-defined margins and are low density (attenuation similar to water), unenhancing lesions Note: cysts below ~ 1cm in size cannot be reliably
distinguished from neoplasms
Abscesses: appear similar to cysts, but usually their walls are thicker (due to surrounding edema) and more irregular May not be able to distinguish from a necrotic tumor

Hepatic Cyst vs. Abscess
Photo, Novelline et al, 2004 Photo Lee et al, 1998
Left, hepatic cyst; right, hepatic abscess. Note the thickened wall of the abscess.

Homogeneity – Liver Trauma Trauma can cause hepatic parenchymal
lacerations, subcapsular and intrahepatic hematomas
All are low-density areas relative to contrast-enhanced parenchyma
Leakage of contrast = active bleeding

Hepatic Laceration
Photo, www.e-radiography.net

Gallbladder Ultrasound is the
preferred initial modality in the investigation of right upper quadrant pain.
Normal gallbladder on US

Cholecystitis
US findings: Thick GB wall, stones in GB, absence of echoes posterior to the calculi "Shadowing"
Demographics: "fat, forty, female and fertile ” Incidence increases with age May be associated with low-
fiber diet
Clinically: Fever, Nausea, and vomiting Positive Murphy’s Sign Elevated WBC

Gallstones on CT Although less sensitive
than ultrasound, CT findings include : • Cholelithiasis• Gallbladder distension• Gallbladder wall thickening• Mural or mucosal
hyperenhancement• Pericholecystic fluid and
inflammatory fat stranding• Enhancement of the
adjacent liver parenchyma due to reactive hyperaemia
hyperattenuating calculi (arrow) in gallbladder

Pancreas The head of the pancreas is
surrounded by the duodenum as it makes a C-loop around the pancreas. The tail is in the hilus of spleen.
With contrast enhancement it has the same density as liver and spleen.
It is recognizable by the splenic vein running along posterior inferior groove.
The common bile duct traverses through the head of the pancreas and joins with the pancreatic duct at the ampulla of Vater to empty bile into the second or descending part of the duodenum. Normal pancreas

Pancreatitis Demographics
Any age, however less common <45 years
Clinically:Abdominal pain,
fever, nausea, and vomiting
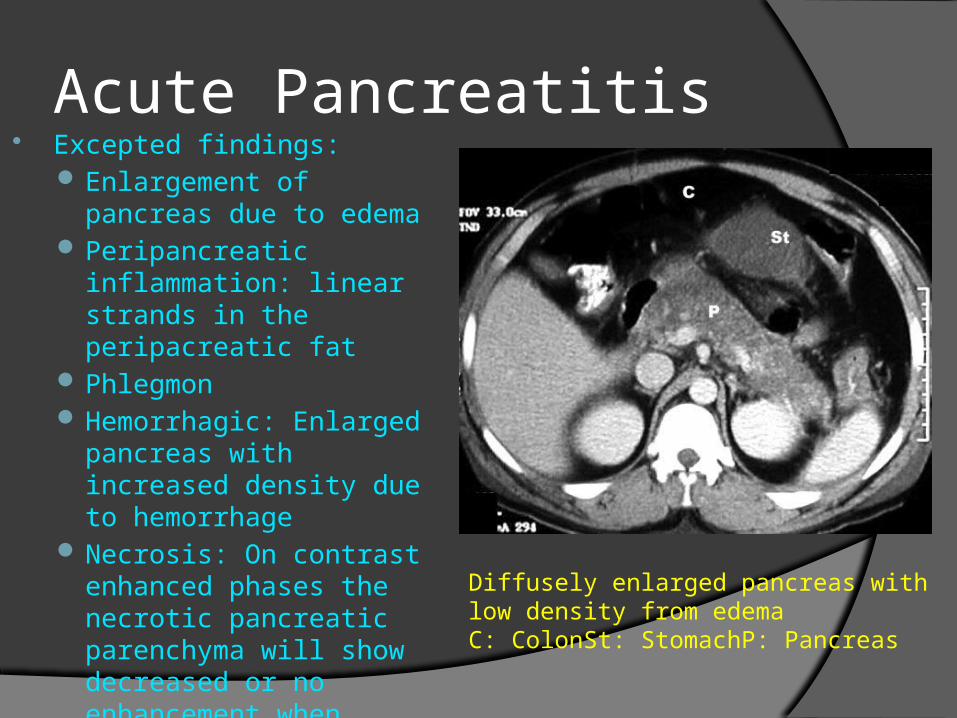
Acute Pancreatitis Excepted findings:
Enlargement of pancreas due to edema
Peripancreatic inflammation: linear strands in the peripacreatic fat
Phlegmon Hemorrhagic: Enlarged
pancreas with increased density due to hemorrhage
Necrosis: On contrast enhanced phases the necrotic pancreatic parenchyma will show decreased or no enhancement when compared with normally enhancing viable tissue
Diffusely enlarged pancreas with low density from edemaC: ColonSt: StomachP: Pancreas

Chronic Pancreatitis May show dilated duct,
enlarged pancreas, pseudocyst, calcification
Optimal visualization with helical CT using pancreas-optimized protocol - water as oral contrast agent, initial scan without IV contrast, then contrast infusion using pancreatic cancer protocol
Limited usefulness in early chronic pancreatitis
Mass density in pancreasWhite arrow: PsudocystBlack arrow: Calcifications

Acute Pancreatitis on KUB Radiographic findings:
Cut off sign and Ileus Cut off sign: abrupt
termination of gas within the proximal colon at the level of splenic flexure, seen on abdominal radiographs, CT, and barium enema in patients with acute pancreatitis.
White arrowpoints to Transeverse colon cut off at Splenic flexure. No air in descending colon.TC: Transverse colonI: Represents small bowel loops with air suggestive of Ileus

Chronic Pancreatitis on KUB Radiographic findings:
• Calcifications in the pancreas
• Pseudocysts: As necrotic pancreatic tissue liquefies, it forms a "pseudocyst”.This may be in the region of the pancreas or extend beyond the pancreatic region.


