Embed Size (px)
Citation preview
AN
NU
AL
RE
PO
RT
20
13N
OR
MA
Gro
up S
E
ANNUAL REPORT 2013
GROWTH CONNECTS

NORMA Group SE is an international market and technology leader in advanced engineered joining technology. We offer about 30,000 high-quality products and solutions to approxi-mately 10,000 customers. We manufacture a wide range of innovative engineered joining technology solutions in three product categories: Clamp, Connect and Fluid. Headquartered in Maintal near Frankfurt, we operate a worldwide network with 21 manufacturing centres and numerous sales and distribution sites across Europe, the Americas and Asia-Pacific.

Overview of Key Figures 2013
2013
2012 1)
Change
in %
Order situation
Order book (31 December) EUR million 236.7 215.4 9.9
Income statement
Revenue EUR million 635.5 604.6 5.1
Gross profit 2) EUR million 371.4 344.4 7.8
Adjusted EBITA3) EUR million 112.6 105.4 6.9
Adjusted EBITA margin % 17.7 17.4 0.3 Pts.
EBITA EUR million 112.1 105.1 6.7
Adjusted profit for the period 3) EUR million 62.1 61.8 0.4
Adjusted EPS EUR 1.95 1.94 0.5
Profit for the period EUR million 55.6 56.6 –1.8
EPS EUR 1.74 1.78 – 2.2
Pro-forma adjusted EPS EUR 1.95 1.94 0.5
Number of shares (weighted) 31,862,400 31,862,400
Cash flow
Operating cash flow EUR million 115.4 96.1 20.0
Operating net cash flow EUR million 103.9 81.0 28.2
Cash flow from investing activities EUR million – 43.4 – 58.1 25.3
Cash flow from financing activities EUR million 51.7 – 34.1 n / a
31 Dec 13
31 Dec 12
Change
in %
Balance sheet
Totals assets EUR million 823.7 691.8 19.1
Total equity EUR million 319.9 289.2 10.6
Equity ratio % 38.8 41.8 3 Pts.
Net debt EUR million 153.5 199.0 – 22.9
Employees
Core workforce 4,134 3,759 10.0
Share data
IPO 8 April 2011
Stock exchange Frankfurt Stock Exchange, Xetra
Market segment Regulated Market (Prime Standard), MDAX
ISIN DE000A1H8BV3
Security identification number A1H8BV
Ticker symbol NOEJ
Highest 2013 4) EUR 39.95
Lowest 2013 4) EUR 20.75
Year-end share price 31 December 2013 4) EUR 36.08
Market capitalisation as at 31 December 2013 EUR million 1,150.0
1) Restated due to effects from the application of IAS 19R. Date of publication: 2) Revenue including changes in inventories of finished goods and work in progress less raw materials and consumables used. 27 March 2014 3) Adjusted by non-recurring / non period-related costs, restructuring costs, as well as other group and normalised items
as well as depreciation from PPA adjustments.4) Xetra closing price.

Engineered Joining TechnologyTailored, high-tech productsdeveloped to meet specific
requirements of individualOEM customers
Distribution ServicesHigh-quality standardised brand products for a variety of applications
70 30
ENGINEERED JOINING TECHNOLOGY (EJT)
The EJT marketing strategy focusses on customised, engineered solutions which meet the specific application requirements of original equipment manufacturers (OEM). Our EJT products are built on our extensive engi-neering expertise and proven leadership in the field. We develop innovative, value-adding solutions for a wide range of application areas and markets. No matter whether it’s a single component, a multi-component unit or a complex system, all of our products are individually tailored to the exact requirements of our industrial customers. In our experience, once a customer includes one of our engineered joining solutions in their end product, it becomes an integral component of the system.
DISTRIBUTION SERVICES (DS)
In DS, we sell a wide range of high-quality, standardised joining technology products for a broad range of applications through various distribution channels to customers such as distributors, OEM aftermarket cus-tomers, technical wholesalers and hardware stores. The DS way-to-market benefits not only from our extensive geographic presence and global manufacturing, distribution and sales capacities, but also from its well-known brands, the customised packaging as well as our marketing expertise and the high availability of the products at the point of sale. We distribute DS products through our own global distribution network and representatives in more than 90 countries. We market our joining technology products under our well-known brand names:
NORMA Group brands
Ove
rvie
w K
ey F
igu
res
| N
OR
MA
Gro
up
DISTRIBUTION OF SALES BY SALES CHANNELS
in %
Two Strong Distribution Channels – Our Competitive Advantage

Innovative joining technology and the highest quality standards secured our market position for over 60 years now. We offer solutions for many different industries with our advanced products. In fact, we rank as the world’s market and technology leader in the area of joining technology thanks to the personal dedication of roughly 5,000 employees and our intellectual property rights portfolio that consists of more than 850 patents.

SizeThanks to the many different fields in which our products and solutions are used, we will have access to high market potential in the long term and thus excellent growth opportunities. Read more on p. 18.


Our power of innovation and the ability to identify future global trends are important prerequisites to achieve sustained growth. For this reason, we invest around four percent of our EJT sales in Research and Development. We are thus able to continue to develop new products and solutions and strengthen our position as technology leader in the area of joining technology. Read more on p. 28.
Innovation


Brands We market many strong and well-known brands through our Distribution Services. By systematically expanding our sales network, we ensure that our products and services are available all over the world. We will also continue to focus on successively expanding in order to address new markets and industries. Read more on p. 36.


PresenceBrazil is one of our key markets in expanding our business in South America. The fifth largest country in the world offers NORMA Group fertile ground for longterm, dynamic growth. We intend to continue to significantly expand our activities in this country in the years to come. Read more on p. 46.


NORMA Group SE Annual Report 2013
Annual Review 2013
Q12013 Q2 2013NORMA Group acquires Davydick & Co. Pty Ltd and strengthens its distribution network in Australia
Market launch of weight-optimized NORMAQUICK connector for cooling water systems
3i sells remaining NORMA Group shares, free float increases to 100 %
NORMA Group was included in the MDAX
Acquisition of Variant S.A., Poland, and expansion of business activities in Eastern Europe
Acquisition of Guyco Pty Ltd, an Australian distributor of join-ing products for various industries
Presentation of new high-performance clamp RedGrip at Paris Airshow
NORMA Group earns ‘Go Further Award for Business Excellence’ from Ford Motor Co.
NORMA Group receives ‘Best Technology Innovation Award’ from Chinese B2B automobile market place Gasgoo International
NORMA Group receives ‘Würth Award for Quality and Reliability of Supply’

Annual Review 2013
Q12014
Q3 2013 Q4 2013NORMA Group completes conversion into Societas Europaea (SE)
NORMA Group start setting up production in Atibaia, Brazil
NORMA Group secures business for innovative V profile clamp for Japanese car and engine manufacturer
NORMA Group receives major order from leading German vehicle and engine manufacturer for NORMAFLEX fluid systems
NORMA Group expands its product portfolio in the infrastructure division by the pipe connector NORMACONNECT VARIO PIPE
NORMA Group was recognized for quality performance in Thailand by Komatsu
NORMA Group earns ‘50 PPM-Award’ from PACCAR Inc., USA
NORMA Group successfully places promissory note of EUR 125 million
Market launch of improved ABA Mini clamp for use with thin-walled hoses
NORMA Group receives ‘Ford Q1 Award’ in Mexico for highest customer satisfaction
NORMA Group achieved 2nd place in the category ‘most in-novative newcomer’ at the European Small and Mid-Cap Awards 2013
NORMA Group receives major orders for fluid line systems and hose clamps in China
NORMA Group obtains large order for its innovative NORMA- FLEX fluid pipes from an Italian manufacturer of passenger cars and commercial vehicles
NORMA Group launches new range of compression fittings for fluid transfer and compressed air transportation
NORMA Group receives ‘Best Partner Award’ from General Motors Shanghai for high-quality product solutions and excellent logistics
Partial repayment of the original IPO financing from cash inflow of promissory note
NORMA Group receives ‘Best Medium Enterprise 2013 Award’ in Serbia

NORMA Group SE Annual Report 201312
Contents
15
22
50
Letter from the Management Board
To Our Shareholders
Consolidated Management Report
22 NORMA Group on the Capital Market 32 Supervisory Board Report 40 Corporate Governance Report
including Declaration of Conformity
52 Principles of the Group 64 Economic Report including Segment Reporting 91 Supplementary Report 92 Forecast 97 Risk and Opportunity Report 107 Remuneration Report for the Management
and Supervisory Boards 109 Other Legally Required Disclosures

13
112
194
Consolidated Financial Statements
Further Information
114 Consolidated Statement of Financial Position 116 Consolidated Statement of Comprehensive Income 117 Consolidated Statement of Cash Flows 118 Consolidated Statement of Changes in Equity 120 Segment Reporting 122 Notes to the Consolidated Financial Statements 176 Appendix to the Notes to the Consolidated
Financial Statements 179 Responsibility Statement 180 Auditor’s Report
194 Glossary 199 Overview by Quarter 2013 200 Multi-Year Overview
Financial Calendar 2014ContactImprint
EXPLANATION OF SYMBOLS
* Glossary @ Internet Cross Reference

Bernd KleinhensBoard Member Business Development
Dr. Othmar BelkerChief Financial Officer (CFO)
Werner DeggimChief Executive Officer (CEO)
John StephensonChief Operating Officer (COO)

15Letter from the Management Board
Letter from the Management Board
Dear shareholders, customers and business partners,
Despite the difficult economic climate, 2013 proved to be yet another good financial year for NORMA Group. We achieved most of our goals and resolutely continued writing our growth story. By making strategic acquisitions and expanding our capacities, we once again managed to lay important mile-stones for a sustainable positive development last year. And we set new records for both sales and earnings in 2013. We succeeded in achieving significant organic growth, particularly thanks to the dynamic market environment in the fourth quarter, and this makes us look forward to 2014 with optimism.
But let us begin by taking a look back at last year: We managed to increase our sales by 5.1 per cent in 2013 to EUR 635.5 million. EBITDA rose by around 7 per cent to almost EUR 130 million and thus once again exceeded last year’s high level. We succeeded in increasing our operational results (EBITA) by nearly 7 per cent to just under EUR 113 million. And with an operational EBITA margin of 17.7 per cent, we again achieved a record level well above the industry average. Despite the payments we made for acquisitions and the dividend, our net debt continued to decline to EUR 138 million (without hedg-ing instruments) last year.
Growth impulses came mainly from the new emission regulations from the EURO-6 Standard, which became mandatory for all newly registered commercial vehicles in the EU in January 2014. The start-ups of engines that this brought had a positive effect on our sales, particularly in the second half of the year.
Furthermore, the acquisitions we made last year also contributed to our growth. We managed to continue driving our strategy of expanding into important growth markets and additional customer industries through strategic acquisitions. We succeeded in strengthening NORMA Group’s presence in the Asia-Pacific region by acquiring the two Australian companies Davydick & Co. and Guyco. We also took yet another step into the promising irrigation market that we entered into by acquiring Chien Jin Plastic in Malaysia in 2012.
Construction of our new plant in Brazil marked yet another milestone in expanding our manufacturing in the fifth largest country in the world and strengthening our market position in South America.
By acquiring our sales partner Variant in Poland, we were able to optimise our supply processes and strengthen our position in Eastern Europe.

NORMA Group SE Annual Report 201316
Last year, we received several large orders for our fluid products, among others from customers in Germany, Italy and China, which only shows that our advanced solutions are in demand all over the world. The many awards we received from our customers and suppliers last year clearly show how satisfied our business partners are. At the same time, they encourage us to continue to meet our high quality standards for our products and processes that we set for ourselves in the future.
Our multi-industry strategy paid off again in 2013. Expanding our global presence and diversifying across many different customer industries will remain important goals in the future and become important growth drivers in the long term.
To also express how international our business is through our legal form, the Annual General Meeting approved of transforming NORMA Group AG into a European stock corporation (Societas Europaea) in May 2013. The new Company structure that took effect in July 2013 will emphasize NORMA Group’s open company culture and, at the same time, represents a commitment to our domestic European market.
Since our former major investor, the 3i plc Group, left us in January 2013, the free float of the NORMA Group share is now at 100 per cent. Thanks to the strong interest that international investors have shown and the considerably higher trading volumes compared with the previous year, we managed to advance from the SDAX to the MDAX in March 2013.
Dear shareholders, we are proud to see that NORMA Group now ranks among the 80 largest listed companies in Germany and has established itself as a promising growth value on the international capital markets after only three years of experience with the stock exchange.
Our strong operating performance and confidence in our business is also reflected in the remarkable development of our share, which rose by 72 per cent last year and beat out all of the respective in dexes by far. In July 2013, NORMA Group’s market capitalisation broke through the billion barrier for the first time ever. In November, our share reached EUR 39.95, the highest level it had ever seen before. At the end of December 2013, our Company was valued at EUR 1.2 billion on the stock exchange, and even continued to increase in value during the first quarter of 2014.
Our good reputation on the capital market, strong balance sheet and solid financial situation represent important success factors for our business that ensure that we receive favourable refinancing oppor-tunities on the international money and capital markets. For example, the promissory note we issued in mid-2013 also met with strong acceptance among international investors. Furthermore, we also benefitted from advantageous framework conditions on the foreign capital markets, which enabled us to secure attractive financing conditions for ourselves. By issuing the promissory note, we were able to further diversify our financing instruments on the one hand and lay an additional foundation for future acquisitions and sustainable growth on the other.
We will continue writing NORMA Group’s success story during the current year also. By focussing closely on innovations, we plan to continue meeting our customers’ high demands for specific system solutions and thus strengthen our leading market and technological position even further in the future. Continued expansion of our global presence and entry into new industries remain our strategic fo cuses. We expect to see increased demand for advanced joining technology particularly in the emerging countries in the Asian-Pacific region and South America. We have therefore intensified our activities in these regions.

17Letter from the Management Board
Stricter emission regulations that also result from climate change present us and our business partners with special challenges. On the one hand, we benefit from these developments because our innovative solutions make a significant contribution to reducing emissions, leakages and the weight of our cus-tomers’ end products. On the other hand, we also bear a great deal of responsibility for our environment and society. Sustainable and responsible business practices, Corporate Responsibility (CR), is there-fore part of securing the future of NORMA Group and an integral component of our Group strategy. We began formulating long-term objectives and central CR-activities back in 2012. In order to anchor these in our Company guidelines more firmly, we published our sustainability strategy on our website at the end of February 2014. We will also continue to work hard on achieving the goals formulated here in the years to come.
Dear shareholders, we would also like to thank you for the trust you have shown in our Company. We are pleased to have you participate again appropriately in our good net profit that we earned in finan-cial year 2013. For this reason, we will be proposing a dividend of EUR 0.70 for the financial year 2013 at our Annual General Meeting to be held on 21 May 2014. This means we will have increased the dividend again by another EUR 0.05 compared to last year.
Last, but not least, we would like to thank our close to 5,000 employees all over the world who con-tribute to the success of NORMA Group each day through their hard work. Moreover, we would like to thank our customers and business partners for our good and trusting relationships. We look forward to the months to come and hope you will continue to support us.
Sincerely,
Werner DeggimCEO
Dr. Othmar BelkerCFO
Bernd KleinhensBusiness Development
John StephensonCOO

Focus on growth – NORMA Group is only active in industries that are experiencing growth. The demand for mature joining technology remains on the rise, particularly in the emerging economies in the AsiaPacific region. This will create promising growth opportunities for us.
SIZE


NORMAQUICK® PS 3
Source: LMC Automotive
LIGHT VEHICLE SALES (IN MILLIONS)
EMEA Americas APAC
2015e
2013e
23.6
19.1
17.7
2020e
28.4 54.6
42.0
35.9
25.6
24.0

“ We take advantage of the innovation dynamics in the automotive industry and apply our expertise to other areas in the field of joining technology. We strengthen our position as the world’s leading supplier of engineered joining technology by focussing on growth markets, such as the pharmaceutic and biotech industries, but also aviation and the water industry.”Sophie Zhang Finance Controller NORMA China, China

NORMA Group SE Annual Report 201322
NORMA Group on the Capital Market
NORMA Group share rises by 72 % in 2013 and beats all indices
Higher market capitalisation and trading volume pave the way into the MDAX
Number of private shareholders increased
MONETARY POLICY DECISIONS SHAPE THE TREND ON
THE CAPITAL MARKETS
International stock markets performed positively in 2013 over the year as a whole. The important key indices of industrial nations recorded high profits and even reached new record levels in some cases. In contrast, interest on classic low-risk investments such as federal government bonds persisted throughout the year at a very low level. Even the risk premiums on interest for European crisis countries fell over the course of the year, thereby signalling a slow recovery from the debt crisis.
The common currency – the euro – appreciated significantly against important currencies such as the USD, JPY and GBD. In exchange, gold as a ‘crisis investment’ lost over 25 per cent in value over the course of the year and thus fell to its lowest level in two years.
The monetary policy decisions of industrial nations’ central banks were the main driver of these developments. The low interest policy that peaked in November 2013 with the surprising decrease in the European key interest rate to a record low of 25 basis points as well as unlimited bond purchases on the part of the US central bank (FED) boosted international stock markets. A global eco-nomic recovery and companies’ positive fundamental data also supported this development. At most, the conflict in the Middle East and the impending fiscal cliff in the USA only temporarily curbed capital markets in 2013.
For instance, the indices S&P 500, Eurostoxx 50, Dow Jones and NIKKEI closed in December 2013 with a strong double-digit per-centage increase. The leading German index DAX ended the year with a plus of around 26 per cent at 9,552 points. The MDAX recorded a gain of around 40 per cent and closed at 16,574 points.
NORMA GROUP SHARE
CONTINUES UPWARD TREND
The share of NORMA Group SE also continued its upward trend in 2013 and rose from EUR 21.00 on 31 December 2012 to EUR 36.085 on 31 December 2013. This corresponds to a year-over-year price increase of around 72 per cent.
NORMA Group’s market capitalisation exceeded the billion mark for the first time in July 2013. The NORMA Group share reached its previous peak value of EUR 39.95 on 11 November 2013. On 31 December 2013, the market capitalisation amounted to EUR 1.15 billion (2012: EUR 669.1 million).
FREE FLOAT OF 100 PERCENT SINCE JANUARY 2013
At the end of 2012, the main shareholders 3i Group plc and funds managed by 3i held around 5.3 million NORMA Group shares. This corresponded to a shareholding of 16.7 per cent. At the beginning of 2013, 3i sold its remaining shares in NORMA Group, thereby decreasing its shareholding to 0 per cent. Since then, 100 per cent of the shares have been widely held.
SIGNIFICANTLY HIGHER TRADING VOLUME
At 86,570 shares per day, the NORMA Group share’s average Xetra trading volume was up significantly over the previous year (2012: 54,432 shares) in the period from January to December 2013. The value of the average daily Xetra trading volume was EUR 2.53 million (2012: EUR 1.04 million). Thus, around 98 per cent of all official trading in Germany took place over the XETRA in 2013 (2012: 90.3 per cent).

23To Our Shareholders
NORMA Group on the Capital Market
Trading over alternative platforms also increased considerably year-on-year. An average of 30,656 million shares per day were traded on alternative platforms in the past year (2012: 11,627 shares). This corresponds to around 14.6 per cent of all transac-tions. An average of 90,870 shares per day (2012: 90,401 shares) exchanged hands through block trades in 2013. This does not include the roughly 10.5 million shares that were traded as part of a private placement of the shares of 3i Group plc.
The total average number of daily traded shares was 209,887 in 2013 (2012: 164,329 shares).
NORMA ADMITTED TO THE MDAX
As a result of the increased trading volume and greater market capitalisation of the widely held stock, the NORMA Group share rose from the SDAX to the MDAX in March 2013. The NORMA Group share ranked 38th in the category of ‘free float market capitalisation’ in the MDAX in December 2013; it ranked 46th within the MDAX in trading volume.
In addition to the MDAX, the NORMA Group share is also includ-ed in the following indices: CDAX, Classic All Share, Prime All Share, DAXsector All Industrial, DAX International 100, DAXsec-tor Industrial, DAXsubsector, All Industrial Products & Services, DAXsubsector Industrial Products & Services, DAXsubsector Industrials, HDAX, MIDCAP MKT PR, MIDCAP MKT TR, Trade-gate Indikator.
INSTITUTIONAL INVESTORS
According to the voting rights notifications received in 2013, shares of NORMA Group designated as free floating are held by the following institutional investors:
Ameriprise Financial Inc. 9.96 per cent
Allianz Global Investors Europe GmbH 5.75 per cent
Mondrian Investment Partners, Ltd. 5.34 per cent
T. Rowe Price International, Ltd. 3.02 per cent
Blackrock Group Ltd. 3.02 per cent
DWS Investment GmbH 2.98 per cent
BNP Paribas Investment Partners Belgium S.A. 2.98 per cent
Oddo Asset Management S. A. 2.84 per cent
As at 31 December 2013. More information regarding the voting rights can be found on p. 176.
The Management Board and Supervisory Board of NORMA Group SE hold around 2.5 per cent of the shares.
Jan Feb March April May June July Aug Sep Oct Nov Dec
80
70
60
50
40
30
20
10
0
SHARE PRICE PERFORMANCE INDEXED TO 100 IN COMPARISON TO THE MDAX AND DAX
in % NORMA Group SE MDAX DAX

NORMA Group SE Annual Report 201324
International investors increased in significance due to the place-ment of shares on the part of 3i. In particular investors in the USA increased their investment in our share. The identifiable share-holdings of institutional investors can be broken down by region as follows:
USA: 24 % Germany: 21 % United Kingdom: 26 % Nordic: 10 % France: 12 % Rest of the world: 7 %
The number of private investors more than tripled from 623 to 2,149 in the past year. However, private investors only hold 1.53 per cent of all the shares.
SUSTAINABLE INVESTOR RELATIONS ACTIVITIES
In 2013, we also consistently pursued our goal of increasing the name recognition of NORMA Group SE around the world and cementing and augmenting the perception of the NORMA Group share as an attractive growth value. We supported the strategic orientation of NORMA Group’s focus, which is directed on sus-tainable growth and permanently high margins through continu-ous, open and reliable communication with institutional investors, private investors and analysts. We intend to further strengthen trust in our share and achieve a realistic and fair valuation.
In 2013, we held numerous discussions with institutional inves-tors, financial analysts and private shareholders. We were pres-ent at 16 capital market conferences and conducted 34 road-shows in Europe and North America’s important financial centres. The Management Board personally attended many of these events and addressed the questions of capital market partici-pants.
100 % Free float
SHAREHOLDER STRUCTUREDISTRIBUTION OF TRADING ACTIVITY
Excluding the shares that were traded as part of the private placement of the shares of 3i Group plc in January 2013.
42 % Official trading
43 % Block trades
15 % Multilateral trading facilities

25To Our Shareholders
NORMA Group on the Capital Market
We presented at the following conferences in 2013:
Commerzbank German Investment Seminar, New York Cheuvreux German Corporate Conference, Frankfurt / Main Deutsche Bank Small & Mid Cap Conference, London Goldman Sachs European Small & Mid Cap Symposium, London
Deutsche Bank German, Swiss & Austrian Conference, Frankfurt / Main
Société Générale Mid Caps Conference, Nice Exane BNP Paribas German Mid Caps Day, London UBS Pan European Small & Mid Cap Conference, London Commerzbank Sector Conference, Frankfurt / Main HSBC Capital Goods Conference, London UBS Best of Germany Conference, New York Berenberg / Goldman Sachs German Corporate Conference, Munich
Baader Investment Conference, Munich Exane BNP Paribas, Mid Cap Forum, London Analyst & Investor Conference, Frankfurt / Main Berenberg European Conference, London
Those interested in receiving our circular letter for investors can register in the investor relations area of our website @ www.normagroup.com. They are informed promptly by e-mail of de velop ments in the Group and automatically receive our regu-lar publications. Furthermore, we publish comprehensive infor-mation on the NORMA Group share on our website. In addition to financial reports and presentations that can be downloaded, all important financial market dates and details on how to reach our contact partners can be found there. The teleconferences on our quarterly and annual financial statements are recorded and offered in audio format.
FREE FLOAT BY REGION
in %
21 Germany
10 Nordic
7 Rest of world
26 UK
US 24
France 12
ANALYST RECOMMENDATIONS
8 Buy/ Outperform
Sell 4
Hold 6
RESEARCH COVERAGE AT A HIGH LEVEL
The number of banks and research companies that accompany NORMA Group rose from 16 to 18 in the past year. We aim to further increase the number of analysts.
As at 31 December 2013, there are 8 recommendations to ‘buy’, 6 to ‘hold’ and 4 to ‘sell’. The average price target was EUR 35.81 at the end of the year and thus around 60 per cent higher than on 31 December 2012 (EUR 22.47).
RESEARCH COVERAGE OF NORMA GROUP SHARE
Baader Bank Peter Rothenaicher
Bankhaus Metzler Jürgen Pieper
Bank of America Merrill Lynch Paul R. Hartley, Bernard Donges
Berenberg Benjamin Gläser
Close Brothers Seydler Daniel Kukalj
Commerzbank Ingo-Martin Schachel
Deutsche Bank Tim Rokossa
DZ Bank Jasko Terzic
Exane BNP Paribas Gerhard Orgonas
Goldman Sachs Will Wyman
Hauck & Aufhäuser Philippe Lorrain
HSBC Jörg-Andre Finke
Kepler Chevreux Hans-Joachim Heimbürger
LFG Kronos Thomas Aney
Macquarie Christian Breitsprecher
MainFirst Tobias Fahrenholz
NordLB Frank Schwope
Warburg Research Christian Cohrs
NORMA Group SE Annual Report 201326
2013 ANNUAL GENERAL MEETING
The second Ordinary Annual General Meeting of NORMA Group AG was held in Frankfurt / Main on 22 May 2013. 11.8 million of the 31.8 million shares with voting rights, i. e. 37.1 per cent, were represented at the meeting. The participating shareholders re-solved a dividend of EUR 0.65 per share. This corresponded to a distribution rate of 33.5 per cent based on NORMA Group’s adjusted net profit for the financial year of EUR 61.8 million. All other items on the agenda were approved with majorities of more than 98 per cent.
NORMA GROUP RECEIVED NUMEROUS AWARDS
Our 2012 annual report excelled in numerous national and inter-national competitions and received the following awards
manager magazinIn manager magazin’s ‘Best Annual Report 2013’ ranking, we placed 7th in overall scoring out of 50 in the MDAX segment. Thus, we finished directly in the Top 10 of this competitive seg-ment only a short time after the NORMA Group share was ad-mitted to the MDAX with the second annual report since our IPO. Our report took 19th place in the overall comparison of the 160 annual reports examined.
manager magazin’s competition is the most comprehensive analysis of annual reports in Germany and Europe as well as one of the largest worldwide. The goal of the competition is to motivate companies to improve the quality of their annual reports in order to better serve the interests of the users of the financial state-ments.
40
35
30
25
20
15
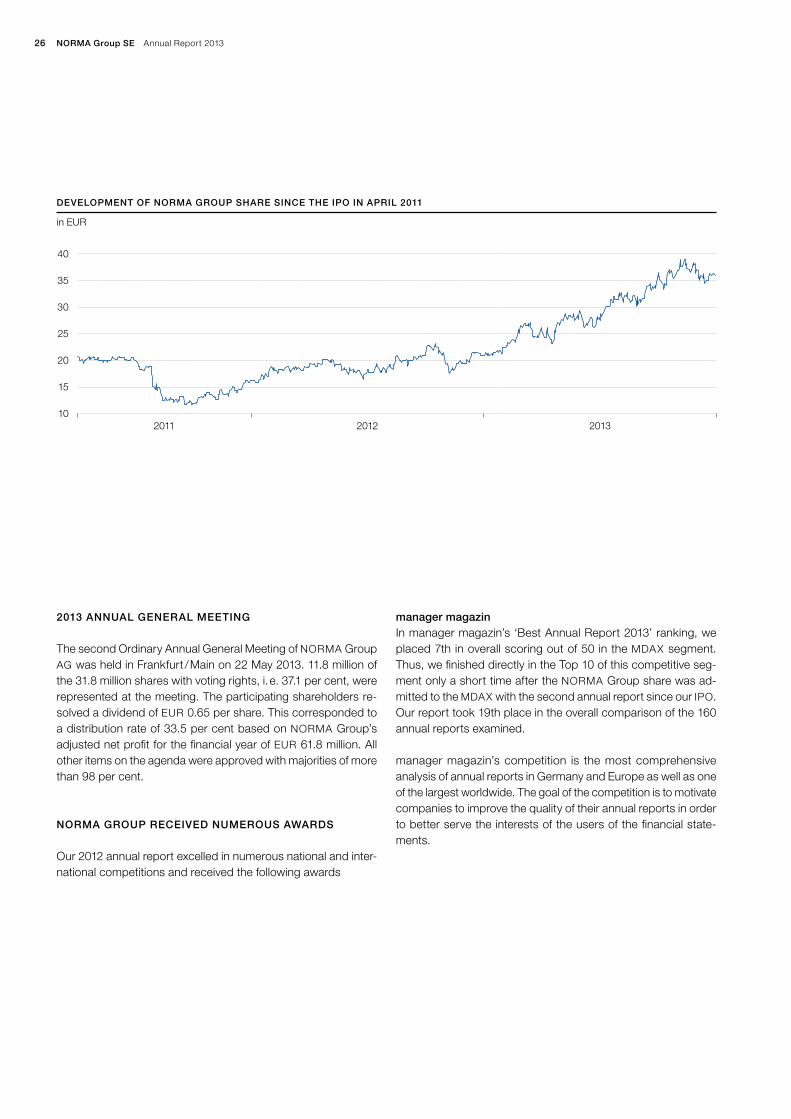
10
DEVELOPMENT OF NORMA GROUP SHARE SINCE THE IPO IN APRIL 2011
in EUR
201320122011

27To Our Shareholders
NORMA Group on the Capital Market
KEY FIGURES OF THE NORMA GROUP SHARE SINCE THE IPO
2013
2012
2011
8 April 2011 1)
Closing price on 31 December (in EUR) 36.085 21.00 16.00 21.00 2)
Highest price (in EUR) 39.95 23.10 21.58 n/a
Lowest price (in EUR) 21.00 15.85 11.41 n/a
Closing level MDAX as at 31 December 3) 16,574 11,914 8,897 10,539
Closing level SDAX as at 31 December 4) 6,788 5,249 4,421 5,230
Number of unweighted shares as at 31 December 31,862,400 31,862,400 31,862,400 31,862,400
Market capitalisation as at 31 December (in EUR millions) 1,150 669.1 509.8 669.1
Average daily Xetra volume
Shares 86,570 54,432 46,393 n/a
EUR million 2.53 1.04 1.45 n/a
Earnings per share (in EUR) 1.74 1.78 1.19 n/a
Adjusted earnings per share (in EUR) 1.95 1.94 1.92 n/a
Dividends per share (in EUR) 0.70 0.65 0.60 n/a
Dividend yield (in %) 1.9 3.1 3.8 n/a
Distribution rate (in %) 35.9 33.5 33.2 n/a
Price-earnings ratio 20.7 11.8 13.4 n/a
1) IPO and first trading day of the NORMA Group share2) Issuing price3) NORMA Group share in the MDAX since 18 March 20134) NORMA Group share in the SDAX from 8 June 2011 to 17 March 2013
LACP Vision Award GoldIn addition, we received the ‘LACP Vision Award Gold’ with 98 out of 100 possible points in the category of ‘Other Industries’ of the League of American Communication Professionals (LACP). More than 6,000 entries from over 24 countries were submitted during this competition, whereby we prevailed against strong international competitors and received the maximum number of points in each of the categories of report cover, letter to share-holders, report narrative and creativity as well as the trans parency and accessibility of information.
Annual Report CompetitionIn the 2013 ‘Annual Report Competition’ (ARC), NORMA Group’s annual report was awarded a ‘Bronze’ certificate in the category of ‘Traditional Annual Report: Connection Method’ The ARC Award is given annually and honours outstanding achievements with respect to contents and original design. At the same time, it sets the benchmark for the highest standards of quality for annual reports.
GOOD DESIGN Award 2013The 2012 annual report of NORMA Group SE prevailed against multiple thousand entries from over 48 countries and is among the 700 product and graphic designs from over 38 countries chosen by the jury. The ‘GOOD DESIGN Award’ is presented every year by the Chicago Athenaeum Museum of Architecture and Design and European Centre for Architecture Art Design and Urban Studies for outstanding design excellence.
European Small and Mid-Cap Awards 2013We also took second place in the ‘European Small and Mid-Cap Awards 2013’ in the category of ‘most innovative newcomer.’ The award is a common initiative of the European Commission, the Federation of European Securities Exchanges (FESE) and the European Association of Issuers, European Issuers. The goal is to increase the visibility of small and medium-sized enterprises on the capital market.

INNOVATION
Technology in transition – Effective January 2014, the EURO6 standard now applies for all new heavy commercial vehicles. Starting in September 2014, the exhaust emission regulation will also be mandatory for newly registered diesel and petrol cars. Increasing government regulation places high demands on vehicle manufacturers and the complexity of their engines – yet another growth driver for NORMA Group and its engineered joining technology.

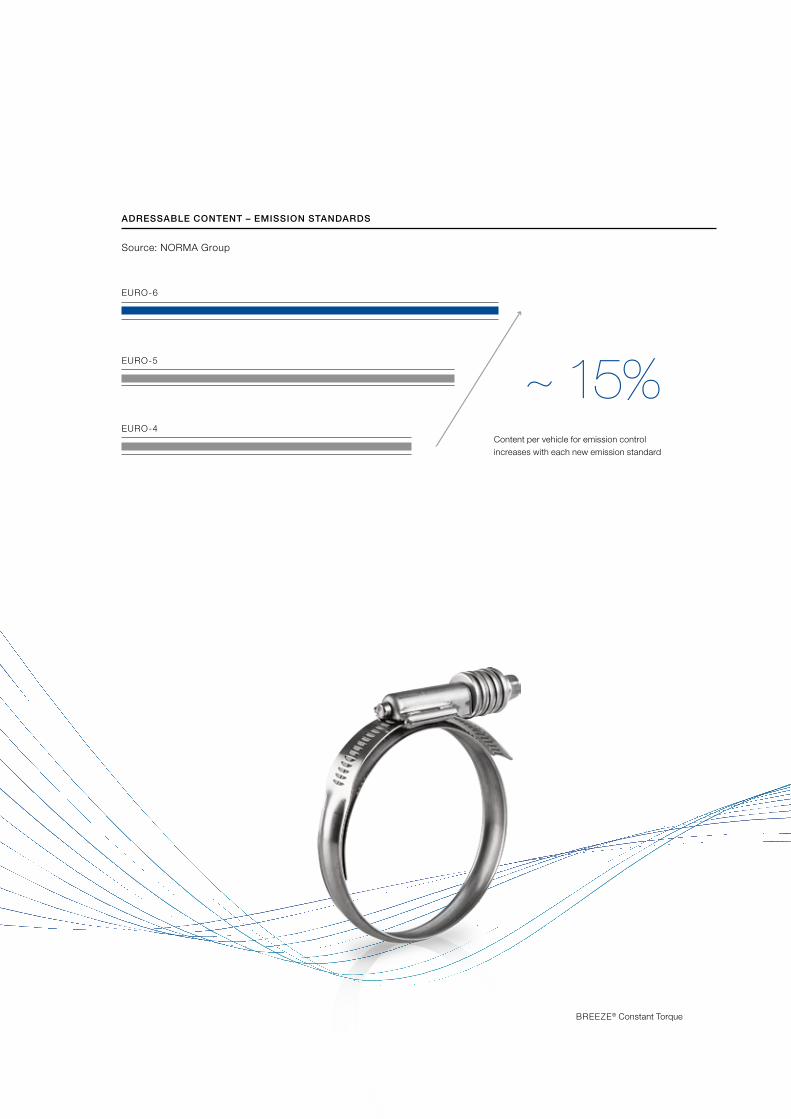
BREEZE® Constant Torque
Source: NORMA Group
Content per vehicle for emission control increases with each new emission standard
ADRESSABLE CONTENT – EMISSION STANDARDS
EURO-4
EURO-5
EURO-6
~ 15%

“ We have been developing innovative, high performance products for our customers for over 60 years. Thanks to our long years of experience and application knowhow, we are the innovation leader in the area of joining technology and continue to set new standards for applications across all industries.”Michael Potts Vice President Sales & Application Engineering NORMA Americas, USA

NORMA Group SE Annual Report 201332
NORMA Group SE Supervisory Board Report
The Supervisory Board of NORMA Group SE has monitored and advised on the activities of the Management Board in financial year 2013 in accordance with the rules of the German Stock Corporation Act, the German Corporate Governance Code and NORMA Group SE’s (and previous to that NORMA Group AG’s) Articles of Association. Until the entry of the transformation in the commercial register on 4 July 2013, NORMA Group SE traded as NORMA Group AG with a Supervisory Board comprised of the same members.
The Management Board provides the Supervisory Board with regular written reports on a monthly basis. These reports cover the state of the economy, the business development of NORMA Group SE and the Group as well as the forecast for the current financial year, and give a detailed account of incoming orders, the order book and the development of both sales and earnings compared to the previous year and current targets.
In financial year 2013, NORMA Group AG’s Supervisory Board convened for two regular meetings and NORMA Group SE’s Board for another two ordinary meetings. Additional Superviso-ry Board meetings were also conducted as needed via telecon-ference on short notice.
The Management Board provided extensive information about the current course of business at the Supervisory Board’s regu-lar meetings. In particular, all key figures for the Group and the SE were discussed at these meetings and compared to the pre-vious year’s figures and current targets. At every meeting, the Management Board provided the Supervisory Board with infor-mation concerning the order situation as well as their assessment of the economic outlook, market developments and NORMA Group’s competitors. At each regular meeting of the Super visory Board, the Management Board also presents a risk report in which the probability of occurrence and potential effects of all relevant risks are assessed. This regular risk reporting provides the Supervisory Board with a clear picture of which possible risks could have a negative impact on the Company’s cash flows and financial performance. The Supervisory Board worked together with the Management Board to develop measures to avoid the risks that were considered highly relevant and likely to occur. In addition, the Supervisory Board and Management Board dis-
cussed NORMA Group’s long-term strategic orientation and current M&A projects. In addition to the regularly recurring topics, the Supervisory Board also dealt with the following issues in finan cial year 2013:
TELEPHONIC SUPERVISORY BOARD MEETING OF
NORMA GROUP AG HELD ON 8 FEBRUARY 2013
The members of the Supervisory Board unanimously decided to recommend Erika Schulte as a candidate for election to NORMA Group AG’s Supervisory Board. Lars Berg was elected as Vice Chairman of the Supervisory Board and as a member of the General and Nomination Committees.
SUPERVISORY BOARD MEETING HELD ON
26 MARCH 2013 IN MAINTAL
The 2012 annual financial statements and management report of NORMA Group AG as well as the corresponding consolidated financial statements and group management report presented by the Management Board were discussed in detail by the Super-visory Board with the auditors in attendance from the engaged auditing firm, PricewaterhouseCoopers AG. This discussion focused, among other things, on the acquisitions made that year, corporate restructuring in the APAC region and the internal con-trol system. The members of the Audit Committee reported on their in-depth discussion with the auditors on 25 March 2013 regarding various impairment tests and inventory management.The consolidated financial statements of NORMA Group AG were prepared in accordance with section 315a of the German Com-mercial Code (Handelsgesetzbuch, HGB) on the basis of Inter-national Financial Reporting Standards (IFRS). The auditor issued an unqualified opinion for the 2012 annual financial statements and management report of NORMA Group AG as well as for the consolidated financial statements and group management report. The documents pertaining to the financial statements, the Manage ment Board’s proposal for the appropriation of net profit and both auditors’ reports were submitted to the Supervisory Board. The Supervisory Board accepted the auditor’s findings and had no objections.

33To Our Shareholders
Supervisory Board Report
The Supervisory Board then approved and adopted the annual financial statements of NORMA Group AG as well as the 2012 consolidated financial statements along with the associated man-agement reports. The Supervisory Board also approved the Management Board’s recommendation on the utilisation of un-appropriated net profits.
The Supervisory Board dealt with NORMA Group’s compliance programme, for which current drafts of the code of conduct, the anti-corruption policy and anti-corruption compliance procedures and the conflict of interest review policy were presented, among other things. All members of the Supervisory Board approved the current compliance programme subsequent to the meeting.
The presentation of the current risk management report on the part of the Management Board involved in particular the dis-cussion of a legal dispute in the USA. The Management Board presented various acquisition targets as part of its long-term strategic orientation project. The Supervisory Board discussed various acquisition cases and approved the acquisition of the distribution business of the Polish entity Variant S.A. as well as the acquisition of capital goods in Brazil.
The Supervisory Board discussed the possibility and general terms of a promissory note loan to improve NORMA Group’s finan cing structure and unanimously approved the issue of a promissory note loan with 5, 7 and 10 year tranches.
The Supervisory Board’s examination of the efficiency of its activi ties specified in the German Corporate Governance Code was carried out in the Supervisory Board meeting held on 26 March 2013.
SUPERVISORY BOARD MEETING HELD ON 22 MAY 2013
IN FRANKFURT/MAIN
The Supervisory Board meeting began immediately following the second annual shareholders’ meeting of NORMA Group AG with a review of the successfully concluded annual shareholders’ meeting.
The detailed discussion of current business developments in-cluded in particular the various developments in the various re-gional segments. The Supervisory Board approved a capital increase on the part of the subsidiary in Serbia, which currently represents new production facilities under construction.
The Management Board presented the possible acquisition of the Australian trading company Guyco under the agenda item ‘Strategic Projects and Acquisitions.’ The Supervisory Board discussed the determination of the purchase price and potential integration steps. Directly after the meeting, all members of the Supervisory Board approved the acquisition.
The Management Board and Supervisory Board discussed the schedule and general environment for the construction of a pro-duction plant in Brazil.
Potential deviations in quality on the part of subcontractors, among other things, were discussed under the topic of risk man-agement.
SUPERVISORY BOARD MEETING OF NORMA GROUP SE
HELD ON 20 SEPTEMBER 2013 IN MAINTAL
In the first Supervisory Board meeting after the transformation of NORMA Group AG into an SE (Societas Europaea), the Manage-ment Board reported in detail on the Group’s business per-formance in the first eight months of 2013. The subsequent dis-cussion focused, among other things, on an initiative to improve machine security introduced following a recent workplace acci-dent, an initiative to further improve customer satisfaction, current customer complaints and the ensuing customer claims. The preliminary results of ongoing tax audits in overseas were pre-sented and discussed. The influence of a successfully placed promissory note was presented during the financial reporting.
The Supervisory Board was informed of the commencement of an occasion-independent audit by the German Financial Report-ing Enforcement Panel (Prüfstelle für Rechnungslegung, DPR) of the annual and quarterly financial statements of NORMA Group AG / SE.
Dr. Stefan WolfChairman of the Supervisory Board

NORMA Group SE Annual Report 201334
The Management Board reported on the business trend in the APAC region. The Management Board and Supervisory Board discussed the selection criteria for potential acquisition targets and various acquisition approaches in Taiwan and the USA. The Supervisory Board approved the due diligence of various acqui-sition targets following an in-depth discussion.
The Supervisory Board approved the formation of a lease for the expansion of the Distribution Center North America (Michigan, USA) as well as the exercise of a purchase option on the land and building for the plant and administrative offices in Auburn Hills (Michigan, USA).
The Management Board presented the next steps for further simplifying the Group’s corporate structure by reducing the number of intermediate holding companies and introduction of clear regional structures. The Supervisory Board agreed to this reorganisation.
The Supervisory Board of NORMA Group SE unanimously con-firmed the composition of the SE’s Supervisory Board as pre-viously at NORMA Group AG:
Chairman of the Supervisory Board: Dr. Stefan Wolf Vice Chairman of the Supervisory Board: Lars Berg General and Nomination Committee: Dr. Stefan Wolf (Chairman), Lars Berg, Dr. Christoph Schug
Audit Committee: Dr. Christoph Schug (Chairman), Lars Berg, Knut Michelberger
The Supervisory Board unanimously approved the revision of the by-laws of NORMA Group SE’s Supervisory Board as well as the by-laws of its Management Board in their final versions. These were necessary due to the transformation of the Company from a stock corporation into an SE.
SUPERVISORY BOARD MEETING OF NORMA GROUP SE
HELD ON 27 NOVEMBER 2013 IN MAINTAL
The Management Board provided the Supervisory Board with the 2014 budget as well as the 2015–2018 medium-term plan. The expected market trend, NORMA Group’s business develop-ment and key cost items were discussed in detail. This also in-cluded the influence of the expansion of production as a result of the construction of new plants currently underway in China and Brazil as well as the expansion of the new plant in Serbia. In addition to cost planning, the balance sheet planning and develop ment of cash flows was discussed in detail. Due to the changes in the external value of the euro, in particular against the US dollar, the exchange rates used in the budget process were adjusted to reflect the expected trend.
The 2014 budget and the medium-term plan for 2015–2018 were approved unanimously by the Supervisory Board.
The Management Board and Supervisory Board discussed the current risk reporting, focussing on issues related to ensuring the capacity for innovation.
The Management Board informed the Supervisory Board on the current status of ongoing M&A projects.
The Supervisory Board approved the formation of a lease for the Russian plant in Togliatti.
The Supervisory Board acknowledged the goal of partially re-paying the existing financing from funds received from the newly issued promissory note loan.
Erika Schulte, Dr. Stefan Wolf, Lars Berg, Dr. Günter Hauptmann, Knut Michelberger and Dr. Christoph Schug participated in all Supervisory Board meetings.
The General and Nomination Committee convened once in 2013. The Supervisory Board approved the preparation of contract documents to dispatch a member of the Management Board as the President of the APAC region in 2014.
There were no conflicts of interest between the members of the Supervisory Board and the Company in the 2013 financial year.
In addition to the regular monthly reporting and the Supervisory Board meetings, the Chairman of the Supervisory Board re-mained in constant contact with the Chairman of the Manage-ment Board by telephone and e-mail in the 2013 financial year. This communication dealt with assessments of the Company’s economic situation, important transactions and events and the progress of ongoing projects. The Chairman of the Supervisory Board informed the other members of the Supervisory Board of the important and relevant issues discussed by the Chairman of the Supervisory Board and the Chairman of the Management Board by e-mail and by phone.
The Management Board promptly alerted the Supervisory Board of all transactions requiring its approval in the 2013 financial year. The Supervisory Board made all of its decisions on the basis of detailed and well-founded documents.
As the Chairman of the Audit Committee, Dr. Schug regularly reported on the committee’s meetings in several Supervisory Board meetings.
The Audit Committee of NORMA Group convened four times in the financial year just ended. In addition, it held three detailed telephone conferences with the auditors concerning the annual

35To Our Shareholders
Supervisory Board Report
audit and how it was to be prepared. Knut Michelberger and Dr. Christoph Schug as the Chairman participated in all meetings of the Audit Committee. Lars Berg was prevented from participating in an ordinary meeting on the subject of Supervisory Board re-porting. CFO Dr. Othmar Belker from the Management Board at tended the meetings, as did officers of the second management level to advise on technical issues in their areas of responsibility. The auditors Dr. Ulrich Störk and Benjamin Hessel from Price-waterhouseCoopers AG participated in the Supervisory Board meeting to approve the balance sheet as well as in four Audit Committee meetings and / or teleconferences. The Audit Com-mittee accompanied the audit of the annual financial statements and discussed core controls and areas of audit emphasis as well as the preliminary and final results of the audit with the auditors. In addition to an in-depth discussion on the execution and results of the audit of the SE / stock corporation and consolidated finan-cial statements as well as individual accounting issues, the Audit Committee regularly dealt with the risk reporting (including special individual risks from the area of taxes, litigation, the profitability of subsidiaries and quality issues), the compliance system and individual compliance topics, internal auditing, the audit conduct-ed by DPR, the Treasury and financing with a focus on the issue of a promissory note loan, the integration of newly acquired com-panies and the efficiency of Supervisory Board reporting as well as the detailed analysis of the planning process and budgeting.
In addition to the Audit Committee meetings, the Chairman of the Audit Committee was in regular personal and telephone con-tact with the CFO and held a separate meeting with the auditors and the CFO to discuss possible areas of emphasis for the audit of the 2013 annual financial statements.
The 2013 annual financial statements for NORMA Group SE pre-sented by the Management Board were audited by the auditing firm PricewaterhouseCoopers AG along with the management report and the corresponding consolidated financial statements and group management report. The auditors were engaged on 14 August 2013.
The consolidated financial statements of NORMA Group SE were prepared in accordance with section 315a of the German Com-mercial Code (Handelsgesetzbuch, HGB) on the basis of Inter-national Financial Reporting Standards (IFRS). The auditor issued an unqualified opinion for the 2013 annual financial statements and management report of NORMA Group SE as well as for the consolidated financial statements and group management report. The documents pertaining to the financial statements, the Man-agement Board’s proposal for the appropriation of net profit and both auditors’ reports were submitted to the Supervisory Board. The Audit Committee and the Supervisory Board in its entirety thoroughly examined the reports and discussed and scrutinised them in detail together with the auditor. The Supervisory Board accepted the auditor’s findings and had no objections.
The Supervisory Board approved the annual financial statements of NORMA Group SE and the 2013 consolidated financial state-ments together with their respective management reports at its meeting on 26 March 2014. NORMA Group AG’s annual financial statements are thereby adopted in accordance with section 172 of the German Stock Corporation Act (Aktiengesetz, AktG). The Supervisory Board approved the Management Board’s recom-mendation on the utilisation of unappropriated net profits at the same meeting.
The Supervisory Board dealt with the declaration of conformity with the Corporate Governance Code and issued the version on 4 March 2013. The Supervisory Board had approved the current version on 20 February 2014. NORMA Group SE’s dec-laration of conformity is available on the Company’s website at @ www.normagroup.de.
The Supervisory Board would like to thank the Management Board and all employees of NORMA Group SE as well as the Group companies all around the world for their successful efforts in the 2013 financial year. These results would not have been possible without the commitment of all employees. The Super-visory Board considers the successful year 2013 a source of motivation for all of the Group’s employees to remain committed to the course in 2014 and contribute to NORMA Group’s con-tinued profitable growth.
Dettingen / Erms, 26 March 2014
Dr. Stefan WolfChairman of the Supervisory Board

Everything is in flow – New industries will open up even more growth opportunities for NORMA Group. The acquisition of the Davydick distribution business last year marked an important step toward expanding our business activities in Australia and entering the promising future water market.
BRANDS


NORMAFLEX® CVS
Sources: OECD, NORMA Group
GLOBAL DEMAND FOR WATER 2000–2050 IN KM³
Irrigation Private households Livestock breeding Industry Power generation
+ 53 %2000
2,049
2,384
2050
790
348
44
27
1,195
236
1,386
568

“ We offer our customers stateof theart technology for use in a wide variety of industrial applications. Whether it’s pharmaceuticals, the biotech industry, the water industry, aviation, or agriculture, our brands stand for superior quality and the high performance of our products.”Jean-Luc Kirmann Director of Application Engineering NORMA EMEA, France

NORMA Group SE Annual Report 201340
Corporate Governance Report including Declaration of Conformity
Corporate governance ensures the long-term development of NORMA Group and the permanent growth of our Group. We are aware of our economic and social responsibility to our share-holders, employees, business partners and our social environ-ment. Therefore, our corporate management is based on sus-tainability and transparency. Corporate responsibility, p 88.
The following is the Management Board’s declaration of confor-mity in accordance with Section 289a of the German Commercial Code (Handelsgesetzbuch, HGB) and section 3.10 of the German Corporate Governance Code. The declaration is part of the group management report.
1. DECLARATION OF CONFORMITY WITH THE
GERMAN CORPORATE GOVERNANCE CODE
OF THE MANAGEMENT AND SUPERVISORY BOARD
OF NORMA GROUP SE
The Supervisory Board and Management Board thoroughly exam ined which of the German Corporate Governance Code’s recommendations and suggestions NORMA Group SE should follow and explains deviations from the recommendations and the reasons for deviating from the Code. The current declaration dated 20 February 2014 as well as the first declaration dated 4 August 2011 and the other declarations dated 9 March 2012 and March 4 2013 are published on NORMA Group’s website @ www.normagroup.com.
The declaration dated 20 February 2014 is presented below:
With the following exceptions, NORMA Group SE complies with the recommendations of the German Corporate Governance Code in the financial year 2014 as amended on May 13, 2013, published by the Federal Ministry of Justice in the official section of the Federal Gazette (“Bundesanzeiger”) and will continue to comply with the recommendations:
i. With respect to the compensation of the members of the Management Board, the Supervisory Board does not take into account the compensation of the upper management or the workforce as a whole (Section 4.2.2 German Cor-porate Governance Code).
When determining the compensation of the Management Board, the Supervisory Board, advised by an external expert, also took into account the compensation structure of the Com-pany as well as the entire NORMA Group. Due to the NORMA Group’s dynamic development, the Supervisory Board has so far not explicitly defined the upper management or the relevant workforce and, therefore, does not take these groups or their development over time into account.
ii. The remuneration of the Management Board is not capped, either in total or in terms of its variable com-pensation elements (Section 4.2.3 German Corporate Governance Code)
The maximum gross option profit from the matching stock programme for the management board is limited in total to a percentage of the average annual EBITA during the vesting period; therefore a relative maximum limit that is dependent on the Company’s success is applied rather than a maximum monetary amount.
iii. Concrete objectives regarding the composition of the Super visory Board are not set and, therefore, are not published in the corporate governance report. There is no age limit. (Section 5.4.1 German Corporate Gover-nance Code)
All members of the Supervisory Board will continue to comply with all pertinent legislation related to Supervisory Board nomi-nations for new Supervisory Board and take the professional and personal qualifications of candidates into account, regard-less of their gender. Thereby they will take the number of inde-pendent members of the Supervisory Board, potential conflicts of interest, the international business of the Company and the diversity of the Supervisory Board into consideration. Because of this, the Company sees no need to set concrete objectives in this area or to introduce an age limit.
iv. During the transformation of NORMA Group AG into an SE, the members of the Supervisory Board were not chosen in a separate election (Section 5.4.2 German Corporate Governance Code)
All members of the first Supervisory Board of NORMA Group SE were elected as part of the transformation pursuant to Article 40 para. 2 sen 2 SE VO in accordance with the articles

41To Our Shareholders
Corporate Governance Report
of association to ensure that the resolution on the election of the members of the Supervisory Board could not be chal-lenged separately. Otherwise, the risk could not be ruled out that the Company would have no Supervisory Board or that the Board would have an insufficient number of members af-ter the transformation was entered in the commercial register.
The above declaration applies with regard to the recommendation in Section 4.2.5 para. 3 of the German Corporate Governance Code as amended on 13 May 2013 provided that this new re-commen dation will be relevant for the first time for compensation reports of financial years starting after 31 December 2013.
2. RELEVANT INFORMATION ABOUT
CORPORATE GOVERNANCE PRACTICES
Responsibility, honesty and mutual respect among management and our employees define our corporate culture. We expect our managers and employees to not only comply with mandatory laws and regulations, but also ethical rules. Our compliance docu-ments are our most important resources for demonstrating to our employees their ethical and legal obligations. The central compliance documents, the Code of Conduct and the two funda-mental guidelines “Conflicts of Interest” and “Anti-corruption” are binding for all employees of NORMA Group. They are adjusted to reflect changes in legal requirements and current topics as necessary and regularly updated. We train our staff in in-person meetings or online trainings on compliance-related issues. In addition, we analyse our compliance risks as part of internal compliance risk assessments.
The Supervisory Board monitors the Management Board’s ad-herence to compliance rules. The Compliance Officer of NORMA Group SE performs this function for NORMA Group SE’s em-ployees. In the other Group companies, the Chief Compliance Officer of NORMA Group Holding GmbH is responsible for the observance and administration of the above-mentioned Code for all employees of NORMA Group Holding GmbH and its asso-ciated companies. Each Group company with business oper-ations has its own Compliance Officer and the three regional Compliance Officers for the regions EMEA, Americas and Asia- Pacific report to the Chief Compliance Officer. Among other
things, the local Compliance Officers organise on-site compliance training measures for the employees. They are also responsible for ensuring that potential violations of compliance rules are re-ported, investigated, sanctioned, rectified and prevented in the future.
We encourage our employees to report violations of regulations and internal guidelines – skipping the chain of command if neces-sary – and to recommend measures for improvement. Therefore, we have set up a whistleblower hotline through which employees can report compliance violations anonymously, if desired.
3. RESPONSIBILITIES AND COOPERATION OF
MANAGEMENT BOARD AND SUPERVISORY BOARD
NORMA Group SE has a dual management system in which the management, i. e. the Management Board, is monitored by a separate Supervisory Board. The Management Board manages the Company under its own responsibility and determines the strategy, while the Supervisory Board appoints, advises and monitors the Management Board. This model corresponds to the organisation of a traditional German stock corporation. In this regard, no changes were made with the transformation of NORMA Group AG into an SE, which means that responsibilities and func-tioning of the Supervisory Board and Management Board are continued unchanged after the transformation.
The Management Board provides the Supervisory Board with regular updates about business policies and the position of the Company – in particular the development of sales and trans-actions that could have a significant impact on profitability or li-quidity. The Management Board reports on a monthly basis the key figures of the Group and the current course of business to the Supervisory Board, in particular with regard to the published statements on the expected development of the Company.
The Chairman of the Supervisory Board and the Chairman of the Management Board coordinate the collaboration of the two boards. They also stay in regular contact between Supervisory Board meetings and discuss current corporate governance issues. All members of the Management Board participate in Supervisory Board meetings unless they are closed to the Man-

NORMA Group SE Annual Report 201342
agement Board. The members of the Management Board report in these meetings on the current business development and provide an outlook on the expected further development of NORMA Group on the basis of written documents provided in advance to the Supervisory Board members. In addition to monthly and quarterly figures, risk analysis and measures to mini-mise identified risks are discussed at all Supervisory Board meet-ings and each committee chairman reports on the preceding meetings. In addition, the Management Board and Supervisory Board discussed ongoing M&A projects and NORMA Group’s long-term acquisition strategy throughout 2012. The Management Board submits monthly reports to the Supervisory Board on the most important key figures of the Group and its current business development, in particular with respect to the published state-ments on the expected development of the Company.
In accordance with the by-laws of the Management Board and NORMA Group SE’s Articles of Association, the Supervisory Board must approve certain important transactions. This applies not only for measures at NORMA Group SE, but also for mea-sures at its subsidiaries. In order to ensure that the Management Board is promptly informed of corresponding matters involving subsidiaries so that it can request the approval of the Super visory Board, a hierarchical system of approval requirements organised by functional areas, levels of responsibility and countries applies worldwide at NORMA Group.
4. MANAGEMENT BOARD AND REGIONAL MANAGEMENT
The Management Board of NORMA Group AG has four members. When NORMA Group AG was transformed into an SE, all Board members were reappointed and continued their previous func-tions unchanged. Werner Deggim is Chairman of the Manage-ment Board (Chief Executive Officer), Dr. Othmar Belker is Chief Financial Officer, Bernd Kleinhens is Managing Director Business Development and John Stephenson is Chief Operating Officer.
Principles of the Group, p 52.
The allocation of responsibilities and internal order of the Man-agement Board are based on relevant legislation, NORMA Group SE’s Articles of Association and the Management Board by-laws enacted by the Supervisory Board as well as the internal guide-
lines, including compliance documents. As a general rule, Man-agement Board resolutions are passed by simple majority. The Chairman has the deciding vote if the vote is tied. However, the members of the Management Board are obliged to make an effort to reach unanimous decisions. If a member of the Man-agement Board cannot participate in a vote, his vote will be ob-tained at a later date.
The entire Management Board is responsible in matters of par-ticular importance. In accordance with the Management Board by-laws, these include producing the Management Board reports for the purpose of informing the Supervisory Board and the quar-terly and half-yearly reports, fundamental organisational mea-sures, including the acquisition or disposal of significant parts of companies and strategic and business planning issues, measures
ALLOCATION OF RESPONSIBILITIES WITHIN THE MANAGEMENT BOARD
Werner Deggim Chairman Compliance Personnel Legal & M&A Group development Media relations Internal audit Corporate responsibility / sustainability
Dr. Othmar Belker Chief Financial Officer Finance Controlling Investor Relations Treasury IT Risk management Insurances
Bernd Kleinhens Business development Sales Product development Marketing
John Stephenson COO Production Purchasing Supply chain management Global Excellence Programme Quality management

43To Our Shareholders
Corporate Governance Report
related to the implementation and supervision of a monitoring system pursuant to section 91(2) of the German Stock Corpora-tion Act (Aktiengesetz, AktG), issuing the declaration of con-formity pursuant to section 161(1) AktG, preparing the consoli-dated and annual financial statements and similar reports, convening the Annual General Meeting and inquiries and recom-mendations by the Management Board that are to be handled and resolved by the Annual General Meeting. In addition, every Management Board member may request that a specific issue be dealt with by the entire Management Board. Board meetings are held regularly on the first Monday of the month, with addi-tional meetings convened as necessary.
Local presidents in the three regions EMEA, Americas and APAC are responsible for carrying out business on a daily basis. The entire Management Board of NORMA Group SE meets at least once a year with the presidents and their managers at the local headquarters – Singapore for the Asia-Pacific region, Auburn Hills, Michigan, for the Americas, and Maintal for the EMEA re-gion. In addition, individual members of the Management Board meet regularly with the local teams. NORMA Group has a matrix structure in which the leading employees have both a disciplinary as well as a technical supervisor. Thus, for example, the Vice Presidents, who are responsible for sales in the three regions, report to the regional Presidents and the Board Member business development.
5. SUPERVISORY BOARD
The Supervisory Board of NORMA Group SE has six members: Dr. Stefan Wolf (Chairman of the Supervisory Board), Lars M. Berg (Vice Chairman of the Supervisory Board), Dr. Christoph Schug, Günter Hauptmann, Knut J. Michelberger and Erika Schulte. Acting on an application filed by the Management Board in consultation with its Supervisory Board on 18 February 2013, Mrs Schulte was legally appointed as a new member of the Com-pany’s Supervisory Board until the time of the next Shareholders’ Meeting. She succeeds Dr. Ulf von Haacke, who resigned from the Supervisory Board in September 2012 and stepped down from the Board. Her appointment has been confirmed by the 2013 Annual General Meeting. In the course of the transformation of NORMA Group AG in NORMA Group SE, the 2013 Annual
Meeting has appointed all members of the Supervisory Board until the Annual General Meeting which resolves on the formal approval of the actions of the Supervisory Board members for the fourth financial year after the commencement of their term of office (financial year 2013 in which the term of office begins is not counted in this respect), however no longer than six years. This is presumably the Annual General Meeting in 2018.
The Supervisory Board can pass resolutions by simple majority. The Chairman has the deciding vote if a vote is tied. In addition to the Supervisory Board’s four scheduled meetings, one tele-conference took place in financial year 2013.
The Chairman of the Supervisory Board represents the Super-visory Board externally. He organises the work of the Super visory Board and chairs its meetings. The Supervisory Board formed two committees: the Audit Committee and the General and Nomi-nation Committee.
The Audit Committee deals in particular with monitoring the accounting process and the effectiveness of the internal control and risk management systems as well as the audit of the annual financial statements, in particular the independence of the audi-tor, the additional services rendered by the auditor, engaging the auditor, determining areas of audit emphasis and agreeing to the auditor’s fees. The Audit Committee accompanies the collabo-ration between NORMA Group SE and the auditors and ensures that opportunities for improvement identified during the audit are promptly implemented. It is responsible for preparing the account-ing documents and adopting the Supervisory Board’s resolution on the consolidated and separate financial statements. Moreover, it is responsible for compliance and reviews the compliance with statutory provisions and the internal guidelines.
The Chairman of the Audit Committee is Dr. Christoph Schug and the other members are Lars M. Berg and Knut J. Michelberger. The Chairman of the Audit Committee has special knowledge and experience in the application of accounting policies and in-ternal control processes due, in particular, to his many years of work as Chief Financial Officer, managing director and consultant. He is an independent financial expert within the meaning of sec-tion 100(5) AktG.
NORMA Group SE Annual Report 201344
As a rule, the Audit Committee convenes immediately prior to Supervisory Board meetings as well as whenever necessary. It convened seven times in financial year 2013. In addition to the monitoring of risk reporting and internal control systems, the Audit Committee dealt in particular with the examination by the German Financial Reporting Enforcement Panel, current tax proceedings, the efficiency of Supervisory Board reporting, the promissory note and a detailed analysis of planning and budgeting processes.
The responsible employees presented the current status of each item on the agenda and provided an outlook on pending issues.
The General and Nomination Committee prepares personnel- related decisions and monitors the Management Board’s com-pliance with its by-laws. This committee has the following specific responsibilities: preparing Supervisory Board resolutions regard-ing the formation, amendment and termination of employment contracts with members of the Management Board in accor-dance with the remuneration system approved by the Super visory Board, preparing Supervisory Board resolutions regarding legal applications to reduce the remuneration of a Management Board member pursuant to section 87(2) AktG, preparing Supervisory Board resolutions regarding the structure of the remuneration system for the Management Board, acting as representatives of the Company to Management Board members who have left the Company pursuant to section 112 AktG, approving secondary employment and external activities for Management Board mem-bers pursuant to section 88 AktG, granting loans to the persons specified in section 89 AktG (loans to members of the Manage-ment Board) and section 115 AktG (loans to members of the Supervisory Board), approving contracts with members of the Supervisory Board pursuant to section 114 AktG and proposing suitable candidates to the Annual General Meeting when there is a vote on Supervisory Board members. In 2013, the Chairman of the General and Nomination Committee was Chairman of the Supervisory Board Dr. Stefan Wolf and the other members Dr. Christoph Schug and as of 8 February 2013 Lars Berg.
6. ANNUAL GENERAL MEETING
The shareholders of a Societas Europaea decide on the com-pany’s important and fundamental matters. Shareholders are
entitled to vote if they are registered in the shareholders’ register of NORMA Group SE and provide NORMA Group SE or another location specified in the invitation with written notice, in German or English, at least six days before the Annual General Meeting that they will be attending. Each share entitles the bearer to one vote. The shareholders exercise their voting rights at the Annual General Meeting, which takes place at least once every year.
NORMA Group SE publishes the invitation and all documents made available at the Annual General Meeting promptly on its website. Information regarding the number of attendees and the voting re-sults are published there following the Annual General Meeting.
7. SHAREHOLDINGS OF THE MANAGEMENT BOARD
AND SUPERVISORY BOARD
On 31 December 2013, the Management Board and the Super-visory Board jointly held 796,431 (2.5 %) of the total 31,862,400 shares of NORMA Group SE. Members of the Supervisory Board held 87,083 (0.3 %) and members of the Management Board 709,348 (2.2 %). No member of the Management Board held more than 1 % of the shares in NORMA Group SE.
The members of the Supervisory Board and Management Board acquired most of these shares prior to the initial public offering, because they held interest in the former NORMA Group GmbH, which was transformed into NORMA Group AG prior to the initial public offering in 2011. Therefore, these acquisitions were never published as directors’ dealings.
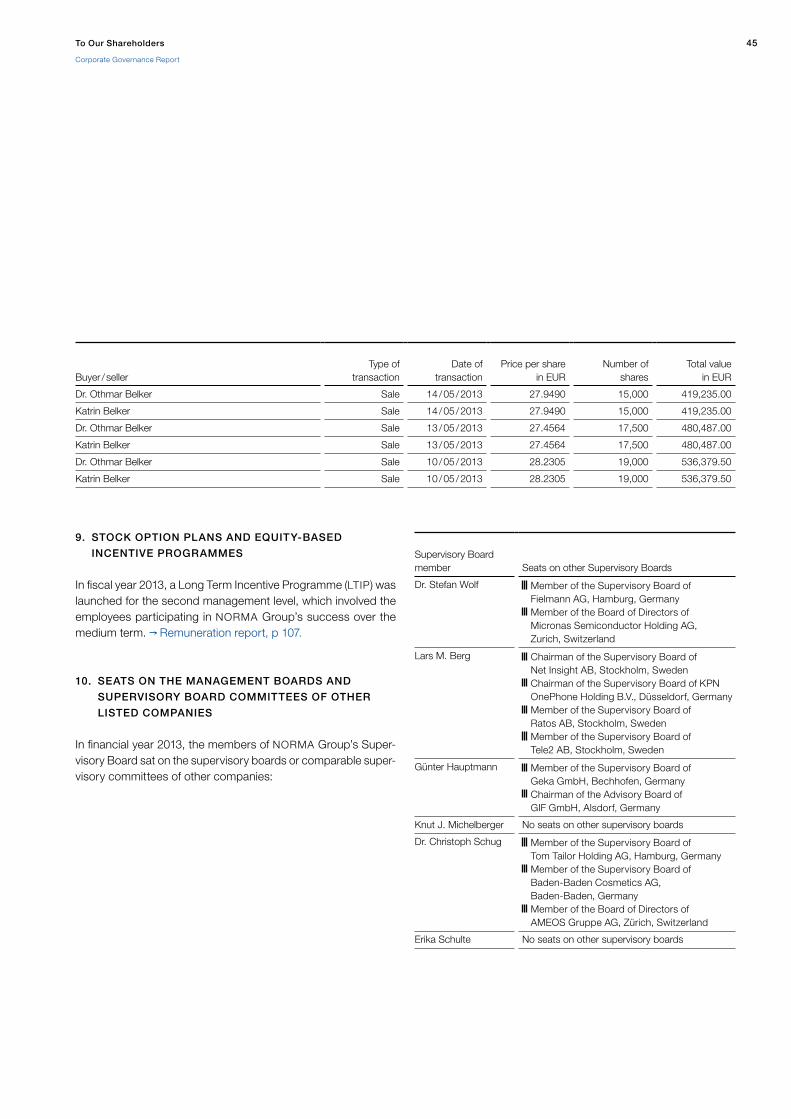
8. DIRECTORS’ DEALINGS
According to section 15a of the German Securities Trading Act (Wertpapierhandelsgesetz, WpHG), members of the Manage-ment Board and the Supervisory Board and related parties are obliged to disclose directors’ dealings in NORMA Group SE shares if the value of these transactions reaches EUR 5,000 with-in a calendar year.
The following transaction was reported in connection with Direc-tors’ Dealings in 2013:
45To Our Shareholders
Corporate Governance Report
9. STOCK OPTION PLANS AND EQUITY-BASED
INCENTIVE PROGRAMMES
In fiscal year 2013, a Long Term Incentive Programme (LTIP) was launched for the second management level, which involved the employees participating in NORMA Group’s success over the medium term. Remuneration report, p 107.
10. SEATS ON THE MANAGEMENT BOARDS AND
SUPERVISORY BOARD COMMITTEES OF OTHER
LISTED COMPANIES
In financial year 2013, the members of NORMA Group’s Super-visory Board sat on the supervisory boards or comparable super-visory committees of other companies:
Buyer / seller
Type of
transaction
Date of
transaction
Price per share
in EUR
Number of
shares
Total value
in EUR
Dr. Othmar Belker Sale 14 / 05 / 2013 27.9490 15,000 419,235.00
Katrin Belker Sale 14 / 05 / 2013 27.9490 15,000 419,235.00
Dr. Othmar Belker Sale 13 / 05 / 2013 27.4564 17,500 480,487.00
Katrin Belker Sale 13 / 05 / 2013 27.4564 17,500 480,487.00
Dr. Othmar Belker Sale 10 / 05 / 2013 28.2305 19,000 536,379.50
Katrin Belker Sale 10 / 05 / 2013 28.2305 19,000 536,379.50
Supervisory Board member
Seats on other Supervisory Boards
Dr. Stefan Wolf Member of the Supervisory Board of Fielmann AG, Hamburg, Germany
Member of the Board of Directors of Micronas Semiconductor Holding AG, Zurich, Switzerland
Lars M. Berg Chairman of the Supervisory Board of Net Insight AB, Stockholm, Sweden
Chairman of the Supervisory Board of KPN OnePhone Holding B.V., Düsseldorf, Germany
Member of the Supervisory Board of Ratos AB, Stockholm, Sweden
Member of the Supervisory Board of Tele2 AB, Stockholm, Sweden
Günter Hauptmann Member of the Supervisory Board of Geka GmbH, Bechhofen, Germany
Chairman of the Advisory Board of GIF GmbH, Alsdorf, Germany
Knut J. Michelberger No seats on other supervisory boards
Dr. Christoph Schug Member of the Supervisory Board of Tom Tailor Holding AG, Hamburg, Germany
Member of the Supervisory Board of Baden-Baden Cosmetics AG, Baden-Baden, Germany
Member of the Board of Directors of AMEOS Gruppe AG, Zürich, Switzerland
Erika Schulte No seats on other supervisory boards

The key to success – We address attractive, highgrowth regions all over the world and plan to continue erasing the last white spots on the map in the future. Our expertise in the area of joining technology and innovative solutions are in great demand in many other regions. By expanding into new end markets we secure ourselves stable, longterm growth.
PRESENCE

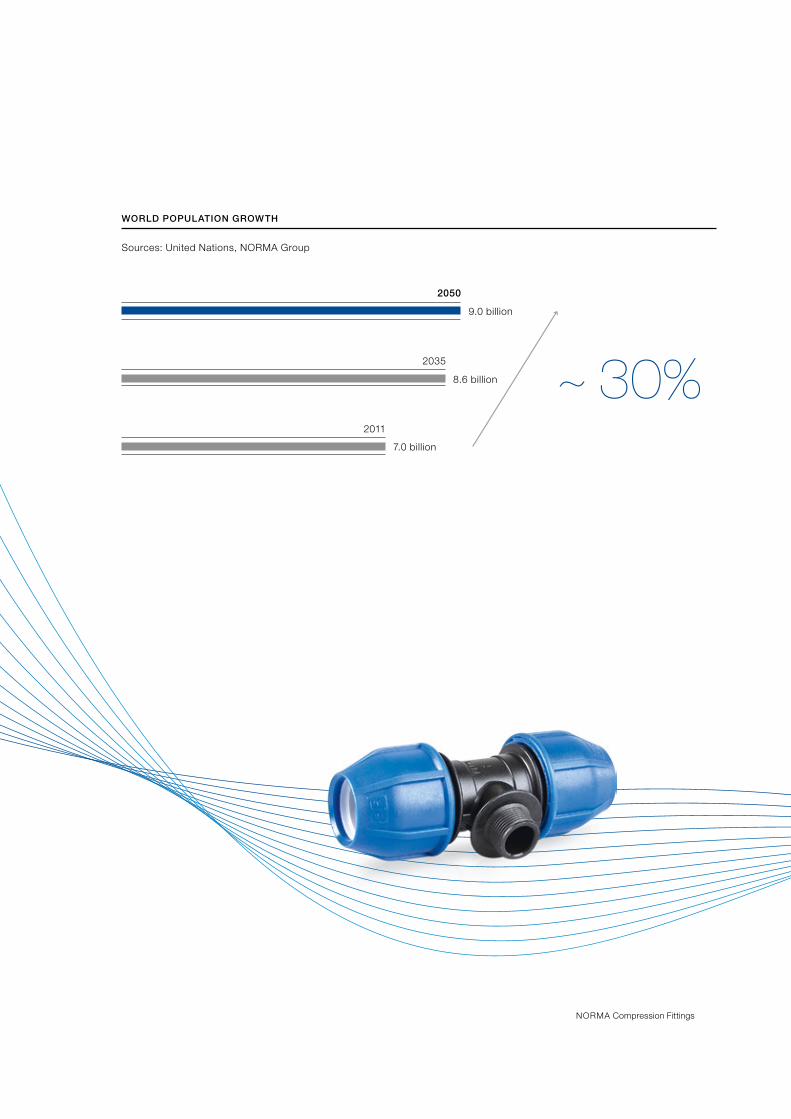
Sources: United Nations, NORMA Group
WORLD POPULATION GROWTH
7.0 billion
8.6 billion
9.0 billion
2011
2035
2050
~ 30%
NORMA Compression Fittings

“ We are already present with our broad product portfolio and global sales network in more than 100 countries. Through the acquisitions we made in 2013, we are able to approach new regional markets, expand our product offerings and strengthen our market position, particularly in the AsiaPacific region.”Malliga Muniandy Export Manager Chien Jin Plastic, Malaysia

NORMA Group SE Annual Report 201350
Consolidated Management Report
52 Principles of the Group52 Business Model58 Corporate Goals and Strategies59 Control System and Control Parameters61 Research and Development
64 Economic Report64 General Economic and Industry-Specific Conditions66 Significant Events for Business Development66 Actual Business Development compared to forecast 68 General Statement by the Management Board on the
Course of Business and Economic Situation69 Earnings, Assets and Financial Position76 Segment Reporting78 Organisational and Process Advantages80 Purchasing and Supplier Management82 Marketing84 Employees88 Corporate Responsibility (CR)89 Occupational Health and Safety90 Environmental Protection and Ecological Management

51Consolidated Management Report
CO
NS
OL
IDA
TE
D M
AN
AG
EM
EN
T R
EP
OR
T
91 Supplementary Report
92 Forecast Report92 General Economic Conditions93 The Future Development of NORMA Group97 General Statement by the Management Board
on Anticipated Development
97 Risk and Opportunity Report97 Opportunity and Risk Management System98 Internal Control and Risk Management System
and their Relation to the Group Accounting Process100 Opportunity and Risk Portfolio of NORMA Group105 Assessment of the Overall Profile of Opportunities and
Risks by the Management Board
107 Remuneration Report for the Management and Supervisory Boards
109 Other Legally Required Disclosures109 Additional Information Required under the German
Takeover Directive Implementation Act 111 Report on Transactions with Related Parties

NORMA Group SE Annual Report 201352
Consolidated Management Report
Growth of 5.1% leads to record sales of EUR 635.5 million
Once again high and sustainable margin of 17.7 %
High operating net cash flow of EUR 104 million and decreasing net debt
Further expansion through acquisitions
Principles of the Group
BUSINESS MODEL
NORMA Group is an international market and technology leader in attractive niche markets for advanced engineered joining tech-nology. We manufacture and market more than 30,000 high-qual-ity and often mission-critical joining products and solutions to over 10,000 customers all over the world in the three product categories clamps (CLAMP), joining elements (CONNECT) andconnections/fluid systems (FLUID).
High customer satisfaction forms the foundation of our continued business success. We offer our customers many years of exper-tise, customer-specific system solutions and global availability of products with reliable quality and delivery. Global megatrends such as the reduction of emissions, leakages, weight and size, but also increased modularisation of manufacturing processes, continue to present challenges to OEM companies when it comes to developing new products. Here, we proactively support our customers by offering innovative customised joining products and solutions as well as our own broad range of established brand products. Our products account for only a small share of the costs and prices of the end product, yet are often mission critical to how they function with respect to quality, performance and operational reliability.
Compared with financial year 2012, there have been no significant changes in NORMA Group’s business activities and Group struc-ture in 2013.
Important products, services, sales markets and business processesOur clamp products and solutions are manufactured from un-alloyed steels or stainless steel and are generally used to join or seal elastomer hoses.
The connection products include connectors made of unalloyed steels or stainless steel that are partly equipped with elastomer or metal seals and are used as the joining and sealing elements of metal and thermoplastic pipes.
Our fluid products are either single or multiple layer thermo plastic plug-in connectors for liquid systems that reduce installation times, ensure reliable flow of liquids or gases and occasionally replace conventional products like elastomer hoses.
Our intellectual property portfolio of 867 patents and utility models in 161 patent families underscores our high power of innovation and secures us a leading technological position in the global marketplace.
We offer joining products and product solutions for many different areas of application. These include equipment and com ponents for farming, motors, commercial vehicles, and passenger cars for the aviation industry, construction machines, and household appliances. Our products can also be found in irrigation systems, drinking water supply systems and industrial water disposal systems, but also in the pharmaceutical and bio tech nology indus tries.

53Consolidated Management Report
Principles of the Group
With our 21 production sites and additional sales and distribution centres in Europe, North, Central and South America and the Asia-Pacific region, we maintain a global presence in 100 coun-tries. Worldmap. By consistently expanding our local engineer-ing and production sites, among other places in Russia, Serbia, Mexico, Brazil, China, India, and Thailand, we improve our cost position and strengthen our working relationships with local cus-tomers.
We supply our customers successfully via two different sales channels:
Engineered Joining Technology (EJT) and Distribution Services (DS).
This approach that gives us a much better understanding of the various needs of the market enables us to stand out from our manufacturing competitors.
In the area of EJT, we provide industrial OEM customers with indi vidually developed, customised products and solutions. Once our engineered joining solutions have been installed in a cus-tomer’s product, they normally remain part of the final design of that product. Areas of application include emission controls, cooling systems, air intake and induction, assistive systems and infrastructure. The distribution channel EJT is characterised by development partnerships with our customers that take several years before manufacturing of the end product even begins. Our customers are taken care of by both the Group’s development departments and local developers (resident engineers). Many new developments are validated on NORMA Group’s test stands. The area of EJT accounts for approximately 70 percent of NORMA Group’s sales.
In the area of DS, we market a broad range of high-quality, more standardised brand products for a broad spectrum of applica-tions via our own sales network as well as sales representatives, retailers and importers. Our customers are distributors, special-ised wholesalers, OEM customers in the aftermarket segment and do-it-yourself stores and small application industries. Our well-known brands ABA®, BREEZE®, Connectors®, FISH®, GEMI®, NORMA®, R.G.RAY®, Serflex®, Serratub®, TERRY® and Torca® exemplify technological know-how, high-quality and reli-ability. Distinctions are made between many of these products in trade on the basis of national technical standards. We manage around 10,000 distributors in more than 100 countries and guar-antee high-quality service. We generate roughly one-third of our sales revenue in the area of DS.
Both distribution channels have intersections in the area of pro-duction and development that enable cost advantages and quali-ty assurance.
Competitive situationDue to our heterogeneous structure in the area of Engineered Joining Technology, none of our competitors are in a comparable position. We combine know-how from the area of metals with our product categories clips/clamps (CLAMP) and joining ele-ments (CONNECT) with our know-how in the area of thermo-plastic materials through our product category connections/fluid systems (FLUID). The areas CLAMP and CONNECT include mainly small to medium-sized manufacturers who only manufac-ture certain types of products and applications or oper ate main-ly on a regional basis. The area of FLUID, on the other hand, includes mainly globally active groups that focus on rubber and elastomer products, which we do not offer. Research and De-velopment, p. 61.
SALES BY END MARKETS IN 2013
in % 2012 in brackets
30 (29) Distributors
10 (10) Commercial vehicle OEMs
30 (32) Industrial suppliers
30 (29) Passenger vehicle OEMs

NORMA Group SE Annual Report 201354
PRODUCT CATEGORY AND END MARKETS
Segment Main product categories Distribution channels used End markets Brands
EMEA CLAMP, CONNECT, FLUID
EJT, DS
Industrial suppliers, passenger vehicle OEMs, distributors, commercial vehicle OEMs
ABA®, Connectors®, NORMA®, Serflex®, Serratub®, TERRY®
The Americas CLAMP, CONNECT, FLUID
EJT, DS
Industrial suppliers, passenger vehicle OEMs, distributors, commercial vehicle OEMs
BREEZE®, R.G. RAY®,TORCA®
Asia-Pacific CLAMP, CONNECT, FLUID
EJT, DS
Industrial suppliers, passenger vehicle OEMs, distributors, commercial vehicle OEMs
FISH®, GEMI®, NORMA®
20192000 2002 2004 2006 2008 2010 2012 2014 2016 2018
INTRODUCTION OF EMISSION STANDARDS
Sources: Integer Research, DieselNet, ACEA, NORMA Group
EURO 3 EURO 4 EURO 5 EURO 6
EPA ’00 EPA ’04 EPA ’07 EPA ’10 EPA ’15
JPN ’98 JPN ’02 JPN ’05 JPN ’09 JPN ’14 JPN ’19
EURO 1 EURO 2 EURO 3 EURO 4 EURO 5
EURO 1 EURO 2 EURO 3 EURO 4 EURO 4+
EURO 3 EURO 4 EURO 5 (big cities) EURO 6 (big cities)EURO 1 EURO 2
EURO 1 EURO 2 EURO 3 EURO 6EURO 4 EURO 5
Europe
NAFTA
Japan
Brazil
Russia
India
China

55Consolidated Management Report
Principles of the Group
We consider ourselves to be a supplier of solutions to problems that provide benefits to customers and therefore stand out from many of our smaller competitors who focus on selling specific types of products. We offer product solutions for a wide variety of technical niches. We also strive to achieve high market pene-tration within technical applications. We stand out in mass markets thanks to our branding and high-quality service. For this reason, we do not set market share goals, but rather seek to occupy niches in which we are able to create benefits for our customers.
Economic and legal factors of influenceEconomic factorsOur products and product solutions are used in different industries and regions. These are subject to different economic fluctuations that differ in terms of degree and time of occurrence, but also have different effects on the demand for our solutions and our order situation. Due to our comprehensive product portfolio and our broad customer base, we are well prepared to compensate for temporary declines in demand.
We track specific early indicators in order to be able to take probable developments into consideration in our business plan-ning early on. These include, among others, commodity price development, our customers’ order behaviour in the area of Dis-tribution Services, the order book, and the expected develop ment of production and sales figures for our customer industries.
Due to the high share of long-term development partnerships, we rely mainly on cost and process optimisation to react to short-term fluctuations in demand. Global Excellence Programme, p. 55.
Exchange rate fluctuationsThe effects that exchange rate fluctuations have on our business must be looked at differently: due to the fact that we mainly develop, purchase, manufacture and sell regionally to regional markets, deviations between two non-euro currency regions have only insignificant effects on our operating results.
Exchange rate fluctuations against the euro as NORMA Group’s reporting currency influence the valuation of our business in eu-ros. Due to the fact that we generate roughly a third of our sales in US dollars, the weakening of the US dollar against the euro in particular has a negative effect on our results. Another 30 percent of our business is denominated in other currencies. Risk and Opportunity Report, p. 101, notes, p. 138.
Changes in personnel and material costsWith respect to costs, particularly the development of wages and salaries has an effect on NORMA Group, as do changes in material costs.
Due to the fact that we are operationally active in 16 countries, changes in personnel costs have different effects in the respec-tive regions. We employ around 20 percent of all our employees in Germany. Agreed salary adjustments in Germany therefore only have an effect on part of our Group results. We achieve in-creases in productivity, among other things, through our ongoing cost reduction programme.
Short-term fluctuations in material prices generally have less ef-fect on our earnings because we set the prices for important materials in long-term contracts – generally one year – when we place an order. This pertains to both procurement as well as sales to consumers. Purchasing and Supplier Management, p. 81.
We absorb negative developments on the cost side on the one hand with the help of our Global Excellence Programme which we launched back in 2009. As part of this program, we optimise our internal processes in all functional areas, among other things, and thus increase our profitability. Here, we systematically track projects on increasing efficiency that are monitored using a web-based programme. This enables us to quantify the monetary savings that result from a specific measure fairly accurately at the end of the 12-month project cycles. Senior management reviews the current status of all projects once a month and a steering committee does so once a quarter. Our goal is to ensure that we offset or even lower any inflationary increases in costs with the help of this programme.
Legal and tax-related aspectsDue to the international focus of our business and against the background of our acquisition strategy, various legal and tax-re-lated regulations are of relevance to us. Among others, these include product safety and product liability laws, construction, environmental and employment-related regulations as well as foreign trade and patent laws. Risk and Opportunity Report, p. 105.
The growing degrees of regulation in the area of environmental law affect our product strategy quite significantly. For example, we introduced more stringent emission regulations, such as the EURO-6 Standard, which will be mandatory for all newly regis-tered heavy goods vehicles starting in January 2014 and all newly registered diesel and petrol passenger vehicles starting in September 2014, and this will result in a higher demand for the joining elements that we manufacture and increase the value of these elements.
Legal structure of the GroupNORMA Group was formed in 2006 as a result of the merger of the German Rasmussen Group and the Swedish ABA Group. From 2011 up until July 2013, NORMA Group took on the legal
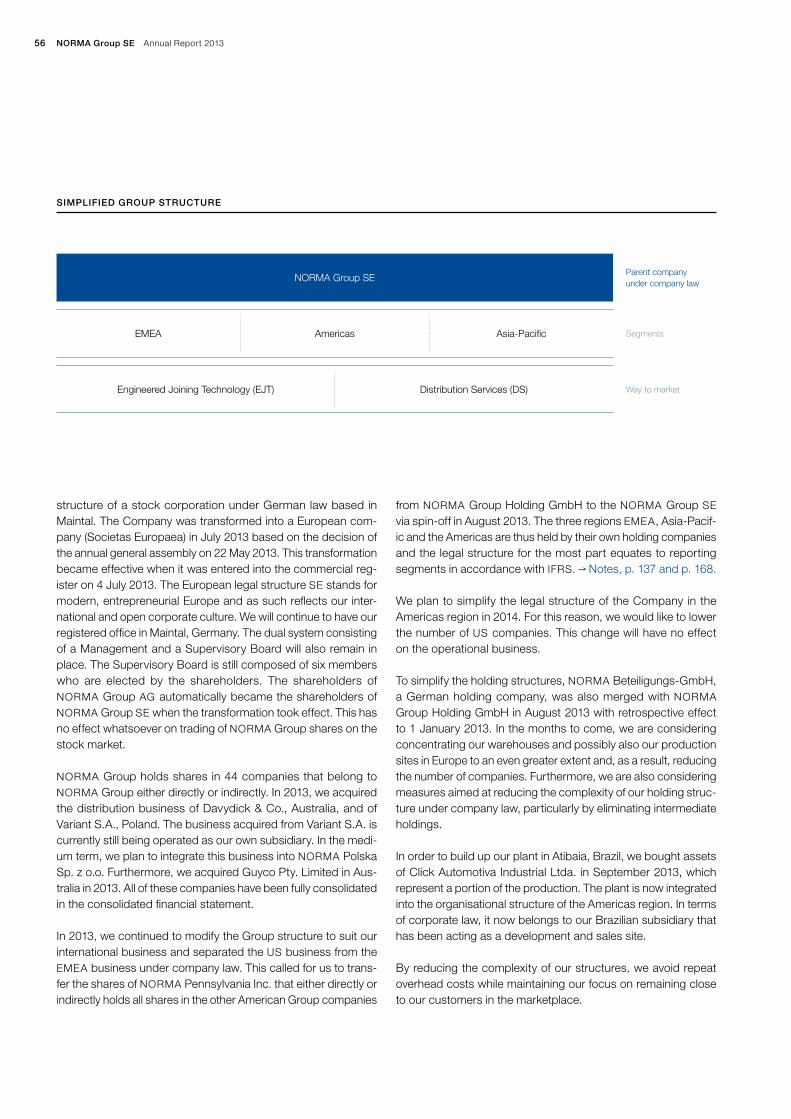
NORMA Group SE Annual Report 201356
structure of a stock corporation under German law based in Maintal. The Company was transformed into a European com-pany (Societas Europaea) in July 2013 based on the decision of the annual general assembly on 22 May 2013. This transformation became effective when it was entered into the commercial reg-ister on 4 July 2013. The European legal structure SE stands for modern, entrepreneurial Europe and as such reflects our inter-national and open corporate culture. We will continue to have our registered office in Maintal, Germany. The dual system consisting of a Management and a Supervisory Board will also remain in place. The Supervisory Board is still composed of six members who are elected by the shareholders. The shareholders of NORMA Group AG automatically became the shareholders of NORMA Group SE when the transformation took effect. This has no effect whatsoever on trading of NORMA Group shares on the stock market.
NORMA Group holds shares in 44 companies that belong to NORMA Group either directly or indirectly. In 2013, we acquired the distribution business of Davydick & Co., Australia, and of Variant S.A., Poland. The business acquired from Variant S.A. is currently still being operated as our own subsidiary. In the medi-um term, we plan to integrate this business into NORMA Polska Sp. z o.o. Furthermore, we acquired Guyco Pty. Limited in Aus-tralia in 2013. All of these companies have been fully consoli dated in the consolidated financial statement.
In 2013, we continued to modify the Group structure to suit our international business and separated the US business from the EMEA business under company law. This called for us to trans-fer the shares of NORMA Pennsylvania Inc. that either directly or indirectly holds all shares in the other American Group companies
from NORMA Group Holding GmbH to the NORMA Group SE via spin-off in August 2013. The three regions EMEA, Asia-Pacif-ic and the Americas are thus held by their own holding companies and the legal structure for the most part equates to reporting segments in accordance with IFRS. Notes, p. 137 and p. 168.
We plan to simplify the legal structure of the Company in the Americas region in 2014. For this reason, we would like to lower the number of US companies. This change will have no effect on the operational business.
To simplify the holding structures, NORMA Beteiligungs-GmbH, a German holding company, was also merged with NORMA Group Holding GmbH in August 2013 with retrospective effect to 1 January 2013. In the months to come, we are considering concentrating our warehouses and possibly also our production sites in Europe to an even greater extent and, as a result, re ducing the number of companies. Furthermore, we are also considering measures aimed at reducing the complexity of our holding struc-ture under company law, particularly by eliminating intermediate holdings.
In order to build up our plant in Atibaia, Brazil, we bought assets of Click Automotiva Industrial Ltda. in September 2013, which represent a portion of the production. The plant is now inte grated into the organisational structure of the Americas region. In terms of corporate law, it now belongs to our Brazilian subsidiary that has been acting as a development and sales site.
By reducing the complexity of our structures, we avoid repeat overhead costs while maintaining our focus on remaining close to our customers in the marketplace.
Parent companyunder company law
Segments
Way to market
NORMA Group SE
EMEA
Engineered Joining Technology (EJT) Distribution Services (DS)
Americas Asia-Pacific
SIMPLIFIED GROUP STRUCTURE

57Consolidated Management Report
Principles of the Group
NORMA GROUP
A list of all Group companies and NORMA Group’s shareholdings as at 31 December 2013 can be found on page 137.
1) NORMA China is categorised in the APAC segment. In terms of company law, it belongs to NORMA Group Holding.
NORMA Group SE
NORMA Pennsylvania (USA)
NORMA Michigan (USA)
Craig Ass. (USA)
R.G.Ray (USA)
NORMA Group Mexico
NORMA Brazil
NORMA Group Holding
NORMA Germany
Groen BV (Netherlands)
NORMA Netherlands
NORMA Italy
Nordic Metalblok (Italy)
NORMA France
NORMA Sweden
NORMA Serbia
NORMA Poland
NORMA Czech
NORMA Turkey
NORMA Spain
NORMA UK
Connectors Verbindungs-
technik AG (CH)
NORMA Russia
NORMA China 1)
NORMA Group APAC Holding
NORMA Malaysia
NORMA Thailand
NORMA EJT (Changzhou)
NORMA Singapore
NORMA Australia
Guyco (Australia)
Chien Jin Plastic (Malaysia)
NORMA Korea
NORMA Japan
NORMA India

NORMA Group SE Annual Report 201358
NORMA Group SE, the parent company of NORMA Group, serves as the formal legal holding of the Group. NORMA Group SE is responsible for the strategic management of business activi-ties. As the lead company in the Group, it is also responsible for communication with the Company’s important target audiences, particularly the capital market and shareholders. The operating companies are managed by their own management that is mea-sured based on agreed target requirements. The operational coordination of duties is taken care of by regional management that also ensures that we remain close to our regional customer markets. Specific objectives are defined at the Group-wide, re-gional and operational level and reviewed constantly. Group-wide functional management responsibilities such as Group Account-ing, IT, Internal Audit, and Treasury, are all based at the subsidi-ary NORMA Group Holding GmbH. This is how we ensure that subsidiaries are able to concentrate solely on everyday business.
Operative segmentation by regionsOur planning is based, among other things, on regional growth targets. The Group business is managed by the three regional segments EMEA (Europe, Middle East, Africa), the Americas and Asia-Pacific (APAC) in order to be able to execute our successful growth strategy. All three regions have networked regional and cross-company organisations with different functions. The inter-nal Group reporting and control system that our Management uses is also therefore quite regional in nature.
Corporate Governance StatementThe statement of corporate governance pursuant to section 289a HGB is included in the Corporate Governance Report and is also part of the Management Report. This also includes a description of the procedures of the Management Board and the Super visory Board, the Declaration of Conformity pursuant to Section 161 AktG, and relevant information on corporate governance prac-tices. Corporate Governance Report, p. 40.
CORPORATE GOALS AND STRATEGIES
Our strategic goal in both sales areas and all regions is to extend our business activities in the long term. By offering innovative products and high-quality service to the trade, we hope to achieve growth in sales that exceeds the market average. Furthermore, we also focus closely on high profitability and stable cash flows. Compared to the previous year, there were no significant changes in our objectives and strategies. Forecast Report, p. 92.
The core of our Group strategy is broad diversification with re-spect to products, regions and end markets. On the one hand, this strengthens the stability of our business operations and, on the other, puts us in a position to be able to capitalise on attrac-tive growth potentials out of the many relevant growth trends with our customers and their end products.
Megatrends permanently support greater use of our high-quality joining products and system solutionsCustomer demands in the respective markets for engineered joining technology constantly change. This is driven by techno-logical megatrends on the one hand, for instance higher engine efficiency as a reaction to more stringent emission regulations, weight reduction and modularisation of production processes. On the other hand, global megatrends such as increased en-vironmental consciousness, rising fuel costs and growing cost pressure for manufacturers also play a key role. For this reason, we expect to see demand for engineered joining technologies in the end products of our customers increase more quickly than our customers’ end markets themselves. After all, both the num-ber and the value of engineered joining elements in an end pro-duct continue to increase. Supported by external market studies, we expect the use of engineered joining technology in vehicles, construction machines and engines, for instance, to increase by up to 15 per cent annually from 2010 through 2015 depending on the core industry and technical application. We intend to capi-talise on these growth opportunities by focussing on innovative solutions for mission-critical connections that add value and thus assist our customers in reducing emissions, leakages, weight, space and installation time. Research and Development, p. 61.
Unique position and synergies thanks to an unrivalled, customer-oriented sales strategyOur two separate ways to the market are designed to meet the unique needs of the respective customers. We benefit from vari ous synergies thanks to this special combination of comprehensive expertise and skills in developing customised solution approach-es for industrial customers (EJT) and offering high-quality standard brand products and solutions via global distributors (DS). These include significant economies of scale in manufacturing, unique close proximity to international EJT customers and the transfer of know-how from the area of EJT to high-quality, standardised prod-ucts in the DS area. This approach allows us to consistently strengthen the diversification and stability of our business.
Our parameters for success are global presence, size, power of innovation and strong brands Our goal is to extend our presence in existing markets and de-velop new emerging markets that offer attractive growth potential. We intend to offer our existing customers solutions for these types of applications that do not yet include our joining solutions. We rely here on product innovations that result in higher product performances and quality. By doing so, we will increase the num-ber of products used per customer end product and encourage the implementation of our existing products. We see growth oppor tunities in emerging countries that result from the increase in industrial manufacturing and the rising demand for mature joining technology. In the process, we leverage the manu facturing
59Consolidated Management Report
Principles of the Group
and sales presence that we have established in these markets in recent years. The main focus in the emerging countries is on the BRIC nations (Brazil, Russia, India, and China). Based on our past activities in India and China in recent years, among other things establishing additional production capacities, we will con-tinue to strengthen our sites in Asia and South America even further.
We address attractive markets with respect to margins, sophis-ticated markets with respect to products and fragmented niche markets with fast-growing sales with respect to competition. By engaging in strategic knowledge transfer to new fast-growing industries, we open up new end markets for ourselves and make effective use of growth potentials. These include, among other areas, the construction industry, the flue gas system aftermarket segment, and the area of infrastructure. We also succeeded in entering the drainage end market. Our products are also used here, in drainage systems at the Munich Airport since last year, for example. The successful acquisition of Connectors Ver-bindungs technik AG in 2012 and the related entry into the pharma-ceuticals market is yet another example of our efforts to enter into new markets.
By expanding in new markets, we achieve greater diversification and thus strengthen our defensive earnings profile with respect to end market presence. Furthermore, we continuously strength-en our power of innovation, whereby Research and Development (R&D) plays an important role here. Due to the fact that setting up local engineering capacities will help to lower our personnel costs for development work in the medium-term, we invest around 4 per cent of EJT sales in R&D activities each year. Re-search and Development, p. 61. We focus here on strengthening and extending the respective success parameters of our well-known brands. By systematically expanding our sales network, we strive to establish a global presence, increase the earnings share with our existing customers and gain new customers.
Successful organic growth and selective acquisitions that create added valueWe pursue a strategy of organic growth and strategic acquisi-tions. To strengthen our organic growth, we rely on constantly expanding application solutions with existing EJT customers, identifying and signing up new EJT customers, extending and deepening our customer base in the area of Distribution Service and entering into new end markets for engineered joining tech-nology that create added value.
Selected acquisitions that complement our internal growth are also a permanent component of our long-term growth strategy. We observe the market for advanced joining technology very closely. We set strict criteria in identifying and evaluating acqui-sition possibilities.
We have a solid track record with respect to the acquisition and integration of companies that create added value. In 2012 and 2013, we acquired seven companies and successfully integrated them into NORMA Group. Economic Report, p. 64. Future acquisitions will continue to strengthen the regional presence of the Group, complement its product portfolio, improve access to customers and allow for synergies to be realised. We are well-po-sitioned to benefit from the fragmentation of the market and be a leader in its consolidation.
We constantly improve our production processes and cost structuresWe support and control our strategic goals of achieving high profitability and strengthening our cash flow through various mea-sures. These include cost discipline, continuous improvement of processes in all functions and regions and successful supply chain management.
After we significantly optimised our manufacturing structure in Europe back in 2010, we finished expanding production capac-ities for special clamps in England and China in 2013. Further-more, we have continually been able to generate significant cost savings with our “Global Excellence Programme” that we intro-duced in 2009. The improvement initiatives we identified and introduced as part of this programme will enable us to realise even greater cost advantages by maximising flexibility in the future.
CONTROL SYSTEM AND CONTROL PARAMETERS
Group management relies on both financial and non-financial control parameters to manage NORMA Group.
Important financial control parametersThe most important financial performance indicators include sales, profitability (EBITA margin) and net operating cash flow.
In addition, we concentrate on committing our investment rate , the development of the working capital (inventories and trade receivables less trade liabilities) as well as the liquidity and the capital structure ( Financial Management, p. 60) taking into ac-count risks from interest, foreign currencies and the costs of materials. Risk and Opportunity Report, p. 97.
We strive to achieve short and medium term growth in sales that exceeds the market average. Due to the heterogeneous industries that use joining technologies, we define the expected market development based on quantitative and external market analyses.

NORMA Group SE Annual Report 201360
High profitability is one of the main target and measurement para meters for our Group management. We calculate a target EBITDA margin and a target EBITA margin based on the histor-ic performance and planning of our business divisions. We de-termine the target margin for the Group as the weighted average of the divisions and adjust the amortisation effects from the purchase price allocation of acquired companies.
Operating net cash flow is yet another target figure. By focusing on this financial figure, we also ensure that the financial solidity of the Group is maintained in the future. We calculate our oper-ating net cash flow based on the EBITDA plus changes in work-ing capital, minus investments from the operational business.
Economic Report, p. 64.
All financial control parameters are planned and continuously mon-itored at the Group, regional and Group company levels. We mea-sure deviations between forecasted targets and what we actually achieve on a monthly basis inside all local companies. Key figures are analysed on a monthly and quarterly basis. At the same time, we evaluate our detailed business plans and make projections on specific business developments that perhaps include various scenarios on the basis of existing monthly and quarterly results.
Important non-financial control parametersAmong others, non-financial control parameters include market penetration, power of innovation, problem-solving behaviour and the sustainable overall development of NORMA Group.
We quantitatively measure market penetration and innovative capability by producing both application-oriented and seg-ment-specific multiple year planning for the medium term that is reviewed in great detail every six months. This planning mainly
serves to manage our development strategy. The extent of our market penetration is reflected in our organic growth in the me-dium term. Our goal is to register new products and innovations for patents each year.
Problem solving behaviour has an impact on the number of cus-tomer complaints, which we measure with the help of key per-formance indicators. These so-called KPIs include, among other things, defective products measured in ‘parts per million’ (PPM), or the number of customer inquiries for each product unit. We track this information on a monthly basis. Organisational and Process Advantages, p. 78.
We consider it to be our main responsibility to bring the effects of our business activity into balance with the expectations and needs of society. For this reason, we base our operational deci-sions on the principles of responsible company management and sustainable actions. Our long-term development is influenced by our Corporate Responsibility (CR) policies. Corporate Respon-sibility, p. 88.
More information on non-financial performance indicators can be found from page 78 onwards.
Financial managementOur basic goals with respect to the central financial and liquidity management system are the same as last year:
I. Ensuring solvency at all timesOur main financial objectives are maintaining the necessary liquidity for the Group’s operating business at all times, main-taining sufficient strategic liquidity reserves and thus ensuring NORMA Group’s long-term solvency.
NET OPERATING CASH FLOW
In EUR millions
2013
2012
2011
2010
EBITDA1) 129.3 120.8 117.0 99.2
Change in working capital 5.1 – 9.8 – 19.5 – 26.4
Investments from the operational business – 30.5 – 30.0 – 30.7 – 21.1
Net operating cash flow 103.9 81.0 66.8 51.7
1) 2010 and 2011 adjusted mainly to account for the costs of the IPO

61Consolidated Management Report
Principles of the Group
II. Limiting financial risksThe Treasury division identifies interest rate and currency risks as well as risks related to changes in the price of raw materials and also selects suitable hedging instruments to reduce these risks.
III. Optimising the Group’s internal liquidityNORMA Group Holding GmbH is responsible for investing surplus liquidity as well as for intra-Group financing.
Last year, we also extended the possibilities of internal financing by engaging in various projects in the Treasury area. Here, we pursue the objective of placing Group-wide financing on a broad and well-balanced foundation and thus further optimising the Group’s cash flow which is already quite strong.
The main components of our policy on limiting financial risks in-clude a clear definition of process responsibility, multilevel approv-al processes, and risk assessments, which we have adopted in a Treasury policy. The new EMIR (European Market Infrastructure Regulation) requirements have already been addressed as well.
Liquidity managementOur goal is to bundle surplus liquidity of Group companies and allocate this money optimally in the Group or invest it optimally outside the Group. This is done using a professional treasury management system which provides us with an overview of the cash holdings of our most important subsidiaries at all times. Due to the heterogeneous global corporate structure, automated global cash pooling makes little sense for technical reasons; as a result, the Treasury division concentrates cash in periodic inter-vals. Manually pooling funds allows us to invest these funds with external institutions at better terms, whereby in particular the local terms for international payments must be taken into account.
RESEARCH AND DEVELOPMENT
Innovation as a growth driver Our customers must continually cope with new challenges with respect to their product development. On the one hand, new legis-lation constantly leads to ever stricter regulations, especially in the field of pollutant emissions, and on the other, mounting safety requirements are always increasing due to increasingly smaller installation spaces. Intensive research activities and the develop-ment of new products and solutions are thus indispensable. For this reason, we have built up a comprehensive fundamental Re-search and Development department in recent years. Our prod-uct development focusses on innovation opportunities that arise from global megatrends and are of great benefit to our end cus-tomers.By offering our customers technical solutions that help them to cope with the specific challenges of reducing emissions, leakage, weight, space requirements and assembly time, we are increas-ing our own profitability as well as our technological and eco-nomic success. In return, we enable our customers to achieve process-optimised and more efficient production.
There have been no major changes to our overall R&D strategy or how the R&D department is organised compared to previous financial years.
As at 31 December 2013, 205 employees (2012: 190) worldwide worked for our R&D department. This represents approximately 5.0% of all permanent employees of the Group. Approximately 44% (2012: 44%) work in application development, 26% (2012: 24%) in product development and 30% (2012: 32%) in process development. Our R&D personnel mainly consists of engineers, technicians and technical draftsmen.
R&D EMPLOYEES BY DEPARTMENT
in % 2012 in brackets
44 (44) Application development
30 (32)Process
development
Product development 26 (24)

NORMA Group SE Annual Report 201362
Know-how protected by patents Our know-how in the area of engineered joining technology rep-resents a key success factor for our Group. We therefore use patents to protect our innovations. As at 31 December 2013, we held 867 patents and utility models in 161 patent families. In 2013, we filed 68 new patent applications (2012: 77) in more than 16 patent families (2012: 20 patent families). Licensing revenue plays a subordinate role since we use most of our licenses and rights ourselves for competitive reasons.
The carrying amount of our patents and technologies as at 31 December 2013 amounted to a total of EUR 14.3 million. Notes, p. 149.
R&D expensesOur research and development expenses in EJT totalled EUR 21.9 million in 2013 (2012: EUR 22.1 million). This represents approximately 4.9 percent of sales in this area.
External expenses in the Research and Development department came to EUR 2.5 million in 2013 (2012: EUR 3.2 million). This includes primarily external audit costs. Audits that cannot be performed internally in an economical manner must be secured externally in order to meet the required audit extent in a flexible and economical manner, besides general framework agreements with experimental service providers.
The main investment focus in the area of Research and Devel-opment was the second SCR (Selective Catalytic Reduction) testing facility at our headquarters in Maintal. This unique testing facility allows us to process initiated and planned projects with SCR systems in the coming years in a timely manner. Further-more, the testing sites in China and the United States were also strengthened.
We received no public funding support for Research and Develop-ment in 2013 (2012: EUR 55,000).
Strategic collaboration with customers and research institutesOur product development and application development in the area of Engineered Joining Technology (EJT) is set up as a two-pillar process. Therefore, we have created a standardised innovation process which allows us to utilise our resources at a global level with a sharp focus on growth and profitable markets.
We create new basic products in the entire area of EJT in prod-uct development in close cooperation with our customers. Our application developers modify our existing and newly developed products based on our customers’ specific requirements or local
conditions. Our competence centres in the USA, China, India and Europe focus on clearly defined innovation tasks aimed at developing solutions for various products and product groups in the different customer groups and adjusting them to account for regional characteristics.
On the one hand, we successfully develop high-performance joining technologies together with our customers in order to de-velop new applications that allow for existing products to be used. On the other hand, we meet new market challenges head on and implement them seamlessly in new products. This process in-cludes the validation of new products, but also the development of new materials, product testing and the definition of internal product and test specifications that confirm the reliability of our products.
Due to our close proximity to our customers, we also increase the speed with which we can market product innovations, achieve a high level of customer-specific adaptation and differentiate our-selves from direct competitors who mainly operate locally. Further more, we offer our customers tailor-made products for current applications, while simultaneously setting future trends in the area of joining technology. These solutions offer our cus-tomers an innovative edge and thus increased competitiveness.
At our cutting-edge testing laboratory, we are able to perform service life tests for all relevant application areas. We use our laboratory to test joining technology for cooling water and fuel lines, charge air and other air and gas applications, among other things. These test facilities help us to develop new products, set their specifications and test them. We are also able to run tests in accordance with relevant customer specifications. Our cus-tomers can trust the joining integrity of our products after instal-lation due to this safety concept that accompanies a product
R&D KEY FIGURES
2013
2012 2011
Number of R&D employees 205 190 174
R&D employee ratio with respect to permanent staff in % 5.0 5.1 5.1
R&D expenses in the area of EJT in EUR millions 21.9 22.1 16.8
R&D ratio (with respect to EJT sales) in % 4.9 5.1 4.1
External R&D expenses (excluding personnel costs) in EUR millions 2.5 3.2 3.0
R&D subsidies received in EUR thousands 0 55 58

63Consolidated Management Report
Principles of the Group
from development to the production stage. We achieve both thanks to the committed and close cooperation of all functional areas of NORMA Group, starting with our sales employees and engineers, but also process development, IT and other areas such as purchasing.
We also work closely with research and higher education insti-tutions such as material and other testing institutes. However, for competitive reasons, we do not publish the specific nature of these research partnerships.
The Distribution Services division is purely a commercial unit; the market does not require the same type of technological research as is conducted in the EJT unit. Moreover, our customers in this sales segment expect a strong brand image and the most com-plete product range possible with the corresponding marketing measures. Therefore, we continuously drive development in this unit by making useful additions to the product range.
Developments in 2013 and newly introduced productsIn the EJT unit, we introduced further innovations to the market that help our customers to meet challenges in the area of weight and emission reduction, minimisation of leaks and assembly opti-misation and safety:
Redesign of the Push&Seal NORMAQUICK PS3 quick connec-tor for cooling water systems in passenger cars. With the new design, we have reduced the overall weight by up to 40 percent. The connector is now even more compact, which means it can be used more easily in narrow spaces.
We developed a diesel tank filling system for quicker and safe refuelling of combines and large tractors in cooperation with CLAAS KGaA mbH, a globally leading manufacturer of agri-cultural machinery.
Optimisation of the ABA Mini W1 clamp for thin-walled hoses with small diameters for use in fuel, pneumatic and water hoses. Offers higher corrosion resistance and easier mounting.
Sale contribution of newly introduced product numbers in 2013 amounted to EUR 51.9 million of total sales. This corresponds to an 8.1 % share of total sales.
IMPORTANT PRODUCTS INTRODUCED IN THE LAST YEARS
Product Application
Industry Year
NORMACLAMP® TORRO Tamper Proof Tank, air induction and cooling systems Agriculture, automotive industry, shipbuilding, construction industry
2012
NORMAFLEX® Low Emission Tubes Fuel systems Automotive industry 2012
NORMAQUICK® TWIST III Charge air and cooling water systems Agriculture, automotive industry, shipbuilding, construction industry
2012
NORMACONNECT® V PP profile clamp Flanged pipes, exhaust gas, cooling and filter systems
Agriculture, automotive industry, shipbuilding, construction industry
2012
Red Grip Electrical, hydraulics, air ducts, drainages Aviation industry 2012
Thermoplastic material for high temperature applications in cooling systems
Cooling systems Agriculture, automotive industry, construction industry
2012
SCR Urea Generation II lines Dosing lines for SCR systems Agriculture, automotive industry, construction industry
2012
Pre-positioning of hose clamps Mainly for charge air connections and other connections with large diameters
Agriculture, automotive industry, construction industry
2011
Automatic venting of closed fluid circuits Cooling water systems in various vehicles, electric vehicles in particular
Agriculture, automotive industry, construction industry
2011
Broadband coupling for exhaust aftertreatment Exhaust gas systems Automotive industry 2011
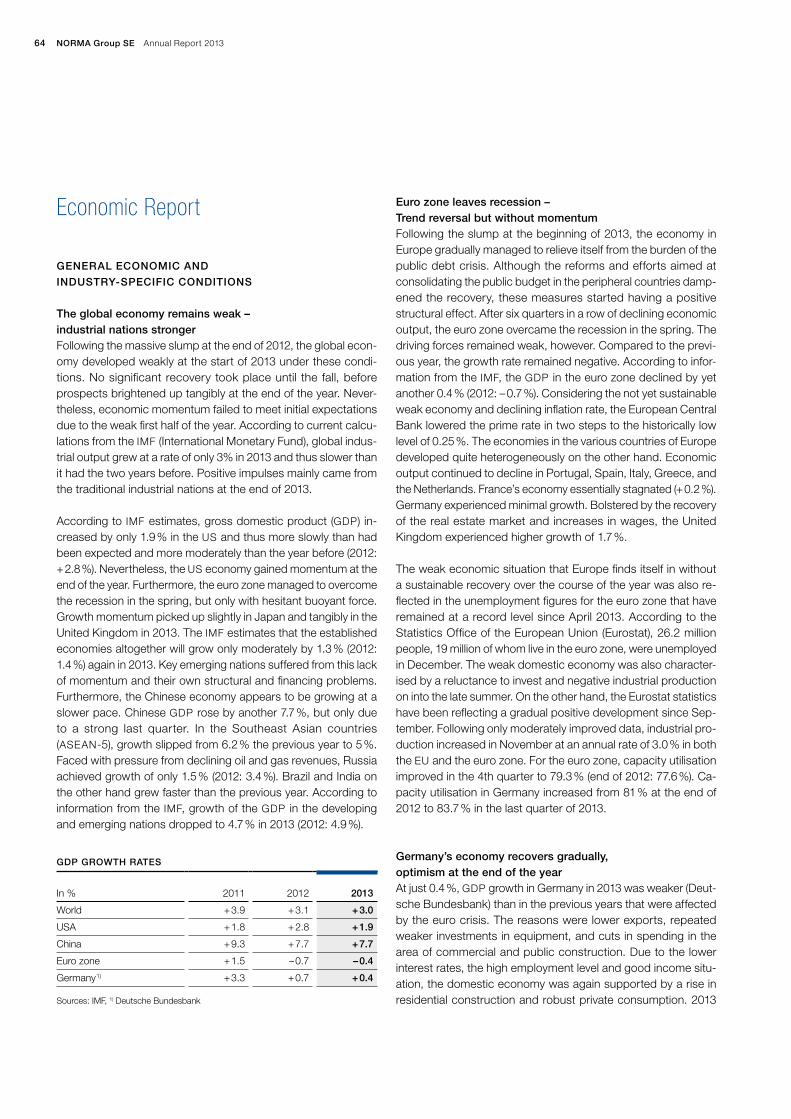
NORMA Group SE Annual Report 201364
Economic Report
GENERAL ECONOMIC AND
INDUSTRY-SPECIFIC CONDITIONS
The global economy remains weak – industrial nations stronger Following the massive slump at the end of 2012, the global econ-omy developed weakly at the start of 2013 under these condi-tions. No significant recovery took place until the fall, before prospects brightened up tangibly at the end of the year. Never-theless, economic momentum failed to meet initial expectations due to the weak first half of the year. According to current calcu-lations from the IMF (International Monetary Fund), global indus-trial output grew at a rate of only 3% in 2013 and thus slower than it had the two years before. Positive impulses mainly came from the traditional industrial nations at the end of 2013.
According to IMF estimates, gross domestic product (GDP) in-creased by only 1.9 % in the US and thus more slowly than had been expected and more moderately than the year before (2012: + 2.8 %). Nevertheless, the US economy gained momentum at the end of the year. Furthermore, the euro zone managed to overcome the recession in the spring, but only with hesitant buoyant force. Growth momentum picked up slightly in Japan and tangibly in the United Kingdom in 2013. The IMF estimates that the established economies altogether will grow only moderately by 1.3 % (2012: 1.4 %) again in 2013. Key emerging nations suffered from this lack of momentum and their own structural and financing problems. Furthermore, the Chinese economy appears to be growing at a slower pace. Chinese GDP rose by another 7.7 %, but only due to a strong last quarter. In the Southeast Asian countries (ASEAN-5), growth slipped from 6.2 % the previous year to 5 %. Faced with pressure from declining oil and gas revenues, Russia achieved growth of only 1.5 % (2012: 3.4 %). Brazil and India on the other hand grew faster than the previous year. According to information from the IMF, growth of the GDP in the developing and emerging nations dropped to 4.7 % in 2013 (2012: 4.9 %).
Euro zone leaves recession – Trend reversal but without momentumFollowing the slump at the beginning of 2013, the economy in Europe gradually managed to relieve itself from the burden of the public debt crisis. Although the reforms and efforts aimed at consolidating the public budget in the peripheral countries damp-ened the recovery, these measures started having a positive structural effect. After six quarters in a row of declining eco nomic output, the euro zone overcame the recession in the spring. The driving forces remained weak, however. Compared to the previ-ous year, the growth rate remained negative. According to infor-mation from the IMF, the GDP in the euro zone declined by yet another 0.4 % (2012: – 0.7 %). Considering the not yet sustainable weak economy and declining inflation rate, the European Central Bank lowered the prime rate in two steps to the historically low level of 0.25 %. The economies in the various countries of Europe developed quite heterogeneously on the other hand. Economic output continued to decline in Portugal, Spain, Italy, Greece, and the Netherlands. France’s economy essentially stagnated (+ 0.2 %). Germany experienced minimal growth. Bolstered by the recovery of the real estate market and increases in wages, the United Kingdom experienced higher growth of 1.7 %.
The weak economic situation that Europe finds itself in without a sustainable recovery over the course of the year was also re-flected in the unemployment figures for the euro zone that have remained at a record level since April 2013. According to the Statistics Office of the European Union (Eurostat), 26.2 million people, 19 million of whom live in the euro zone, were unemployed in December. The weak domestic economy was also character-ised by a reluctance to invest and negative industrial production on into the late summer. On the other hand, the Eurostat statistics have been reflecting a gradual positive development since Sep-tember. Following only moderately improved data, industrial pro-duction increased in November at an annual rate of 3.0 % in both the EU and the euro zone. For the euro zone, capacity utilisation improved in the 4th quarter to 79.3 % (end of 2012: 77.6 %). Ca-pacity utilisation in Germany increased from 81 % at the end of 2012 to 83.7 % in the last quarter of 2013.
Germany’s economy recovers gradually, optimism at the end of the yearAt just 0.4 %, GDP growth in Germany in 2013 was weaker (Deut-sche Bundesbank) than in the previous years that were affected by the euro crisis. The reasons were lower exports, repeated weaker investments in equipment, and cuts in spending in the area of commercial and public construction. Due to the lower interest rates, the high employment level and good income situ-ation, the domestic economy was again supported by a rise in residential construction and robust private consumption. 2013
GDP GROWTH RATES
In % 2011 2012
2013
World + 3.9 + 3.1 + 3.0
USA + 1.8 + 2.8 + 1.9
China + 9.3 + 7.7 + 7.7
Euro zone + 1.5 – 0.7 – 0.4
Germany 1) + 3.3 + 0.7 + 0.4
Sources: IMF, 1) Deutsche Bundesbank

65Consolidated Management Report
Economic Report
got off to a weak start due to the extremely cold and long winter. GDP stagnated at the level of the weak previous quarter. Com-pared to the previous year, economic output even declined by 1.6 %. The compensation effects in spring were followed by a blow from disappointing foreign trade. The driving forces took effect, but only slowly. Industrial capacity utilisation improved as industrial production recovered starting at the middle of the year. This triggered a recovery in investments in equipment. Both the economic situation and expectations brightened up at the end of 2013. Important early indicators like the Ifo Business Climate Index and the ZEW Index improved noticeably and signalised a robust recovery in the months to come at the end of 2013 / be-ginning of 2014.
Global mechanical engineering lacks momentum, decline in manufacturing in Germany According to the estimates of the industrial association VDMA, mechanical engineering grew slightly on a global basis. Sales rose by 1 % in real terms. This can be attributed to the two large countries of China (+ 5 %) and the USA (+ 1 %). Japanese and Italian manufacturers recorded drops in sales of 2 % and 4 % respectively. German mechanical engineering sales stagnated at EUR 207 billion. Production declined by 1 % in real terms. Due to the weak start of the year, expectations of weak growth in 2013 were not met. Reluctance to invest in Western Europe and Ger-many in particular weakened the industrial economy. European business stagnated, while exports to Asia, in particular, declined (through October 2013: a nominal – 4.5 %) and Latin America (– 3.2 %). 4.2 % fewer machines were exported to China during this period, and 0.7 % fewer to the USA.
Orders for the German mechanical and industrial engineering industry also reflected the weak global economy in 2013. The recovery of incoming orders from abroad did not continue in 2013. The trend was clearly negative here during the reporting year. At the beginning of the year, domestic orders in particular slumped, yet managed to recover over the course of the year. Impulses came from industrial manufacturing, which gained momentum, and the improved economic prospects. For the year 2013 as a whole, incoming orders, domestic orders and orders from abroad each came in 2 % behind last year’s level.
Car industry continues to grow – Western Europe gained groundThe global automotive market also continued to grow in 2013. According to information from the German industry association VDA and the market research institute IHS Automotive (Polk), new registrations (passenger cars, light trucks) increased by about 5 % worldwide. The two major markets USA and China
accounted for almost all of this growth. The number of new regis-trations in the USA rose by 7.5 %, while the Chinese market grew by 23.1 % (VDA). The Japanese market stagnated. Due to the weak economy, important emerging nations experienced a de-cline in passenger car sales. According to VDA information, for example, the market volumes in Brazil declined by 1.5 %, in India by 7.5 %, and in Russia by 5.5 %.
The Western European passenger car market stabilised in the second half of the year after several years of declines. A recovery set in at the end of the year. According to information from the European umbrella organisation ACEA, new registrations in the euro zone declined by 1.8 % and in Western Europe by a total of 1.9 % to 11.55 million cars in 2013 overall. With respect to the high-volume markets, France (– 5.7 %) and Italy (– 7.1 %) experi-enced the highest declines. Spain (+ 3.3 %) and Portugal (+ 11.1 %) on the other hand experienced growth once again. Due to the strong domestic economy, the market in the United Kingdom experienced strong growth of 10.8 %. New car registrations in Germany dropped by 4.2 %. German manufacturers nevertheless benefited from the international markets, especially from growth in the USA and China. Therefore, according to estimates from the VDA, exports and domestic production each rose by 1 %. Manufacturing at foreign sites even rose by 6 %.
The European commercial vehicle market stabilised in 2013. Accord ing to the ACEA’s figures, registrations of cars and buses in Western Europe rose by 1.2 % and in the euro zone by 0.4 % for the year as a whole. The Italian market continued its decline (– 11.7 %). New registrations declined only slightly in France (– 3.7 %) and Germany (– 2.0 %). The United Kingdom, Spain and Portugal all showed strong growth. In 2013, registrations of heavy vehicles (over 16 tons), a market dominated by German commer-cial vehicle manufacturers, rose sharply by 6.8 % in the euro zone and 8.6 % in the EU. The truck segment up to 3.5 tons dropped slightly, while registration figures for buses rose moderately.
European construction declines, strong residential construction in GermanyThe construction industry in Europe shrunk again in 2013, how-ever the trends differed in the various countries. The industry network Euroconstruct and the Ifo Institute estimated the decline in construction in Western Europe to be nearly 3 % in real terms. Here, investment in new homes fell to the lowest level in 20 years. Italy and Portugal had to absorb severe blows. Furthermore, construction activity in the Netherlands also shrank. The con-struction industry in France experienced moderate losses. The markets in Spain and Ireland, on the other hand, recovered. The construction industry in the United Kingdom experienced gains over the course of the year.
NORMA Group SE Annual Report 201366
The construction industry in Germany suffered from a long, cold winter. According to Eurostat, construction output started to re-cover in July, yet still failed to compensate for the declines despite a solid order situation. According to estimates from the IfW in Kiel, construction spending dropped by 0.3 % in real terms in 2013. This was caused by losses in the area of commercial con-struction (– 3.2 %) and public construction (– 1.1 %). Residential construction, on the other hand, developed positively once again. The number of building permits rose sharply. Despite the losses caused by adverse weather conditions and high capacity utilisa-tion, investment in residential construction increased by 1.3 % in real terms (IfW, Deutsche Bundesbank). According to information from the German Statistics Office, orders for the main construc-tion trade rose by 1.2 % in real terms and total sales by 1.9 % through November. The two major industry associations ZDB and HDB estimate that the main German construction trade’s sales rose by 2.5 % to EUR 95.3 billion in 2013.
SIGNIFICANT EVENTS FOR BUSINESS DEVELOPMENT
Acquisition of the distribution business of Davydick & Co. Pty Ltd., Australia In January 2013, we acquired the distribution business of Davydick & Co. Pty Limited (“Davydick”) in Goulburn, Australia, and added it to the group of consolidated companies of NORMA Group. Davy-dick has been marketing various elements for use in transporting water in irrigation systems for more than 20 years. The company supplies more than 700 customers in Australia with joining prod-ucts for irrigation systems and valves and pumps under the name PUMPMASTER, particularly in the field of agriculture, sanitary prod-ucts and home supplies. The company recorded sales of around EUR 4 million in 2012. For us, this acquisition represents a major step toward expanding our business activities in the area of water management. We thus improve our infrastructure product range and our sales network, particularly in the areas of agriculture and irrigation in the Asia-Pacific region.
Acquisition of the distribution business on joining technology from Variant S.A., PolandIn May 2013, we signed a purchase agreement to acquire the distribution business of Variant S.A. based in Krakow, Poland, and included this company in the group of consolidated compa-nies of NORMA Group effective June 2013. Variant markets join-ing products and cable connectors and has been a NORMA Group sales partner for over 20 years. Its products are marketed to more than 1,000 retailers and wholesalers in Poland. Among its end customers are home-improvement markets, workshops, and expert stores that sell automotive supplies. Variant had sales of around EUR 5 million in its joining technology division in finan-
cial year 2012. With this acquisition, we are strengthening our market position in the Eastern European region and expanding our business activities in the area of cable connectors.
Acquisition of Guyco Pty Ltd., AustraliaIn June 2013, we signed a purchase agreement to acquire all of the shares of Guyco Pty Ltd., which has its headquarters in Adelaide, Australia. It was included in the consolidated group of NORMA Group after the transaction had been completed in July 2013. This company specialises in the design, production and sale of joining products and valves that are used in freshwater supplies, irrigation and sanitary systems, but also in agriculture and industry. Guyco supplies more than 700 customers in Aus-tralia and New Zealand and generated sales of around EUR 7 million in financial year 2012. With this acquisition, we are ex-panding our product portfolio and strengthening our presence in the Asia-Pacific region.
Acquisition of a portion of production of Click Automotiva Industrial and setting up of manufacturing in BrazilIn order to build up our plant in Atibaia, Brazil, we bought assets of Click Automotiva Industrial Ltda. in September 2013, which represent a portion of the production. The new plant in Atibaia near São Paulo has capacities for manufacturing a broad range of NORMA Group products including exhaust gas pipe clamps, mounting clamps, connectors and fluid systems. We have been present in Brazil with a sales site since 2011. By building this new plant, we are further expanding our manufacturing in Brazil as planned and strengthening our presence in South America.
These events are the direct results of our strategy described earlier. Corporate Goals and Strategies, p. 58.
COMPARISON OF ACTUAL TO FORECAST
COURSE OF BUSINESS
In our annual report 2012, we projected moderate growth in sales and an acquisition-related sales contribution of EUR 20 million. Annual Report 2012, p. 95. Due to additional acqui-sitions, we adjusted acquisition-related growth in sales in our Q2 report 2013 to EUR 25 million and to EUR 26 million in our Q3 report.
With annual sales of EUR 635.5 million and sales growth of 5.1 % compared to the previous year’s level, we were able to confirm our forecast. The sales share from acquisitions amounted to EUR 26.7 million, which is slightly higher than the level we had projected.

67Consolidated Management Report
Economic Report
COMPARISON OF ACTUAL BUSINESS DEVELOPMENT WITH FORECAST
Results in 2012
Forecast Annual Report 2012(as at March 2013)
Forecast Q2 / 2013 report (as at August 2013)
Forecast Q3 / 2013 report (as at November 2013)
Result 2013
Group sales in EUR millions
604.6 n /a n /a n /a 635.5
Adjusted EBITA margin 17.4 % on par with the three previous years of over 17 %
no adjustment no adjustment 17.7 %
Growth in Group sales 1.5 % + EUR 14.3 million from
acquisitions
moderate growth in addition to around EUR 20 million from acquisitions 1)
moderate growth in addition to around EUR 25 million from acquisitions 2)
moderate growth in addition to around EUR 26 million from acquisitions 3)
2.5% + EUR 26.7 million from acquisitions
Sales growth in the Asia-Pacific region
22.6 % more than 10 % organic no adjustment more than 10 % including acquisitions
28.1 %
Sales growth in the Americas
11.8 % neutral to slight growth in euros
no adjustment no adjustment – 0.9 %
Sales growth in the EMEA region
– 1.4 % neutral to slight growth no adjustment no adjustment 5.6 %
Sales growth EJT 3.9 % moderate no adjustment no adjustment 3.8 %
Sales growth DS 2.5 % strengthened mainly by ac-quisitions made in 2012
no adjustment no adjustment 11 %
Financial result in EUR millions
– 13.3 approx. EUR 15 million no adjustment no adjustment – 15.6 million
Earnings per share in EUR
1.94 (adjusted) 1.78 (reported)
moderately higher no adjustment no adjustment 1.95 (adjusted) 1.74 (reported)
Investments in R&D (in relation to EJT sales)
5.1 % about 4 % of EJT sales no adjustment no adjustment 4.9 %
Cost of materials ratio 43.6 % about the same level as last year (43.6 %)
no adjustment no adjustment 42.4 %
Personnel cost ratio 25.9 % gradual continued improvement
no adjustment no adjustment 26.7 %
Tax ratio (adjusted) 30.3 % about 30 to 32 % no adjustment no adjustment 32.6 %
Investment ratio (ad-justed for acquisitions)
5.0 about 4.5 % no adjustment no adjustment 4.8 %
Net operating cash flow in EUR millions
81.0 stable (near last year’s adjusted level of EUR 81.6 million)
no adjustment no adjustment 103.9
Dividend in EUR Dividend payment ratio
EUR 0.65 33.5 %
between around 30 % and 35 % of adjusted consolidat-ed Group earnings
no adjustment no adjustment EUR 0.70 35.9 %
1) CONNECTORS Verbindungstechnik, Nordic Metalblok, Chien Jin Plastic, Groen Bevestigingsmaterialen, Davydick2) in addition to Variant und Guyco3) adjustment of expected sales for the acquired companies

NORMA Group SE Annual Report 201368
As forecast, sales in the DS area were carried for the most part by the acquisitions (15.3 %) we made in 2012 and 2013. Total sales in the area of DS amounted to EUR 193.6 million.
In the EJT area, sales grew organically by 5.6 %, but were nega-tively affected by currency effects. By increasing sales by 3.8 %, we remained within our forecast.
We expected to see the highest increase in sales of over 10 % in the Asia-Pacific region in 2013. Here, we adjusted this forecast in our Q3 report to more than 10 % growth, including acquisitions. We were able to exceed this goal despite negative currency effects by achieving growth in sales, including acquisitions, of 28.1 % to EUR 56 million in 2013.
For the Americas and EMEA regions, we had predicted neutral to slight or neutral to weak growth respectively. In the EMEA region, we managed to significantly exceed our forecast due to new ramp-ups as a result of the EURO-6 standard to achieve 5.6 % higher sales growth. In the Americas, the fact that the economy remained weak prevented us from achieving our growth goal there of 2.4 % organic growth by – 0.9 % in 2013 due to an extremely strong euro during the second half of the year.
By employing systematic cost reduction measures as part of our Global Excellence Programme and using intelligent sourcing strategies, we managed to lower our cost of materials ratio to 42.4 %, which is even lower than the level we had projected.
On the other hand, we were unable to confirm our forecast of a gradual and continued improvement in personnel costs. Per-sonnel costs rose disproportionately to sales to 26.7 % in 2013 due to the acquisitions we made, the sites we opened or expand-ed, and the resulting increase in the number of employees.
We had hoped that net other operating income and expenses would stabilise due to investments in growth and the expansion of our activities in the emerging nations. In relation to sales, at 11.4 %, they were only slightly above the 11.1 % level of the pre-vious year, therefore we feel we met our forecast.
With a financial result of EUR – 15.6 million, we managed to meet our forecast (EUR – 15 million).
Adjusted earnings per share, which is calculated on the basis of the adjusted earnings for the period, amounted to EUR 1.95 in 2013 (2012: EUR 1.94). The reported earnings-per-share amount-ed to EUR 1.74 (2012: EUR 1.78).
At 32.6 % of earnings before taxes, the tax ratio was slightly higher than the target corridor that we had forecast of between 30 % and 32 %.
We predicted an investment rate of 4.5% of consolidated sales. With EUR 30.5 million in expenditures and a ratio of 4.8 %, we were slightly above this originally planned ratio.
We had hoped that our net operating cash flow would remain stable at the adjusted level of the previous year of EUR 81.0 million. Due to our positive operating result (EBITDA) and positive effects from reverse factoring on trade liabilities, we were able to significantly increase our forecast with net cash flow of EUR 103.9 million.
We pursue a sustainable dividend policy and strive to achieve a pay-out ratio of approx. 30 % to 35 % of annual Group earnings. With the proposed dividend of EUR 0.70 per share and a pay-out ratio of 35.9 % of adjusted Group earnings, we are at the upper end of this range.
GENERAL STATEMENT BY THE MANAGEMENT BOARD ON
THE COURSE OF BUSINESS AND ECONOMIC SITUATION
Financial year 2013 was essentially in line with the Management Board’s expectations. We managed to compensate for the weak start to the year because of the economy by the time the year ended.
Due to the acquisitions we made, we were able to increase our originally forecast consolidation-related sales for the first and second quarters from EUR 20 million to EUR 25 million and 26 million respectively.
At the end of financial year 2013, total sales came in at EUR 635.5 million. By achieving 2.5 % organic growth in sales and expand-ing our sales by 4.4 % with the help of acquisitions, we slightly exceeded our November 2013 forecast. Despite the difficult eco-nomic situation, we were able to increase our operating earnings and achieve an operational margin of 17.7 % as forecast.
If we take a look at specific segments, we can see that the vari-ous regions experienced different developments: Whereas the APAC region recorded strong growth in all quarters mainly due to acquisitions, the EMEA region – driven by new ramp-ups as a result of the EURO-6 standard – began experiencing significant organic growth starting in the second quarter. The Americas region also recorded solid organic growth starting in the third quarter, nevertheless currency effects had a negative effect on the total growth in sales in this region in 2013.
In light of the economic conditions, the Management Board is satisfied with how business developed in 2013. We succeeded in achieving most of our objectives. Through the acquisitions we made and by expanding our capacities, particularly in the

69Consolidated Management Report
Economic Report
Asia-Pacific region, we managed to expand and strengthen our market position.
The Management Board considers the economic situation of NORMA Group to be stable and sustainable. This assessment is based on the results of our balance sheet and NORMA Group SE’s individual results in 2013 and takes business development up until the drawing up of the Group management report 2013 into consideration. Business development through the start of 2014 has been in line with the Management Board’s expectations up until this annual report was prepared.
EARNINGS, ASSETS AND FINANCIAL POSITION
The accounting rules changed in financial year 2013 due to the first-time use of IAS 19R. In order to better compare the earnings, assets and financial position, the figures in this annual report that pertain to 2012 have been adjusted to suit the new accounting rules and may therefore deviate from the figures published in annual report 2012. Notes, p. 141.
Sales and Earnings PerformanceOrder book remains at a high levelAs at 31 December 2013, the order book was EUR 236.7 million and thus significantly higher than last year’s previous high level of EUR 215.4 million. Due to short-term orders in the area of DS, the order volume pertains mainly to EJT.
Moderate growth in sales despite economic weakness in the Americas and negative currency effectsWe finished financial year 2013 successfully with Group sales of EUR 635.5 million (2012: EUR 604.6 million). We were thus able
to achieve a 5.1 % increase over the previous year despite neg-ative currency effects (– 1.8 %). Following a slow start to the first quarter due to economic conditions, we managed to signi ficantly increase our sales growth in the second, third and fourth quarters compared to the previous year.
This growth resulted from the successfully integrated acquisitions on the one hand (+ 4.4 %), on the other hand, we were able to achieve 2.5 % organic growth in sales. The latter was driven mainly by new ramp-ups due to the EURO-6 standard.
The companies acquired in 2012 and 2013 contributed EUR 26.7 million to sales growth, but to various extents depending on when the acquisition took place.
We meet the demand in our business with our global network of production plants with highly-developed joining technology. Our manufacturing facilities are mostly located in the markets that they serve. Accordingly, costs are incurred in the same currency in which we realise our sales revenues. Currency effects, in par-ticular the correlating development of both the US dollar and the euro, had a negative impact on sales in 2013. Since we generate a large portion of our sales in the USA and the euro zone, a depreciation on the part of the US dollar is disadvantageous from a balance sheet perspective, since we report in euros and the profits generated in US dollars resulted in a lower computed euro value (translation effect). The currency relationship usually also reflects the differences in regional economic momentum. The average exchange rate of the US dollar to the euro was 1.33 in 2013 and thus higher than the previous year’s average exchange rate of 1.28 USD/EUR.
NORMA Group’s business development is subject to a certain seasonal fluctuation and is typically characterised by a strong
OVERVIEW OF SALES CONTRIBUTIONS FROM THE COMPANIES ACQUIRED IN 2012 AND 2013
Company When added to the consolidated group
Share of sales contribution 2013 1)
in EUR millions
Connectors Verbindungstechnik AG, Switzerland April 2012 5.1
Nordic Metalblok S.r.l., Italy July 2012 2.9
Chien Jin Plastic Sdn. Bhd., Malaysia 2) November 2012 7.2
Groen Bevestigingsmaterialen B.V., the Netherlands 3) December 2012 3.4
Davydick & Co. Pty Limited, Australia January 2013 3.3
Variant S.A., Poland June 2013 1.2
Guyco Pty Limited, Australia July 2013 3.6
Click Automotiva Industrial Ltda., Brazil September 2013 0
Total 26.7
1) Until 12 months have expired following the acquisition 2) as at 31 Dec. 2013: Share of 85 %3) as at 31 Dec. 2013: Share of 90 %

NORMA Group SE Annual Report 201370
first half of the year compared to the second half. In 2013, how-ever, we experienced the opposite trend due to the weak eco-nomic environment. General Economic and Industry-Specific Environment, p. 64. In the first quarter, sales revenue amounted to EUR 159.3 million and was thus 0.3 per cent lower than in the first quarter of the previous year. In the second quarter, we not only generated positive sales revenues from our acquisitions, but also grew organically and generated sales of EUR 163.5 million, 3.5 per cent more than in the second quarter of 2012. In the third quarter, at EUR 160 million, sales turned out to be somewhat weaker than in the previous quarter due to the effect of holidays with fewer business days in the summer and increasing uncer-tainty regarding the further economic development. Compared to the same period in the previous year, however, sales rose by 6.9 per cent. The fourth quarter was seasonally the weakest compared to the rest of the year with sales of EUR 152.8 million, but nevertheless exceeded the previous year’s period in 2012 with sales growth of 11.2 percent.
Organic growth in the area of EJT; DS bolstered by acquisitions We generated total sales of EUR 443.9 million in the EJT unit. This represents an increase of 3.8 % over the previous year’s sales of EUR 427.6 million. The EJT unit also clearly experienced the weak economic environment at the beginning of the year and this resulted in a slight decline in EJT sales by – 2.4 % during the first quarter compared to the same period last year. Thanks to the three strong quarters that followed, the unit was able to compen-sate for this again by recording significant organic growth in sales.
The DS unit developed positively thanks to acquisitions. Sales rose from EUR 174.5 million in 2012 to EUR 193.6 million in the current financial year and thus by 11 %.
EFFECTS ON GROUP SALES
in EUR millions
Share
in %
Sales 2012 604.6
Organic growth 15.1 2.5
Acquisitions 26.7 4.4
Currency effects – 10.9 – 1.8
Sales 2013 635.5 5.1
DEVELOPMENT OF THE DISTRIBUTION CHANNELS
EJT
DS
2013 2012
2013 2012
Sales in EUR millions 443.9 427.6 193.6 174.5
Growth in % 3.8 3.9 11.0 2.5
Share of sales in % 70.0 71.0 30.0 29.0
Operational results increase at a high level We managed to increase our earnings before interest, taxes, de-preciation and amortisation (adjusted EBITDA) by EUR 8.5 million or 7.1 % from EUR 120.8 million in 2012 to EUR 129.3 million in 2013. EBITA amounted to EUR 112.6 million for the last financial year and was thus 6.9 % higher than the adjusted EBITA in 2012 (EUR 105.4 million). This means we achieved a higher operating margin of 17.7 % compared to the previous year (2012: 17.4 %).
Sales in EUR millions 2012
Percentage share
of the entire year 2012
2013
Percentage share
of the entire year 2013
H 1 317.7 52.5 % 322.8 50.8 %
H 2 286.9 47.5 % 312.7 49.2 %
H2
322.8
312.7
H1
317.7
286.9
340
320
300
280
260
SALES
in EUR millions 2012 2013

71Consolidated Management Report
Economic Report
Adjusted EBITDA generally comprises revenue, changes in in-ventories of finished goods and work in progress, raw materials and consumables used, other operating income and expenses, and employee benefits expense, adjusted for material one-time effects.
From the view of the Management Board, there were no import-ant special effects in financial year 2013, therefore only the de-preciation on fixed assets and intangible assets, in each case from purchase price allocations, are presented in adjusted form. Adjusted EBITA comprises adjusted EBITDA less depreciations, without depreciations from purchase price allocations. Notes, p. 142.
The main influencing factors on the development of our opera-tional results include material and personnel costs, but also other operational earnings and expenditures.
Cost of materials ratio improved againAustenitic and ferritic steels as well as plastic granules are key components of the raw materials we use. Despite relatively stable market prices for steel-related goods last year, we managed to lower our purchase prices for the respective material groups for individual NORMA plants quite significantly by using intelligent commodity strategies. We were able to negotiate better terms by reducing the number of suppliers and leveraging volumes across multiple NORMA Group plants. By identifying new sup-pliers in best-cost countries and developing sustainable partner-ships, we secure ourselves market compatible and globally competitive price levels for our materials over the long term.
The combination of stable prices and selective and specifically coordinated purchasing activities helped us to limit the increase in our material expenses to only 2.3 % from EUR 263.5 million to EUR 269.4 million in 2013, a lower rate than sales. This means we were able to significantly reduce our material cost ratio in 2013 to 42.4 % (2012: 43.6 %). Notes, p. 143 and Multi-Year Overview, p. 186.
Personnel costs impacted by extended production capaci-ties and acquisitions Employee benefits expense increased by 8.4 % from EUR 156.5 million to EUR 169.7 million compared to last year. The personnel cost ratio rose from 25.9 % in 2012 to 26.7 %. This increase in personnel costs can be attributed mainly to acquisitions and expansion of sites and the resulting increase in the average num-ber of employees (without temporary employees) to 3,945 (pre-vious year: 3,577). Production and Logistics, p. 78.
Other operating income and expenses relatively stable Other operating income and expenses in 2013 amounted to EUR – 72.4 million (previous year: EUR – 67.1 million). Thus, the rate of 11.1 % with respect to sales increased slightly to 11.4 %. This slight increase in the ratio can be attributed among other things to one-off expenses that were incurred by transforming NORMA Group AG into a Societas Europaea (SE) in the second quarter of 2013.
Gross margin improved After deducting material costs (EUR 269.4 million), changes in inventories (EUR 1.9 million) and other own work capitalised (EUR 3.4 million) of sales, we reported gross profit of EUR 371.4 million in 2013 (2012: EUR 344.4 million). This means our gross margin improved by 1.4 percentage points to 58.4 % after 57.0 % in 2012.
2013
635.5
2012
604.6700
600
500
400
300
200
100
0
SALES GROWTH
in EUR millions
SALES DISTRIBUTION BY DISTRIBUTION CHANNELS
in % 2012 in brackets
DS 30 (29)
70 (71) EJT
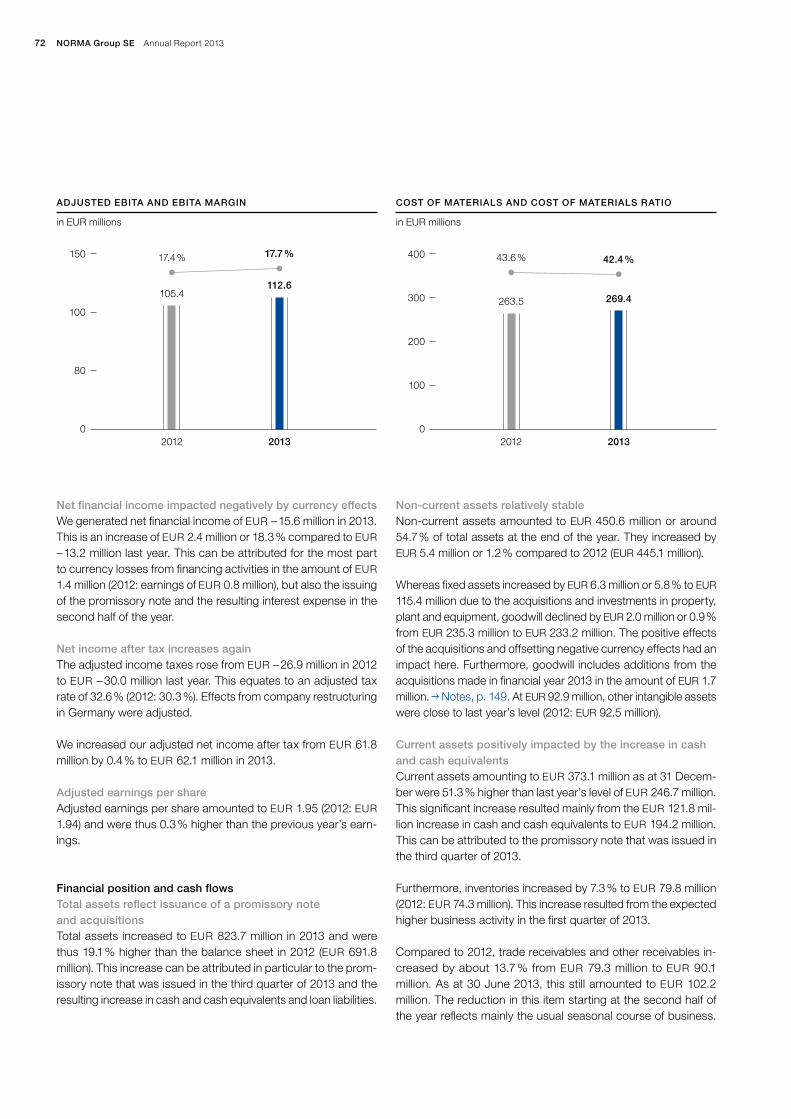
NORMA Group SE Annual Report 201372
Net financial income impacted negatively by currency effects We generated net financial income of EUR – 15.6 million in 2013. This is an increase of EUR 2.4 million or 18.3 % compared to EUR – 13.2 million last year. This can be attributed for the most part to currency losses from financing activities in the amount of EUR 1.4 million (2012: earnings of EUR 0.8 million), but also the issuing of the promissory note and the resulting interest expense in the second half of the year.
Net income after tax increases againThe adjusted income taxes rose from EUR – 26.9 million in 2012 to EUR – 30.0 million last year. This equates to an adjusted tax rate of 32.6 % (2012: 30.3 %). Effects from company restructuring in Germany were adjusted.
We increased our adjusted net income after tax from EUR 61.8 million by 0.4 % to EUR 62.1 million in 2013.
Adjusted earnings per share Adjusted earnings per share amounted to EUR 1.95 (2012: EUR 1.94) and were thus 0.3 % higher than the previous year’s earn-ings.
Financial position and cash flows Total assets reflect issuance of a promissory note and acquisitions Total assets increased to EUR 823.7 million in 2013 and were thus 19.1 % higher than the balance sheet in 2012 (EUR 691.8 million). This increase can be attributed in particular to the prom-issory note that was issued in the third quarter of 2013 and the resulting increase in cash and cash equivalents and loan liabilities.
Non-current assets relatively stableNon-current assets amounted to EUR 450.6 million or around 54.7 % of total assets at the end of the year. They increased by EUR 5.4 million or 1.2 % compared to 2012 (EUR 445.1 million).
Whereas fixed assets increased by EUR 6.3 million or 5.8 % to EUR 115.4 million due to the acquisitions and investments in property, plant and equipment, goodwill declined by EUR 2.0 million or 0.9 % from EUR 235.3 million to EUR 233.2 million. The positive effects of the acquisitions and offsetting negative currency effects had an impact here. Furthermore, goodwill includes additions from the acquisitions made in financial year 2013 in the amount of EUR 1.7 million. Notes, p. 149. At EUR 92.9 million, other intangible assets were close to last year’s level (2012: EUR 92.5 million).
Current assets positively impacted by the increase in cash and cash equivalents Current assets amounting to EUR 373.1 million as at 31 Decem-ber were 51.3 % higher than last year’s level of EUR 246.7 million. This significant increase resulted mainly from the EUR 121.8 mil-lion increase in cash and cash equivalents to EUR 194.2 million. This can be attributed to the promissory note that was issued in the third quarter of 2013.
Furthermore, inventories increased by 7.3 % to EUR 79.8 million (2012: EUR 74.3 million). This increase resulted from the ex pected higher business activity in the first quarter of 2013.
Compared to 2012, trade receivables and other receivables in-creased by about 13.7 % from EUR 79.3 million to EUR 90.1 million. As at 30 June 2013, this still amounted to EUR 102.2 million. The reduction in this item starting at the second half of the year reflects mainly the usual seasonal course of business.
2013
112.6
2012
105.4
17.4 % 17.7 %150
100
80
0
ADJUSTED EBITA AND EBITA MARGIN
in EUR millions
2013
269.4
2012
263.5
43.6 % 42.4 %400
300
200
100
0
COST OF MATERIALS AND COST OF MATERIALS RATIO
in EUR millions
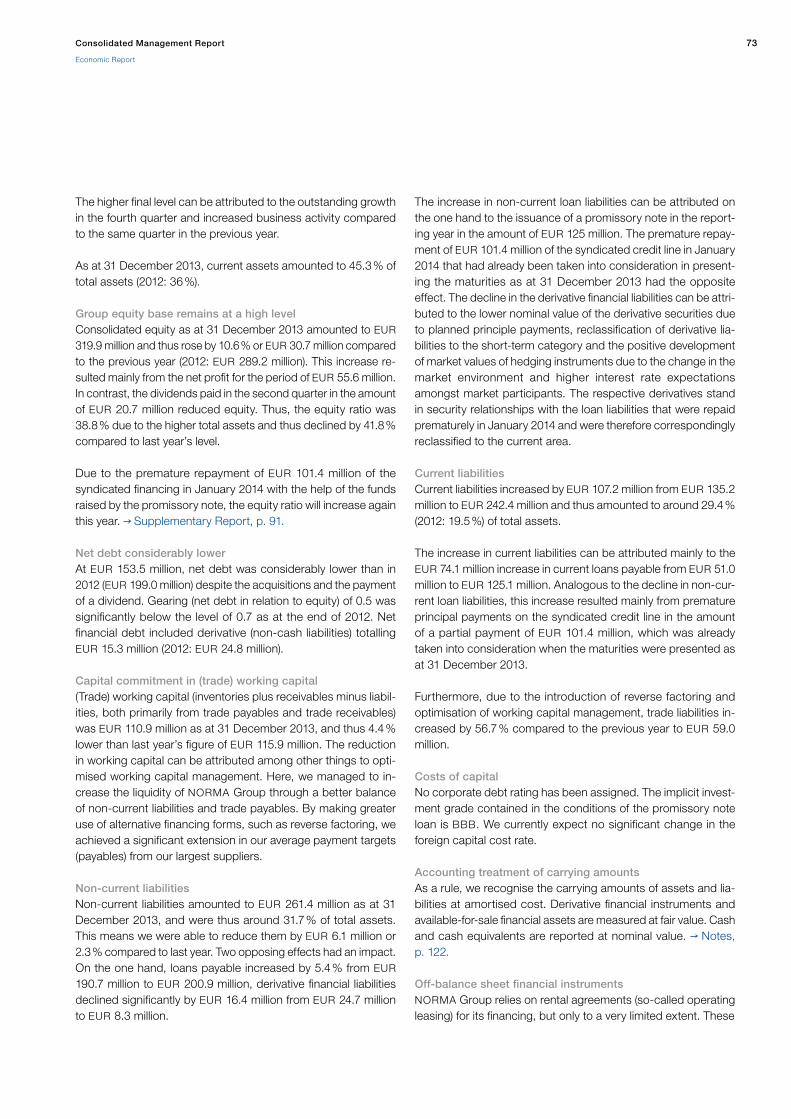
73Consolidated Management Report
Economic Report
The higher final level can be attributed to the outstanding growth in the fourth quarter and increased business activity compared to the same quarter in the previous year.
As at 31 December 2013, current assets amounted to 45.3 % of total assets (2012: 36 %).
Group equity base remains at a high level Consolidated equity as at 31 December 2013 amounted to EUR 319.9 million and thus rose by 10.6 % or EUR 30.7 million compared to the previous year (2012: EUR 289.2 million). This increase re-sulted mainly from the net profit for the period of EUR 55.6 million. In contrast, the dividends paid in the second quarter in the amount of EUR 20.7 million reduced equity. Thus, the equity ratio was 38.8 % due to the higher total assets and thus declined by 41.8 % compared to last year’s level.
Due to the premature repayment of EUR 101.4 million of the syndicated financing in January 2014 with the help of the funds raised by the promissory note, the equity ratio will increase again this year. Supplementary Report, p. 91.
Net debt considerably lower At EUR 153.5 million, net debt was considerably lower than in 2012 (EUR 199.0 million) despite the acquisitions and the payment of a dividend. Gearing (net debt in relation to equity) of 0.5 was significantly below the level of 0.7 as at the end of 2012. Net financial debt included derivative (non-cash liabilities) totalling EUR 15.3 million (2012: EUR 24.8 million).
Capital commitment in (trade) working capital (Trade) working capital (inventories plus receivables minus liabil-ities, both primarily from trade payables and trade receivables) was EUR 110.9 million as at 31 December 2013, and thus 4.4 % lower than last year’s figure of EUR 115.9 million. The reduction in working capital can be attributed among other things to opti-mised working capital management. Here, we managed to in-crease the liquidity of NORMA Group through a better balance of non-current liabilities and trade payables. By making greater use of alternative financing forms, such as reverse factoring, we achieved a significant extension in our average payment targets (payables) from our largest suppliers.
Non-current liabilitiesNon-current liabilities amounted to EUR 261.4 million as at 31 December 2013, and were thus around 31.7 % of total assets. This means we were able to reduce them by EUR 6.1 million or 2.3 % compared to last year. Two opposing effects had an impact. On the one hand, loans payable increased by 5.4 % from EUR 190.7 million to EUR 200.9 million, derivative financial liabilities declined significantly by EUR 16.4 million from EUR 24.7 million to EUR 8.3 million.
The increase in non-current loan liabilities can be attributed on the one hand to the issuance of a promissory note in the report-ing year in the amount of EUR 125 million. The premature repay-ment of EUR 101.4 million of the syndicated credit line in January 2014 that had already been taken into consideration in present-ing the maturities as at 31 December 2013 had the opposite effect. The decline in the derivative financial liabilities can be attri-buted to the lower nominal value of the derivative securities due to planned principle payments, reclassification of derivative lia-bilities to the short-term category and the positive development of market values of hedging instruments due to the change in the market environment and higher interest rate expectations amongst market participants. The respective derivatives stand in security relationships with the loan liabilities that were repaid prematurely in January 2014 and were therefore corre spondingly reclassified to the current area.
Current liabilities Current liabilities increased by EUR 107.2 million from EUR 135.2 million to EUR 242.4 million and thus amounted to around 29.4 % (2012: 19.5 %) of total assets.
The increase in current liabilities can be attributed mainly to the EUR 74.1 million increase in current loans payable from EUR 51.0 million to EUR 125.1 million. Analogous to the decline in non-cur-rent loan liabilities, this increase resulted mainly from premature principal payments on the syndicated credit line in the amount of a partial payment of EUR 101.4 million, which was already taken into consideration when the maturities were presented as at 31 December 2013.
Furthermore, due to the introduction of reverse factoring and optimisation of working capital management, trade liabilities in-creased by 56.7 % compared to the previous year to EUR 59.0 million.
Costs of capital No corporate debt rating has been assigned. The implicit invest-ment grade contained in the conditions of the promissory note loan is BBB. We currently expect no significant change in the foreign capital cost rate.
Accounting treatment of carrying amounts As a rule, we recognise the carrying amounts of assets and lia-bilities at amortised cost. Derivative financial instruments and available-for-sale financial assets are measured at fair value. Cash and cash equivalents are reported at nominal value. Notes, p. 122.
Off-balance sheet financial instruments NORMA Group relies on rental agreements (so-called operating leasing) for its financing, but only to a very limited extent. These

NORMA Group SE Annual Report 201374
are not reflected in the consolidated financial statements. There were no other major off-balance sheet financial instruments during the reporting period January to December 2013.
Unrecognised intangible assets NORMA Group’s rights to the brands it owns are recognised in the balance sheet as intangible assets together with its patents. However, the reputation of these brands and how well known they are among our customers also play an important role in our success, as does consumer confidence in our products and solutions. Well-established customer relationships are equally important to us. These are also supported by our distribution network built up over many years. Worldmap.
The know-how and experience of our employees also play an important part in the success of the Company. We also regard our many years of research and development expertise and proj-ect management know-how as competitive advantages for NORMA Group. These values are not recognised on the balance sheet. Non-Financial Indicators, p. 78 onwards.
Financial ManagementStrategic financing measures The original financing volume at the time of the IPO in 2011 amounted to EUR 375 million. This includes an amortising struc-ture. As at 31 December 2013, the credit amount was EUR 200.5 million with an interest margin of under 1.75 basis points above the 3-month-EURIBOR. This contains a revolving credit valued at EUR 125 million that was drawn down by EUR 5.5 million by the end of 2013. The credit line was intentionally converted over to the fixed rate positions using derivative instruments to ensure that no interest rate change risk exists before the term ends. Only
the short-term revolving credit line for working capital or to finance acquisitions includes an interest rate change risk due to the fact that this has not been hedged by using derivatives.
The entire syndicated loan was initially issued solely on a variable euro basis. To accommodate our Group’s local cash flows, most of the credit amount was paid out in our three main currencies, the US dollar, the Swedish krona and the British pound, back in 2011 and hedged by derivative structures. This enabled us to minimise currency and interest rate change risks. The changes in value of the instruments chosen are recorded directly in the equity position as part of hedge accounting. Partial tranches will possibly be repaid to some extent in 2014 or 2015 by using promissory note funds.
Most of the supply and service relationships between individual currencies are simultaneously hedged over the course of the year. To minimise risks, we strive to achieve broad diversification of our financing instruments over the medium term. These also include prolongation of repayment obligations and an even distribution of the maturity profile.
The issuance of a promissory note loan in the amount of EUR 125 million with a 5, 7, and 10-year term for the first time ever represented an important step towards this. This new instrument contributes about one-third to our financing mix. The strong in-terest from the institutions that issued this loan resulted in high oversubscription and therefore also an attractive credit margin. Due to the strong condition of the foreign capital markets when the promissory note loan was issued, we were able to achieve an average interest rate (EURIBOR + margin) of less than 3.0 percent. With EUR 21 million, we managed to place a significant share in the 10-year tranche. As with our syndicated loan, all
ASSETS AND LIABILITIES STRUCTURE
in EUR millions
2013 2013
2012 2012
Assets Liabilities
824 824
692 692
451 320
446 289
179 262
174 267
194 242
72 135
Non-current assets
Equity Current assets
Non-current liabilities
Cash and cash equivalents
Current liabilities

75Consolidated Management Report
Economic Report
tranches were either hedged to begin with or hedged using de-rivative structures as fixed interest payment positions to limit the risk of a change in interest rates. These funds are used to finance general operations and will be partly used to repay existing loans in 2014 or 2015 with a term until 30 March 2016. We therefore managed to achieve a significant extension of the term and an even repayment profile for half of the original credit tranche of EUR 250 million from this financing. The operating credit line in the amount of EUR 125 million which has hardly been used will remain in effect until 2016. The average interest rate of the prom-issory note loan of 3.0 percent corresponds to the market assess ment of an ‘Investment Grade’ for NORMA Group.
As at 31 December 2013, we complied with all of the indicators contained in the loan contracts (financial covenant: equity ratio, interest ratio, financial debt ratio, change of control). The securi-ties that had originally been provided in 2011 to receive the loan have been released. Notes, p. 100.
Further concrete financing steps will depend on the current changes in the financing markets and acquisition potentials. We also always take risks from changes in exchange rates that are limited by using derivative structures into consideration.
Development of cash flow Significant increase in operating net cash flowWe achieved operating net cash flow of EUR 103.9 million in 2013. This was 28.2 % higher than last year’s level of EUR 81.0 million. The increase in operating net cash flow reflects the good position our business is in and is mainly attributable to the increase in operating results (EBITDA). In relation to total sales, net cash flow rose by 16.3 % in financial year 2013 (2012: 13.4 %).
Higher cash flow from operating activities We generated a cash flow of EUR 115.4 million from operating activities in 2013. This corresponds to an increase of around EUR 19.2 million or roughly 20.0 % compared to the previous year (2012: EUR 96.1 million).
This increase was due for the most part to the repayment of trade and other liabilities which are also impacted by the effect of re-serve factoring discussed earlier.
Cash flow from investing activities In 2013, cash outflow from investing activities amounted to EUR 43.4 million (2012: EUR 58.1 million).
The difference to the previous year is mainly due to a reduction in the net payments for acquisitions of EUR 29.0 million by 54.4 % to EUR 13.2 million. Expenditures for property, plant and equip-ment (EUR 21.3 million) were slightly lower than last year (2012: EUR 23.9 million), while intangible assets amounting to EUR 6.1 million rose slightly to EUR 9.3 million.
Capital expenditures in 2013 related in particular to projects aimed at expanding our manufacturing capacities in the United Kingdom, Serbia, Mexico, the USA, China and Brazil. Organi-sational and Process Advantages, p. 78.
Capital expenditure on property, plant and equipment and in-tangible assets came in at 4.8 %. Based on the long-term growth trend, we also aim to invest in expansion and maintenance in the medium-term at a rate of about 4.5 % of sales on an annual basis.
Cash flow from financing activities impacted by the promissory noteIn 2013, cash outflow from financing activities amounted to EUR 51.7 million, whereas it was EUR 34.1 million in 2012. This re sulted mainly from the payments received in conjunction with the prom-issory note issued in mid-2013. Cash flow pertained for the most part to the payment of dividends to shareholders in the amount of EUR 20.7 million (2012: 19.1 million), as well as principal pay-ments on loans in the amount of EUR 47.1 million (2012: EUR 23.2 million). Notes, p. 117.
Investment analysis We invest the funds from operating cash flow in our growth. Last year, we further expanded the plant we founded in Serbia in 2011. In Asia, our internal and external growth was strengthened by building new production sites and making strategic acquisitions. By acquiring the distribution business of Variant S.A. in Poland, we shorten the supply process to our customers by one level and therefore have now moved closer to our end customers. By ac-quiring the distribution business of Davydick and Guyco in Aus-tralia, we have added new products and new sales partners and further extended our presence on the continent. Furthermore, we strengthened our position in the water and wastewater mar-ket in the Asian region. By acquiring part of Click Automotiva Industrial and setting up a production site in Brazil, we were able to strengthen our market position in South America. Moreover, we invested in automating and optimising our existing plants all over the world. Organisational and Process Advantages, p. 78.
Capital expenditures that have not yet been realised for which contractual obligations exist as at 31 December 2013 amount to EUR 1.4 million. These pertained mainly to investments in fixed assets in Germany (kEUR 893), China (kEUR 531) and Poland (kEUR 19).
Summary on financial position Last year, we managed to improve our financial position even further thanks to solid results, continued strong cash flow and by successfully issuing a promissory note. Our equity ratio reached 38.8 % in 2013 and remains at a high level. We succeed-ed in achieving this despite issuing a promissory note in the

NORMA Group SE Annual Report 201376
amount of EUR 125 million, acquiring additional companies and paying out a dividend of EUR 0.65 per share for financial year 2012. Our current financing offers a sound foundation for our medium term growth strategy.
SEGMENT REPORTING
By developing new markets and customers, we increased the share of sales realised internationally even further from 67.4 % to 70.4 % in the financial year just ended, thereby continuing our strategy of internationalisation.
EMEA
Solid development of sales in the EMEA regionDespite a decline in the volumes in some industries during the first quarter of 2013, the EMEA region developed positively for the year overall. Whereas the first quarter was relatively slow due to the economic conditions and only yielded growth due to the acquisitions, the improved economic conditions resulted in a moderate improvement in the second quarter and significant organic growth in sales starting in the third quarter. This devel-opment was complemented by the new ramp-ups due to the EURO-6 emissions standard. With respect to the entire year, we achieved solid growth in sales of 5.6 %. This equates to an in-crease in external sales of around 20 million from EUR 367.5 million in 2012 to EUR 387.9 million. Besides the growth of 3.4 % from acquisitions, we experienced solid organic growth of 2.9 % on the challenging European market. The share of the EMEA region in relation to total sales remained at 61 %, the same level as last year.
Positive EBITDA growthAdjusted EBITDA increased by 5.8 % from EUR 79.3 million in 2012 to EUR 83.9 million in 2013. At 21.6 %, the EBITDA margin remained at the same level as last year, and this despite a decline in volume and the investments in new products for the new EURO-6 engine generation.
Assets increased due to the acquisition of Variant, on the one hand, and the increase in trade payables from EUR 457.4 million as at 31 December 2012 to EUR 490.3 million as at 31 December 2013.
Investments amounted to EUR 13.1 million and were thus 13.8 % lower than in 2012 (EUR 15.2 million). These funds were mainly invested in production facilities to increase our capacities at the German sites, but also in Serbia and the United Kingdom.
The AmericasNegative impact of currency developmentThe Americas segment generated EUR 191.6 million in sales in 2013, which were slightly lower than last year’s level of EUR 193.3 million. The positive currency development that drove sales growth last year turned in the opposite direction in 2013 and had a negative impact on sales denominated in the euro. For the year 2013 as a whole, we recorded a 0.9 % decline in sales. This means that the organic growth of 2.4 % for the year was over-shadowed by negative currency effects of – 3.3 %. This region’s share of sales in relation to total sales declined to 30 % in 2013 (2012: 32 %).
DEVELOPMENT OF THE SEGMENTS
EMEA Americas Asia-Pacific
in EUR millions
2013 2012 2) Change
2013 2012 2) Change
2013 2012 2) Change
External sales 387.9 367.5 + 5.6 % 191.6 193.3 – 0.9 % 56.0 43.7 + 28.1 %
Contribution to consolidated sales 61 % 61 % 30 % 32 % 9 % 7 %
Adjusted EBITDA 1) 83.9 79.3 + 5.8 % 45.2 43.0 + 5.2 % 6.5 5.2 + 25.0 %
1) The adjustments relate to adjustments within the individual segments. At Group level no adjustments were made in the EBITDA.2) Restated due to effects of IAS 19R.

77Consolidated Management Report
Economic Report
Over the course of the year, we were able to achieve a sequential improvement in sales growth. While the first and second quarter (Q1: – 7.0 %, Q2: – 5.8 %) remained relatively weak due to the economy and currency effects, the situation improved consider-ably in line with the gradual recovery of the US economy towards the end of the year. In the fourth quarter, we achieved organic growth compared to the previous year’s period of 16.8 % due to the strong improvement in the economic situation.
Adjusted EBITDA amounted to EUR 45.2 million in 2013 and was thus 5.2 % higher than the previous year’s level of EUR 43.0 million. The EBITDA margin improved from 22.2 % to 23.6 % com-pared to last year. Among other things, this is due to the reduc-tion of our cost base as a result of measures from our Global Excellence Programme.
Assets (EUR 210 million) hardly changed at all compared to last year (2012: EUR 209.9 million). Adjusted for currency effects, however, they increased by EUR 9.6 million also due to the ac-quisition of assets of Click Automotiva Industrial Ltda. that rep-resent a portion of production.
Investments were EUR 7.3 million or 9.5 % higher than last year’s level of EUR 6.7 million. The main focuses of investments included the production facilities at our plants in Auburn Hills and St. Clair.
Asia-Pacific Dynamic sales growthThe Asia-Pacific region continues to be of paramount importance to the future growth of NORMA Group. Higher incomes and a better standard of living in the emerging Asian economies results in higher demand for high-quality products in all areas of life.
We generated sales of EUR 56.0 million in the Asia-Pacific region in 2013 and thus exceeded last year’s level by 28.1 % (2012: EUR 43.8 million). This growth was driven mainly by acquisitions. Ad-justed for acquisitions, sales amounted to EUR 41.9 million in 2013. The Asia-Pacific region accounted for a 9 % share of sales in 2013, which was two percentage points higher than the share in 2012.
Adjusted EBITDA rose by 25 % from EUR 5.2 million in 2012 to EUR 6.5 million. The EBITDA margin was 11.6% and thus slightly lower than the ratio of 11.8 % the previous year. This can be at-tributed to expansion of sites and merger and acquisition activ-ities, among other factors.
Assets rose from EUR 51.2 million to EUR 61.9 million and thus by 20.8 % in 2013. This can be attributed partly to acquisitions, but for the most part resulted from the operating business.
Investments in 2013 were made mainly to expand our second site in China and in urea manufacturing at our existing Chinese site in Qingdao. Investments amounted to EUR 6.7 million in 2013 and thus rose by 16.8 % compared to the previous year (2012: EUR 5.8 million).
BREAKDOWN OF SALES BY SEGMENT
in % 2012 in brackets
61 (61) EMEA
30 (32) Americas
Asia-Pacific 9 (7)
NORMA Group SE Annual Report 201378
Central management of financingDue to the fact that financing as a whole is controlled centrally, we forgo publishing a separate list of financing by segments. We strive to achieve an investment ratio and cash generation in every segment that is in line with the Group average in the medium-term.
ORGANISATIONAL AND PROCESS ADVANTAGES
Production and LogisticsNORMA Group manufactures approximately 30,000 different products at 21 sites all over the world. Furthermore, we operate distribution, sales and competence centres in 27 countries that supply our customers in the respective regions. Our largest man-ufacturing site is based in Maintal near Frankfurt/Main, Germany.
Worldmap.
Our product categories ( Business Model, p. 52) involve differ-ent materials, production processes, technical expertise and sterility requirements. Because of how few synergies there are between these production processes, we try to keep the product categories separate when it comes to producing them.
We have implemented this approach quite strictly in Europe and the USA. In emerging economies in which we only have one plant, however, both product categories are manufactured at a single site.
Constantly improving manufacturing structures and processesAs part of our Global Excellence Programme that we introduced in 2009, we constantly analyse and identify potential for optimi-sation in all areas and implement the appropriate measures aimed at realising these. We already completed comprehensive optimi-sation of our manufacturing structure in Europe in 2010. As part of our optimisation efforts, we have bundled high-volume auto-mated and essentially standardized production processes at specific high-tech manufacturing lines. This has allowed us to take advantage of considerable economies of scale. Production processes that require a higher degree of manual assembly work are based mainly in low-wage countries.
Manufacturing close to our customers and high reliability of delivery In order to optimise our production and logistics costs, we always strive to manufacture in the regions our customers are based in. This enables us to reduce our working capital and production costs, but also to minimise delivery risks and thus be able to respond quickly and flexibly to fluctuations in demand.
We constantly strive to shorten our delivery times, optimise our supply chain and freight and customs costs, but also to minimise negative effects on the environment. For this purpose, we put a central warehouse into operation in Moscow, Russia, and Auburn Hills, USA, over the last two years. This has enabled us to process customer orders directly at the warehouse in less than a week and significantly reduce the previous delivery times.
Furthermore, we sign annual agreements with those freight and logistics service providers who promise to deliver us the best possible results with respect to costs and environmentally rele-vant aspects.
Flexible expansion of capacitiesThe capacity utilisation of our manufacturing and storage facilities varies from site to site. In order to have sufficient capacity available at all times, we plan our investments proactively: In emerging countries, where we already have a manufacturing site, we see to it that sufficient production space to be able to expand pro-duction capacity successively when needed is available from the very start. In industrial nations, on the other hand, we strive to prevent having to invest in additional manufacturing space when-ever possible. Instead, we try to make our manufacturing pro-cesses as lean as possible in order to be able to use the existing space to create additional capacity.
Capacity utilization also varies from site to site. Most of the prod-ucts in the area of EJT are customer- and application-specific. For this reason, the facilities and tools we use to manufacture these products are also usually quite specific. Our investments in new operating equipment are therefore made relatively pro-portionate to prototype development, type testing and the be-ginning of manufacturing at our customers’ sites.
In contrast to the area of EJT, we rely on standardised products and production equipment in the area of DS. This means that we can extend our capacities quickly and easily in case of increasing customers’ demands.
Investments and acquisitions in 2013As part of our company’s strategy, we rely not only on organic growth, but also on growth through key acquisitions. Corporate Goals and Strategies, p. 58. We constantly optimise and further de velop our production sites in order to be able to integrate new acquisitions as effectively as possible and ensure the efficiency of our production structures.
Apart from the acquisitions, the following investments toward expanding our capacities were made in 2013:

79Consolidated Management Report
Economic Report
Newbury, United Kingdom
Capacity extension of our plant in Newbury and ex-pansion of production space by 1,850 m² as a reaction to strong growth in demand for our VPP clamps from our European customers
Serbia Expansion of extrusion capacities in order to prepare for the market introduction of second-generation fluid systems at our European OEMs
Riese Pio X, Italy
Acquisition of Nordic Metalblok to create additional capacity and contribute to further consolidation of the European metal-based clamp market
Moscow, Russia
Establishment of distribution platform in Moscow in order to improve customer service
Juarez, Mexico
Capacity increase for our roll-forming equipment
Monterrey, Mexico
Expansion of existing production line in order to keep up with growing demand for products in the area of Selective Catalytic Reduction (SCR) in the North American market.
Implementation of standard ERP-system in order to improve efficiency of managing supply chains, financial processes and customer service.
St. Clair, Michigan, USA
Implementation of an automated assembly system and expansion of plastic injection moulding capacities.
Changzhou, China
Establishment of a second plant in China (10,800 m²) for production of metal-based joining products for Chinese, Japanese and Western OEMs.
Pune, India Start of operation of a production facility in Pune.
Quality ManagementOur products are often critical to the ability of our customers’ end products to function properly. It is therefore extremely important for us to ensure that we deliver outstanding quality. In order to be able to offer our customers around the world the same high quality, we observe the quality standards ISO 9001, TS 16949 and ISO 14001 throughout the entire Group. Even our plants that have been in existence for quite some time have all been certified based on these standards. Certification of plants that were built more recently or acquired is also planned. Two sites that supply to the aviation industry have also been certified in accordance with EN 9100, and various product categories have been ap-proved especially for the shipping and construction industry. Furthermore, regional standards are also taken into consideration. In addition, the same consistent production processes are used at all NORMA Group sites. This know-how is shared and com-municated inside the Group through close collaboration between the various sites and gradual implementation of new quality man-agement (CAQ) software.
Quality management at NORMA Group is based on an inte grated, holistic approach that already starts with advanced planning of quality and includes the entire process.
In 2013, we managed to reduce the number of returned parts per million (PPM) to 24 (2012: 34). The number of quality-related complaints per month could be reduced to an average of 9 (2012: 10.2).
Innovative methods of process optimisationNORMA Group relies on many different proven methods to ana-lyse processes, identify defects early and ultimately achieve systematic process improvements. These include statistical pro-cess regulation, kaizen, the 5S methodology on optimisation of workplaces, the Six Sigma method for analysing and eliminating defects in development and manufacturing, but also the daily Gemba Walk through the production halls that was introduced in June 2013. With the latter, individual processes are inspected by an interdisciplinary team in the opposite order of the workflow. Data on current and targeted performance, unplanned down-time, accidents at work, the order situation, backlogs and qual-ity defects is collected by the employees at each site and then analysed. The goal is to identify potential for improvements at every station and implement the appropriate measures quickly. The Gemba Walk has already brought significant improvements to the processes, a reduction in delivery backlogs, for example.
Customers reward NORMA quality The many awards that we have received from our customers in recent years clearly show that they are pleased with the quality of our products:
April 2013: Awarded with ‘Best Technology Innovation’ price by China’s automotive B2B marketplace Gasgoo International
August 2013: Receipt of the ‘50 PPM Award’ from American car manufacturer Paccar Inc.
October 2013: Receipt of the ‘Ford Q1 Award’ for our plant in Monterrey, Mexico
October 2013: Receipt of the ‘Ford Q1 Award’ for our plant in Monterrey, Mexico
January 2014: Receipt of the ‘Best Partner Award’ by General Motors Shanghai
February 2014: Receipt of the ‘Captain Misa Anastasijevic Award’ in Serbia
March 2014: Certified ‘A-class supplier’ by FAW-Volkswagen Automobile, China

NORMA Group SE Annual Report 201380
MATERIAL PURCHASES IN 2013
in %
19 Steel, wire
7 Rubber moulded parts7 Granules
20 Metal components
Plastic parts 8
Production mate- 4 rials (various)
Electronic components 1
Indirect materials 25 (MRO, DS, various)
Alloy surcharges 9
STRUCTURAL ANALYSIS OF SUPPLIERS IN 2013
in % Top 10 Top 50 Top 100
100
80
60
40
20
0
81
Share of suppliers in the purchasing volume
65
32
21,000
20,000
19,000
18,000
17,000
16,000
15,000
14,000
13,000Q1 2012 Q2 2012 Q3 2012 Q4 2012 Q1 2013 Q2 2013 Q3 2013 Q4 2013
DEVELOPMENT OF NICKEL COMMODITY PRICES FROM 2012 TO 2013
in USD / Metric ton Source: Dow Jones
18,000
16,000
14,000
12,000
10,000
8,000
1,600
1,500
1,400
1,300
1,200
1,100
1,000Q1 2012 Q2 2012 Q3 2012 Q4 2012 Q1 2013 Q2 2013 Q3 2013 Q4 2013
DEVELOPMENT OF NICKEL COMMODITY PRICES AND THE ALLOY SURCHARGE 1.4301 FROM 2012 TO 2013
Alloy surcharge of flat products 1.4301 X5CrNi18-10 Europe (Outokumpu) cash in EUR (left scale) Source: Dow Jones Nickel on the LME 3 months in EUR (right scale)

81Consolidated Management Report
Economic Report
Export controlsDue to the many cross-border deliveries, effective and reliable customs processes are extremely important to us. We participate in various customs and trade partnership programs in order to ensure that our supply chains are stable and reliable. Our German plants have held the permit to act as an Authorised Economic Operator – Customs Simplifications (AEO-C) already since 2010 / 2011. In March 2013, our plant in the Czech Republic suc-cessfully received a certificate. Since September 2013, following a scheduled evaluation by a US customs authority, our plant in Michigan, USA, has been a member of the “Customs and Trade Partnership against Terrorism” (C-TPAT).
In 2010, we implemented an export control programme in order to ensure that our supply chain fully meets the legal requirements. We conduct reviews of all business partners at least once a year in order to rule out that we supply legally sanctioned third parties.
PURCHASING AND SUPPLIER MANAGEMENT
Material costs represent the highest cost position for a manufac-turing company like NORMA Group next to personnel costs. Because they significantly affect NORMA Group’s profits, pur-chasing and supplier management both play a decisive role in the success of the Group.
Proactive management of direct and indirect material costs and services is the most important task for the purchasing depart-ment. These pertain mainly to the direct material areas of steels (strip steels of various grades), stainless steels, wires, technical thermoplastics, polyamides, granules, plastics, rubber and met-al components, but also electronic components. Due to the fact that these commodities are subject to price changes, it is up to purchasing to lower these price risks by employing systematic material and supplier risk management. For this reason, we have developed a high-performance global Group purchasing struc-ture in order to leverage economies of scale within the Group in purchasing the most important product areas and acquiring these as competitively as possible.
Furthermore, we always strive to ensure permanently competitive purchasing prices by constantly optimising our selection of sup-pliers and by employing the BLC (Best-landed-cost) approach. We also protect ourselves from the volatility of raw material prices by signing purchasing contracts with terms of up to 12 months and longer.
Relatively stable commodity prices The market prices for steel-related materials remained relatively stable on average in 2013. Alloy surcharges for stainless steel, on the other hand, declined compared to 2012 and remained at a relatively low level compared to previous years. This was due mainly to declining nickel prices.
In the area of granules, the supplier situation normalised consid-erably again in 2013 following the accident with serious conse-quences that took place at one of our preliminary material sup-pliers’ sites in 2012 and the resulting global shortage of supply of polyamide 12. Due to the fact that the situation returned to normal in the area of high-performance polyamides and com-modity prices (butadiene, for example) declined to some extent, we managed to negotiate better purchasing agreements for the Group in 2013.
Global structure and regional expertisePurchasing of commodities and materials at NORMA Group is managed by a global commodity structure for all domestic and foreign Group companies. Here, regional teams contribute their unique expertise with respect to local market conditions and cost drivers that are typical for a region. This structure that was es-tablished for the EMEA region back in 2012 has made a significant contribution to continuously improving the cost of materials ratio and ensuring that our purchasing management remains com-petitive.
In 2013 regional purchasing structure in consultation of material group volumes within one regional commodity-responsibility and global commodity direction could be established successfully in the Americas.
Supplier structureOur total production materials turnover amounts to roughly EUR 180 million. Our top 10 suppliers account for roughly 32 percent, while our top 50 suppliers account for nearly 65 percent of the total volume.
Support for organic growth through purchasing programmesCommodity strategies and a supplier panel that is clearly defined based on product categories represent an important foundation for the newly established Programme Purchasing in our EJT Flu-id business. Thanks to decentralised programme purchasing in the area of Fluid directed at lean central coordination, we are able to support our organic growth plans in a much more focussed
NORMA Group SE Annual Report 201382
manner and more efficiently through purchasing. Furthermore, a project purchasing database not only enables better purchasing management, but also allocation of new material orders con-formed to the commodity strategy.
We also established new structures in purchasing last year in the area of non-production materials & services. Our goal is to achieve a higher degree of professionalism and gradually conclude more long-term, competitive contracts by coming up with a good com-bination of global and regional purchasing management.
MARKETING
NORMA Group has continued to grow in recent years. In order to further increase awareness of our products all over the world, increase product sales and intensify our customer relationships, we employ many different marketing instruments that suit our individual target audiences.
We coordinate our marketing activities either centrally, region ally, or locally, depending on the type of activity and objectives. By having Group marketing teams work closely with regional and local organisational units, we ensure that local marketing con-ditions and consumer preferences are taken into account in the various regions and markets. The Group marketing team’s re-sponsibilities include planning and defining strategic goals, develop ing our brand strategy and corporate identity, but also defining the framework conditions for all marketing activities. The regional marketing units are responsible for executing the various activities and synchronising them with the operative objectives of NORMA Group. All trade marketing activities are managed at the regional level and executed locally.
Our marketing expenditures amounted to EUR 2.87 million in 2013 (2012: EUR 2.15 million). Around 20 % of this spending was put toward general marketing activities, 63 % was invested in brand-related communication, and approximately 17 % on product-related communication. Roughly 45 % of our marketing expenditures can be attributed to the EMEA region, 30 % to the Americas, and 25 % to the APAC region.
We plan to continue intensifying our marketing activities in 2014, particularly in the APAC region and the Americas. As a result, total expenditures on marketing will be higher in these segments this year. Nevertheless, we expect to be able to lower our overall marketing expenses in the EMEA region due to new organisa-tional structures in the area of marketing and the increased effective ness and higher capacities associated with these. Gen-erally speaking, we intend to optimise our cost structure by es-tablishing new structures and introducing new instruments and processes in 2014. For this reason, 2014 spending should remain at roughly the same level as in 2013 despite the higher level of marketing activity.
Annual customer survey aimed at further improving customer satisfactionBeing able to understand what our customers expect of us and our products is of immense importance to our Company. For this reason, our global marketing team conducts an annual study on customer satisfaction every year, the Customer Satisfaction Sur-vey (CSS). This is actually a detailed survey with which we seek to gain new insights on our customers’ expectations and how they feel about our performance. Furthermore, we also analyse the various levels of expectation of different groups of customers
OUR BRANDS

83Consolidated Management Report
Economic Report
and measure customer satisfaction over an extended period of time, also compared with our fellow market participants. We then leverage the potential for improvement that we discover to pro-duce an activity plan that helps us to systematically execute and monitor the respective optimisation processes. This plan contains specific goals which the respective employees are expected to achieve within a certain period of time. Management oversees this process on an ongoing basis.
More than 600 customers took part in this survey last year and assessed the following categories: sales, products, product train-ing, packaging and labelling, logistics, technology and engineer-ing, quality, customer service and the NORMA Group website.
We proceeded to develop a catalogue of activities based on the potential for improvement that the survey exposed. Of the 81 measures formulated in total, 26 had already been completed by the end of 2013. We will gradually begin executing the remaining measures starting in 2014. In the EMEA region, for example, we are planning to intensify and expand our contact to customers by holding Innovation Day events on-site. In the Asia-Pacific re-gion, the main focus of marketing activities and measures that contribute to sales will be on product training courses. Here, our goal is to be able to prepare offers for our customers more quick-ly in the future. In the Americas region, we will also be looking to react more quickly when it comes to producing technical draw-ings and prototypes, for example.
We measure the results of our efforts with the help of the cus-tomer satisfaction index and the so-called Net Promoter Score (NPS) – a further indicator that directly measures customer satis-faction and indirectly their willingness to recommend us to other companies.
Newly established marketing activitiesIn 2013, we organised our first ‘Tech Day’, a marketing event aimed at introducing new product developments directly at our customers’ sites and thus strengthening our customer relation-ships. The first Tech Day took place at the corporate headquarters of one of our Swedish customers. Other events of this kind were also held and all were considered to be extremely successful.
We are currently working on developing a global brand strategy for the DS area that will address the changing market more di-rectly.
Attendance of 43 exhibitions all over the worldMaintaining a presence at trade fairs and industrial exhibitions also represents an important component of our marketing strat-egy. It is here that we unveil the new products in our product portfolio and have the opportunity to speak directly with both existing and potential customers.
In 2013, we attended 43 exhibitions all over the world (previous year: 17) with our own trade fair booth and introduced our prod-ucts and joining solutions for the many different industries we serve. Our presence in the Asia-Pacific growth region deserves special mention in this respect. We participated in 13 exhibitions, which among others included the ACMA Automechanika in India and the Water Expo in China.
Social Media In order to increase public awareness of NORMA Group and to provide a further platform for interaction to our customers, part-ners and employees, we expanded our online activities in the
MARKETING EXPENDITURES BY ACTIVITY
in %
20 All marketing activities
63 Brand communication
Product communication 17
MARKETING EXPENDITURES BY SEGMENT
in %
45 EMEA
Americas 30
Asia-Pacific 25
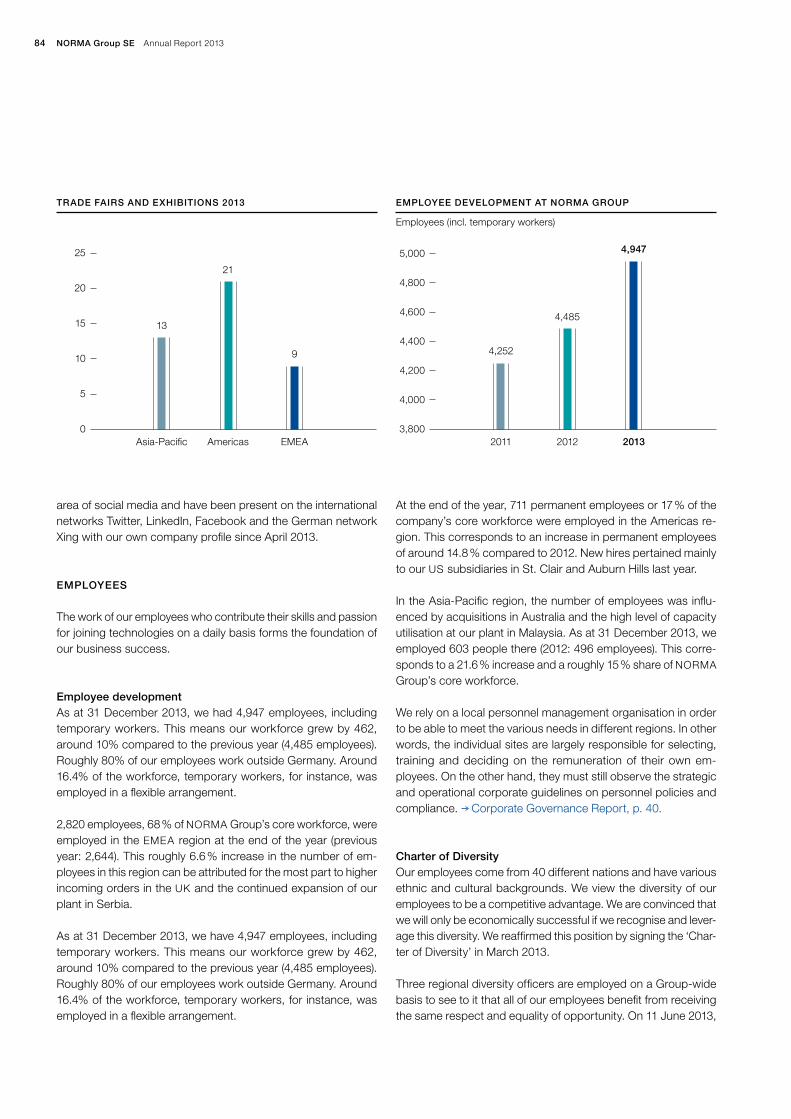
NORMA Group SE Annual Report 201384
area of social media and have been present on the international networks Twitter, LinkedIn, Facebook and the German network Xing with our own company profile since April 2013.
EMPLOYEES
The work of our employees who contribute their skills and passion for joining technologies on a daily basis forms the foundation of our business success.
Employee developmentAs at 31 December 2013, we had 4,947 employees, including temporary workers. This means our workforce grew by 462, around 10% compared to the previous year (4,485 employees). Roughly 80% of our employees work outside Germany. Around 16.4% of the workforce, temporary workers, for instance, was employed in a flexible arrangement.
2,820 employees, 68 % of NORMA Group’s core workforce, were employed in the EMEA region at the end of the year (previous year: 2,644). This roughly 6.6 % increase in the number of em-ployees in this region can be attributed for the most part to higher incoming orders in the UK and the continued expansion of our plant in Serbia.
As at 31 December 2013, we have 4,947 employees, including temporary workers. This means our workforce grew by 462, around 10% compared to the previous year (4,485 employees). Roughly 80% of our employees work outside Germany. Around 16.4% of the workforce, temporary workers, for instance, was employed in a flexible arrangement.
At the end of the year, 711 permanent employees or 17 % of the company’s core workforce were employed in the Americas re-gion. This corresponds to an increase in permanent employees of around 14.8 % compared to 2012. New hires pertained mainly to our US subsidiaries in St. Clair and Auburn Hills last year.
In the Asia-Pacific region, the number of employees was influ-enced by acquisitions in Australia and the high level of capacity utilisation at our plant in Malaysia. As at 31 December 2013, we employed 603 people there (2012: 496 employees). This corre-sponds to a 21.6 % increase and a roughly 15 % share of NORMA Group’s core workforce.
We rely on a local personnel management organisation in order to be able to meet the various needs in different regions. In other words, the individual sites are largely responsible for selecting, training and deciding on the remuneration of their own em-ployees. On the other hand, they must still observe the strategic and operational corporate guidelines on personnel policies and compliance. Corporate Governance Report, p. 40.
Charter of DiversityOur employees come from 40 different nations and have various ethnic and cultural backgrounds. We view the diversity of our employees to be a competitive advantage. We are convinced that we will only be economically successful if we recognise and lever-age this diversity. We reaffirmed this position by signing the ‘Char-ter of Diversity’ in March 2013.
Three regional diversity officers are employed on a Group-wide basis to see to it that all of our employees benefit from receiving the same respect and equality of opportunity. On 11 June 2013,
TRADE FAIRS AND EXHIBITIONS 2013
25
20
15
10
5
0
9
Asia-Pacific Americas EMEA
21
13
EMPLOYEE DEVELOPMENT AT NORMA GROUP
Employees (incl. temporary workers)
5,000
4,800
4,600
4,400
4,200
4,000
3,800
4,947
2011 2012 2013
4,485
4,252

85Consolidated Management Report
Economic Report
we participated in the 1st German Diversity Day that the club Charta of Diversity e. V. issued a nationwide invitation to. The second Diversity Day will be held on 3 June 2014.
More female expertiseAs a consequence of our diversity strategy, we intend to increase the share of female employees in management positions. Roughly 35 % of our employees are currently females. In 2013, a Super visory Board mandate was issued to a woman for the first time ever.
Inclusion of the handicappedAt NORMA Group, we want people who have handicaps to also take part in normal work life. In fact, we currently employ 46 severely handicapped men and women in Germany.
Integration through cooperationFor us, fostering diversity also means seeing to it that all parties are able to get along well in their immediate environment. People from 25 different countries work at our headquarters in Maintal alone. We cooperate with the non-profit FAB gGmbH in order to also support effective integration outside the workplace, for ex-ample. This organisation gives the foreign employees of our site in Maintal the opportunity to participate in the German courses that are held by educational institutions at no charge.
Managing performance – Rewarding performance Our goal is to attract and retain qualified and committed em-ployees. For this reason, we place particular importance on fair remuneration and profit-sharing, but also on how we handle tem-porary employment. By offering variable remuneration systems, we strive to encourage our employees to take an interest in our success and the further development of the company. By hold-ing regular benchmarks, we ensure that our employees are paid market-oriented salaries and wages based on their performance and responsibilities, regardless of their gender. Furthermore, we ensure that all of the remuneration and social contributions paid satisfy at least the local statutory standards.
Rewarding and motivatingParticipation in our success is an important element of our re-muneration system. Our results are largely dependent on the contributions and motivation of our employees. For this reason, we consider allowing them to participate in our Company’s profit to be a logical consequence. This participation can be considered recognition and appreciation of our employees’ achievements and, at the same time, as an incentive to achieve even better results in the future.
Responsibility for temporary employeesTemporary employment of workers allows us to compensate for temporary peaks in production and economic cycles in a flexible manner. Furthermore, it enables us to work on special projects or to fill-in for employees. Temporary employment thus contrib-utes to our operational results. For this reason, it is important to us not to achieve this success at the expense of temporary em-ployees. Therefore, NORMA Group reached an agreement with the German Group Works Council in October 2012 that requires that temporary employees be offered permanent employment
EMPLOYEES BY REGIONS 2013 (CORE WORKFORCE)
in %
68 EMEA
17 Americas
Asia-Pacific 15
NEW HIRES OF FEMALE EMPLOYEES IN 2013
in %
32 EMEA
31 Americas
Asia-Pacific 35
AGE STRUCTURE 1)
< 30 years 30 – 50 years > 50 years
Average
17.64 % 61.40 % 20.96 % 35.75 years
1) 3,650 employees counted (88 % of permanent staff) in total. For legal reasons,
reporting on employees’ ages is not possible for all Group companies.

NORMA Group SE Annual Report 201386
as soon as they have worked for the Company for more than 15 months. Temporary employees already receive the same base salary as our core workforce after six months. In contrast to this, the collective bargaining provisions of the IG Metall in Germany require permanent employment after two years and salaries are adjusted in four steps after nine months at the earliest.
Low fluctuation reflects employee satisfactionOur employees are extremely motivated and work hard for the Company and to ensure its success. The low number of em-ployees who voluntarily leave the Company clearly confirms that this is the case. The share in Germany was only 1 % and 6 % on a Group-wide basis (excluding China and Mexico). This high com-mitment to NORMA Group can also be seen in the low absence rate of only 4 % Group-wide. 27 % of our workforce also looks back on having worked for the Company for over ten years – a rather high number considering the new plants that have been built and the acquisitions made in recent years. The average total length of service is currently around 8 years.
Knowledge as a resource – Talent drives performanceBy investing to further improve the qualifications and edu cational backgrounds of our skilled employees, NORMA Group is also investing in the future of the Company and society. We are an international market and technology leader in the area of engi-neered joining technology. In order to reinforce and expand our position, we need qualified and well-trained employees. For this reason, we consider further education and training of our staff to be not only part of our social responsibility, but also an important contribution to the future development of our business. Our goal is to recruit as many of our expert employees from our own youth as possible. For this reason, training our young people represents an elementary component of our personnel policy. Besides this, we also lower our dependence on the external job market and are able to ensure a high level of educational quality.
Focus on technical careers At NORMA Germany, the main focus of training at the site in Maintal is on technical careers. These include electronic techni-cians who work on operational equipment, industrial mechanics, machine and plant operators (metal technology), mechatronics technicians, process mechanics on plastics and rubber technol-ogies, but also toolmakers.
Furthermore, industrial managers and skilled employees for the area of logistics are trained at our two sites in Maintal and Ger-bershausen. In keeping with the global focus of NORMA Group, our training and further education programmes also have an international focus. We offer employees who are just starting their careers study trips, English courses and traineeships at other
national companies in order to prepare them for working in inter-national teams at an early point in time.
Dual studies offer advantages Our company has been giving young men and women the chance to obtain a combination of practical training and university studies since 2006. Theoretical and practical contents are closely co-ordinated with a dual studies program. This makes it easier for them to enter the job world later on because students are already familiar with our Company and the internal operating procedures. They are then able to acquire their Bachelor of Engineering de-grees at the Career Academy in Frankfurt / Offenbach and at the Technical University of Darmstadt in the fields of industrial engi-neering, mechanical engineering and mechatronics or their Bach-elor of Arts degrees in business administration.
In 2013, NORMA Germany employed 39 trainees, three of whom pursued dual studies. 13 career entrants successfully completed their training or studies in 2013. We gave all of these individuals permanent employment.
Nevertheless, education does not come to an end for our em-ployees when they are hired. To ensure that we are able to con-tinue improving our position as a technology and innovation leader in the industry, our workforce must be given the chance to improve its qualifications in all relevant areas. For this reason, each and every person who works for NORMA Group was able to benefit from an average of 28 hours of additional occu pational training in 2013. 97 % of our employees participated in at least one training activity last year.
Targeted search for talent The development of our workforce and technical and manage-rial personnel in particular is of high priority to NORMA Group. So-called talent reviews help us to identify employees with po-tential at all levels of management. We introduced a global talent programme in 2013. 15 extremely promising future managers or so-called high potentials who have already demonstrated their ability to perform well in the past, but also have immense poten-tial to advance in their professional careers, are prepared here for higher management responsibilities. The participants acquire management and conflict solving skills in four modules over a period of three years. At the same time, they train their strategic and entrepreneurial thinking. We also developed special promo-tion programs for employees with development potential who have strong ties to the region.
Furthermore, we offer experienced managers who are nomi nated by the Management Board a modular training programme aimed at further developing their professional and personal development in cooperation with the Frankfurt School of Finance & Manage-

87Consolidated Management Report
Economic Report
ment. These managers are then able to acquire new skills in the areas of strategy, organisation, corporate culture, but also per-sonnel, resource and supply chain management, for example.
All supervisors are required to hold an assessment and qualifi-cation conversation with each individual employee at least once a year in order to be able to evaluate their staff’s performances, specialized knowledge and development potential. During these meetings, the employees’ responsibilities and personal goals for the next year are documented and the need for further training is determined.
Exchanges of personnel: More communication, better understanding NORMA Group will continue to grow internationally in the future, both organically and through acquisitions. In order to be able to integrate new parts of the Group and for the individual sites to work together efficiently, we need functioning communication at all levels. To achieve this, we offer a variety of exchange pro-grammes for our employees, one to three-month so-called ‘bub-ble assignments,’ three to twelve month ‘short term assignments’ and ‘long-term assignments’ with a term of at least one year. Expert personnel and managers who participate in this initiative bring special skills and experience to the new sites and, at the same time, benefit from the know-how that their new colleagues have. Through these projects, we promote the internal transfer of know-ledge, intercultural awareness, the establishment of net-works and the individual development of the participants. This exchange is not limited to technical and management personnel. Job entrants are also given the chance to take part in traineeships at other national companies while they are being trained and are thus able to extend their specialised and intercultural skills.
Our employees express their opinions By strengthening our company culture, we lay the foundation for higher employee satisfaction and more motivated and productive employees. In 2008, we introduced an employee survey as an instrument for actively co-designing internal processes. This sur-vey enables us to systematically analyse our company’s strengths and weaknesses from the perspective of our employees. It helps us to identify and meet challenges more effectively, but also to initiate important change processes.
We conducted our third Group-wide survey since 2008 and 2010 in 2012. The overall results of the survey and the high participation rate of nearly 90 per cent clearly suggest that our employees support the further development of NORMA Group and are pleased with their situation at work.
Families welcome NORMA Group helps its employees to reconcile work and fam-ily life. For this reason, we established measures to offer the highest degree of flexibility to employees with family and children. For example, we supported the introduction of a lifetime working time account together with the German Group Works Council. NORMA Group employees at the sites in Maintal, Gerbers-hausen, and Marsberg are allowed to set up wage credit ac-counts on a voluntary basis by saving parts of their monthly salaries, bonuses or remaining vacation days. The resulting credits can be used by our employees to take time off to attend to their children or take care of family members. Furthermore, since November 2013, our employees have been able to perform some or even all of their work-related tasks outside the Com pany at their home offices.
PARTICIPATION RATE IN THE EMPLOYEE SURVEY
in %
100
75
50
25
0
89.6
2008 2010 2012
80.481.9

NORMA Group SE Annual Report 201388
Healthy Team – Healthy CompanyA productive company like NORMA Group depends on having healthy and satisfied employees. For this reason, we contribute to our employees’ health by conducting various activities, such as skin screening, intraocular pressure and blood fat measure-ments, tests on lung function, cardiovascular disease prevention and flu vaccinations. Our company doctors also accompany the rehabilitation and reintegration of these employees into work life. By conducting tours of our facilities on a regular basis, we subject each and every workplace to analysis with respect to all possible work-related healthcare risks. Our goal is to establish medical facilities and healthcare programmes at all NORMA Group sites. On the way to achieving this, doctors began working at our sites in Ciudad Juarez and Monterrey (both NORMA Mexico) and Briey (NORMA France) in 2013. Furthermore, we took out voluntary health insurance policies for all of our employees in Russia, France, Poland, the UK and Turkey.
We know from our most recent employee survey in 2012 that job-related and personal stress can exert immense pressure on many of our employees. For this reason, NORMA Group Holding and NORMA Group SE began working with an external healthcare and social service provider in October 2013. The doctors, psy-chologists, social advisors and legal advisors who work for EAP-Assist GmbH are now available to assist our employees and their immediate family members around the clock and throughout the year to help them with any health-related, mental, social or family problems they might be having. Our employees at the site in Pune (NORMA India) have been benefitting from a similar pro-gramme since 2013.
CORPORATE RESPONSIBILTY (CR)
We consider bringing the effects of our operations in line with the needs and expectations of society to be a core responsibility. For this reason, we base our decisions on the principles of respon-sible corporate governance and sustainable action.
The global megatrends that result from climate change present us, as a manufacturer of innovative joining technology and a busi-ness partner for companies in many different industries, with a special challenge. We stand up to this challenge by offering solu-tions that provide ways to increase the efficiency of re sources and energy. Together with our business partners, we thus contribute toward making society more socially and ecologically sustainable. We consider this to be both a challenge and an incentive.
Organisation In August 2012, a CR steering committee was established under the direction of our CEO Werner Deggim. Its objective is to define the long-term corporate responsibility goals for NORMA Group and to develop and decide on cross-functional measures.
Now that we initiated the process of integrating Corporate Re-sponsibility into our business strategy and developed our first CR-model in 2012, we focussed on defining the specifics of our CR-strategy in 2013. The CR-steering committee approved an appropriate roadmap in the spring of 2013. Overriding goals were identified and medium and long-term measures were adopted. The CR-steering committee monitors execution at regular inter-vals, adjusts the objectives if conditions have changed, and modi-fies the activity plan, if necessary.
Five CR key areasNORMA Group has systematised CR-measures in five key ar-eas of action. The respective departments are responsible for their implementation and for achieving the objectives. The CR coordinators are responsible for cross-departmental functions.
Responsible management: Corporate leadership that takes the interests of the various stakeholders into consideration represents an important element of our understanding of re-sponsibility. This requires that our employees live a culture of responsibility, honesty and mutual respect. Our policies on compliance are our most important tools for reminding our employees of their ethical and legal obligations. Corporate Governance Report, p. 40.
Business solutions: We offer our business partners and cus-tomers product solutions that make using fluid and gaseous substances cleaner, safer and more efficient. By doing so, we help to lower energy consumption and emissions that are harmful to the climate. Conducting research on and develop-ing new, ‘green’ products plays an important role in meeting the changing social and legal requirements. Research and Development, p. 61.
Employees: Thanks to our global presence, promoting diver-sity among our workforce represents an important part of our Company culture at NORMA Group. By signing the Charter of Diversity in March 2013, we committed ourselves to creating a working atmosphere that is free from prejudices and discrim-ination and characterised by mutual respect and appreciation.
Employees, p. 84.
Environment: We are mindful of the fact that we depend on the environment with all actions we take. This is why we are improving the efficiency of our use of energy and other natural resources at our sites and in the area of logistics. In 2013, NORMA Group continued to expand certification of its sites in accordance with ISO 14001. We also introduced a Group-wide reporting system that enables us to record and track the con-sumption of resources, emissions and waste. This helps us to further improve the efficiency of our manufacturing in environ-mental terms. Environmental Protection, p. 90.
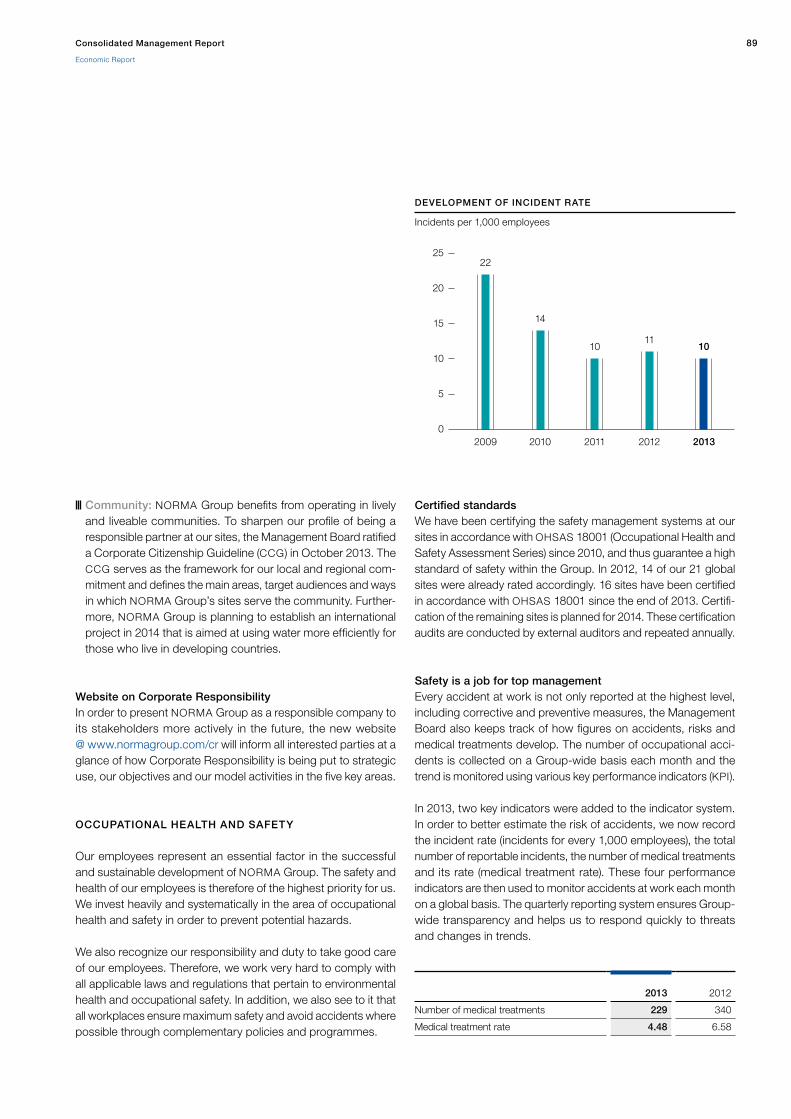
89Consolidated Management Report
Economic Report
Community: NORMA Group benefits from operating in lively and liveable communities. To sharpen our profile of being a responsible partner at our sites, the Management Board ratified a Corporate Citizenship Guideline (CCG) in October 2013. The CCG serves as the framework for our local and regional com-mitment and defines the main areas, target audiences and ways in which NORMA Group’s sites serve the community. Further-more, NORMA Group is planning to establish an international project in 2014 that is aimed at using water more efficiently for those who live in developing countries.
Website on Corporate ResponsibilityIn order to present NORMA Group as a responsible company to its stakeholders more actively in the future, the new website @ www.normagroup.com/cr will inform all interested parties at a glance of how Corporate Responsibility is being put to strategic use, our objectives and our model activities in the five key areas.
OCCUPATIONAL HEALTH AND SAFETY
Our employees represent an essential factor in the successful and sustainable development of NORMA Group. The safety and health of our employees is therefore of the highest priority for us. We invest heavily and systematically in the area of occupational health and safety in order to prevent potential hazards.
We also recognize our responsibility and duty to take good care of our employees. Therefore, we work very hard to comply with all applicable laws and regulations that pertain to environmental health and occupational safety. In addition, we also see to it that all workplaces ensure maximum safety and avoid accidents where possible through complementary policies and programmes.
Certified standardsWe have been certifying the safety management systems at our sites in accordance with OHSAS 18001 (Occupational Health and Safety Assessment Series) since 2010, and thus guarantee a high standard of safety within the Group. In 2012, 14 of our 21 global sites were already rated accordingly. 16 sites have been certified in accordance with OHSAS 18001 since the end of 2013. Certifi-cation of the remaining sites is planned for 2014. These certification audits are conducted by external auditors and repeated annually.
Safety is a job for top managementEvery accident at work is not only reported at the highest level, including corrective and preventive measures, the Management Board also keeps track of how figures on accidents, risks and medical treatments develop. The number of occupational acci-dents is collected on a Group-wide basis each month and the trend is monitored using various key performance indicators (KPI).
In 2013, two key indicators were added to the indicator system. In order to better estimate the risk of accidents, we now record the incident rate (incidents for every 1,000 employees), the total number of reportable incidents, the number of medical treatments and its rate (medical treatment rate). These four performance indicators are then used to monitor accidents at work each month on a global basis. The quarterly reporting system ensures Group-wide transparency and helps us to respond quickly to threats and changes in trends.
DEVELOPMENT OF INCIDENT RATE
Incidents per 1,000 employees
25
20
15
10
5
0
10
20132012
11
2009
22
2010
14
2011
10
2013 2012
Number of medical treatments 229 340
Medical treatment rate 4.48 6.58

NORMA Group SE Annual Report 201390
We have made significant progress in the area of occupational safety in recent years. We managed to reduce our incident rate to 10 in 2013. Our goal is to achieve an incident rate close to zero over time.
In 2012, we established the Value Based Safety Programme at our US production sites which will be rolled out to include all sites by the end of 2014. The Value Based Safety Programme analyses the activities of employees at work and determines potentially dangerous behaviours as part of weekly security checks. The deficits found are permanently corrected using standardised and team-oriented problem solving methods, for example, the so-called 8D-method that includes detailed feedback. We thus involve our employees more actively in occupational safety, sen-sitize them and, at the same time, increase safety for all those involved.
ENVIRONMENTAL PROTECTION
AND ECOLOGICAL MANAGEMENT
As a manufacturing company, we are well aware of our environ-mental, economic and social responsibilities. Environmentally- friendly and sustainable management is therefore an integral part of the strategy of NORMA Group. Corporate Responsibility, p. 88. The systematic integration of environmental aspects into business decisions and the continuous optimisation of our pro-cesses play an important role here.
To make our contribution to the sustainable use of resources and environmental protection, we invest in measures that serve to optimise the efficiency of our processes and lower our consump-tion of resources.
Group-wide environmental management systemIn 2013, we established a comprehensive, Group-wide environ-mental management system that currently includes 18 sites in total that are certified according to the ISO 14001 standard. Our goal is to increase the efficiency of our production processes, sustainably reduce our energy consumption and produce less waste. The long-term savings that this will bring will also con-tribute positively to the profitability of NORMA Group.
Our aim is to integrate all NORMA Group production sites into the system by mid-2014 with the exception of Chien Jin Plastic, Malay sia, and Nordic Metalblok, Italy. New acquisitions from 2013 have not yet been taken into account here. A Group-wide report-ing tool for recording and tracking our use of resources, emissions and waste that was activated in 2013 will help us to record and track results more swiftly.
Reducing consumption of energy and waterAs part of the implementation of our sustainability strategy, we succeeded in reducing our energy and water consumption com-pared to 2012. Measures that have made a significant contribu-tion to this include the use of more efficient lighting systems, the consequent shutdown of consumption during breaks, and the use of efficient compressors at the site in Juarez. Together, these measures have helped us to reduce CO2 emissions from elec-tricity and gas consumption compared with 2012 by 2.7% to 80.32 kg/kEUR of production activity. Power consumption also dropped by 2.1 % to 118.25 kWh / kEUR of production activity.
Water consumption was cut by more than half compared with the previous year at our sites in Auburn Hills through optimisation measures for watering the building grounds.
SPECIFIC ENVIRONMENTAL INDICATORS
2012
2013 Change
CO2 emissions from the consumption of electricity and gas (kg / EUR thousands of production activity) 82.54 80.32 – 2.7 %
Electricity consumption (kWh / EUR thousands of production activity) 120.83 118.25 – 2.1 %
Gas consumption (kWh / EUR thousands of production activity) 39.50 36.84 – 6.7 %
Water consumption (t / EUR thousands of production activity) 0.19 0.17 – 10.5 %
Metal waste (t / EUR of production activity) 13.04 12.17 – 6.7 %
Non-metal waste (t / EUR of production activity) 1.29 1.68 + 30.2 %
Paper waste (t / EUR per production activity) 1.21 1.11 – 8.3 %
Remaining waste (t / EUR per production activity) 1.66 1.46 – 12.0 %
91Consolidated Management Report
Supplementary Report
In Pennsylvania, USA, we significantly reduced both the amount of waste and new consumption by reprocessing detergent solu-tions that are used to clean parts of production. At the same time, we also succeeded in lowering consumption of coolants and machine oils.
Through these and other measures, we managed to improve our waste balance in 2013 with the exception of non-metallic waste. For example, we reduced paper and residual waste by 8.3 % and 12.0 % respectively compared to 2012. The 30.2 % increase in non-metallic waste can be attributed to the launch of new prod-ucts and changes in the product mixes at a few plants.
Responsible transportation of people and goodsWe continue to update the company car directive that applies in Germany and takes fuel consumption into consideration. And with shipments by sea, the respective products are transported to the port by train.
Furthermore, we have been shipping parcels carbon dioxide-neu-trally in Germany since 2011. This means the emissions produced during processing of a parcel that are harmful to the environment are compensated for by financing climate protection projects. Even this Annual Report was printed carbon neutrally using FSC-certified paper. From April 2012 to March 2013, we thus compensated for 14.3 tons of CO2 in total.
Sustainability will also continue to play an important role in our Group strategy in the future. Here, we also involve our suppliers by requesting that they establish a sustainable environmental management system or continue to develop their existing systems.
A green product portfolioNORMA Group is an expert in the area of engineered joining technology. We manufacture a wide range of components that are installed in critical areas of vehicles, ships and aircraft and are crucial to their ability to perform properly. Roughly 50 % of our product portfolio is used to control emissions. Examples include our SCR-fluid pipe systems that are used to reduce the level of nitrogen oxide in the exhaust fumes of combustion en-gines. Our latest generation V-Band clamps and Euro Couplers are not only used to reduce weight, but also to achieve more reliable sealing of interfaces in the exhaust track and on the turbo-charger.
Furthermore, roughly one million vehicles are currently equipped with our newly developed coolant duct systems. Our products are up to 30 % lighter than conventional systems and thus con-
tribute significantly to reducing the weight and emissions of ve-hicles. Our product Euro Coupler helps our customers to build lighter cars, prevent leakages and thus lower CO2 emissions. The further development of our NORMAFLEX® Low Emission Tubes, a new generation of tubing, meets the Low Emission III Standards for fuels with a high percentage of aggressive alcohol com-pounds.
Due to how extremely important the components we manufacture are for our customers’ end products, we bear a great deal of responsibility to them. Therefore, our goal is to ensure the high-est possible product reliability. We achieve this by relying on a high degree of auto mation in our manufacturing and by using modern quality and testing technique.Among other things, this enables us to significantly reduce the risk of negative consequenc-es for the environment and society. Organisational and Process Advantages, p. 78.
Supplementary Report
OPTIMISATION OF OUR FINANCING STRUCTURE
In mid-January 2014, NORMA Group used the funds raised from the promissory note that was issued in the middle of 2013 to prematurely repay a share of the syndicated financing that the Company has had available since April 2011. The repayment amounted to EUR 101.4 million in total. As a result of this repay-ment, NORMA Group will benefit from lower interest expenses in the future. In fact, this will already have a positive effect on results for the first quarter of 2014.
The hedging transactions associated with the amount that was repaid (interest / cross currency swaps) were closed when these funds were paid back. These releases will have a one-off negative effect on the first quarter in the amount of EUR 6.8 million. The savings that will result from lower interest expenses starting in January 2014 will already compensate for roughly half of the one-off expenditures during the current year. By the end of the financing term, NORMA Group will have saved more than EUR 3.6 million by repaying this loan and cancelling the derivative.
Including the premature decomposition of confined financing costs, we expect total financing costs of around EUR 18 million in 2014 which will be reduced to EUR 10 million in the follow-ing year.

NORMA Group SE Annual Report 201392
ACQUISITION OF THE REMAINING SHARES
IN CHIEN JIN PLASTIC SDN. BHD.
In February 2014, we exercised our right to acquire the remaining 15 % shares in Chien Jin Plastic Sdn. Bhd. in Malaysia. We there-fore now hold 100 % of the shares in this company.
Due to the fact that we have already been fully consolidating Chien Jin Plastic since the acquisition in November 2012, the acquisition of the remaining 15 % of the shares will have no effect on the operative figures for the Group.
Chien Jin Plastic is a manufacturer of thermoplastic joining tech-nology based in Ipoh, Malaysia. The company has been on the market for over 20 years and manufactures connecting elements for plastic and iron pipe systems that are used in a wide variety of different applications, most notably to supply drinking and in-dustrial water, but also in irrigation systems. For further informa-tion, please refer to our 2012 Annual Report. Annual Report 2012, p. 59. The complete acquisition of Chien Jin Plastic is in line with our strategic goal of further expanding our presence in Asia.
Forecast Report
GENERAL ECONOMIC CONDITIONS
Industrial nations drive global economy – euro zone grows moderatelyThe prospects for the global economy noticeably improved at the turn of 2013 / 2014. Important early indicators signal an eco-nomic recovery in the coming months. In its outlook for the current year updated in January 2014, the International Monetary Fund (IMF) expects economic output to grow 3.7 % (2013: + 3.0 %) and also expects growth to further accelerate in 2015.
The drivers in 2014 are in particular the advanced economic regions. The IMF forecasts a 2.2 % increase in GDP (2013: +1.3 %) for the major industrial nations. US economic growth should accel erate to 2.8 %, provided the US central bank’s change of course is carried out cautiously and without turbulence in the capital markets. The euro zone returns to a moderate growth course of 1.0 % in 2014, supported by higher exports and grad-ually rising investments; however, the recovery remains fragile. For Germany, the IMF forecasts an acceleration of growth to 1.6 %, while the German Bundesbank expects 1.7 %. In addition to robust private consumption and higher construction investments, the driving factors also result from investments in machinery and equipment, which are once again growing tangibly. In the United Kingdom, GDP growth of 2.4 % is gaining further momentum.
According to IMF forecasts for 2014, developing nations and emerging markets could expand more robustly at + 5.1 % fol-lowing + 4.7 % in the previous year. However, the risks are high. At the beginning of 2014, some emerging markets had already countered further currency devaluation and rapidly rising rates of inflation with massive interest rate hikes. Barring any disrup-tions, the emerging markets should also achieve higher growth rates than the established regions in the future. However, eco-nomic researchers are assuming that the very high rates of expansion seen in the past, in particular in China, are general-ly no longer achievable. The Chinese government is accelerat-ing the process of structural and permanent reinforcement of its private domestic economy with reforms, which are intended to reduce its dependency on infrastructure investments and exports. The IMF estimates that the Chinese economy will grow by only 7.5 % in 2014. In 2014, the ASEAN-5 countries will grow by 5.1 % and Brazil by 2.3 %, similar to the previous year. For Russia (2.0 %) and India (5.4 %), economic recoveries are on the horizon for 2014.
This overall economic backdrop is the foundation for NORMA Group’s forecast and outlook.
FORECASTS FOR GDP GROWTH
In %
2013 2014e 2015e
World +3.0 +3.7 +3.9
USA +1.9 +2.8 +3.0
China +7.7 +7.5 +7.3
Euro zone – 0.4 +1.0 +1.4
Germany 1) +0.4 +1.7 +2.0
Sources: IMF, 1) German Bundesbank
In 2015, the driving factors will continue to increase worldwide. All important economic regions will contribute to this result. The IMF estimates global growth of 3.9 % in 2015, whereby both advanced economies (2.3 %) as well as developing nations and emerging markets (5.4 %) will gain slight momentum. However, in the view of the IMF, the important economic regions are not expected to contribute equally to global economic growth in 2015. On the one hand, growth in the USA, estimated at 3.0 %, as well as in the euro zone, expected to be 1.4 %, will continue to accel-erate. France (1.5 %), Italy (1.1 %) and Spain (0.8 %) in particular will contribute to this. The IMF also expects a stronger recovery in India, the ASEAN-5 region as well as in Russia and Brazil for 2015. On the other hand, growth is expected to weaken to 1.0 % in Japan and 7.3 % in China. The IMF also expects growth to flatten to 1.4 % in Germany for 2015. In contrast, the German Bundesbank and IfW (Kiel) expect a clear recovery in Germany to 2.0 % and 2.5 % respectively.

93Consolidated Management Report
Forecast Report
Improved operating environment for important customer industries of NORMA GroupThe looming recovery of the international economy for 2014 and 2015 improves the environment and prospects for important customer industries of NORMA Group.
The German industry association VDMA is confident about the development of the engineering and plant construction industry in 2014. This is bolstered by global economic growth and the positive performance of early indicators. The association expects worldwide machine sales to grow by 5 % in 2014, whereby growth in China (+ 7 %) and the USA (+ 2 %) is expected to accelerate compared to the previous year. The Italian engineering industry (+ 3 %) and the sales revenues of Japanese manufacturers (+ 7 %) are also expected to grow dynamically once again. The VDMA expects the German engineering industry’s sales revenues to grow by just under 4 % to the record level of EUR 215 billion in 2014, whereby production is expected to increase by 3 % in real terms. The drivers will be both a tangible recovery of the domes-tic economy, which benefited from a recent increase in orders and once again rising investments in machinery and equipment, as well as once again growing exports.
The prospects for the global automotive industry are brightening again in 2014. On the one hand, because the two largest markets (USA, China) will continue to grow. On the other, because the Western European market for automobiles and commercial ve-hicles will recover moderately after years of contraction. In addi-tion, demand is rising again in important emerging markets. The industry association VDA expects new registrations to rise by 3 % worldwide to 74.7 million automobiles for 2014. The research institute IHS Automotive (Polk) forecasts an increase of 3.5 % to 78.4 million units in the global market for automobiles and light trucks. The VDA expects that, with the exception of Japan (– 4 %), all relevant markets will grow in 2014. According to its expecta-tions, China should grow by 7 % and the USA by 3 %. Growth of 2 % is predicted for Western Europe. The VDA is also confident about India (+ 7 %), Brazil (+ 2 %) and Russia (+ 3 %). The German market is only expected to recover slightly with a solid 3 million new automobile registrations. In the opinion of the VDA, produc-tion by German manufacturers will increase by 3.5 % to just under 14.7 million automobiles in 2014. This expansion will be attributable almost entirely to higher production levels at foreign plants (+ 6 %).
The industry network Euroconstruct and the Ifo Institute forecast a trend reversal for the European construction industry in 2014. Production should expand moderately by + 0.9 %. The driver will be residential construction, which will return to growth for the first time in nearly all countries. Growth is expected to further accel-erate in 2015, as commercial construction and pent up infrastruc-ture investments are also expected to gain momentum. The prospects for the German construction industry remain positive.
In light of the high number of building permits, the German Bundesbank expects residential construction investments to in-crease by 5.5 % for 2014 (2015: + 3.8 %). The IfW forecasts growth rates of 4.3 % (2014) and 4.7 % (2015). Investments in commercial construction (2014: +1.5 %; 2015: + 3.9 %) will also rise with the recovery of investments in machinery and equipment. Public-sec-tor construction should receive a significant boost estimated at 5 % in 2014 (2015: – 0.2 %). Arguments in favour of this include higher infrastructure investments for energy and roads as well as the repair of the prior year’s flood and storm damage. The fore-casts of the trade associations ZDB and HGB are based on the assumption that sales revenues will grow by 3.5 % in the main construction trades to EUR 98.6 billion. The driver remains resi-dential construction at + 5.0 %. Sales growth is also expected for the commercial construction (+ 2.5 %) and public-sector con-struction industries (+ 3.5 %).
THE FUTURE DEVELOPMENT OF NORMA GROUP
Apart from the structural simplifications in the Americas men-tioned on p. 58, we currently have no plans to make significant changes to the Company’s goals or legal structure.
We have succeeded in continuously increasing both our sales and our earnings in the past and hold fast to our basic company strategy. We intend to continue to grow faster than the market in the future with the help of our two sales channels EJT and DS, international expansion and constant innovations.
We will also continue to drive our international focus forward in the future, by expanding our distribution network and our pro-duction sites, but also by further expanding our local engineering know-how. In the medium and short term, this will include ex-panding and building new sites in China and Brazil. By doing so, we hope to be able to leverage the opportunities in these import-ant growth markets and to transfer the value creation chain to the respective region or country.
Growth in sales expected in 2014 For the year 2014, the NORMA Group Management Board cur-rently (Maintal, 12 March 2014) expects the global economy to grow at a higher rate than in 2013. The advanced economic re-gions will be the main drivers here. The euro region will return to its moderate growth course in 2014 thanks to exports and a gradual increase in investments. We also expect to see growth impulses from the developing and emerging nations, nevertheless the risks here are quite high.
Due to broad diversification with respect to products, regions and markets, we have a relatively robust business model. Sup-

NORMA Group SE Annual Report 201394
ported by the positive development in growth of the global economy compared to financial year 2013, business with im-portant customers of NORMA Group has developed quite pos-itively so far.
Stimulated by solid growth in many Asian markets, such as China for example, and the further expansion of our activities, but also higher market shares, we are planning to achieve strong growth in sales of over 10 % in the Asia-Pacific region.
Following the moderate growth we saw the previous year, the North American market has still not reached its historic high and this suggests that solid market growth in local currency can be expected in 2014. This could be supported by a possible pre-buy effect in the second half of 2014 due to plans to implement the emissions regulation EPA15 for heavy goods vehicles starting on 1 January, 2015. Due to the relative strength of the euro, this growth will probably be compensated for to at least some extent. For this reason, slight growth measured in euros seems likely.
We also expect to see the EMEA region develop positively. Whereas production volumes in the various industries have prob-ably bottomed out for the first time in several years, e. g. growth can be expected for the current year, we also expect to see an increase in the number of joining elements and a higher value of these elements due to the legal introduction of the emissions standards EURO-6 and the related ramp-up for the new energy generation. All in all, the EMEA region should achieve more solid growth in 2014 than in the previous year.
We expect the two ways to market EJT and DS to develop sim-ilarly and this will lead to a more analogous division compared to the previous year. EJT still accounts for approx. 70 % of total sales, and DS for approx. 30 %. The organic growth in sales that is expected in the area of EJT will be important here, while the area of DS will be supported not only by an organic recovery, but also by the acquisitions made in 2013.
In total, we expect Group sales to increase organically by around a solid 4 to 7 per cent in 2014 compared to 2013. Here, it is as-sumed that no economic cool down occurs in the regional seg-ments. For the most part, this growth will be achieved through higher volumes, while the price adjustment clauses so typical of our business will continue to lead to slight declines in prices.
Furthermore, the acquisitions of the Polish company Variant S.A. in June 2013 and the Australian company Guyco Pty. Ltd. in July 2013 will generate around EUR 5 million in additional sales com-pared to the previous year, due to consolidation.
Approximately 4 % of EJT sales to be put toward Research & Revelopment in the future alsoWe plan to invest roughly 4 % of our EJT sales in Research and Development in the future. We will be able to realise cost advan-tages in the medium term by expanding our local development activities. We will continue to put the main focus of our Research and Development work on developing innovative solutions that meet our customers’ demands, particularly with respect to weight reduction, higher engine efficiency and modularisation of pro-duction processes. Research & Development, p. 61. By doing so, we hope to secure ourselves a competitive advantage that will be honoured by our customers in the area of EJT in particu-lar. Furthermore, developments from this area continue to find their way into areas of application for our customers in the area of Distribution Services. We also plan to register new patents again in 2014.
In order to meet the requirements of increasingly strict emission regulations, we have been working for some time on a new gen-eration of dynamic hose clamps for high temperature applica-tions. These should meet the requirements of future emission regulations and the resulting higher pressure, temperatures and mechanical stresses, such as vibrations, for example.
Future assembly simplifications are in demand, above all to bal-ance tolerances and reduce the susceptibility for mistakes during the assembly process, in particular in the area of exhaust gas aftertreatment. We are also looking at solutions that will save our customers costs when manually installing particle filters or com-plex waste gas systems. In addition, we are working on further developing the profile clamps that are used to ensure operation-al reliability even under the most difficult conditions in terms of temperature and vibrations.
The aspect of safety has always played an important role for our customers. Therefore, we have developed additional secondary latches and assembly indicators for a visual check of the con-nection in order to ensure the proper assembly of connectors at all times.
Cost of materials ratio planned at the level of the previous two years By concluding fixed purchasing contracts in the areas of steel and technical polymers during the year, we are protecting our-selves against price changes in the commodity markets to a large extent during the current financial year. We are able to pass on a large portion of the fluctuations in prices for aggregates that occur over the course of the financial year due to the contracts

95Consolidated Management Report
Forecast Report
we have with our customers. In combination with the measures from our Global Excellence Programme, we achieve a relatively stable cost of materials ratio within the Group that should remain at roughly the same level in 2014 as the previous two years (2012: 43.6 %; 2013: 42.4 %).
Further optimisation of the remaining cost positions Thanks to the Group’s ongoing growth and the fact that we have intensified our activities in the Asia-Pacific region, we expect per-sonnel costs to rise more slowly than sales. This will result in a gradual, continuous improvement in our personnel cost ratio. The other operational expenses will remain at a stable level due to expenditures for growth and expansion of our activities in the emerging nations, particularly the costs of ramping up new plants.
Adjusted EBITA margin expected at the same level as in previous yearsOrganic growth compared to the previous year once again en-ables us to expand our activities, especially in the Asia-Pacific region and Brazil. Together with the acquisitions we made in 2013, we strive to achieve yet another sustainable adjusted EBITA mar-gin in 2014. The adjusted EBITA margin in 2014 should remain at the same level as in prior years of more than 17 %. This can also be attributed to the effects of our Global Excellence Programme.
Financial result of around EUR – 18 million expectedPartial repayment of the syndicated credit line in the amount of EUR 101.4 million with bank balances in January 2014 resulted in partial termination of related hedges. The savings from lower interest expenses starting in January 2014 already compensate for roughly half of the one-off expenditures of around EUR 6.8 million in the current financial year. Furthermore, assuming that no further acquisitions are made, the financial result will show lower interest expenses in the current financial year due to re-payment of this debt. In addition, the financial result can be in-fluenced either positively or negatively by possible, but currently unplanned financing measures or changes in the hedging position. In total, we expect a financial result of around EUR – 18 million.
Tax rate of around 32 per centDue to the positive earnings development of the Americas seg-ment, we expect a Group tax rate of around 32 %. In case of further sales and earnings growth, especially in the APAC region, we assume a reduction of the Group tax rate in the mid-term.
Higher earnings per share (adjusted)Adjusted earnings per share will rise solidly in financial year 2014. Growth in sales and a sustainable margin, but also the result contributions from acquisitions made in 2013, will contribute to this. The one-off effect from partial repayment of the syndicated credit line is not included here.
Investment rate of around 4.5 % the goalFor financial year 2014, we plan to invest around 4.5 % of Group sales or roughly at the same level as in previous years. By doing so, we will be financing both maintenance investments and in-vestments on expanding our business. With this expansion, we will be concentrating mainly on the Asia-Pacific region and other emerging nations in which we intend to significantly expand our activities in the future. Investment peaks could result from ex-panding manufacturing capacities at a second plant in China or further roll-out activities in the Brazilian market.
Financial and liquidity situation: Operating net cash flow between the levels of the two previous years In 2014, we expect a continued positive cash flow from operating activities. This cash flow will help us to finance the demand for short-term operating capital, but also current investments and dividend payments. We plan to use excess funds mainly to invest in growth activities, particularly in emerging countries, and to finance possible acquisitions.
Due to the high operational results and planned investment ex-penditures, we once again expect to see high positive free cash flow (before acquisitions) in 2014. Operating net cash flow for 2014 should be between the levels of the previous two years (2013: EUR 103.9 million / 2012: EUR 81.0 million). This is assum-ing the inflows that are typical for our business, particularly in the 4th quarter of the financial year. Besides the cash flow that we expect, sufficient funds from the revolving credit line valued at EUR 125 million are available.
Acquisitions to remain a cornerstone of our growth in the future The current financing structure gives us sufficient latitude to achieve external growth. Here, the focus is on companies that manufacture and sell products that complement our current product portfolio, but also companies in regions in which we have not yet addressed the market. Furthermore, we focus on consol-idation of the industry and the markets and include the search
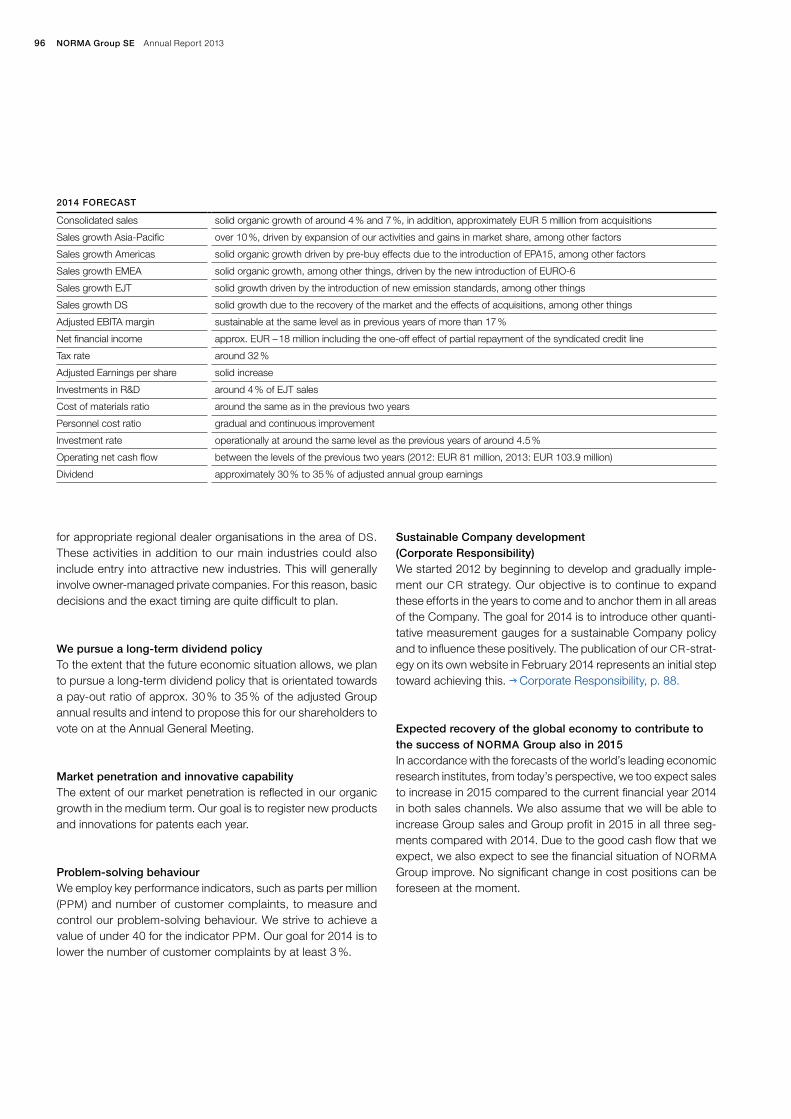
NORMA Group SE Annual Report 201396
for appropriate regional dealer organisations in the area of DS. These activities in addition to our main industries could also include entry into attractive new industries. This will generally involve owner-managed private companies. For this reason, basic decisions and the exact timing are quite difficult to plan.
We pursue a long-term dividend policyTo the extent that the future economic situation allows, we plan to pursue a long-term dividend policy that is orientated towards a pay-out ratio of approx. 30 % to 35 % of the adjusted Group annual results and intend to propose this for our shareholders to vote on at the Annual General Meeting.
Market penetration and innovative capabilityThe extent of our market penetration is reflected in our organic growth in the medium term. Our goal is to register new products and innovations for patents each year.
Problem-solving behaviourWe employ key performance indicators, such as parts per million (PPM) and number of customer complaints, to measure and control our problem-solving behaviour. We strive to achieve a value of under 40 for the indicator PPM. Our goal for 2014 is to lower the number of customer complaints by at least 3 %.
Sustainable Company development (Corporate Responsibility)We started 2012 by beginning to develop and gradually imple-ment our CR strategy. Our objective is to continue to expand these efforts in the years to come and to anchor them in all areas of the Company. The goal for 2014 is to introduce other quanti-tative measurement gauges for a sustainable Company policy and to influence these positively. The publication of our CR-strat-egy on its own website in February 2014 represents an initial step toward achieving this. Corporate Responsibility, p. 88.
Expected recovery of the global economy to contribute to the success of NORMA Group also in 2015In accordance with the forecasts of the world’s leading eco nomic research institutes, from today’s perspective, we too expect sales to increase in 2015 compared to the current financial year 2014 in both sales channels. We also assume that we will be able to increase Group sales and Group profit in 2015 in all three seg-ments compared with 2014. Due to the good cash flow that we expect, we also expect to see the financial situation of NORMA Group improve. No significant change in cost positions can be foreseen at the moment.
2014 FORECAST
Consolidated sales solid organic growth of around 4 % and 7 %, in addition, approximately EUR 5 million from acquisitions
Sales growth Asia-Pacific over 10 %, driven by expansion of our activities and gains in market share, among other factors
Sales growth Americas solid organic growth driven by pre-buy effects due to the introduction of EPA15, among other factors
Sales growth EMEA solid organic growth, among other things, driven by the new introduction of EURO-6
Sales growth EJT solid growth driven by the introduction of new emission standards, among other things
Sales growth DS solid growth due to the recovery of the market and the effects of acquisitions, among other things
Adjusted EBITA margin sustainable at the same level as in previous years of more than 17 %
Net financial income approx. EUR – 18 million including the one-off effect of partial repayment of the syndicated credit line
Tax rate around 32 %
Adjusted Earnings per share solid increase
Investments in R&D around 4 % of EJT sales
Cost of materials ratio around the same as in the previous two years
Personnel cost ratio gradual and continuous improvement
Investment rate operationally at around the same level as the previous years of around 4.5 %
Operating net cash flow between the levels of the previous two years (2012: EUR 81 million, 2013: EUR 103.9 million)
Dividend approximately 30 % to 35 % of adjusted annual group earnings
97Consolidated Management Report
Risk and Opportunity Report
GENERAL STATEMENT BY THE MANAGEMENT BOARD
ON THE PROBABLE DEVELOPMENT
At the time that the management report 2013 was prepared, the Management Board expect NORMA Group to achieve solid growth in 2014. This growth will be achieved due to a consider-ably more relaxed economic environment on the one hand. On the other hand, we expect to see positive effects on our business from the introduction of new emission standards. On the basis of current economic forecasts, the Board of Management expects this growth to continue to gain momentum in 2015. We see growth especially in the Asia-Pacific region and will therefore continue to expand our activities in this region. In the Americas, we also see solid growth opportunities at least in local currency. The EMEA region has probably hit bottom for the first time in several years and this gives cause to expect growth on the volume side. Both the areas of EJT and DS should show solid organic growth. Furthermore, the area of DS is growing due to the ac-quisitions made in 2013. In total, the Management Board expects solid growth for the Group compared to 2013, assuming that the economy does not cool down significantly.
We plan to keep the costs of Research and Development, thr cost of materials ratio and other operational expenditures stable and see other slight optimisation possibilities with respect to the other cost positions due to our solid growth and the consistent implementation of our Global Excellence Programme. We will continue to invest in expanding our plans in the current financial year. For this reason, we expect to achieve a sustainable margin at the same level as in previous years, more than 17 %,
The Management Board will continue to consider the possibility of acquisitions that offer us additional potential for success on a regular basis in the future. Here, we will concentrate on compa-nies that have the potential of improving NORMA Group’s position in the regions in which we do not cover the market, strengthen our technology portfolio, or address new target audiences.
Risk and Opportunity Report
NORMA Group’s corporate group is exposed to a wide variety of risks and opportunities which can have a positive or negative short-term or long-term impact on its financial position and per-formance. For this reason, opportunity and risk management represents an integral component of corporate management for NORMA Group SE, at both the Group management level and at the level of the individual companies and individual functional areas. Due to the fact that all corporate activities are associated
with risks and opportunities, we consider identifying, assessing, and managing opportunities and risks to be a fundamental com-ponent of executing our strategy, securing the short and long-term success of the Company and sustainably increasing share-holder value. In order to achieve this over the long-term, we encourage our employees in all areas of the Company to remain conscious of risks and opportunities.
OPPORTUNITY AND RISK MANAGEMENT SYSTEM
We define risks as the possibility of disadvantageous future de-velopments, changes, or events that could have a positive / neg-ative impact on the Group’s ability to meet its targets and achieve its business objectives. Analogous to our medium-term planning, our focus with respect to possible deviations in specific risks and opportunities covers a period of five years. Opportunities and risks that affect the Company’s success beyond this period of time are recorded and controlled at the Group management level and taken into consideration in the Company’s strategy.
The Management Board of NORMA Group AG is responsible for maintaining an effective Group risk and opportunity management system. The Supervisory Board is responsible for monitoring the effectiveness of the Group risk management system. Checking compliance with the Group’s internal risk and opportunity man-agement rules is also integrated into the internal audit depart-ment’s periodic reviews.
Risks are recorded on a Group-wide basis every quarter and categorised according to functional areas and individual compa-nies and then reported to the individuals responsible for these functions and segment management, the Management Board and the Supervisory Board. Furthermore, risks that are identified during a quarter whose expected value will have a significant effect on the results of Group divisions are reported to the Board of Management on an ad hoc basis and, if necessary, even to the Supervisory Board. Operational opportunities are identified during monthly meetings held at the local and regional level, but also by the Management Board, and then documented and ana-lysed. Measures aimed at capitalising on strategic and opera-tional opportunities through local and regional projects are ap-proved during these meetings. Regular forecasts are developed as part of periodic reporting to record how successfully potential opportunities are taken advantage of. Strategic opportunities are recorded and evaluated as part of annual planning. We use a systematic assessment procedure to evaluate the opportunities and risks that we identify, both in terms of their financial impact, i. e. gross and net impact on planned financial indicators, and their probability of occurrence.
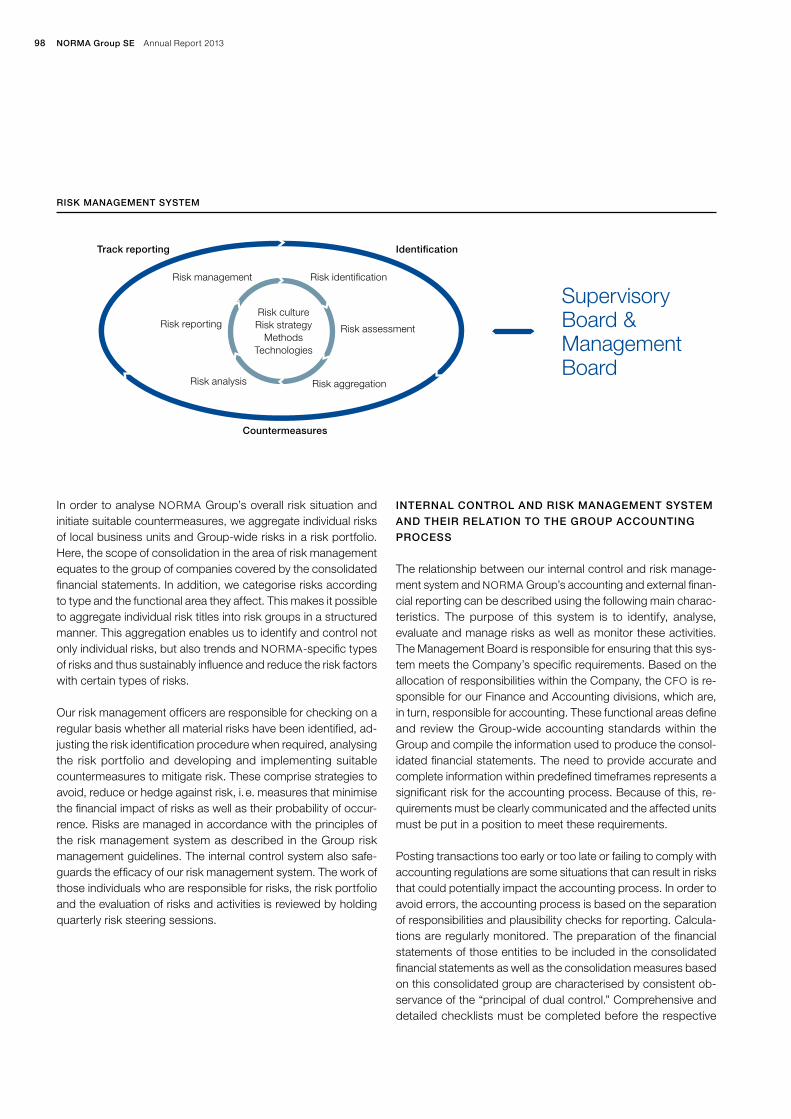
NORMA Group SE Annual Report 201398
In order to analyse NORMA Group’s overall risk situation and initiate suitable countermeasures, we aggregate individual risks of local business units and Group-wide risks in a risk portfolio. Here, the scope of consolidation in the area of risk management equates to the group of companies covered by the consolidated financial statements. In addition, we categorise risks according to type and the functional area they affect. This makes it possible to aggregate individual risk titles into risk groups in a structured manner. This aggregation enables us to identify and control not only individual risks, but also trends and NORMA-specific types of risks and thus sustainably influence and reduce the risk factors with certain types of risks.
Our risk management officers are responsible for checking on a regular basis whether all material risks have been identified, ad-justing the risk identification procedure when required, analysing the risk portfolio and developing and implementing suitable countermeasures to mitigate risk. These comprise strategies to avoid, reduce or hedge against risk, i. e. measures that minimise the financial impact of risks as well as their probability of occur-rence. Risks are managed in accordance with the principles of the risk management system as described in the Group risk management guidelines. The internal control system also safe-guards the efficacy of our risk management system. The work of those individuals who are responsible for risks, the risk portfolio and the evaluation of risks and activities is reviewed by holding quarterly risk steering sessions.
INTERNAL CONTROL AND RISK MANAGEMENT SYSTEM
AND THEIR RELATION TO THE GROUP ACCOUNTING
PROCESS
The relationship between our internal control and risk manage-ment system and NORMA Group’s accounting and external finan-cial reporting can be described using the following main charac-teristics. The purpose of this system is to identify, analyse, evaluate and manage risks as well as monitor these activities. The Management Board is responsible for ensuring that this sys-tem meets the Company’s specific requirements. Based on the allocation of responsibilities within the Company, the CFO is re-sponsible for our Finance and Accounting divisions, which are, in turn, responsible for accounting. These functional areas define and review the Group-wide accounting standards within the Group and compile the information used to produce the consol-idated financial statements. The need to provide accurate and complete information within predefined timeframes represents a significant risk for the accounting process. Because of this, re-quirements must be clearly communicated and the affected units must be put in a position to meet these requirements.
Posting transactions too early or too late or failing to comply with accounting regulations are some situations that can result in risks that could potentially impact the accounting process. In order to avoid errors, the accounting process is based on the separation of responsibilities and plausibility checks for reporting. Calcula-tions are regularly monitored. The preparation of the financial statements of those entities to be included in the consolidated financial statements as well as the consolidation measures based on this consolidated group are characterised by consistent ob-servance of the “principal of dual control.” Comprehensive and detailed checklists must be completed before the respective
RISK MANAGEMENT SYSTEM
Risk cultureRisk strategy
MethodsTechnologies
Risk management
Track reporting
Countermeasures
Identification
Risk reporting
Risk identification
Risk assessment
Risk aggregationRisk analysis
SupervisoryBoard &ManagementBoard
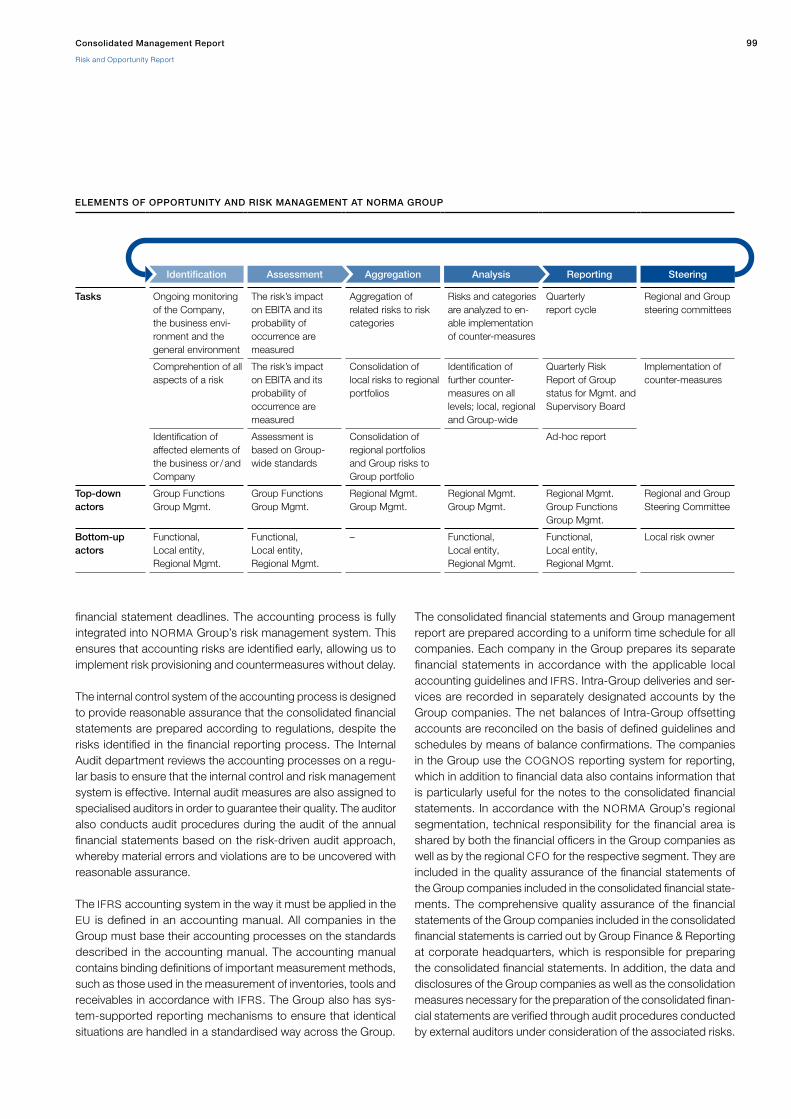
99Consolidated Management Report
Risk and Opportunity Report
finan cial statement deadlines. The accounting process is fully integrated into NORMA Group’s risk management system. This ensures that accounting risks are identified early, allowing us to implement risk provisioning and countermeasures without delay.
The internal control system of the accounting process is designed to provide reasonable assurance that the consolidated financial statements are prepared according to regulations, despite the risks identified in the financial reporting process. The Internal Audit department reviews the accounting processes on a regu-lar basis to ensure that the internal control and risk management system is effective. Internal audit measures are also assigned to specialised auditors in order to guarantee their quality. The auditor also conducts audit procedures during the audit of the annual financial statements based on the risk-driven audit approach, whereby material errors and violations are to be uncovered with reasonable assurance.
The IFRS accounting system in the way it must be applied in the EU is defined in an accounting manual. All companies in the Group must base their accounting processes on the standards described in the accounting manual. The accounting manual contains binding definitions of important measurement methods, such as those used in the measurement of inventories, tools and receivables in accordance with IFRS. The Group also has sys-tem-supported reporting mechanisms to ensure that identical situations are handled in a standardised way across the Group.
The consolidated financial statements and Group management report are prepared according to a uniform time schedule for all companies. Each company in the Group prepares its separate financial statements in accordance with the applicable local account ing guidelines and IFRS. Intra-Group deliveries and ser-vices are recorded in separately designated accounts by the Group companies. The net balances of Intra-Group offsetting accounts are reconciled on the basis of defined guidelines and schedules by means of balance confirmations. The companies in the Group use the COGNOS reporting system for reporting, which in addition to financial data also contains information that is particu larly useful for the notes to the consolidated financial statements. In accordance with the NORMA Group’s regional segmentation, technical responsibility for the financial area is shared by both the financial officers in the Group companies as well as by the regional CFO for the respective segment. They are included in the quality assurance of the financial statements of the Group companies included in the consolidated financial state-ments. The comprehensive quality assurance of the financial statements of the Group companies included in the consolidated financial statements is carried out by Group Finance & Reporting at corporate headquarters, which is responsible for preparing the consoli dated financial statements. In addition, the data and disclosures of the Group companies as well as the consolidation measures necessary for the preparation of the consolidated finan-cial statements are verified through audit procedures conducted by external audi tors under consideration of the associated risks.
ELEMENTS OF OPPORTUNITY AND RISK MANAGEMENT AT NORMA GROUP
Tasks Ongoing monitoring of the Company, the business envi-ronment and the general environment
The risk’s impact on EBITA and its probability of occurrence are measured
Aggregation of related risks to risk categories
Risks and categories are analyzed to en-able implementation of counter-measures
Quarterly report cycle
Regional and Group steering committees
Comprehention of all aspects of a risk
The risk’s impact on EBITA and its probability of occurrence are measured
Consolidation of local risks to regional portfolios
Identification of further counter- measures on all levels; local, regional and Group-wide
Quarterly Risk Report of Group status for Mgmt. and Supervisory Board
Implementation of counter-measures
Identification of affected elements of the business or / and Company
Assessment is based on Group- wide standards
Consolidation of regional portfolios and Group risks to Group portfolio
Ad-hoc report
Top-down actors
Group FunctionsGroup Mgmt.
Group FunctionsGroup Mgmt.
Regional Mgmt.Group Mgmt.
Regional Mgmt.Group Mgmt.
Regional Mgmt.Group FunctionsGroup Mgmt.
Regional and Group Steering Committee
Bottom-up actors
Functional, Local entity, Regional Mgmt.
Functional, Local entity, Regional Mgmt.
– Functional, Local entity, Regional Mgmt.
Functional, Local entity, Regional Mgmt.
Local risk owner
Identification Assessment Aggregation Analysis Reporting Steering

NORMA Group SE Annual Report 2013100
Local financial accounting uses a variety of different IT systems. We are aiming to standardise the local IT systems across the Group in the medium term and have already begun with imple-mentation. All systems have tiered access authorisation systems. The type and design of these access authorisations and authori-sation policies are decided by local management in coordination with the Head of IT for NORMA Group.
OPPORTUNITY AND RISK PORTFOLIO
OF NORMA GROUP
As part of the preparation and monitoring of our risk and oppor-tunities profile, we assess the financial impact of risks and op-portunities based on three categories derived in relation to our EBITA:
Minor: up to 5 % of current EBITA
Moderate: up to 25 % of current EBITA
Severe: more than 25 % of current EBITA
The interval of the risk’s impact relates to the EBITA of the Group or segment provided that an individual assessment relates to a specific segment. The presented effects always reflect the effects of (counter)-measures implemented, thereby representing a net assessment of risks and opportunities.
We assess the probability of individual risks and opportunities occurring on a scale of 0 % to 100 % and assign it to one of three categories:
Unlikely: up to 5 % probability of occurrence Possible: up to 25 % probability of occurrence Very likely: more than 25 % probability of occurrence
The measurement of individual risk and opportunity categories reflects a period of five years based on our medium-term plan unless another period is indicated in the individual categories.
Financial opportunities and risksDue to the nature of our business, we are exposed to an array of financial risks, including default, liquidity and market risks. The Group’s financial risk management strategy concentrates on the identification, evaluation and mitigation of risks, focusing on mini-mising the potential negative impact on the Company’s financial performance. We use derivative financial instruments to hedge particular risk items. The financial risk management strategy is implemented by Group Treasury. Group management defines the areas of responsibility and necessary controls related to the risk management strategy. Group Treasury is responsible for defining, evaluating and hedging financial risks in close consul-tation with the Group’s operating units.
Capital risk managementNORMA Group’s objective when it comes to managing its capi-tal is primary the long-term servicing of its debts and remaining financially stable. In connection with our financing agreements, we are obliged to maintain certain financial indicators (financial covenants), such as interest cover ratio, total net debt cover (debt divided by adjusted consolidated EBITDA) and consolidated equity as a percentage of assets. These key figures and their maintenance are continually monitored. As part of our capital risk management, we monitor net debt in all our accounts, which are managed in accordance with accepted accounting principles.
Default risksDefault risk is the risk of our contractual partners not meeting their obligations arising from business and financial transactions. Default risk results from deposits and other transactions con-cluded with credit and financial institutions, and primarily from the risk of customers defaulting on outstanding receivables or confirmed transactions. We review the creditworthiness of new customers to minimise the risk of default on trade receivables. In addition, we generally only supply customers whose credit ratings are below Group standards or who have defaulted on payment if they pay in advance. We have a diversified customer portfolio, which reduces the financial repercussions of default risks. For this reason, we believe that it is possible for default risks to occur, while the potential financial repercussions would be minor due to the implemented countermeasures.
Liquidity opportunities and risksPrudent liquidity risk management requires us to hold sufficient cash funds and marketable securities, have sufficient financing from committed lines of credit and be able to close out market positions. Due to the dynamic nature of the underlying business, Group Treasury aims to maintain flexibility in financing by keeping committed credit lines available. Therefore, our primary objective is to ensure the uninterrupted solvency of all Group companies.
Financial Management, p. 60. Group Treasury is responsible for liquidity management and therefore for minimising liquidity risks. As at 31 December 2013, NORMA Group’s liquid assets (Cash and Cash equivalents) amounted to EUR 194.2 million (31 December 2012: EUR 72.4 million). We also have a high level of financial flexibility thanks to a total of EUR 125 million in commit-ted revolving credit lines with national and international credit institutions. These lines were drawn down in the amount of EUR 5.5 million as at 31 December 2013.
We see financial opportunities, among other things, in NORMA Group’s high creditworthiness as well as its solid financial posi-tion, financial performance and cash flows, which enable us to gradually reduce our capital costs. For instance, we succeeded in further optimising NORMA Group’s operational flexibility by issuing a promissory note loan in the amount of EUR 125 million in the summer of 2013. On the one hand, the promissory note

101Consolidated Management Report
Risk and Opportunity Report
loan enabled us to access a new investor group; on the other, we were able to extend the maturity profile of our liabilities to five, seven and ten years. The financing terms of the promissory note loan were fully twisted into an attractive fixed interest rate so that future interest rate risk can be ruled out. We estimate the financial opportunities based on our good reputation on the capital mar-ket to be possible with a moderate impact on net profit or loss.
The Group’s financing agreements contain typical terms for credit lines (financial covenants). If we do not adhere to these terms, the banks would be entitled to re-evaluate the agreements and demand early repayment. Failure to comply with these loan cov-enants would have severe potential financial repercussions. For this reason, we continuously monitor our compliance with the financial covenants in order to implement suitable measures in advance and prevent the terms from being violated. We were able to further minimise the likelihood of liquidity risks negatively impacting NORMA Group’s operations by increasing our financial flexibility compared to the previous year. In our view, non-com-pliance with financial covenants remains unlikely due to our high profitability and strong operating cash flow.
Foreign currency trendsAs an international company, we are active in more than 100 countries, which exposes us to foreign currency risks. We regard our main risky currency positions to be the US dollar, British pound, Chinese renminbi, Polish zloty, Czech koruna, Swedish krona, Thai baht, and Turkish Lira.
Since our distribution sites in Turkey and Thailand settle their transactions largely in local currency, the influence of the foreign exchange rate trends of the Thai baht and Turkish lira against the euro is increased due to the current political situation. However, in light of these countries’ limited contribution to NORMA Group’s total sales, we expect that the resulting foreign currency effects will be comparatively moderate.
Foreign currency risks that cannot be offset against each other are hedged using futures and options whenever necessary (in-cluding the US dollar, Swedish krona, Japanese yen and British pound). The high volatility of many major currencies and the par-ticular influence of the US dollar on the Group’s financial position and performance represent a significant risk that can only be partially hedged for a short-term period. We reduce the medium- term risk through an increasingly regional approach to production.
Because the Group’s subsidiaries operate in the most important countries with currencies other than the euro, it has sufficient cash-in and cash-out capabilities to absorb short-term exchange rate fluctuations via targeted income and expenditure manage-ment. In addition, currency risk is monitored in the Group and
transferred to the euro over time on a rolling basis by means of derivative hedging instruments if the risk becomes too excessive, whereby translation risk, i.e. the risk of fluctuations in the value of the net assets of our Group companies as a consequence of changes in exchange rates, is intentionally not hedged using hedging instruments due to NORMA Group’s long-term engage-ment. Translation effects from items in the statement of financial position and income statement of subsidiaries in foreign currency areas on the consolidated statement of financial position prepared in euros are unavoidable. Currency risks are very likely to occur due to the ongoing exchange rate volatility. In addition, the ex-pected rising share of our business activities in foreign currency areas, in particular in emerging markets, signifies additional currency risk for NORMA Group. Nevertheless, we regard the poten tial financial effects of currency risks to be moderate under consideration of our countermeasures. In contrast, our assess-ment of the opportunities for an advantageous development of foreign exchange rates is more cautious; we thus regard the probability of a positive impact on our business success to be possible and the financial scope to be moderate. In addition, we are pur posely expanding our opportunities in the area of foreign currencies by further localising our production and the payment and currency flow of equivalent internal financing and can thus further reduce our currency exposure.
Changes in interest ratesChanges in global market interest rates affect future interest pay-ments for variable-interest liabilities and can therefore have an adverse effect on the Group’s financial position, financial perfor-mance and cash flows. NORMA Group’s interest change risk arises in particular from long-term loans.
However, it is limited to the utilisation of the revolving credit line (EUR 5.5 million as at 31 December 2013), because neither the existing bank financing nor the individual tranches (five, seven, and ten years) of the issued promissory note loan are subject to interest rate risk. In order to further reduce interest change risks, we intend to use excess cash flow from operating activities in the medium term to limit the debt/equity ratio or to reduce our net financial liabilities. We will aim to hedge approximately 80 % of the interest change risk arising from future medium-term utilisa-tion of the committed revolving credit facility.
As a result of the currently low interest rate level and the first signs of a more restrictive monetary policy, we regard the risk of inter-est rate hikes in the medium term to be very likely; however, they will only have a minor impact due to NORMA Group’s financing structure. Accordingly, we also consider the potential for oppor-tunities that can arise from a falling interest rate level to be un-likely and the financial effects of such a development to be minor.

NORMA Group SE Annual Report 2013102
Economic and cyclical opportunities and risks The success of NORMA Group depends heavily on macroeconomic trends on its sales markets and its customers’ sales markets. Therefore, we take into account the indicators for economic development worldwide both in the planning as well as in our risk and opportunities management. In order to gauge the macro economic trend, we mainly use the forecasts of widely regarded institutions such as the IMF, the Bundesbank and reputable economic research institutes. Accordingly, global growth of 3.7 % can be expected in 2014. We regard positive development over and above this level to be an opportunity. As a result of our flexible production structures, we can expand our capacities on short notice and thereby react to a general increase in demand. We consider it possible for the economic situation worldwide to improve considerably within a framework that can moderately impact our earnings. In addition, we consider the possibility of a positive deviation from the assumptions on which our planning for the AsiaPacific region is based to be very likely.
Nevertheless, we see risks that can offset these forecasts, which is reflected in our Groupwide risk management. We regard a weakening of the global economy under consideration of the strained budget situation of numerous countries in the EMEA region and the USA as well as the politically uncertain situation in some countries in the AsiaPacific region to be unlikely. If these factors should nevertheless impact global demand, the financial effects for NORMA Group compared to our plan would be moderate.
Industry-specific and technological opportunities and risks Industryspecific opportunities and risks can arise for NORMA Group in particular due to technological and competitive changes. The increasing importance of new technologies, such as environmentally friendly drivetrain technologies, could also lead to increased competitive pressure and greater price pressure. We counter these risks with continuous initiatives to safeguard and expand our position as a technological and innovative leader as well as by focusing on customers and markets. Research & Development, p. 61.
The global megatrend toward “green” technologies presents challenges to many of our customers and their finished products and offers excellent growth prospects for NORMA Group. Since we concentrate our product developments on innovations in this area, we regard this change as an opportunity. It can be assumed that regulatory measures such as the Euro6 Standard on emissions and incentive programmes will be established in other countries, which will lead to increased demand for environmentally friendly technologies and products. We have already secured additional order volume and thus participate in the development of these markets thanks to early and innovative developments in these areas. Therefore we regard the likelihood of future positive
developments in this area that go beyond the scale of our planning as possible based on the current discussion on tightening environmental standards. This would have a moderate impact on our performance. For the AsiaPacific region, we estimate the likelihood of future positive stimulus to be high – also with moderate effects on regional earnings – as a result of our transfer of existing technologies from other regions and the rising technological demands of customers in the region.
Our strong diversification in terms of customers in different industries is another element of our risk and opportunity management. We counter longterm, industryspecific risks and opportunities through consistent innovation policy and regular market analyses. As a result, we consider it unlikely that industryspecific or technological risks will occur. We consider the potential for financial effects to be minor.
Risks and opportunities associated with corporate strategyThe Group’s strategic orientation was advanced in 2013 through investments in growth markets, the expansion of the second production site in China (Changzhou) and the expansion of existing markets in Australia, Poland and Brazil.
The goal of these acquisitions is to expand our presence in existing markets and to develop new emerging markets with attractive growth potential. As a result of our global orientation, we can also set up production processes that entail a more labourintensive assembly in countries with lower wage costs, thereby securing and further increasing our profitability. We also continue to constantly observe the markets and identify opportunities for strategic acquisitions or equity holdings to complement our organic growth. We use targeted acquisitions to continuously strengthen our position as a technology leader, exploit market opportunities and improve the services we offer our customers and expand our product range.
In addition, we work together closely with our customers across all business processes. New products are created already in the product and application development phases in constant coordination with our customers. Our two distribution channels, Engineered Joining Technology and Distribution Services, are oriented toward the special needs of our customers. We will continue to develop our markets in collaboration with our customers in the future.
We invest around 4 % of EJT sales in Research and Development every year. We are consolidating our competitive position as a technology leader and increasing NORMA Group’s innovative capacity as a result of this focus on developing new technologies, products and solutions, as well as on improving existing ones, and can thereby realise cost advantages in the medium term.

103Consolidated Management Report
Risk and Opportunity Report
We consider this strategic orientation to be the basis for creating longterm potential for opportunities. Therefore, we estimate the intermediate impact of our strategy to be moderate and expect a potential positive deviation from our plan.
Nevertheless, misjudgement with respect to the Group’s strategic orientation and its market potential or cus tomer rejection of newly developed products cannot be ruled out and can have a negative effect on NORMA Group’s competitive position and sales volume. In order to avoid strategic risks, we observe our market environment and our competitors and conduct customer and supplier surveys for continual improvement. Purchasing and Supplier Management, p. 81. Therefore, we consider strategic risks to be unlikely to occur, whereas the potential finan cial effects for financial year 2014 are regarded as moderate.
We adjust our corporate strategy in the individual segments to the individual market conditions; nevertheless, the general appraisal of strategic risks and opportunities in the regions is identical.
Performance-related opportunities and risks Commodity pricesThe materials we use, in particular the raw materials steel and plastics, are subject to the risk of price fluctuations. The price trend is also influenced indirectly by the further development of the world economic situation as well as by institutional investors. NORMA Group limits the risk of rising purchase prices through systematic material and supplier management. In this context, an efficient Group purchasing structure was built up around the world in order to utilise the Group’s economies of scale in the procurement of the most important product areas of steel, metal components, polyamides and rubber materials and to procure them as competitively as possible. This Grouppurchasing structure also enables us to balance out the risks of individual segments with each other. We also constantly strive to secure permanently competitive procurement prices by continuously optimising our selection of suppliers and applying the BLC approach. We also try to reduce dependency on individual materials through constant technological advances and tests of alternative materials. We protect ourselves against commodity price volatility by forming procurement contracts with a term of up to 12 months, whereby material supply risks are minimized and price fluctuations can be better calculated. Purchasing and Supplier Management, p. 81.
Although we consider it possible for prices to rise based on the positive growth forecasts for the global economy, this would only have a minor financial effect as a result of the countermeasures initiated in the financial year just ended. Since we can transfer a portion of changes in our material prices to our customers through the structure of our contractual documents, falling commodity prices are also not a significant performance factor for
us. Therefore, we estimate the opportunities arising from falling commodity prices to be minor, whereby a declining global commodity price trend is possible in China due to poorer economic expectations.
Suppliers and dependencies on key suppliersThe loss of suppliers and dependency on individual suppliers can lead to material shortages and thus to negative impacts on the Group’s activities. In order to minimise this risk, we only work with reliable and innovative suppliers who meet our quality requirements. The ten most important suppliers are responsible for approximately 32 % of our purchasing volume. Purchasing and Supplier Management, p. 81. This and other key suppliers are regularly observed and assessed as part of our quality management. If the loss of a supplier appears imminent, we evaluate alternatives immediately. For instance, we were able to offset the loss of an important supplier for the plastic granule PA12 in 2012. As a result, we consider it possible that we may lose suppliers and continue to regard the potential financial impact as minor. However, we also see opportunities in this area as a result of our proactive approach both in our existing supplier relationships as well as in the identification of new suppliers and raw materials. But since we also anticipate an optimisation in the area of purchasing in the medium term, we estimate the potential of our implemented measures for a positive deviation from our planning to be possible with a minor impact. (reference to Section on Purchasing)
Quality and processesOur products are often functioncritical with respect to the quality, performance and reliability of the final product. Therefore, the reliable guarantee of product quality is a key factor to ensuring NORMA Group’s longterm success, so that our products provide crucial added value for our customers. Organisational and Process Advantages, p. 78. Maintaining the right balance between cost leadership and quality assurance is a constant challenge. We use farreaching quality assurance measures and Groupwide quality standards to reduce this risk, and also focus on innovative and value added joining solutions tailored to meet customer requirements. For this reason, we believe that it is possible for quality risks to occur, while the potential financial repercussions would be minor due to our existing insurance coverage.
We take every opportunity to realise cost advantages to improve our competitive position. We develop and implement initiatives focused on cost discipline, the continuous improvement of processes in all functions and regions and optimisation of supply chain management and production processes. We expect these initiatives to have a positive impact on our business. Organisational and Process Advantages, p. 78. Since we pursue a continuous process of improvement, there are opportunities over and above our planning for positive deviations in the area of these

NORMA Group SE Annual Report 2013104
processes. This applies for all regions in which NORMA Group is active. We estimate the likelihood of costsavings to be possible. However, since our planning allows for an optimisation of production processes and our processes are already extremely efficient, the shortterm financial impact of a deviation from the plan as a result of improved production processes is minor.
CustomersCustomer risks result from a company being dependent on important buyers for a significant proportion of its sales. They could take advantage of their bargaining power, which can lead to increased pressure on our margins. Decreases in demand from these customers or the loss of these customers can have a negative impact on NORMA Group’s earnings. For this reason, we continuously monitor incoming orders and customer behaviour so as to identify customer risks early. We also have a diversified customer portfolio, which reduces the financial repercussions of customer risks. Accordingly, no single customer generated more than 6 % of our sales in the 2013 financial year. Average annual sales per customer are only kEUR 60. Therefore, it is possible that customer risks could have a negative impact on our business, but the financial effects would be minor due to our diversified customer structure.
However, based on our strategy and the goal of further ex panding our markets, we managed to expand our customer portfolio compared to the previous year. We can excite new customers for our products in all regions as a result of our innovative solutions and therefore estimate the opportunities for positive deviations from our planning as possible with a minor impact on our earnings based on a growing number of customers. For the APAC region, our planning is based on the assumption of likely positive effects with a moderate impact on regional earnings due to the dy namic market environment and our continuous growth strategy.
Opportunities and risks of personnel managementOur success is largely dependent on our employees’ enthusiasm, commitment to innovation, expertise and integrity. The Group’s personnel management serves to retain and expand this core expertise. The exit of employees with crucial skills as well as a shortage of suitable workers can have a negative impact on our operations. The competition for the most talented employees as a result of demographic developments and the shortage of skilled labour in Western industrial nations is becoming more and more intense.
We counter these risks with farreaching basic and advanced training as well as employee development programmes. We also encourage our employees to focus on the Company’s success through variable remuneration systems. In return, our employees contribute to the continuous further development of NORMA
Group in connection with employee surveys and improvement initiatives. Comprehensive representation rules and a division of responsibilities that promote mutual exchange secure us from risks that can arise due to the departure of employees. When identifying potential new employees that can make a crucial contribution to performance, we seek the advice of external human relations advisors.
Since NORMA Group’s personnel policy is practiced worldwide, the risks and opportunities are consistent across the regions. We regard the probability of personnel risks occurring as possible, whereas the potential financial impact is minor due to our sustainable personnel policy.
In addition, there are opportunities from the consistent further development of our employees. We foster our employees and offer them incentives to further develop their personal expertise through numerous educational and training opportunities as well as the targeted search for talent within the Group. In addition, we offer our employees a broad range of additional services (free health checkups, flexible and familyfriendly working time models, etc.) which contribute on the whole to a high degree of employee satisfaction – measured by means of a semiannual employee survey – and a low fluctuation rate of only six percent Groupwide (excluding China and Mexico). Employees, p. 84.
We actively promote the retention and expansion of knowhow in the Company through the aforementioned measures, wherein we see an opportunity for the future development of NORMA Group whose impact on our further success we regard as very likely. However, since the financial performance beyond our planning is oriented on the very long term, we estimate the financial impact of these opportunities to be minor.
IT-related opportunities and risks Maintaining and exchanging complete, timely and appropriate information as well as being able to utilise functional and powerful IT systems are of central importance for an innovative and global company such as NORMA Group. An extensive com puter system failure could disrupt our operations or expose sensitive corporate information. Therefore, we have implemented appropriate measures to avoid and reduce this type of risk. These measures are collectively embedded in our IT risk management process and are adjusted in this context to changing conditions. NORMA Group controls identifiable IT risks, for example, by mirror ing the database, maintaining decentralised data and outsourcing data archiving to a certified external provider. The Group’s data processing centre in Frankfurt / Main is also used by other Group companies for their ERPsystems. Another data centre is located in the USA, with smaller backup systems in Asia, which were transferred to a regional data centre in Singapore in

105Consolidated Management Report
Risk and Opportunity Report
2012. The access of employees to sensitive information is ensured by means of authorisation systems customised for the respective positions, taking into account the principle of separation of functions. IT systems used in the area of production are being doubled in order to reduce risks. Potential risks are also taken into account through early planning as well as by creating suitable transition solutions.
Based on global standards, we estimate the probability of ITrelated risks occurring in all regions to be possible and the potential financial impact to be minor. Opportunities in the area of IT arise in particular from the potential of process standardisation and optimisation across all companies of NORMA Group. For instance, the gradual replacement of older ERPsystems with new, Groupwide uniform systems was once again advanced in 2013. We regard the opportunities arising from this standardisation to be very likely and expect the financial impact to be very minor.
Legal opportunities and risks Risks related to violations of standardsFuture changes to legislation and requirements in general commercial law, liability law, environmental law, tax law, customs law and labour law, as well as changes in related standards, could have a negative impact on NORMA Group’s development. We use our existing compliance and risk management systems to ensure that we comply with constantly changing laws and regulations.
Corporate Governance Report, p. 40. Consequently, we consider risks related to violations of intellectual property rights as unlikely to occur and the potential financial impact to be moderate.
Any legal risks of which we are aware are taken into account through provisions recognised in the consolidated financial statements. We are not aware of any other significant risks.
Social and environmental standardsViolating social and environmental standards could damage the reputation of NORMA Group. Therefore, we have implemented corporate responsibility as an integral part of our Group strategy.
Corporate Responsibility, p. 88. In this context, a systematic environmental management system was introduced at NORMA Group so that corporate decisions can always be evaluated also considering the goal of avoiding emissions and conserving resources. Environmental Protection, p. 90. We also invest in the area of occupational health and safety. Occupational Health and Safety, p. 89. Consequently, we believe that negative developments remain unlikely to occur as a result of social and environmental risks and that the potential financial effects would be moderate.
However, our investments in the area of Corporate Re sponsibility serve not only to ward off risks. We also see the measures and
initiatives as having the potential to positively impact both our business environment as well as NORMA Group and its stakeholders. Therefore, we estimate the opportunities in this area to be possible. We assume that the measures and initiatives will have a minor impact on our planning overall.
Violations of intellectual property rightsNORMA Group’s position as a technology and innovation leader means that violations of our intellectual property rights could lead to lost sales and reputation. For this reason, we ensure that our technologies and innovations are legally protected. We also minimise the potential impact by developing customerspecific solutions and through the speed of our innovation. At the same time, it is also possible for NORMA Group to violate the intellectual property of third parties. For this reason, we review our developments for potential patent violations at an early stage. Therefore, we consider it possible for our intellectual property to be violated. Due to the countermeasures that we have implemented, we believe that the potential impact of an intellectual property violation would be minor. In addition, we also see potential opportunities that can lead to a minor deviation from our medium term plan as a result of the consistent defence of our intellectual property and the expansion of legal unique selling points.
ASSESSMENT OF THE OVERALL PROFILE
OF OPPORTUNITIES AND RISKS
BY THE MANAGEMENT BOARD
The Group’s overall situation results from the aggregation of individual risks and opportunities from all categories of the business units and functions. After assessing the likelihood of risks occurring and their potential financial impact as well as in light of the current business outlook, NORMA Group’s Management Board does not believe that there is any individual risk or group of risks with the potential to jeopardise the continued existence of the Group or individual Group companies as a going concern. Taking the aggregated opportunities into account, we are in an excellent position with respect to both the medium and long terms to further expand our market position and to grow globally. This assessment is reinforced by the good opportunities to cover our financing requirements. Therefore, NORMA Group has not made any effort to obtain a rating from a leading rating agency.
General economic risks remain for NORMA Group in all areas, which is why setbacks on the way towards longterm realisation of our growth and profitability targets cannot be ruled out. In contrast, there are clear opportunities that we are taking advantage of through our strategy and consistent opportunity management, so that it is possible for us to exceed our profitability targets.

NORMA Group SE Annual Report 2013106
OPPORTUNITY AND RISK PORTFOLIO OF NORMA GROUP 1)
Probability Impact
unlikely possible likely
Change in 2013 minor moderate major
Change in 2013
Financial risks and opportunities
Default • •
Liquidity – Risks • •
– Opportunities • •
Currency – Risks • •
– Opportunities • •
Interest – Risks • •
– Opportunities • •
Economic risks and opportunities
Risks • •
Opportunities 2) • •
Industry-specific and technological risks and opportunities
Risks • •
Opportunities 2) • •
Risks and opportunities associated with corporate strategy
Risks • •
Opportunities • •
Operative risks and opportunities
Commodity pricing – Risks • •
– Opportunities • •
Supplier – Risks • •
– Opportunities • •
Quality and production – Risks • •
– Opportunities • •
Customer – Risks • •
– Opportunities 3) • •
Risks and opportunities of personnel management
Risks • •
Opportunities • •
IT-related risks and opportunities
Risks • •
Opportunities • •
Legal risks and opportunities
Disregard to standards • •
Social and environment – Risks • •
– Opportunities • •
Property rights – Risks • •
– Opportunities • •
1) Provided that not indicated differently, the risk assessment applies for all regional segments. 2) For the APAC region, we assume a positive deviation as likely whereas the financial impact is rated moderate. 3) For the APAC region, we assume a positive deviation as possible whereas the financial impact is rated moderate.
unchanged
higher
lower
new

107Consolidated Management Report
Remuneration Report for the Management and Supervisory Boards
Compared to the prior year, we have reduced the risks from currency, the economic environment and our strategy. All other risks have not changed since the previous year. However, the changes in individual risks and opportunities do not have a significant impact on NORMA Group’s overall risk profile. Therefore, in our opinion, the Group’s overall profile has essentially not changed since the previous year.
Remuneration Report for the Management and Supervisory Boards
REMUNERATION OF THE MANAGEMENT BOARD
Outline of the remuneration system for members of the Management BoardThe purpose of NORMA Group SE’s remuneration system is to provide the members of the Management Board with adequate remuneration for their activities and areas of responsibility as well as their personal performance in accordance with applicable legislation and to provide them with a longterm incentive to commit themselves to the success of the Company. In addition to the criteria of the Company’s performance and future prospects, the decision as to what level of remuneration is appropriate is also based on the general levels of remuneration paid by comparable companies and NORMA Group SE’s remuneration structure.
In accordance with the recommendations of the German Corporate Governance Code in the version dated 13 May 2013 ( Corporate Governance Report, p. 40), the remuneration comprises a fixed element and variable elements.
The basic remuneration is a fixed cash payment for the entire year based on the respective Management Board member’s area of responsibility. This basic remuneration is paid in the form of a monthly salary.
The variable element comprises multiple components.
1. The annual bonus is a variable cash payment calculated on the basis of the quantifiable performance of the Company in the previous financial year. The parameters taken into consideration are whether or not the Company reaches its target for an earnings component (adjusted EBITA) and a liquidity component (operating free cash flow before external use).
Each of the two indicators is calculated for a financial year based on figures taken from the Company’s consolidated finan cial statements and compared to the target set in advance by the Supervisory Board. The annual salary of the Management Board member is multiplied by a percentage between 0 % and 200 %, depending on the extent to which the targets for the components were met. The range limits the annual bonus to 50 % of the member’s annual salary. It can be reduced to EUR 0 if the company performs poorly.
OPPORTUNITY AND RISK PORTFOLIO OF NORMA GROUP SE
Risks Opportunities
Financial risks and opportunities Default
Liquidity
Currency
Interest
Economic risks and opportunities
Industry-specific and technological risks and opportunities
Risks and opportunities associated with corporate strategy
Operative risks and opportunities Commodity pricing
Supplier
Quality and production
Customer
Risks and opportunities of personnel management
IT-related risks and opportunities
Legal risks and opportunities Disregard to standards
Social and environment
Property rights

NORMA Group SE Annual Report 2013108
2. The Company’s longterm incentive (LTI) plan is a component of a variable remuneration element designed to maximise the Company’s longterm performance. The LTI plan also comprises an EBITA component (adjusted) and an operating free cash flow before external use (FCF) component, each of which are observed over a period of three years (performance period). A new threeyear performance period begins every year.
Both components are calculated by multiplying the average annual EBITA (adjusted) and FCFvalues actually achieved in the performance period by the EBITA (adjusted) and FCF bonus percentages specified in the employment contract. In a second step, the actual value of a component is compared to the mediumterm plan approved by the Supervisory Board to evaluate the Company’s performance and adjustments are made to the LTI plan. The LTI plan is limited to two and a half times the amount that would be arrived at on the basis of the figures in the Company’s mediumterm plan. If the actual value is lower than the planned value, the LTI plan is reduced on a straightline basis down to a minimum of EUR 0 if the threeyear targets are missed by a significant amount.
3. The matching Stock programme (MSP) provides a share pricebased longterm incentive to commit to the success of the Company. The MSP is a stock option programme. To this end, the Supervisory Board specifies a number of stock options to be allotted each financial year with the proviso that the Management Board member makes a corresponding personal investment in the company.
The MSP is split into five tranches. The first tranche was allotted on the day of the initial public offering (8 April 2011). The other tranches will be allotted on 31 March each following year. The stock options relate to those shares allotted or acquired and qualified under the MSP as specified in the Management Board contract. The number of stock options is calculated by multiplying the qualified shares (for 2011, 2012 and 2013: 108,452 shares per year) held at the allotment date by the option factor specified by the Supervisory Board. The option factor is redetermined for each tranche and amounts to 1.5 for each of the tranches in 2011, 2012 and 2013. Therefore, 162,679 share options are to be taken into account in financial years 2011, 2012 and 2013. Every tranche will be recalculated taking changes in the influencing factors into consideration and accrued pro rata temporis over the vesting period.
The vesting period is four years and ends on 31 March in 2015, 2016 and 2017 respectively for the 2011, 2012 and 2013 tranches. The options in a tranche can only be exercised within a period of two years after the vesting period expires. As a precondition for exercising the options, the share price must exceed the exercise threshold when the options are exercised
(basis: weighted average of the last ten exchange trading days before exercising the option). The exercise threshold is set by the Supervisory Board when the respective tranche is allo cated and equals at least 120 % of the strike price. The exercise threshold was set at 120 % of the strike price for the 2011, 2012 and 2013 tranches. The strike price for the 2011 tranche corresponds to the initial offering price at the time of the IPO; i. e. the issuing price set at the end of the book building phase for the shares offered publicly during the IPO. The weighted average closing price of the Company’s share for the last 60 exchange trading days directly preceding the allocation of the respective tranche applies when determining the strike price of the other tranches. Dividend payments from the Company during the vesting period are to be deducted from the exercise price of the respective tranche. The value of the stock options is calculated based on generally accepted business valuation models.
When the options are exercised, the Company is free to decide whether to settle them in shares or in cash. The 2011, 2012 and 2013 tranches are expected to be settled in equity instruments (no cash settlement).
The members of the Management Board are additionally compensated with a company car which they can also use for personal purposes. Furthermore, Management Board members are reimbursed for any expenses and travel costs incurred while performing their duties for the Company in accordance with the Company’s respectively applicable guidelines. The members of the Management Board arrange private insurance or are personally responsible for the statutory deductible of 10 % of the loss for the D&Oinsurance policy carried for the Managing Directors of NORMA Group.
Remuneration of the Management Board in the 2013 financial year The remuneration for the Management Board totalled EUR 3.93 million (2012: EUR 2.4 million.). This figure comprises EUR 1.38 million in fixed elements and EUR 2.55 million in variable elements.
The variable elements comprise the shortterm performancebased annual bonus and the two longterm performancebased LTI and MSP schemes.
MATCHING STOCK PROGRAMME (MSP)
Tranches
Option factor
Number of options
Exercise price
End of the
vesting period
2011 1.5 162,679 21.00 EUR 2015
2012 1.5 162,679 17.87 EUR 2016
2013 1.5 162,679 23.71 EUR 2017

109Consolidated Management Report
Other Legally Required Disclosures
A provision was recognized for the variable compensation elements. The stock options associated with the MSP scheme were reported as reserves in accordance with IFRS 2.
The Annual General Meeting held on 6 April 2011 resolved not to disclose the remuneration for individual Management Board members between 2011 and 2015 in accordance with sen tences 5 to 9 of section 314(1) no. 6 letter a) HGB.
REMUNERATION OF THE SUPERVISORY BOARD
The remuneration for the Chairman and the Deputy Chairman of the Supervisory Board was calculated separately in accordance with the recommendations of the German Corporate Governance Code in the version dated 13 May 2013. The Chairman is paid double the remuneration of the other members of the Super visory Board, and the Deputy Chairman is paid one and a half times this amount. In addition, the Chairman and members of the Super visory Board’s committees are remunerated separately.
The Supervisory Board members will be remunerated for their activities on the day after the 2014 Annual General Meeting as follows:
Supervisory Board member
Membership / Chairmanship of a committee
Remuneration in EUR
Dr. Stefan Wolf – Chairman of the Supervisory Board
– Chairman of the General and Nomination Committees
110,000.00
Lars M. Berg – Deputy Chairman of the Supervisory Board (since 8 February 2013)
– Member of the Audit Committee– Member of the General and
Nomination Committees (since 8 February 2013)
91,356.16
Günter Hauptmann
– Not a member of a committee 50,000.00
Knut J. Michelberger
– Member of the Audit Committee 60,000.00
Dr. Christoph Schug
– Chairman of the Audit Committee– Member of the General and
Nomination Committees
95,000.00
Erika Schulte (appointed effective 18 February, 2013)
– Not a member of a committee 43,424.66
Total 449,780.82
No remuneration was paid to Supervisory Board members in financial year 2013 for services personally rendered (in particular advisory and brokerage services).
Furthermore, the Supervisory Board members are reimbursed for any expenses and travel costs incurred while performing their duties for the Company in accordance with the Company’s respectively applicable guidelines. The members of the Super visory Board arrange private insurance or are personally responsible for the statutory deductible of 10 % of the loss for the D&O insurance policy carried for the Management Board and the Supervisory Board of NORMA Group.
Other Legally Required Disclosures
ADDITIONAL INFORMATION REQUIRED UNDER THE
GERMAN TAKEOVER DIRECTIVE IMPLEMENTATION ACT
(ÜBERNAHMERICHTLINIEN-UMSETZUNGSGESETZ)
An overview of the information required under section 315(4) of the German Commercial Code (Handelsgesetzbuch, HGB) is presented below:
Section 315(4) no. 1 HGB
NORMA Group SE’s share capital totalled EUR 31,862,400.00 on 31 December 2013. This is divided into 31,862,400 registered shares with no par value. Each share entitles the bearer to one vote. There are no other classes of shares. NORMA Group SE holds no treasury shares.
Section 315(4) no. 2 HGB
The Management Board of NORMA Group SE is not aware of any restrictions affecting voting rights or the transfer of shares or any agreements between shareholders which could result in such restrictions.
Section 315(4) no. 3 HGB
There are no direct or indirect capital holdings exceeding one tenth of the voting rights other than those voting rights listed in the Notes to the consolidated financial statements.
Section 315(4) no. 4 HGB
There are no shares in NORMA Group SE that confer special control rights to the holder.
Section 315(4) no. 5 HGB
There are no employee share schemes through which employees can acquire shares of NORMA Group SE. Employees with shareholdings in NORMA Group SE exercise control rights in the same way as other shareholders in accordance with applicable legislation and the Articles of Association.

NORMA Group SE Annual Report 2013110
Section 315(4) no. 6 HGB
Management Board members are appointed and dismissed in accordance with section 84 et seq. of the German Stock Corporation Act (Aktiengesetz, AktG). The Articles of Association of NORMA Group SE do not contain any provisions related to this issue that contradict the applicable legislation. The Supervisory Board is responsible for determining the actual number of members on the Management Board. It can nominate a Chairman and Deputy Chairman of the Management Board or a Management Board spokesperson and a deputy spokesperson.
Changes to the Articles of Association are made by the Annual General Meeting in accordance with section 179(1) AktG. In accordance with section 179(1) sentence 2 AktG, the Annual General Meeting can authorise the Supervisory Board to make changes which affect only the wording of the Articles of Association. The Annual General Meeting of NORMA Group SE has chosen to do so: According to Article 14(2) of the Articles of Association, the Supervisory Board is authorised to make changes to the Articles of Association which only affect their wording. In accordance with article 20 sentence 3 of the Articles of Association, a simple majority of votes submitted is sufficient for a resolution on changing the Articles of Association if at least half of the share capital is represented when the resolution is adopted and a different majority is not required under the law.
If the Management Board exercises its right to retire treasury shares without a capital decrease and thereby increases the proportion of the share capital represented by the remaining shares, it is authorised to alter the number of shares in the Articles of Association. The Supervisory Board is authorised to alter the wording of the Articles of Association after capital increases from authorised capital 2011/II or following the expiry of the authorization period if this authorised capital is not used.
Section 315(4) no. 7 HGB
Authorised capital 2011/IIWith the approval of the Supervisory Board, the Annual General Meeting held on 6 April 2011 authorised the Management Board to increase the company’s share capital to a total of EUR 15,931,200.00 until 5 April 2016 through the issue of up to 15,931,200 new registered, noparvalue shares in exchange for cash or noncash contributions (authorised capital 2011/II). With the approval of the Supervisory Board, the Annual General Meeting held on 6 April 2011 authorised the Management Board to increase the company’s share capital to a total of EUR 15,931,200.00 until 5 April 2016 through the issue of up to 15,931,200 new registered, noparvalue shares in exchange for cash or noncash contributions (authorised capital 2011/II). Article 5 of NORMA Group SE’s Articles of Association adopts the provisions on the Company’s Authorised Capital 2011/II from article 5 of NORMA Group AG’s Articles of Association prior to
the transformation. The only change compared to the Articles of Association of NORMA Group AG is the additional clarification that the Authorised Capital 2011/II only exists in NORMA Group SE to the extent remaining when the transformation went into effect, i. e. not yet used up.
The Management Board is authorised, subject to the Super visory Board’s approval, to disapply the preemptive rights of shareholders for one or more capital increases in connection with the authorised capital for fractional amounts resulting from the shareholders’ subscription ratio, for capital increases in exchange for noncash contributions, in particular to acquire companies, for capital increases in exchange for cash contributions limited to a maximum of 10 % of the share capital, provided the issue price is not significantly lower than the stock market price (simplified disapplication of preemptive rights in accordance with section 186(3) sentence 4), to fulfil obligations resulting from conversion and option rights or profit participation rights or participating bonds.
Contingent capitalArticle 6 of NORMA Group SE’s Articles of Association adopts the Contingent Capital 2011 from article 6 of NORMA Group AG’s Articles of Association prior to the transformation and also clarifies that the Contingent Capital 2011 only exists to the extent remaining when the transformation went into effect, i. e. capital increases under article 6 of NORMA Group AG’s Articles of Association have not yet been carried out. The share capital was contingently increased by up to EUR 12,505,000.00 by issuing up to 12,505,000 new registered, noparvalue shares with dividend rights from the beginning of the financial year in which they were issued (contingent capital 2011). With the approval of the Supervisory Board, the Management Board is authorised to issue bonds with warrants or convertible bonds and convertible profit participation rights one or more times until the end of 5 April 2016 and to grant the bondholders or creditors of the bonds conversion or option rights on up to 12,505,000 new shares of NORMA Group SE with a proportionate interest in the share capital of up to EUR 12,505,000.00.
The purpose of the contingent capital increase is to grant shares to the holders or creditors of bonds with warrants or convertible bonds and profit participation rights with warrants or conversion rights which are issued by the Company or any company in which the Company owns a majority interest or which depends on the Company until the end of 5 April 2016 in accordance with the resolution of the Annual General Meeting held on 6 April 2011. The contingent capital increase is only carried out to the extent that holders of the aforementioned bonds with warrants or convertible bonds or profit participation rights with option or conversion rights exercise these options or conversion rights, or conversion obligations arising from such bonds are fulfilled and

111Consolidated Management Report
Other Legally Required Disclosures
that the Company’s treasury shares or new shares from the autho rized capital are used for this purpose.
Authorisation to acquire treasury sharesThe Annual General Meeting held on 6 April 2011 authorised NORMA Group SE to acquire treasury shares up to a total of 10 % of the share capital existing when the resolution was passed over the stock market or by means of a purchase offer extended to all of NORMA Group SE’s shareholders in accordance with section 71(1) no. 8 AktG. This authorisation may be exercised as a whole or in partial amounts on one or several occasions until 5 April 2016. The acquisition price (excluding transaction costs) may not deviate by more than 10 % from the arithmetic average of the closing price of the shares of NORMA Group SE in XETRA trading or a successor system of the Frankfurt Stock Exchange over the five trading days immediately preceding the acquisition or the assumption of an obligation to acquire shares over the stock market or the publication of a public offer.
The authorisation may be exercised for any purpose permitted by law. The Management Board is authorised to retire all or part of the acquired shares with the approval of the Supervisory Board, whereby the Management Board may require the shares to be retired without a capital decrease, but is under no obligation to do so. Other than selling them on the stock market or offering them to all shareholders while partially or completely disapplying preemptive rights, the Management Board is also specifically authorised to use shares acquired on the basis of the aforementioned authorisation for any of the following purposes with the approval of the Supervisory Board: to disapply fractional amounts resulting from the subscription ratio from shareholders’ preemptive rights, for sale in exchange for noncash contributions, in particular as part of the acquisition of companies, for sale in exchange for cash contributions, provided the price is not significantly lower than the stock market price (simplified disapplication of preemptive rights in accordance with section 186(3) sentence 4 and section 71(1) no. 8 sentence 5 half sentence 2 AktG, limited to a maximum of 10 % of the share capital), to fulfil obligations resulting from conversion and option rights or conversion obligations.
The Management Board of NORMA Group SE has yet to make use of this authorisation.
Section 315(4) no. 8 HGB
The promissory note loan that NORMA Group SE received in 2013 also includes the typical Change of Control Clause just as NORMA Group’s other financing agreements. In the event of a takeover by a third party, the possibility that NORMA Group would not be able to finance itself at similarly favourable terms and conditions cannot be ruled out.
Section 315(4) no. 9 HGB
NORMA Group SE has no agreements in place that provide compensation for members of the Management Board or employees in the event of a takeover bid. Please see the remuneration report for further details.
REPORT ON TRANSACTIONS WITH RELATED PARTIES
Apart from the reported, there were no significant transactions with related parties in financial year 2013. Notes, p. 174.
Maintal, 12. March 2014
NORMA Group SE
The Management Board
Werner Deggim Dr. Othmar Belker
Bernd Kleinhens John Stephenson
NORMA Group SE Annual Report 2013112
Consolidated Financial Statements
114 Consolidated Statement of Financial Position
116 Consolidated Statement of Comprehensive Income
117 Consolidated Statement of Cash Flows
118 Consolidated Statement of Changes in Equity
120 Segment Reporting

113Consolidated Financial Statements
CO
NS
OL
IDA
TE
D F
INA
NC
IAL
STA
TE
ME
NT
S
122 Notes to the Consolidated Financial Statements
176 Appendix to the Notes to the Consolidated Financial Statements
176 Notifications of Voting Rights178 Corporate Bodies
179 Responsibility Statement
180 Auditor’s Report
181 Further Information181 Glossary185 Overview by Quarter 2013186 Multi-year Overview

NORMA Group SE Annual Report 2013114
ASSETS
in EUR thousands
Note
31 Dec 2013
31 Dec 20121)
1 Jan 20121)
Non-current assets
Goodwill (20) 233,239 235,262 224,841
Other intangible assets (20) 92,910 92,478 78,940
Property, plant and equipment (21) 115,367 109,079 97,179
Other financial assets 0 0 397
Derivative financial assets 0 0 44
Income tax assets (18) 1,533 2,253 2,038
Deferred income tax assets (19) 7,515 6,061 6,420
450,564 445,133 409,859
Current assets
Inventories (25) 79,770 74,313 66,755
Other non-financial assets (26) 8,114 7,787 9,792
Derivative financial assets (23) 92 103 0
Income tax assets (18) 827 12,778 13,141
Trade and other receivables (24) 90,138 79,293 80,817
Cash and cash equivalents (36) 194,188 72,389 67,891
373,129 246,663 238,396
Total assets
823,693
691,796
648,255
Consolidated Statement of Financial Position
1) Restated due to effects from the application of IAS 19R. See: Section 2 Basis of preparation and Section 7 Change in accounting principles.

115Consolidated Financial Statements
Consolidated Statement of Financial Position
1) Restated due to effects from the application of IAS 19R. See: Section 2 Basis of preparation and Section 7 Change in accounting principles.
EQUITY AND LIABILITIES
in EUR thousands
Note
31 Dec 2013
31 Dec 20121)
1 Jan 20121)
Equity attributable to equity holders of the parent
Subscribed capital 31,862 31,862 31,862
Capital reserves (27) 215,927 213,559 212,252
Other reserves (27) – 13,857 – 8,550 – 2,668
Retained earnings (27) 84,966 51,289 14,908
Equity attributable to shareholders 318,898 288,160 256,354
Non-controlling interests (27) 1,004 1,021 444
Total equity 319,902 289,181 256,798
Liabilities
Non-current liabilities
Retirement benefit obligations (29) 10,869 10,319 8,407
Provisions (30) 5,284 4,558 3,495
Borrowings (31) 200,981 190,727 213,457
Other non-financial liabilities (32) 1,398 1,589 1,310
Other financial liabilities (33) 1,619 2,666 676
Derivative financial liabilities (23) 8,293 24,675 21,809
Deferred income tax liabilities (19) 32,970 32,940 33,775
261,414 267,474 282,929
Current liabilities
Provisions (30) 8,334 6,743 6,359
Borrowings (31) 125,127 50,969 28,917
Other non-financial liabilities (32) 22,407 19,600 21,877
Other financial liabilities (33) 4,676 2,225 1,527
Derivative financial liabilities (23) 6,977 114 18
Income tax liabilities (18) 15,831 17,827 8,457
Trade payables (34) 59,025 37,663 41,373
242,377 135,141 108,528
Total liabilities 503,791 402,615 391,457
Total equity and liabilities
823,693
691,796
648,255

NORMA Group SE Annual Report 2013116
Consolidated Statement of Comprehensive Income
in EUR thousands
Note
Q4 2013
Q4 20121)
2013
20121)
Revenue (9) 152,804 137,354 635,545 604,613
Changes in inventories of finished goods and work in progress
– 318
– 1,051
1,894
1,588
Other own work capitalised 2,275 1,086 3,377 1,671
Raw materials and consumables used (10) – 61,996 – 58,510 – 269,421 – 263,489
Gross profit 92,765 78,879 371,395 344,383
Other operating income (11) 2,690 3,547 6,983 9,536
Other operating expenses (12) – 20,424 – 18,752 – 79,370 – 76,626
Employee benefits expense (13) – 43,252 – 37,317 – 169,689 – 156,504
Depreciation and amortisation (20, 21) – 7,780 – 8,493 – 29,799 – 26,414
Operating profit 23,999 17,864 99,520 94,375
Financial income (14) 232 – 1,010 555 800
Financial costs (14) – 4,596 – 4,153 – 16,140 – 13,972
Financial costs – net – 4,364 – 5,163 – 15,585 – 13,172
Profit before income tax 19,635 12,701 83,935 81,203
Income taxes (17) – 7,008 – 3,270 – 28,319 – 24,587
Profit for the period 12,627 9,431 55,616 56,616
Other comprehensive income for the period, net of tax
Other comprehensive income that can be reclassified into profit or loss, net of tax
– 2,110
– 1,411
– 5,383
– 5,655
Exchange differences on translation of foreign operations (27) – 1,992 – 1,168 – 7,712 – 2,570
Cash flow hedges, net of tax (27) – 118 – 243 2,329 – 3,085
Other comprehensive income that cannot be reclassified into profit or loss, net of tax
– 567
– 1,039
– 567
– 1,039
Remeasurements of post employment benefit obligations, net of tax (27, 29) – 567 – 1,039 – 567 – 1,039
Other comprehensive income for the period, net of tax – 2,677 – 2,450 – 5,950 – 6,694
Total comprehensive income for the period 9,950 6,981 49,666 49,922
Profit attributable to
Shareholders of the parent 12,617 9,435 55,557 56,616
Non-controlling interests 10 – 4 59 0
12,627 9,431 55,616 56,616
Total comprehensive income attributable to
Shareholders of the parent 10,047 6,918 49,683 49,695
Non-controlling interests – 97 63 – 17 227
9,950 6,981 49,666 49,922
Undiluted earnings per share (in EUR)
(16)
0.40
0.30
1.74
1.78
Diluted earnings per share (in EUR) (16) 0.39 0.30 1.74 1.78
1) Restated due to effects from the application of IAS 19R. See: Section 2 Basis of preparation and Section 7 Change in accounting principles.

117Consolidated Financial Statements
Consolidated Statement of Comprehensive Income | Statement of Cash Flows
Consolidated Statement of Cash Flows
in EUR thousands
Note
Q4 2013
Q4 20121)
2013
20121)
Operating activities
Profit for the period 12,627 9,431 55,616 56,616
Depreciation and amortisation (20, 21) 7,780 8,493 29,799 26,414
Gain (–) / loss (+) on disposal of property, plant and equipment 43 317 – 66 – 386
Change in provisions (30) 861 – 676 542 – 673
Change in deferred taxes (19) 329 – 259 – 633 – 4,037
Change in inventories, trade account reveivables and other receivables (24, 25, 26)
12,440
13,134
– 4,732
11,009
Change in trade and other payables (32, 34, 35) 1,228 1,008 12,424 2,591
Interest expenses of the period 2,682 1,798 11,408 11,630
Other non-cash expenses / income (36) 4,712 – 98 10,993 – 7,040
Net cash provided by operating activities 42,702 33,148 115,351 96,124
thereof interest received 229 55 485 1,736
thereof income taxes – 4,674 – 3,772 – 16,484 – 16,232
Investing activities
Payments for acquisitions of subsidiaries, net (40) – 1,167 – 7,248 – 13,210 – 28,976
Investments in property, plant and equipment (21) – 8,559 – 8,749 – 21,267 – 23,892
Proceeds from sale of property, plant and equipment 139 – 112 376 924
Investments in intangible assets (20) – 5,990 – 2,340 – 9,261 – 6,143
Net cash used in investing activities – 15,577 – 18,449 – 43,362 – 58,087
Financing activities
Reimbursement OPICP from shareholder 0 – 1 1,067 1,307
Interest paid – 1,750 – 1,798 – 9,773 – 11,630
Dividends paid to shareholders (27) 0 0 – 20,711 – 19,125
Dividends paid to non-controlling interests 0 0 0 – 11
Proceeds from borrowings (31) 0 0 128,118 18,500
Repayment of borrowings (31) – 16,782 – 10,236 – 47,051 – 23,173
Net cash provided by (+) / used in (–) financing activities (36) – 18,532 – 12,035 51,650 – 34,132
Net increase in cash and cash equivalents
8,593
2,664
123,639
3,905
Cash and cash equivalents at beginning of the year 186,209 70,082 72,389 67,891
Effect of foreign exchange rates on cash and cash equivalents – 614 – 357 – 1,840 593
Cash and cash equivalents at end of the period 194,188 72,389 194,188 72,389
1) Restated due to effects from the application of IAS 19R. See: Section 2 Basis of preparation and Section 7 Change in accounting principles.

NORMA Group SE Annual Report 2013118
Attributable to
equity holders of the parent
Attributable to
equity holders of the parent
in EUR thousands
Note Subscribed
capital Capital reserve
Other reserves
Retained earnings
Total Non-controlling
interests Total equity
Balance at 31 December 2011 (as reported)
31,862
212,252
– 2,668
14,112
255,558
444
256,002
Effects from the application of IAS 19R (7) 796 796 796
Balance at 31 December 2011 1)
31,862
212,252
– 2,668
14,908
256,354
444
256,798
Changes in equity for the period
Result for the period 1) 56,616 56,616 0 56,616
Exchange differences on translation of foreign operations – 2,797 – 2,797 227 – 2,570
Cash flow hedges, net of tax (23) – 3,085 – 3,085 0 – 3,085
Remeasurements of post employment benefit obligations, net of tax (27, 29) – 1,039 – 1,039 0 – 1,039
Total comprehensive income for the period 0 0 – 5,882 55,577 49,695 227 49,922
Stock options
(28)
418
418 0
418
Reimbursement OPICP by shareholders (27) 1,307 1,307 0 1,307
Dividends paid (27) – 19,125 – 19,125 0 – 19,125
Dividends paid to non-controlling interests 0 – 11 – 11
Non-controlling interest acquired in a business combination – 489 – 489 361 – 128
Total transactions with owners for the period 0 1,307 0 – 19,196 – 17,889 350 – 17,539
Balance at 31 December 2012 1) 31,862 213,559 – 8,550 51,289 288,160 1,021 289,181
Balance at 31 December 2012 (as reported)
31,862
213,559
– 8,550
50,450
287,321
1,021
288,342
Effects from the application of IAS 19R (7) 839 839 839
Balance at 31 December 2012 1)
31,862
213,559
– 8,550
51,289
288,160
1,021
289,181
Changes in equity for the period
Result for the period 55,557 55,557 59 55,616
Exchange differences on translation of foreign operations – 7,636 – 7,636 – 76 – 7,712
Cash flow hedges, net of tax (23) 2,329 2,329 0 2,329
Remeasurements of post employment benefit obligations, net of tax (27, 29) – 567 – 567 0 – 567
Total comprehensive income for the period 0 0 – 5,307 54,990 49,683 – 17 49,666
Stock options 2) (28) 1,301 – 602 699 0 699
Reimbursement OPICP by shareholders (27) 1,067 1,067 0 1,067
Dividends paid (27) – 20,711 – 20,711 0 – 20,711
Total transactions with owners for the period 0 2,368 0 – 21,313 – 18,945 0 – 18,945
Balance at 31 December 2013 31,862 215,927 – 13,857 84,966 318,898 1,004 319,902
Consolidated Statement of Changes in Equity
1) Restated due to effects from the application of IAS 19R. See: Section 2 Basis of preparation and Section 7 Change in accounting principles.2) In 2013 the expenses from the stock option programme recognised in equity were reclassified from the retained earnings into the capital reserve in order to achieve the same
disclosure in the Statutory Financial Statements of NORMA Group SE and the Consolidated Financial Statements of NORMA Group.

119Consolidated Financial Statements
Consolidated Statement of Changes in Equity
Attributable to
equity holders of the parent
Attributable to
equity holders of the parent
in EUR thousands
Note Subscribed
capital Capital reserve
Other reserves
Retained earnings
Total Non-controlling
interests Total equity
Balance at 31 December 2011 (as reported)
31,862
212,252
– 2,668
14,112
255,558
444
256,002
Effects from the application of IAS 19R (7) 796 796 796
Balance at 31 December 2011 1)
31,862
212,252
– 2,668
14,908
256,354
444
256,798
Changes in equity for the period
Result for the period 1) 56,616 56,616 0 56,616
Exchange differences on translation of foreign operations – 2,797 – 2,797 227 – 2,570
Cash flow hedges, net of tax (23) – 3,085 – 3,085 0 – 3,085
Remeasurements of post employment benefit obligations, net of tax (27, 29) – 1,039 – 1,039 0 – 1,039
Total comprehensive income for the period 0 0 – 5,882 55,577 49,695 227 49,922
Stock options
(28)
418
418 0
418
Reimbursement OPICP by shareholders (27) 1,307 1,307 0 1,307
Dividends paid (27) – 19,125 – 19,125 0 – 19,125
Dividends paid to non-controlling interests 0 – 11 – 11
Non-controlling interest acquired in a business combination – 489 – 489 361 – 128
Total transactions with owners for the period 0 1,307 0 – 19,196 – 17,889 350 – 17,539
Balance at 31 December 2012 1) 31,862 213,559 – 8,550 51,289 288,160 1,021 289,181
Balance at 31 December 2012 (as reported)
31,862
213,559
– 8,550
50,450
287,321
1,021
288,342
Effects from the application of IAS 19R (7) 839 839 839
Balance at 31 December 2012 1)
31,862
213,559
– 8,550
51,289
288,160
1,021
289,181
Changes in equity for the period
Result for the period 55,557 55,557 59 55,616
Exchange differences on translation of foreign operations – 7,636 – 7,636 – 76 – 7,712
Cash flow hedges, net of tax (23) 2,329 2,329 0 2,329
Remeasurements of post employment benefit obligations, net of tax (27, 29) – 567 – 567 0 – 567
Total comprehensive income for the period 0 0 – 5,307 54,990 49,683 – 17 49,666
Stock options 2) (28) 1,301 – 602 699 0 699
Reimbursement OPICP by shareholders (27) 1,067 1,067 0 1,067
Dividends paid (27) – 20,711 – 20,711 0 – 20,711
Total transactions with owners for the period 0 2,368 0 – 21,313 – 18,945 0 – 18,945
Balance at 31 December 2013 31,862 215,927 – 13,857 84,966 318,898 1,004 319,902

NORMA Group SE Annual Report 2013120
EMEA
Americas
Asia-Pacific
Total segments
Central functions
Consolidation
Consolidated group
in EUR thousands
2013
2012 7)
2013
2012
2013
2012
2013
2012 7)
2013
2012
2013
2012
2013
2012 7)
Total revenue 412,691 392,588 198,321 200,946 57,218 44,745 668,230 638,279 42,457 44,206 – 75,142 – 77,872 635,545 604,613
thereof inter-segment revenue 24,730 25,047 6,752 7,618 1,203 1,001 32,685 33,666 42,457 44,206 – 75,142 – 77,872 0 0
Revenue from external customers
387,961
367,541
191,569
193,328
56,015
43,744
635,545
604,613
0
0
0
0
635,545
604,613
Contribution to consolidated group sales 61 % 61 % 30 % 32 % 9 % 7 % 100 % 100 %
Adjusted EBITDA 1) 83,920 79,314 45,216 42,981 6,471 5,175 135,607 127,470 – 5,915 – 5,078 – 373 – 1,603 129,319 120,789
Depreciation without PPA depreciation 2)
– 9,803
– 10,013
– 4,133
– 4,087
– 1,991
– 1,028
– 15,927
– 15,128
– 772
– 264
0
0
– 16,699
– 15,392
Adjusted EBITA 3) 74,117 69,301 41,083 38,894 4,480 4,147 119,680 112,342 – 6,687 – 5,342 – 373 – 1,603 112,620 105,397
Assets 4) 490,322 457,426 210,047 209,894 61,895 51,240 762,264 718,560 212,440 131,680 – 151,011 – 158,102 823,693 692,138
Liabilities 5) 196,079 185,155 121,336 138,118 20,385 36,536 337,800 359,809 277,946 171,693 – 111,955 – 127,706 503,791 403,796
CAPEX 13,055 15,153 7,317 6,683 6,716 5,752 27,088 27,588 3,440 4,118 0 0 30,528 31,706
Number of employees 6) 2,546 2,468 664 644 567 367 3,777 3,479 168 98 0 0 3,945 3,577
Segment Reporting
1) The adjustments relate to adjustments within the individual segments. At Group level, no adjustments were made in the EBITDA.2) Depreciation from purchase price allocations.3) For details regarding the adjustments, refer to Note 8.4) Including allocated goodwills, taxes are shown within the reconciliation.5) Taxes are shown within the reconciliation.6) Number of employees (average headcount).7) Restated due to effects from the application of IAS 19R. See: Section 2 Basis of preparation and Section 7 Change in accounting principles.
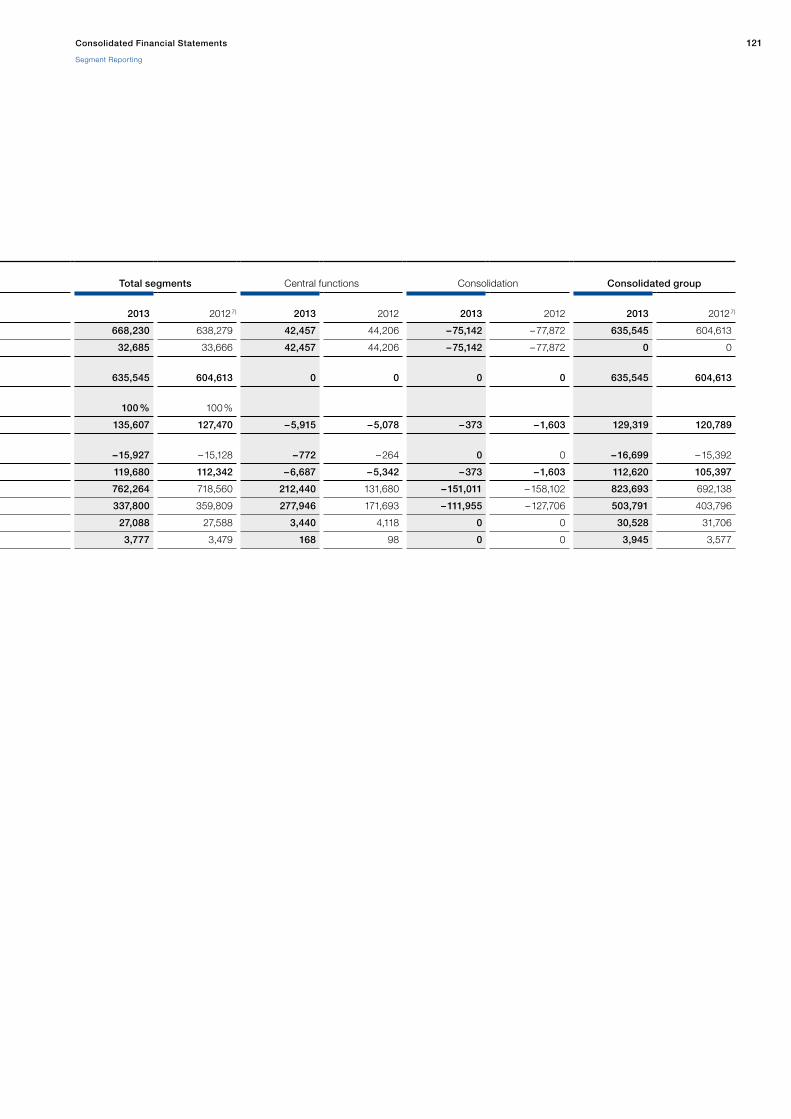
121Consolidated Financial Statements
Segment Reporting
EMEA
Americas
Asia-Pacific
Total segments
Central functions
Consolidation
Consolidated group
in EUR thousands
2013
2012 7)
2013
2012
2013
2012
2013
2012 7)
2013
2012
2013
2012
2013
2012 7)
Total revenue 412,691 392,588 198,321 200,946 57,218 44,745 668,230 638,279 42,457 44,206 – 75,142 – 77,872 635,545 604,613
thereof inter-segment revenue 24,730 25,047 6,752 7,618 1,203 1,001 32,685 33,666 42,457 44,206 – 75,142 – 77,872 0 0
Revenue from external customers
387,961
367,541
191,569
193,328
56,015
43,744
635,545
604,613
0
0
0
0
635,545
604,613
Contribution to consolidated group sales 61 % 61 % 30 % 32 % 9 % 7 % 100 % 100 %
Adjusted EBITDA 1) 83,920 79,314 45,216 42,981 6,471 5,175 135,607 127,470 – 5,915 – 5,078 – 373 – 1,603 129,319 120,789
Depreciation without PPA depreciation 2)
– 9,803
– 10,013
– 4,133
– 4,087
– 1,991
– 1,028
– 15,927
– 15,128
– 772
– 264
0
0
– 16,699
– 15,392
Adjusted EBITA 3) 74,117 69,301 41,083 38,894 4,480 4,147 119,680 112,342 – 6,687 – 5,342 – 373 – 1,603 112,620 105,397
Assets 4) 490,322 457,426 210,047 209,894 61,895 51,240 762,264 718,560 212,440 131,680 – 151,011 – 158,102 823,693 692,138
Liabilities 5) 196,079 185,155 121,336 138,118 20,385 36,536 337,800 359,809 277,946 171,693 – 111,955 – 127,706 503,791 403,796
CAPEX 13,055 15,153 7,317 6,683 6,716 5,752 27,088 27,588 3,440 4,118 0 0 30,528 31,706
Number of employees 6) 2,546 2,468 664 644 567 367 3,777 3,479 168 98 0 0 3,945 3,577
NORMA Group SE Annual Report 2013122
Notes to the Consolidated Financial Statements
1. GENERAL INFORMATION
NORMA Group SE is the parent Company of NORMA Group. Its headquarters are located at 63477 Maintal, Edisonstrasse 4 in the vicinity of Frankfurt, Germany, and is registered in the commercial register of Hanau under the number HRB 94473. NORMA Group SE and its affiliated Group subsidiaries operate in the market as ‘NORMA Group.’
NORMA Group has been listed in the Prime Standard of Frankfurt Stock Exchange’s Regulated Market since 8 April 2011. For a detailed overview of NORMA Group SE’s shareholdings, please refer to the appendix to the notes: voting rights.
NORMA Group SE was established in 2006 as a result of the merger of Rasmussen GmbH and the ABA Group. Rasmussen was founded in 1949 as Rasmussen GmbH in Germany. It manufactured connecting and retaining elements as well as fluid conveying conduits such as monolayer and multilayer tubes and corrugated tubes. All products were marketed globally under the NORMA brand. ABA Group was founded in 1896 in Sweden. The Group has since developed into a leading multinational Com pany specialising in the design and production of hose and pipe clamps, as well as connectors for many worldwide applications.
In 2007, NORMA Group acquired Breeze Industrial Products Corporation (USA) to strengthen its foothold in the Americas. Breeze had expanded its product offering to include a wide range of wormdrive, Tbolt and Vclamps for the commercial and passenger vehicle, heavyduty vehicle, aircraft and further industrial markets. In 2010, NORMA Group acquired two further companies in America, R.G. RAY Corporation and Craig Assembly Inc., to become one of the country’s leading suppliers of fastening and
fixing products. In 2012, NORMA Group acquired Connectors Verbindungstechnik AG in Switzerland, which is specialised in connector systems for the pharmaceutical and biotechnology industry.
In the financial years 2012 and 2013, more acquisitions were made in accordance with our acquisition strategy. In 2012, acqui sitions were made in the regions of EMEA and AsiaPacific. In 2013, we focussed on the regions EMEA, Americas and AsiaPacific.
In past decades, NORMA Group has, driven by its successful acquisitions and continuous technological innovation of products and operations, developed into a group of companies of global importance. Today, NORMA Group markets its products to its customers via two different market channels: Distribution Services (DS) and Engineered Joining Technologies (EJT).
For Distribution Services (DS) customers, NORMA Group offers a wide range of standard fastening and fixing products. Furthermore, NORMA Group offers a broad technological and innovative product portfolio which includes brands like NORMA®, ABA®, BREEZE®, R.G. RAY®, Serflex®, Serratub®, TERRY®, Torca® and FISH®.
For Engineered Joining Technology (EJT) customers, NORMA Group offers tailormade solutions and special engineered joining systems. To effectively fulfil special requirements, NORMA Group builds on extensive industry and application knowledge, a successful track record of innovation and longstanding relationships with all its key customers. As a result, many joining systems and fluid conveying conduits have been developed in close cooperation with global OEMs and NORMA Group.

123Consolidated Financial Statements
Notes to the Consolidated Financial Statements
2. BASIS OF PREPARATION
The principal accounting policies applied in the preparation of these consolidated financial statements are set out below. These policies have been consistently applied to all the years presented, unless otherwise stated.
The consolidated financial statements of NORMA Group have been prepared in accordance with International Financial Reporting Standards as adopted by the EU (IFRS) as well as with the regulations under commercial law as set forth in Section 315a of the German Commercial Code (HGB) for the year ended 31 Decem ber 2013.
The consolidated statement of comprehensive income has been prepared in accordance with the total cost method.
The consolidated financial statements of NORMA Group SE were prepared by the Management Board on 12 March 2014 and released for publication after the approval by the Supervisory Board on 26 March 2014.
The consolidated financial statements of NORMA Group are being filed with and published in the German Federal Gazette (Bundesanzeiger).
The preparation of financial statements in conformity with IFRS requires the use of certain critical accounting estimates. It also requires management to exercise its judgement in the process of applying the Group’s accounting policies. The areas involving a higher degree of judgement or complexity or areas where assump tions and estimates are significant to the consolidated financial statements are disclosed in Note 6.
New and amended standards adopted by the Group for the first time in 2013The following new standards or amendments to standards which are applied for the first time for the financial year beginning 1 January 2013 had some significant enhancements to the disclosures in the notes, but they did not have a material impact on NORMA Group’s financial positions, cash flows and financial performance.
IAS 1 (amendments), Presentation of Financial Statements, was published in June 2011. The presentation of other comprehensive income has been adapted as a result of the amended IAS 1, so that items that will be reclassified, at a later date, in the profit or loss (socalled, recycling); (e. g. cash flow hedges, foreign currency translation) are to be separated from those items that cannot be recycled (e. g. Actuarial gains and losses on defined benefit pension plans).
IAS 19 (amendments), Employee Benefits, was published in June 2011. The amendment was applied retrospective in accor dance with IAS 19.173 (2011) and IAS 8. The most important change of the amended IAS 19 (IAS 19R ) is that the existing election law for the recognition of losses and gains from the remeasurement of defined benefit pension plans was abolished and now only the immediate recognition in other comprehensive income is allowed. This change had no impact on the consolidated financial statements of the group as the NORMA Group recognises actuarial gains and losses, in accor dance with the previous election law, in other comprehensive income. In addition to this change, the profit or loss to be recorded from plan assets under IAS 19R no longer has to be measured on the basis of expectations, but by applying the discount rate of the defined benefit liability. This change has no material effect on the NORMA Group, as there are only limited plan assets to secure pension obligations.
The amendment of IAS 19 contains further a change of the requirements for termination benefits. The definition of termination benefits was clarified, so that benefits that have futureservice obligations are not termination benefits and have to be classified as “ShortTerm Employee Benefits”, as “Other LongTerm Employee Benefits” or as “PostEmployment Benefits”. This clarification has a direct impact on the accounting of provisions for retirement obligations and the corresponding expenses. Topup payments which result from retirement agreements are no longer classified as “Termination Benefits”, in accordance with the amendments to IAS 19, they have to be classified as “Other LongTerm Employee Benefits” in terms of IAS 19.08 seqq. and IAS 19.153 seqq. The recognition of those topup payments has to be made in accordance with IAS 19.155 (2011) seqq. in conjunction with IAS 19.56 (2011) seqq., thus they must be accumulated in return for services. Note 7 presents the impacts of the changes in accounting policy with respect to the provisions for retirement obligations.
The International Accounting Standards Board (IASB) has published amendments to IFRS 7, Financial Instruments: Disclosure in December 2011. The amendments to IFRS 7 require an entity to disclose information about rights of setoff and related arrangements. The new disclosures are required for all recognised financial instruments that are setoff in accordance with IAS 32. These disclosures also apply to recognised financial instruments that are subject to an enforceable master netting arrangement or similar agreement, irrespective of whether they are setoff in accordance with IAS 32. The new disclosure requirements have no impact on the NORMA Group.

NORMA Group SE Annual Report 2013124
IFRS 13, Fair Value Measurement, was published in May 2011. IFRS 13 aims to improve consistency and reduce complexity. IFRS 13 provides a precise definition of fair value and a single source of fair value measurement and disclosure requirements for use across IFRSs. The requirements do not extend to the use of fair value accounting but rather provide guidance on how it should be applied where its use is already required or permitted by other standards within IFRSs. IFRS 13 requires an entity to disclose information that helps readers of its financial statements to assess the valuation techniques and inputs used to develop those measurements and the effects of the measurements on profit or loss or other comprehensive income for the period. Regarding financial instruments, the major ity of changes required by IFRS 13 have already been introduced, mainly by amendments to IFRS 7, Financial Instruments: Disclosures.
The IASB, as a consequential amendment to IFRS 13, Fair Value Measurement, modified some of the disclosure requirements in IAS 36, Impairment of Assets, regarding measurement of the recoverable amount of impaired nonfinancial assets. This amendment removed certain disclosures of the recoverable amount of CGUs which had been included in IAS 36 by the issue of IFRS 13. In addition to removing the requirement to disclose recoverable amounts when there has been impairment or reversal of impairment, the amendments require the following disclosures when an impairment is recognised or reversed and recoverable amount is based on fair value less cost of disposal:
The level of the IFRS 13 ‘fair value hierarchy’ within which the fair value measurement has been determined;
A description of the valuation techniques used and any changes in that valuation technique for Level 2 and Level 3 of the fair value hierarchy;
For fair value measurements at Level 2 or Level 3 of the fair value hierarchy: Key assumptions used in the measurement of the fair value, including the discount rate used in the current measurement and previous measure if the fair value less costs of disposal is measured using a present value technique.
The amendments apply retrospectively to annual reporting periods beginning on or after 1 January 2014, an early adoption is permitted with simultaneous application of IFRS 13. The Group has early applied the amendments as of 31 December 2013.
In Mai 2012, as part of its annual improvements project, the International Accounting Standards Board (IASB) issued Annual Improvements to IFRSs: 2009–2011 Cycle, which proposes amendments to five International Financial Reporting
Standards (IFRSs). The amendments are effective for annual periods beginning on or after 1 January 2013. The amendments are as follows:
Pronouncement
Amendments
IFRS 1 Firsttime Adoption of International Financial Reporting Standards
Permit the repeated application of IFRS 1
Borrowing costs relating to qualifying assets for which the commencement date for capitalisation is before the date of transition to IFRSs
IAS 1 Presentation of Financial Statements
Clarification of the requirements for comparative information
IAS 16 Property, Plant and Equipment
Classification of servicing equipment
IAS 32 Financial Instruments: Presentation
Clarify that tax effect of a distribution to holders of equity instruments should be accounted for in accordance with IAS 12 Income Taxes
IAS 34 Interim Financial Reporting
Clarify interim reporting of segment information for total assets in order to enhance consistency with the requirements in IFRS 8 Operating Segments
Standards, amendments and interpretations of existing standards that are not yet effective and have not been adopted early by the GroupThe following standards and amendments to existing standards have been published and application is mandatory for all accounting periods beginning on or after 1 January 2014. The Group has decided against an early adoption.
1) Standards, amendments and interpretations to existing standards that have already been endorsed by the EU (with reference to each respective EU effective date)
In May 2011, the IASB published its improvements to the account ing and disclosure requirements for consolidation, offbalancesheet activities and joint agreements by issuing IFRS 10, Consolidated Financial Statements, IFRS 11, Joint Arrangements, IFRS 12, Disclosure of Interests in Other Entities, consequential amendments to IAS 27, (Consolidated and) Separate Financial Statements (amended 2011) and IAS 28, Investments in Associates and Joint Ventures (amended 2011). IFRS 10, 11, 12 and the consequential amendments to IAS 27 and IAS 28 are effective for annual periods beginning on or after 1 January 2014. An early adoption is possible, but must be adopted as a package, that is, all as of the same date, with the exception of IRFS 12. The Group does not expect a material impact on its Consolidated Financial Statements from these standards.
The new standards and the consequential amendments are presented in detail below:

125Consolidated Financial Statements
Notes to the Consolidated Financial Statements
IFRS 10, Consolidated Financial Statements, IAS 27, (Consolidated and) Separate Financial Statements
IFRS 10 superseded the requirements relating to consolidated financial statements in IAS 27, Consolidated and Separate Financial Statements (amended 2008) and SIC12, Consolidation – Special Purpose Entities. IFRS 10 builds on the existing principles by identifying the concept of control as the determining factor in whether or not an entity should be included in the consolidated financial statements of the parent Company. The standard provides additional guidance to assist in the determination of control where this is difficult to assess. IAS 27 (amended 2011) now only contains requirements relating to separate financial statements as a result of the issuance of the new standard IFRS10.
IFRS 11 Joint Arrangements IFRS 11 provides guidance for the accounting of joint arrange
ments. The core principle of IFRS 11 is to determine the accounting of joint ventures on the rights and obligations of the arrangement, rather than its legal form. Basically the standard classifies joint arrangements into two types, joint operations and joint ventures, which differ in the way of accounting for joint arrangements. A joint operation is a joint arrangement whereby the parties that have joint control of the arrangement have rights to the assets, and obligations for the liabilities, relating to the arrangement. A joint venture is a joint arrangement whereby the parties that have joint control of the arrangement have rights to the net assets of the arrangement. IFRS requires a joint operator to recognise and measure the assets and liabilities in relation to its interest in the arrangement applicable to the particular assets, liabilities, revenues and expenses. A joint venture is required to recognise an investment and to account for that investment using the equity method according to IAS 28.
IFRS 12 Disclosure of Interests in Other Entities IFRS 12 unifies the disclosure requirements of IAS 27 and IFRS
10, IAS 31 and IFRS 11 and IAS 28 in one comprehensive standard. The standard provides guidance for disclosure requirements for any kind of interests in other entities, including joint arrangements, associates, structured entities, special purpose vehicles and offbalancesheet activities. The objective of IFRS 12 is to require disclosures that enables users of financial statements to evaluate the nature of, and risks associate with, its interest in other entities and the effects on its financial position, financial performance and cash flows.
IAS 28 Investments in Associates and Joint Ventures According to the amendment of IAS 28 an entity shall account
for an investment, or for a portion of an investment, in an associate or joint venture held for sale if it meets the relevant criteria. Any retained portion of an investment in an associate
or joint venture that has not been classified as held for sale shall be accounted for using the equity method until the disposal of the portion that is classified as held for sale takes place.
The International Accounting Standards Board (IASB) has published amendments to IAS 32, Financial Instruments: Presentation, in December 2011. The amendments introduce additional application guidance under IFRS in applying the current offsetting principles. It clarifies that an entity currently has a legally enforceable right to setoff if that right is enforceable both in the normal course of business and in the event of default, insolvency of the entity and all counterparties. The amendments to IAS 32 are to be retrospectively applied for annual periods beginning on or after 1 January 2014. The Group does not expect a material impact on its Consolidated Financial Statements from these amendments.
2) Standards, amendments and interpretations to existing standards that have not yet been endorsed by the EU
IFRS 9, Financial Instruments, a project of the International Accounting Standards Board (IASB) to replace and simplify the current standard IAS 39 Financial Instruments: Recognition and Measurement. The project was divided into three phases:
Phase 1: Classification and Measurement Phase 2: Amortised cost and impairment of financial assets Phase 3: Hedge accounting
IFRS 9, Financial Instruments (effective from 1 January 2013, earlier application is permitted), was published in November 2009 and covers the classification and measurement of financial assets. The various classification and measurement models in IAS 39 are replaced by a single model with only two classification categories. Thus, upon initial recognition financial assets are either classified as measured at amortised cost or at fair value. Further changes introduced by IFRS 9 concern the accounting of embedded derivatives and the measurement of equity instruments not held for trading. In October 2010 the IASB followed the publication of IFRS 9 in November 2009 with an update to IFRS 9, Financial Instruments, to include guidance on financial liabilities and the derecognition of financial instruments. The accounting and presentation of financial liabilities and for derecognising financial instruments has been adopted from IAS 39, ‘Financial Instruments: Recognition and Measurement’, without change, except for financial liabilities that are measured at fair value through profit or loss. In November 2012, the IASB published an exposure draft proposing limited amendments to IFRS 9 ‘Financial Instruments (2010)’ (the ‘ED’). The significant changes from IFRS 9 in the ED include the introduction of a third classification category for debt instruments (fair value through other comprehensive income),
NORMA Group SE Annual Report 2013126
clarification of the business model for the existing amortised cost category, clarification of the contractual cash flow test, consequential changes as a result of the limited amendments and revised transition guidance.
In December 2011, the IASB deferred the mandatory effective date from annual reporting periods beginning on or after 1 January 2013 to annual reporting periods beginning on or after 1 January 2015; early application is permitted.
The International Accounting Standards Board (IASB) has published an amendment to IFRS 9 ‘Financial Instruments’ incorporating its new general hedge accounting model. This represents a significant milestone as it completes another phase of the IASB’s project to replace IAS 39 ‘Financial Instruments: Recognition and Measurement’. The new general hedge accounting model will allow reporters to reflect risk management activities in the financial statements more closely as it provides more opportunities to apply hedge accounting. The new general hedge accounting model will allow more opportunities to apply hedge accounting. The new model allows financial instruments at fair value through profit or loss to be designated as hedging instruments. It also introduces a new way to account for the change in time value of an option when the intrinsic value is designated, resulting in less volatility in profit or loss. A fundamental difference to the IAS 39 hedge accounting model is the lack of the 80–125 per cent bright line threshold for effective hedges and the requirement to perform retrospective hedge effectiveness testing. Under the IFRS 9 model, it is necessary for there to be an economic relationship between the hedged item and hedging instrument, with no quantitative threshold. The trade off to increased hedge accounting possibilities is increased disclosures about an entity’s risk management strategy, cash flows from hedging activities and the impact of hedge accounting on the financial statements.
The amendment removes the previous 1 January 2015 mandatory effective date of IFRS 9. At the IASB’s November 2013 meeting, the Board decided that the mandatory effective date of IFRS 9 would not be before 1 January 2017, but that the
final effective date will be determined when the classification and measurement and impairment chapters of IFRS 9 are finalised. The Group is currently assessing the impacts of adopting IFRS 9 on the Group’s Consolidated Financial Statements.
On 20 May 2013, the International Accounting Standards Board (IASB) issued IFRIC Interpretation 21, Levies, to IAS 37, Provisions, contingent liabilities and contingent assets, which deals with the accounting treatment of levies imposed by govern ments. IFRIC 21 is dealing with the issue of accounting for levies imposed by governments, other than income taxes. An issue was the point at which an “obligating event” under IAS 37 arose, requiring the recognition of a liability for the levy. The interpretation now makes it clear that this obligating event arises when the activity described in the relevant legislation that triggers the payment of the levy is undertaken. IFRIC 21 is effective for annual periods beginning on or after 1 January 2014. The Group does not expect a material impact on its Consolidated Financial Statements from these amendments.
On 19 November 2013 the International Accounting Standards Board (IASB) issued amendments to IAS 19 Defined Benefit Plans: Employee Contributions. The amendments clarify the requirements that relate to how contributions from employees or third parties that are linked to service should be attributed to periods of service. In addition, it permits a practical expedient if the amount of the contributions is independent of the number of years of service, in that contributions, can, but are not required to be recognised as a reduction in the service cost in the period in which the related service is rendered. The amendment is effective for annual periods beginning on or after 1 July 2014. The Group does not expect a material impact on its Consolidated Financial Statements from these amendments.
On 20 November 2012, as part of its annual improvements project, the International Accounting Standards Board (IASB) issued Annual Improvements to IFRSs: 2011–2013 Cycle and 2010–2012 Cycle, which propose amendments to five International Financial Reporting Standards (IFRSs). The amendments are effective for annual periods beginning on or after 1 July 2014.

127Consolidated Financial Statements
Notes to the Consolidated Financial Statements
CYCLE 2010–2012
Standard
Amendments
IFRS 2 Sharebased Payment
Definition of ‘vesting condition’Amends the definitions of ‘vesting condition’ and ‘market condition’ and adds definitions for ‘performance condition’ and ‘service condition’ (which were previously part of the definition of ‘vesting condition’).
IFRS 3 Business Combinations(with consequential amendments to other standards)
Accounting for contingent consideration in a business combinationClarifies that a contingent consideration that is classified as an asset or a liability shall be measured at fair value at each reporting date.
IFRS 8 Operating Segments
Aggregation of operating segmentsRequires an entity to disclose the judgements made by management in applying the aggregation criteria to operating segments.
Reconciliation of the total of the reportable segments’ assets to the entity’s assetsClarifies that an entity shall only provide reconciliations of the total of the reportable segments’ assets to the entity’s assets if the segment assets are reported regularly.
IFRS 13 Fair Value Measurement(amendments to the basis of conclusions only, with consequential amendments to the bases of conclusions of other standards)
Short-term receivables and payablesClarifies that issuing IFRS 13 and amending IFRS 9 and IAS 39 did not remove the ability to measure shortterm receivables and payables with no stated interest rate at their invoice amounts without discounting if the effect of not discounting is immaterial.
IAS 16 Property, Plant and Equipment
Revaluation method – proportionate restatement of accumulated depreciationClarifies that when an item of property, plant and equipment is revalued the gross carrying amount is adjusted in a manner that is consistent with the revaluation of the carrying amount.
IAS 24 Related Party Disclosures
Key management personnelClarifies that an entity providing key management personnel services to the reporting entity or to the parent of the reporting entity is a related party of the reporting entity.
IAS 38 Intangible Assets
Revaluation method – proportionate restatement of accumulated amortisationClarifies that when an intangible asset is revalued the gross carrying amount is adjusted in a manner that is consistent with the revaluation of the carrying amount.
CYCLE 2011–2013
Standard
Amendments
IFRS 1 Firsttime Adoption of International Financial Reporting Standards (changes to the Basis for Conclusions only)
Meaning of effective IFRSsClarifies that an entity, in its first IFRS financial statements, has the choice between applying an existing and currently effective IFRS or applying early a new or revised IFRS that is not yet mandatorily effective, provided that the new or revised IFRS permits early application. An entity is required to apply the same version of the IFRS throughout the periods covered by those first IFRS financial statements.
IFRS 3 Business Combinations
Scope of exception for joint venturesClarifies that IFRS 3 excludes from its scope the accounting for the formation of a joint arrangement in the financial statements of the joint arrangement itself.
IFRS 13 Fair Value Measurement
Scope of paragraph 52 (portfolio exception)Clarifies that the scope of the portfolio exception defined in paragraph 52 of IFRS 13 includes all contracts accounted for within the scope of IAS 39 Financial Instruments: Recognition and Measurement or IFRS 9 Financial Instruments, regardless of whether they meet the definition of financial assets or financial liabilities as defined in IAS 32 Financial Instruments: Presentation.
IAS 40 Investment Property
Clarifying the interrelationship of IFRS 3 and IAS 40 when classifying property as investment property or owner-occupied propertyClarifies that determining whether a specific transaction meets the definition of both a business combination as defined in IFRS 3 Business Combinations and investment property as defined in IAS 40 Investment Property requires the separate application of both standards independently of each other.

NORMA Group SE Annual Report 2013128
The amendments are intended to clarify the requirements and not to change the accounting practice. The Group does not expect a material impact on its Consolidated Financial Statements from these amendments.
The IASB issued various other pronouncements. These recently adopted pronouncements as well as pronouncements not yet adopted will not have a material impact on NORMA Group’s Consolidated Financial Statements.
3. SUMMARY OF SIGNIFICANT ACCOUNTING PRINCIPLES
1. Consolidation(a) SubsidiariesSubsidiaries are all entities over which NORMA Group has the power to govern the financial and operating policies. This generally accompanies a shareholding of more than half of the voting rights. The existence and effect of potential voting rights that are currently exercisable or convertible are considered when assessing whether the Group controls another entity. Subsidiaries are fully consolidated from the date on which control is transferred to the Group. They are deconsolidated from the date that control ceases.
The Group uses the acquisition method of accounting to account for business combinations. The initial value for the acquisition of a subsidiary is recognised at fair value of the assets transferred, the liabilities incurred and the equity interests issued by the Group. The initial value recognised includes the fair value of any asset or liability resulting from a contingent consideration arrangement. At the acquisition date the fair value of contingent consideration is recognised as part of the consideration transferred in exchange for the acquiree. Acquisitionrelated costs are expensed as incurred. Identifiable assets acquired and liabilities and contingent liabilities assumed in a business combination are measured initially at their fair value at the acquisition date. According to IFRS 3 (revised), for each business combination the acquirer shall measure any noncontrolling interest in the acquiree either at fair value (full goodwill method) or at the noncontrolling interest’s proportionate share of the acquiree’s net assets. The Group measures the noncontrolling interest in the acquiree at the noncontrolling interest’s proportionate share of the acquiree’s net assets.
The excess of the consideration transferred, the amount of any noncontrolling interest in the acquiree and the acquisition date fair value of any previous equity interest in the acquiree over the fair value of the Group’s share of the identifiable net assets acquired, is recorded as goodwill. If this is less than the fair value of the net assets of the subsidiary acquired in the case of a bargain purchase, the difference is recognised immediately in the statement of comprehensive income.
In a business combination achieved in stages, the Group remeasures its previously held equity interest in the acquiree at its acquisition date fair value and recognises the resulting gain or loss, if any, in profit or loss.
Intercompany transactions, balances and unrealised gains or losses on transactions between Group companies are elimi nated. Accounting policies of subsidiaries have been changed where necessary to ensure consistency with the policies adopted by the Group.
(b) Non-controlling interestsNoncontrolling interests have a share in the earnings of the reporting period. Their interests in the shareholders equity of subsidiaries are reported separately from the equity of the Group.
The Group treats transactions with noncontrolling interests that do not result in a loss of control as transactions with equity owners of the Group. For purchases from noncontrolling interests, the difference between any consideration paid and the relevant share acquired of the carrying value of net assets of the sub sidiary is recorded in equity. Gains or losses on disposals of noncontrolling interests are also recorded in equity.
(c) Disposal of subsidiariesWhen the Group ceases to have control, any retained interest in the subsidiary is remeasured at its fair value, with the change in the carrying amount recognised in profit or loss. The initial carrying amount is the fair value for the purposes of subsequently accounting for the retained interest as an associate, joint venture or financial asset. In addition, any amounts previously recognised in other comprehensive income in respect of that entity are accounted for as if the Group had directly disposed of the related assets or liabilities. This may mean that amounts previously recog nised in other comprehensive income are reclassified to profit or loss.

129Consolidated Financial Statements
Notes to the Consolidated Financial Statements
2. Valuation methodsThe following table shows the most important valuation methods:
Position Valuation method
Assets
Goodwill Impairmentonly approach
Other intangible assets (except goodwill) Amortised costs
Property, plant and equipment Amortised costs
Derivative financial assets:
Classified as cash flow hedge At fair value in other comprehensive income
Inventories Lower of cost or net realisable value
Other nonfinancial assets Amortised costs
Trade receivables Amortised costs
Cash and cash equivalents Nominal amount
Liabilities
Pensions Projected unit credit method
Other provisions Settlement amount
Borrowings Amortised costs
Other nonfinancial liabilities Amortised costs
Other financial liabilities (categories IAS 39):
Financial liabilities at cost (FLAC) Amortised costs
Derivative financial liabilities:
Classified as cash flow hedge At fair value in other comprehensive income
Contingent consideration At fair value through profit or loss
Trade payables Amortised costs
3. Fair value estimationThe amendment to IFRS 7 for financial instruments that are measured in the statement of financial position at fair value in accordance with IFRS 13 requires disclosure of fair value measurements by level using the following fair value measurement hierarchy:
Level 1: Quoted prices (unadjusted) in active markets for identical assets or liabilities,
Level 2: Inputs other than quoted prices included within Level 1 that are observable for the asset or liability, either directly (that is, as prices) or indirectly (that is, derived from prices) and
Level 3: Inputs for the asset or liability that are not based on observable market data (that is unobservable inputs).
The level in the fair value hierarchy within which the fair value measurement is categorised in total is determined on the basis of the lowest level input that is significant to the fair value measurement in total. The different hierarchy levels demand different amounts of disclosure.
At 31 December 2013 and 2012, the Group’s derivative financial instruments carried in the statement of financial position at fair value (i. e. trading derivatives and derivatives used for hedging) are categorised in total within level 2 of the fair value hierarchy. Contingent considerations, recognised in the balance sheet as at 31 December 2013, measured at fair value, are within level 3 of the fair value hierarchy (Note 22).
The fair value of interest rate swaps and crosscurrencyswaps is calculated as the present value of the estimated future cash flows. The fair value of forward foreign exchange contracts is determined using a present value model based on forward exchange rates.
4. Foreign currency translation(a) Functional and presentation currencyItems included in the financial statements of each of the Group’s entities are measured using the currency of the primary eco nomic environment in which the entity operates (‘the functional currency’). The consolidated financial statements are prepared in ‘euros’ (EUR), which is the NORMA Group SE’s functional and the Group’s presentation currency.
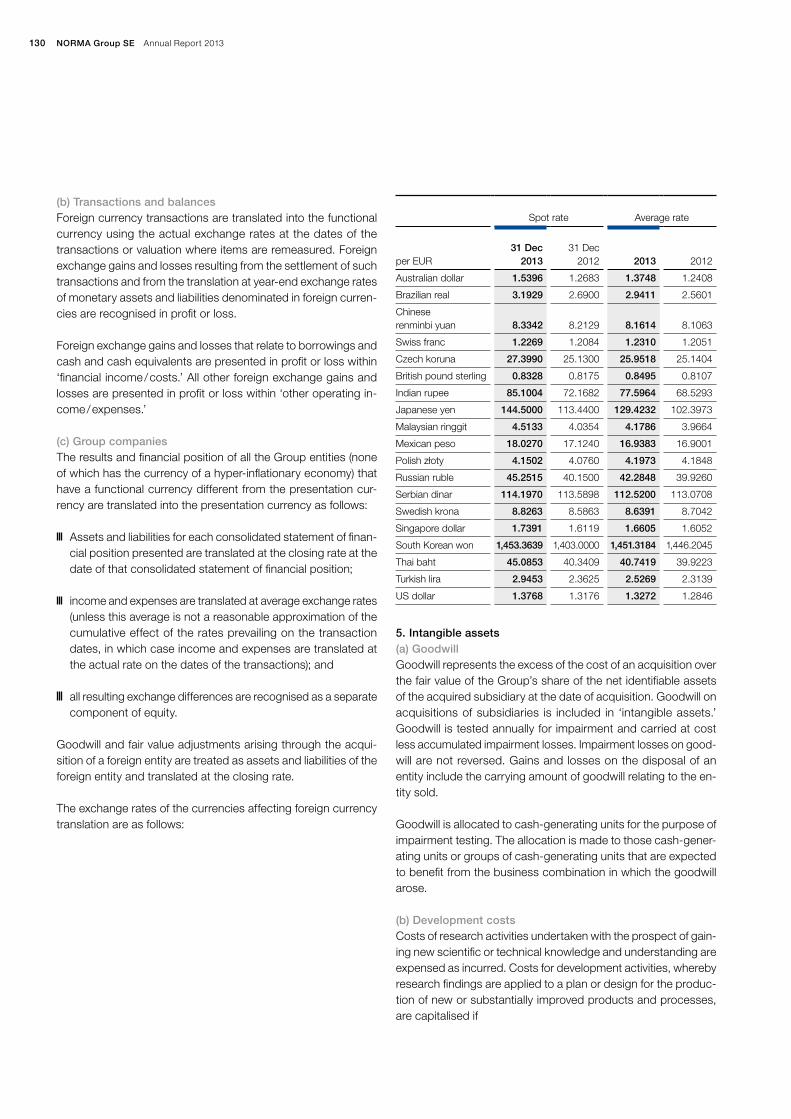
NORMA Group SE Annual Report 2013130
(b) Transactions and balancesForeign currency transactions are translated into the functional currency using the actual exchange rates at the dates of the transactions or valuation where items are remeasured. Foreign exchange gains and losses resulting from the settlement of such transactions and from the translation at yearend exchange rates of monetary assets and liabilities denominated in foreign currencies are recognised in profit or loss.
Foreign exchange gains and losses that relate to borrowings and cash and cash equivalents are presented in profit or loss within ‘financial income / costs.’ All other foreign exchange gains and losses are presented in profit or loss within ‘other operating income / expenses.’
(c) Group companiesThe results and financial position of all the Group entities (none of which has the currency of a hyperinflationary economy) that have a functional currency different from the presentation currency are translated into the presentation currency as follows:
Assets and liabilities for each consolidated statement of financial position presented are translated at the closing rate at the date of that consolidated statement of financial position;
income and expenses are translated at average exchange rates (unless this average is not a reasonable approximation of the cumulative effect of the rates prevailing on the transaction dates, in which case income and expenses are translated at the actual rate on the dates of the transactions); and
all resulting exchange differences are recognised as a separate component of equity.
Goodwill and fair value adjustments arising through the acquisition of a foreign entity are treated as assets and liabilities of the foreign entity and translated at the closing rate.
The exchange rates of the currencies affecting foreign currency translation are as follows:
Spot rate
Average rate
per EUR
31 Dec
2013
31 Dec
2012
2013
2012
Australian dollar 1.5396 1.2683 1.3748 1.2408
Brazilian real 3.1929 2.6900 2.9411 2.5601
Chinese renminbi yuan
8.3342
8.2129
8.1614
8.1063
Swiss franc 1.2269 1.2084 1.2310 1.2051
Czech koruna 27.3990 25.1300 25.9518 25.1404
British pound sterling 0.8328 0.8175 0.8495 0.8107
Indian rupee 85.1004 72.1682 77.5964 68.5293
Japanese yen 144.5000 113.4400 129.4232 102.3973
Malaysian ringgit 4.5133 4.0354 4.1786 3.9664
Mexican peso 18.0270 17.1240 16.9383 16.9001
Polish złoty 4.1502 4.0760 4.1973 4.1848
Russian ruble 45.2515 40.1500 42.2848 39.9260
Serbian dinar 114.1970 113.5898 112.5200 113.0708
Swedish krona 8.8263 8.5863 8.6391 8.7042
Singapore dollar 1.7391 1.6119 1.6605 1.6052
South Korean won 1,453.3639 1,403.0000 1,451.3184 1,446.2045
Thai baht 45.0853 40.3409 40.7419 39.9223
Turkish lira 2.9453 2.3625 2.5269 2.3139
US dollar 1.3768 1.3176 1.3272 1.2846
5. Intangible assets(a) GoodwillGoodwill represents the excess of the cost of an acquisition over the fair value of the Group’s share of the net identifiable assets of the acquired subsidiary at the date of acquisition. Goodwill on acquisitions of subsidiaries is included in ‘intangible assets.’ Goodwill is tested annually for impairment and carried at cost less accumulated impairment losses. Impairment losses on goodwill are not reversed. Gains and losses on the disposal of an entity include the carrying amount of goodwill relating to the entity sold.
Goodwill is allocated to cashgenerating units for the purpose of impairment testing. The allocation is made to those cashgenerating units or groups of cashgenerating units that are expected to benefit from the business combination in which the goodwill arose.
(b) Development costsCosts of research activities undertaken with the prospect of gaining new scientific or technical knowledge and understanding are expensed as incurred. Costs for development activities, whereby research findings are applied to a plan or design for the production of new or substantially improved products and processes, are capitalised if

131Consolidated Financial Statements
Notes to the Consolidated Financial Statements
development costs can be measured reliably, the product or process is
technically and commercially feasible, future economic benefits are probable.
Furthermore, NORMA Group intends, and has sufficient resources, to complete development and use or sell the asset. The costs capitalised include the cost of materials, direct labour and other directly attributable expenditure that serves to prepare the asset for use. Such capitalised costs are included in profit or loss in line ‘own work capitalised’. Capitalised development costs are stated at cost less accumulated amortisation and impairment losses with an amortisation period of generally three to five years. Development costs which did not meet the requirements are expensed as incurred.
(c) Other intangible assetsSeparately acquired other intangible assets are shown at historical cost less accumulated amortisation. Intangible assets acquired in a business combination are recognised at fair value at the acquisition date. All other intangible assets have a finite useful life. Amortisation is calculated using the straightline method to allocate their cost.
In general, the Group’s other intangibles are not qualifying assets in accordance with IAS 23 and borrowing costs eligible for capital isation therefore do not exist.
The useful lives of other intangible assets acquired in a business combination are estimates based on the economics of each specific asset which were determined in the process of the purchase price allocation.
The estimated useful lives for other intangible assets are as follows:
Patents: 5 to 10 years Certificates (Customer lists): 4 to 20 years Technology: 10 to 20 years Licences, rights: 3 to 5 years Trademarks: 20 years Software: 3 to 5 years Development costs: 3 to 5 years
6. Property, plant and equipmentAll property, plant and equipment are stated at historical cost less depreciation and impairment loss, if applicable. Historical cost includes expenditure that is directly attributable to the acquisition of the items and, if any, estimated costs for dismantling and removing the assets, restoring the site on which it is allo cated. Borrowing costs eligible for capitalisation in the sense of IAS 23 were not available.
Subsequent costs are included in the asset’s carrying amount or recognised as a separate asset, as appropriate, only when it is foreseeable that future economic benefits associated with the item will flow to the Group and the cost of the item can be measured reliably. The carrying amount of the replaced part is derecognised. All other repairs and maintenance expenses are charged to profit or loss during the financial period in which they are incurred.
Land is not depreciated. Depreciation on other assets is calculated using the straightline method to allocate their cost to their residual values over their estimated useful lives.
The assets’ residual values and useful lives are reviewed, and adjusted if appropriate, at each balance sheet date.
An asset’s carrying amount is written down to its recoverable amount if the asset’s carrying amount is greater than its esti mated recoverable amount.
Gains and losses on disposals are determined by comparing the proceeds with the carrying amount and are recognised within ‘other operating income / expenses’.
The estimated useful lives for property, plant and equipment are as follows:
Buildings: 8 to 33 years Machinery and technical equipment: 3 to 18 years Tools: 3 to 8 years Other equipment: 2 to 20 years Land is not depreciated
7. Impairment of non-financial assetsAssets that have an indefinite useful life, for example goodwill, are not subject to amortisation and are tested annually for impairment, as well as whenever there are indications that the carrying amount of the cash generating unit (CGU) is impaired. If the impair ment loss recognised for the CGU exceeds the carrying amount of the allocated goodwill, the additional amount of the impairment loss is recognised through a prorata reduction of the carrying amount of the assets allocated to the CGU. Assets that are subject to amortisation are reviewed for impairment whenever events or changes in circumstances indicate that the carrying amount may not be recoverable. An impairment loss is recognised for the amount by which the asset’s carrying amount exceeds its recoverable amount. The recoverable amount is the higher of an asset’s fair value less costs to sell and value in use. For the purposes of assessing impairment, assets are grouped at the lowest levels for which there are separately identifiable cash flows (cashgenerating units). Nonfinancial assets other than goodwill that suffered impairment are reviewed for possible reversal of the impairment at each reporting date.
NORMA Group SE Annual Report 2013132
8. InventoriesInventories are stated at the lower of cost and net realisable value. Net realisable value is the estimated selling price in the ordinary course of business, less the estimated costs of completion and the estimated variable selling costs. Cost is determined using the weightedaveragemethod. The cost of finished goods and work in progress comprises of design costs, raw materials, direct labour, other direct costs and related production overheads (based on normal operating capacity). Inventories of the Group are not qualifying assets in accordance with IAS 23, so that the acquisition or production costs do not include being capitalised borrowing costs.
9. Financial instrumentsFinancial assetsClassificationThe Group classifies its financial assets in the following categories: at fair value through profit or loss, loans and receivables, available-for-sale and held to maturity. The classification depends on the purpose for which the financial assets were acquired. Management determines the classification of its financial assets at initial recognition.
In the current and in the previous financial year, all financial assets, except for derivative financial instruments, are classified in the category loans and receivables.
Loans and receivables are nonderivative financial assets with fixed or determinable payments that are not quoted in an active market. They are included in current assets, except for maturities greater than 12 months after the balance sheet date. These are classified as noncurrent assets. The Group’s loans and receivables comprise ‘trade and other receivables’ ( paragraph 11) and cash and cash equivalents ( see paragraph 12) in the statement of financial position.
Recognition and measurementRegular purchases and sales of financial assets are recognised on the tradedate – the date on which the Group commits to purchase or sell the asset. Financial assets are initially recognised at fair value plus transaction costs for all financial assets not carried at fair value through profit or loss. Financial assets are derecognised when the rights to receive cash flows have expired or have been transferred and the Group has transferred substantially all risks and rewards of ownership. Loans and receivables are carried at amortised cost using the effective interest method.
Impairment of financial assets carried at amortised costThe Group assesses at the end of each reporting period whether there is objective evidence that a financial asset or group of financial assets is impaired. A financial asset or a group of financial assets is impaired and impairment losses are incurred only if there
is objective evidence of impairment as a result of one or more events that occurred after the initial recognition of the asset (a ‘loss event’) and that loss event (or events) has (have) an impact on the estimated future cash flows of the financial asset or group of financial assets that can be reliably estimated.
The criteria that the Group uses to determine if there is objective evidence of an impairment loss include:
Financial difficulty of the issuer or obligor;
A breach of contract, such as a default or delinquency in interest or principal payments;
The Group, for economic or legal reasons relating to the borrower’s financial difficulty, granting to the borrower a concession that the lender would not otherwise consider;
It becomes probable that the borrower will enter bankruptcy or other financial reorganisation;
Observable data indicating that there is a measurable decrease in the estimated future cash flows from a portfolio of financial assets since the initial recognition of those assets, although the decrease cannot yet be identified with the individual financial assets in the portfolio, including:
(i) Adverse changes in the payment status of borrowers in the portfolio; and
(ii) National or local economic conditions that correlate with defaults on the assets in the portfolio.
The Group first assesses whether objective evidence of impairment exists.
The amount of the loss is measured as the difference between the asset’s carrying amount and the present value of estimated future cash flows (excluding future credit losses that have not been incurred) discounted at the financial asset’s original effective interest rate. The asset’s carrying amount is reduced and the amount of the loss is recognised in profit or loss. If a loan has a variable interest rate, the discount rate for measuring any impairment loss is the current effective interest rate determined under the contract.
If, in a subsequent period, the amount of the impairment loss decreases and the decrease can be related objectively to an event occurring after the impairment was recognised (such as an improvement in the debtor’s credit rating), the reversal of the previously recognised impairment loss is recognised in profit or loss.
Impairment testing of trade receivables is described in paragraph 11.

133Consolidated Financial Statements
Notes to the Consolidated Financial Statements
Financial liabilitiesFinancial liabilities primarily include trade payables, liabilities to banks, derivative financial liabilities ( paragraph 11), and other liabilities.
a) Financial liabilities that are measured at amortised cost After initial recognition, financial liabilities are carried at amor
tised cost using the effective interest method. In this category, in particular, trade payables, liabilities to banks and other financial liabilities are classified.
b) Financial liabilities at fair value through profit and loss Financial liabilities at fair value through profit and loss include
derivative financial instruments unless they are designated as hedges and contingent purchase price liabilities. Gains or losses on financial liabilities that are measured at fair value through profit and loss are included in profit or loss.
10. Offsetting financial instrumentsFinancial assets and liabilities are offset and the net amount is reported in the consolidated statement of financial position when there is a legally enforceable right to offset the recognised amounts and there is an intention to settle on a net basis, or realise the asset and settle the liability simultaneously. In 2013 and 2012, no financial instruments were offset and there were no financial assets or liabilities with netting agreements, enforceable master netting agreements or similar agreements.
11. Derivative financial instruments and hedging activitiesDerivatives are initially recognised at fair value on the date a deriva tive contract is entered into and are subsequently remeasured at their fair value. The method of recognising the resulting gain or loss depends on whether the derivative is designated as a hedging instrument, and if so, the nature of the item being hedged.
(a) Derivative financial instruments not designated as hedgesGains and losses from derivatives that are not designated as hedges (trading derivatives) are recognised in profit or loss. Trading derivatives are classified as noncurrent assets or liabilities in accordance with IAS 1.68 and 1.71 if they are due after more than one year; otherwise they are classified as current.
(b) Derivative financial instruments designated as hedgesDerivatives included in hedge accounting are generally designated as either:
Hedges of the fair value of recognised assets or liabilities or a firm commitment (fair value hedge);
Hedges of a particular risk associated with a recognised asset or liability or a highly probable forecast transaction (cash flow hedge); or
Hedges of a net investment in a foreign operation (net investment hedge).
At NORMA Group, at present, only cash flow hedges occur.
At the inception of the transaction the relationship between the hedging instrument and hedged item is documented, as well as the risk management objectives and strategy for undertaking the hedging transaction. The Group also documents its assessment, both at hedge inception and on an ongoing basis, of whether the derivatives that are used in hedging transactions are highly effective in offsetting changes in the cash flows of hedged items.
The effective portion of changes in the fair value of derivatives that are designated and qualify as cash flow hedges is recognised in other comprehensive income. The gain or loss relating to the ineffective portion is recognised immediately in the statement of comprehensive income within ‘financial income / costs.’ Amounts accumulated in other comprehensive income are reclassified to profit or loss in the periods when the hedged item affects profit or loss.
The full fair value of a hedging derivative is classified as a noncurrent asset or liability when the remaining maturity of the hedged item is more than 12 months and as a current asset or liability when the remaining maturity of the hedged item is less than 12 months.
The fair values of derivative financial instruments used for hedging purposes and of those held for trading are disclosed in Note 23. Movements on the hedging reserve in equity are shown in Note 27.
12. Trade receivablesTrade receivables are amounts due from customers for merchandise sold or services performed in the ordinary course of business. If collection is expected within one year or less, they are classified as current assets. If not, they are presented as noncurrent assets.
Trade receivables are classified as loans and receivables in accordance with IAS 39 and recognised initially at fair value and subsequently measured at amortised cost using the effective interest method, less provision for impairment. An allowance of doubtful accounts of trade receivables is established when there is objective evidence that the Group will not be able to collect all amounts due according to the original terms of the receivables. Significant financial difficulties of the debtor, the probability that the debtor will enter bankruptcy or financial reorganisation, and default or delinquency in payments are considered indicators that the trade receivable is impaired. The amount of the allowance is the difference between the asset’s carrying amount and the present value of estimated future cash flows, discounted at the orig

NORMA Group SE Annual Report 2013134
inal effective interest rate. In addition to the required individual bad debt allowances, the Group will determine a portfolio based bad debt allowance considering the aging structure for trade receivables to cover general credit risk if this is applicable.
13. Cash and cash equivalentsCash and cash equivalents are measured at their nominal value and includes cash in hand, deposits held at call with banks, and other shortterm highly liquid investments with original maturities of three months or less and which are subject only to insignificant risk of change in value. Bank overdrafts are shown within borrowings in current liabilities on the consolidated statement of financial position.
14. Trade payablesTrade payables are obligations to pay for goods or services that have been acquired in the ordinary course of business from suppliers. Accounts payable are classified as current liabilities if payment is due within one year or less. If not, they are presented as noncurrent liabilities.
Trade payables are recognised initially at fair value and subsequently measured at amortised cost using the effective interest method.
15. BorrowingsBorrowings are recognised initially at fair value, net of transaction costs incurred. Borrowings are subsequently stated at amortised cost; any difference between the proceeds (net of transaction costs) and the redemption value is recognised in profit or loss over the period of the borrowings using the effective interest method.
Fees paid on the establishment of loan facilities are recognised as transaction costs of the loan to the extent that it is probable that some or all of the facility will be drawn down. In this case, the fee is deferred until the drawdown occurs. To the extent there is no evidence that it is probable that some or all of the facility will be drawn down, the fee is capitalised as a prepayment for liquidity services and amortised over the period of the facility to which it relates.
Borrowings are classified as current liabilities unless the Group has an unconditional right to defer settlement of the liability for at least 12 months after the balance sheet date.
16. Current and deferred income taxThe tax expenses for the period are comprised of current and deferred tax. Tax is recognised in profit or loss, except to the extent that it relates to items recognised in other comprehensive income or directly in equity. In this case, the tax is also recognised in other comprehensive income or directly in equity, respectively.
The current income tax charge is calculated on the basis of the tax laws enacted or substantively enacted at the balance sheet date in the countries where the Group’s subsidiaries operate and generate taxable income. Management periodically evaluates positions taken in tax returns with respect to situations in which applicable tax regulation is subject to interpretation. It establishes provisions where appropriate on the basis of amounts expected to be paid to the tax authorities.
Deferred income tax is recognised, using the liability method, on temporary differences arising between the tax bases of assets and liabilities and their carrying amounts in the consolidated financial statements and on tax losses carried forward. However, the deferred income tax is not accounted for if it arises from initial recognition of an asset or liability in a transaction other than a business combination that at the time of the transaction affects neither accounting nor taxable profit or loss. Deferred income tax is determined using tax rates (and laws) that have been enacted or substantially enacted by the balance sheet date and are expected to apply when the related deferred income tax asset is realised or the deferred income tax liability is settled.
Deferred income tax assets are recognised only to the extent that it is probable that future taxable profit will be available against which the temporary differences can be utilised.
Deferred income tax is provided on temporary differences arising on investments in subsidiaries and associates, except where the timing of the reversal of the temporary difference is controlled by the Group and it is probable that the temporary difference will not reverse in the foreseeable future.
Deferred income tax assets and liabilities are offset when there is a legally enforceable right to offset current tax assets against current tax liabilities and when the deferred income tax assets and liabilities relate to income taxes levied by the same taxation authority on either the taxable entity or different taxable entities where there is an intention to settle the balances on a net basis.
17. Employee benefits(a) Pension obligationsGroup companies operate different pension schemes. NORMA Group has both defined benefit and defined contribution plans. A defined contribution plan is a pension plan under which the Group pays fixed contributions to a separate entity. The Group has no legal or constructive obligations to pay further contributions if the fund does not hold sufficient assets to pay all employees the benefits relating to employee service in the current and prior periods. A defined benefit plan is a pension plan that is not a defined contribution plan. The major defined benefit plan is the German benefit plan which defines the amount of pension benefit that an employee will receive on retirement to depend on years of service and compensation.

135Consolidated Financial Statements
Notes to the Consolidated Financial Statements
The liability recognised in the consolidated statement of financial position with respect to defined benefit pension plans is the present value of the defined benefit obligation at the balance sheet date less the fair value of plan assets. The defined benefit obligation is calculated annually by independent actuaries using the projected unit credit method. The present value of the defined benefit obligation is determined by discounting the estimated future cash outflows using interest rates of highquality corporate bonds that are denominated in the currency in which the benefits will be paid and that have terms to maturity approximating the terms of the related pension liability.
Remeasurement gains and losses arising from experience adjustments and changes in actuarial assumptions are recognised within retained earnings in the other comprehensive income (OCI).
Past service costs are recognised fully in the period of the re lated plan amendment.
For defined contribution plans, the Group pays contributions to publicly or privately administered pension insurance plans on a mandatory, contractual or voluntary basis. The Group has no further payment obligations once the contributions have been paid. The contributions are recognised as employee benefits expense when they are due. Prepaid contributions are recognised as an asset to the extent that a cash refund or a reduction in the future payments is available.
(b) Termination benefitsTermination benefits are payable when employment is termi nated by the Group before the normal retirement date, or whenever an employee accepts voluntary redundancy in exchange for these benefits. The Group recognises termination benefits as a liability and expense at the earlier date of: (a) when the entity can no longer withdraw the offer of those benefits; or (b) when the en tity recognise costs for a restructuring that is within the scope of IAS 37 and involves the payment of termination benefits. Benefits falling due more than 12 months after the balance sheet date are discounted to their present value.
(c) Short-term employee benefitsEmployee benefits with shortterm payment dates include wages and salaries, social security contributions, vacation pay and sickness benefits and are recognised as liabilities at the repayment amount as soon as the associated job has been performed.
(d) Provisions for other long-term employee benefitsProvisions for obligations similar to pensions (such as anni versary allowances and death benefits) are comprised of the present value of future payment obligations to the employee less any associated assets measured at fair value. The amount of pro
visions is determined on the basis of actuarial opinions in line with IAS 19. Gains and losses from the remeasurement are recognised in profit or loss in the period in which they are incurred.
18. Share-based paymentSharebased payment plans issued in the NORMA Group are accounted for in accordance with IFRS 2 “Sharebased payment” All sharebased payment transactions fall within the scope of IFRS 2, unless the transaction is clearly for a purpose other than payment for goods or services supplied to the entity receiving them. The objective of IFRS 2 is that an entity should recognise all goods or services it obtains, regardless of the form of consideration. IFRS 2 starts from the premise that goods or services obtained in a sharebased payment transaction should be recognised and measured in a similar way.
In accordance with IFRS 2, NORMA Group in principle distinguishes between equitysettled and cashsettled plans. The finan cial interest from equitysettled plans granted at grant date is generally allocated over the expected vesting period against equity until the exit event occurs. Expenses from cashsettled plans are generally also allocated over the expected vesting period until the exit event occurs, but against accruals. A description of the plans existing within the NORMA Group can be found in Note 28.
19. ProvisionsProvisions are recognised when the Group has a present legal or constructive obligation to third parties as a result of past events; it is probable that an outflow of resources will be required to settle the obligation; and the amount has been reliably estimated. Provisions are not recognised for future operating losses.
Where there are a number of similar obligations, the likelihood that an outflow will be required in settlement is determined by considering the class of obligations as a whole. A provision is recognised even if the likelihood of an outflow with respect to any one item included in the same class of obligations may be small.
Provisions are measured at the present value of the expenditures expected to be required to settle the obligation taking into account all identifiable risks. Provisions are discounted using a pretax rate that reflects current market assessments of the time value of money and the risks specific to the obligation. The increase in the provision due to passage of time is recognised as interest expense.
In addition to the expected amount of cash outflows, uncertainties also exist regarding time of outflows. If it is expected that the outflows take place within one year, the relevant amounts are reported in the shortterm provisions.
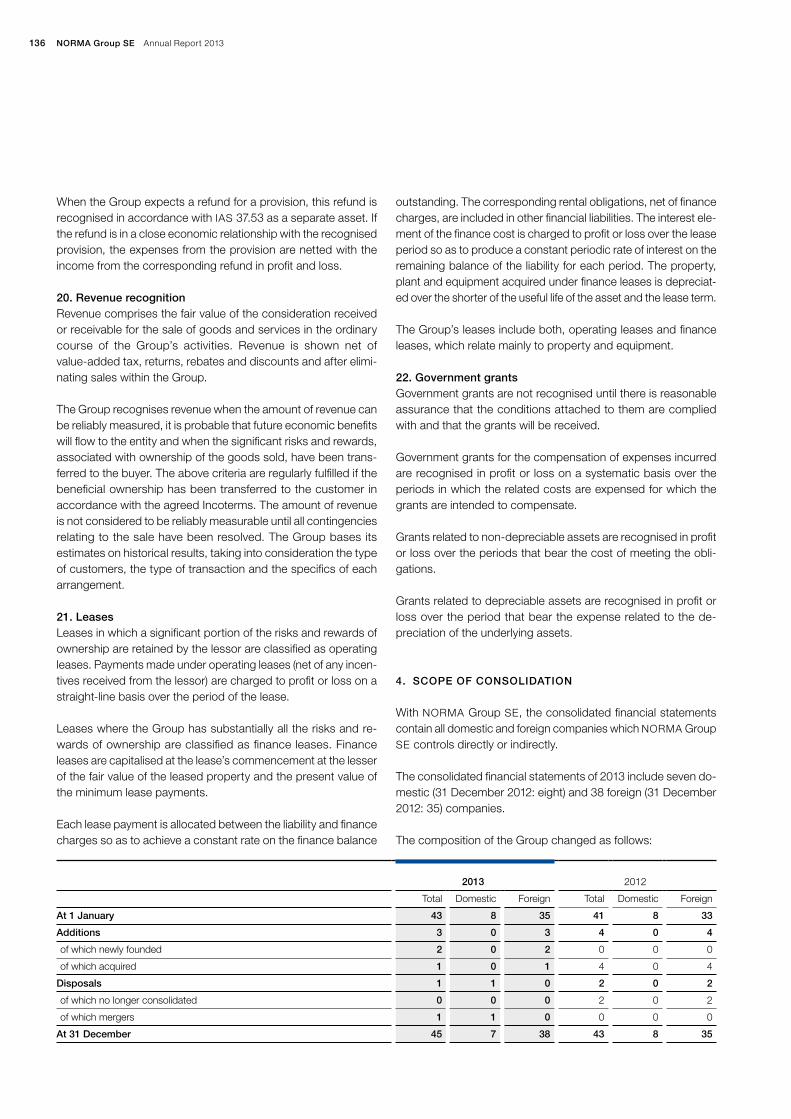
NORMA Group SE Annual Report 2013136
When the Group expects a refund for a provision, this refund is recognised in accordance with IAS 37.53 as a separate asset. If the refund is in a close economic relationship with the recognised provision, the expenses from the provision are netted with the income from the corresponding refund in profit and loss.
20. Revenue recognitionRevenue comprises the fair value of the consideration received or receivable for the sale of goods and services in the ordinary course of the Group’s activities. Revenue is shown net of valueadded tax, returns, rebates and discounts and after eliminating sales within the Group.
The Group recognises revenue when the amount of revenue can be reliably measured, it is probable that future economic benefits will flow to the entity and when the significant risks and rewards, associated with ownership of the goods sold, have been transferred to the buyer. The above criteria are regularly fulfilled if the beneficial ownership has been transferred to the customer in accordance with the agreed Incoterms. The amount of revenue is not considered to be reliably measurable until all contingencies relating to the sale have been resolved. The Group bases its estimates on historical results, taking into consideration the type of customers, the type of transaction and the specifics of each arrangement.
21. LeasesLeases in which a significant portion of the risks and rewards of ownership are retained by the lessor are classified as operating leases. Payments made under operating leases (net of any incentives received from the lessor) are charged to profit or loss on a straightline basis over the period of the lease.
Leases where the Group has substantially all the risks and rewards of ownership are classified as finance leases. Finance leases are capitalised at the lease’s commencement at the lesser of the fair value of the leased property and the present value of the minimum lease payments.
Each lease payment is allocated between the liability and finance charges so as to achieve a constant rate on the finance balance
outstanding. The corresponding rental obligations, net of finance charges, are included in other financial liabilities. The interest element of the finance cost is charged to profit or loss over the lease period so as to produce a constant periodic rate of interest on the remaining balance of the liability for each period. The property, plant and equipment acquired under finance leases is depreciated over the shorter of the useful life of the asset and the lease term.
The Group’s leases include both, operating leases and finance leases, which relate mainly to property and equipment.
22. Government grantsGovernment grants are not recognised until there is reasonable assurance that the conditions attached to them are complied with and that the grants will be received.
Government grants for the compensation of expenses incurred are recognised in profit or loss on a systematic basis over the periods in which the related costs are expensed for which the grants are intended to compensate.
Grants related to nondepreciable assets are recognised in profit or loss over the periods that bear the cost of meeting the obligations.
Grants related to depreciable assets are recognised in profit or loss over the period that bear the expense related to the depreciation of the underlying assets.
4. SCOPE OF CONSOLIDATION
With NORMA Group SE, the consolidated financial statements contain all domestic and foreign companies which NORMA Group SE controls directly or indirectly.
The consolidated financial statements of 2013 include seven domestic (31 December 2012: eight) and 38 foreign (31 December 2012: 35) companies.
The composition of the Group changed as follows:
2013
2012
Total Domestic Foreign Total Domestic Foreign
At 1 January 43 8 35 41 8 33
Additions 3 0 3 4 0 4
of which newly founded 2 0 2 0 0 0
of which acquired 1 0 1 4 0 4
Disposals 1 1 0 2 0 2
of which no longer consolidated 0 0 0 2 0 2
of which mergers 1 1 0 0 0 0
At 31 December 45 7 38 43 8 35

137Consolidated Financial Statements
Notes to the Consolidated Financial Statements
LIST OF GROUP COMPANIES OF NORMA GROUP AS OF 31 DECEMBER 2013
Share in %
No. Company Registered addressheld
by
Direct parent
company
of NORMA
Group SE
Currency Equity 1) Result 1)
Central Functions
01 NORMA Group SE Maintal, Germany
02 NORMA Group APAC Holding GmbH Maintal, Germany 01 100.00 100.00 kEUR 44 – 3
03 NORMA Group Holding GmbH Maintal, Germany 01 100.00 100.00 kEUR 115,959 29,825
Segment EMEA
04 NORMA Distribution Center GmbH Marsberg, Germany 03 94.80 100.00 kEUR 2,175 0 3)
05 DNL GmbH & Co KG Maintal, Germany 03 100.00 100.00 kEUR 6,537 – 6
06 NORMA Germany GmbH Maintal, Germany 03 94.90 100.00 kEUR 56,306 0 3)
07 NORMA Türkei Verwaltungs GmbH Maintal, Germany 03 100.00 100.00 kEUR 26 – 5
08 DNL France S.A.S Briey, France 03 100.00 100.00 kEUR 12,529 – 967
09 NORMA Distribution France S.A.S. La Queue En Brie, France 08 100.00 100.00 kEUR 3,728 705
10 NORMA France S.A.S. Briey, France 08 100.00 100.00 kEUR 6,120 132
11 DNL UK Ltd. Newbury, Great Britain 03 100.00 100.00 kGBP 3,931 – 359
12 NORMA UK Ltd. Newbury, Great Britain 11 100.00 100.00 kGBP 20,199 6,419
13 Nordic Metalblok S.r.l. Riese Pio X, Italy 03 100.00 100.00 kEUR 670 – 100
14 NORMA Italia SpA Gavardo, Italy 19 100.00 100.00 kEUR 6,256 1,286
15 Groen Bevestigingsmaterialen B.V. Ter Apel, Netherlands 03 60.00 90.00 kEUR 1,639 782
16 NORMA Netherlands B.V. Ter Apel, Netherlands 19 100.00 100.00 kEUR 6,268 1,360
17 NORMA Polska Sp. z o.o. Slawniów, Poland 03 100.00 100.00 kPLN 154,029 38,190
18 NORMA Group CIS LLC Togliatti, Russian Federation 03 99.96 100.00 kRUR 21,869 – 31,482
19 DNL Sweden AB Stockholm, Sweden 03 100.00 100.00 kSEK 78,100 10,865
20 NORMA Sweden AB Anderstorp, Sweden 19 100.00 100.00 kSEK 115,095 17,827
21 Connectors Verbindungstechnik AG Tagelswangen, Switzerland 03 100.00 100.00 kCHF 9,387 2,446
22 NORMA Group South East Europe d.o.o Belgrade, Serbia 03 100.00 100.00 kRSD 1,538,155 – 591,830
23 Fijaciones NORMA S.A. Barcelona, Spain 03 100.00 100.00 kEUR 4,190 1,012
24 NORMA Czech, s.r.o. Hustopece, Czech Republic 19 99.90 100.00 kCZK 255,633 25,135
25 NORMA Turkey Baglanti ve Birlestirme Teknolojileri Sanayi ve Ticaret Limited Sirketi
Besiktas, Istanbul, Turkey 07 100.00 100.00 kTRL 1,514 828
26 NORMA Group Distribution Polska Sp. z o.o. Krakow, Poland 17 100.00 100.00 kPLN 4,567 – 433
Segment Americas
27 Craig Assembly Inc. St. Clair, USA 30 100.00 100.00 kUSD 19,948 4,886
28 NORMA Michigan Inc. Auburn Hills, USA 30 100.00 100.00 kUSD 61,606 8,604
29 NORMA US Holding LLC Saltsburg, USA 30 100.00 100.00 kUSD 26,421 – 1,519
30 NORMA Pennsylvania Inc. Saltsburg, USA 01 100.00 100.00 kUSD 51,178 3,511
31 R.G. RAY Corporation Buffalo Grove, USA 30 100.00 100.00 kUSD 71,711 8,334
32 NORMA do Brasil Sistemas De Conexão Ltda. São Paulo, Brazil 30 99.90 100.00 kBRL 23,970 – 2,978
33 NORMA Group México S. de R.L. de C.V. Monterrey, Mexico 28 99.50 100.00 kUSD 2,058 1,495
Segment Asia-Pacific
34 NORMA Pacific Pty. Ltd. Melbourne, Australia 41 100.00 100.00 kAUD 13,820 489
35 NORMA China Co., Ltd. Qingdao, China 03 100.00 100.00 kCNY 79,689 7,386
36 NORMA Group Products India Pvt. Ltd. Pune, India 41 99.99 100.00 kINR 315,844 – 95,555
37 NORMA Japan Inc. Osaka, Japan 41 60.00 60.00 kJPY 122,595 3,239
38 Chien Jin Plastic Sdn. Bhd. Ipoh, Malysia 41 85.00 100.00 kMYR 19,154 4,213
39 NORMA Pacific (Malaysia) SDN. BHD. Kuala Lumpur, Malaysia 41 100.00 100.00 kMYR 2) 2)
40 NORMA Korea Inc. Seoul, Republic of Korea 41 100.00 100.00 kKRW 105,283 106,167
41 NORMA Group Asia Pacific Holding Pte. Ltd Singapore, Singapore 01 100.00 100.00 kSGD 59,488 – 4,765
42 NORMA Pacific Asia Pte. Ltd. Singapore, Singapore 41 100.00 100.00 kSGD 176 – 36
43 NORMA Pacific (Thailand) Ltd. Chonburi, Thailand 41 100.00 100.00 kTHB 68,603 15,547
44 Guyco Pty Ltd Adelaide, Australia 34 100.00 100.00 kAUD 4,390 – 119
45 NORMA EJT (Changzhou) Co., Ltd. Jiangsu Province, China 41 100.00 100.00 kCNY 41,133 – 9
1) Reported values according to IFRS as at 31 December 2013; except for NORMA Group Holding GmbH, NORMA Germany GmbH, NORMA Distribution Center GmbH and DNL GmbH & Co. KG; these values are prepared according to German GAAP as at 31 December 2013 but not yet finally audited. The values are translated with the exchange rates according to Note 3.4.
2) Included in NORMA Pacific Pty. Ltd. (No. 34).3) A profitpoolingcontract exists.

NORMA Group SE Annual Report 2013138
In 2013, NORMA Group Distribution Polska Sp. z o.o., based in Poland and NORMA EJT (Changzhou) Co., Ltd., based in China, were founded. Furthermore, Guyco Pty Limited, based in Australia, was acquired and NORMA Beteiligungs GmbH was merged into NORMA Group Holding GmbH.
For further details, please refer to Note 40 business combinations.
For a detailed overview regarding the shareholdings of NORMA Group, please refer to the chart on the previous page.
5. FINANCIAL RISK MANAGEMENT
1. Financial risk factorsThe Group’s activities expose it to a variety of financial risks, comprising of market risk, credit risk and liquidity risk. The Group’s financial risk management focuses on the unpredict ability of financial markets and seeks to minimise its potential adverse effects on the Group’s financial performance. The Group uses derivative financial instruments to hedge certain risk exposures.
Financial risk management is carried out by a central treasury department (Group Treasury). The necessary responsibilities and controls associated with risk management are determined by Group management. Group Treasury identifies, evaluates and hedges financial risks in close cooperation with the Group’s operating units.
Market risk(i) Foreign exchange riskNORMA Group operates internationally in around 100 different countries and is exposed to foreign exchange risk arising from the exposure to various currencies – primarily with respect to the US dollar, the British pound sterling, the Chinese renminbi yuan, the Polish zloty, the Swedish krona, the Swiss franc, the Serbian dinar and the Singapore dollar.
The effects of changes in foreign exchange rates are analysed below for financial assets and liabilities denominated in foreign currencies.
If the euro had strengthened / weakened by 10 % against the US dollar, NORMA Group would show a profit before tax for the year 2013 of EUR 172 thousand lower / EUR 211 thousand higher (2012: EUR 102 thousand lower / EUR 125 thousand higher).
If the euro had strengthened / weakened by 10 % against the British pound sterling, NORMA Group would show a profit before tax for the year 2013 of EUR 344 thousand higher / EUR 420 thousand lower (2012: EUR 309 thousand higher / EUR 378 thousand lower).
If the euro had strengthened / weakened by 10 % against the Chinese renminbi, NORMA Group would show a profit before tax for the year 2013 of EUR 8 thousand higher / EUR 9 thousand lower (2012: EUR 225 thousand lower / EUR 275 thousand higher).
If the euro had strengthened / weakened by 10 % against the Polish zloty, NORMA Group would show a profit before tax for the year 2013 of EUR 755 thousand higher / EUR 922 thousand lower (2012: EUR 830 thousand higher / EUR 1,014 thousand lower).
If the euro had strengthened / weakened by 10 % against the Swedish krona, NORMA Group would show a profit before tax for the year 2013 of EUR 97 thousand higher / EUR 118 thousand lower (2012: EUR 101 thousand higher / EUR 123 thousand lower).
If the euro had strengthened / weakened by 10 % against the Swiss franc, NORMA Group would show a profit before tax for the year 2013 of EUR 201 thousand higher / EUR 246 thousand lower (2012: EUR 214 thousand higher / EUR 262 thousand lower).
If the euro had strengthened / weakened by 10 % against the Serbian dinar, NORMA Group would show a profit before tax for the year 2013 of EUR 386 thousand higher / EUR 472 thousand lower (2012: EUR 112 thousand higher / EUR 136 thousand lower).
If the euro had strengthened / weakened by 10 % against the Singapore dollar, NORMA Group would show a profit before tax for the year 2013 of EUR 197 thousand lower / EUR 241 thousand higher (2012: EUR 188 thousand lower / EUR 230 thousand higher).
The Group Treasury’s risk management policy is to hedge about 80 % or more of anticipated operational cash flows in US dollar, British pound sterling and Swedish krona.
NORMA Group has certain investments in foreign operations whose net assets are exposed to foreign currency translation risks. This translation risk is primarily managed through borrowings in the relevant foreign currency.
(ii) Interest rate riskNORMA Group’s interest rate risk arises from longterm borrowings. Borrowings issued at variable interest rates expose the Group to cash flow interest rate risk which is partially offset by hedges (interest rate swaps). The Group’s policy is to maintain approximately 80 % of its mediumterm borrowings in fixed rate instruments.
Below, the effects of changes in interest rates are analysed for bank borrowings, which bear variable interest rates, and for interest rate swaps included in hedge accounting. Borrowings that bear fixed interest rates are excluded from this analysis.

139Consolidated Financial Statements
Notes to the Consolidated Financial Statements
At 31 December 2013, if interest rates on eurodenominated borrowings had been 100 basis points higher / lower with all other variables held constant, profit before tax for the year would have been EUR 55 thousand lower / EUR 55 thousand higher (2012: EUR 185 thousand lower / EUR 185 thousand higher) and other comprehensive income would have been EUR 2,525 thousand higher / EUR 2,584 thousand lower (2012: EUR 2,317 thousand higher / EUR 862 thousand lower).
(iii) Other price risksAs NORMA Group is not exposed to any other material eco nomic price risks, like stock exchange prices or commodity prices, an increase or decrease in the relevant market prices within reasonable margins would not have an impact on the Group’s profit or equity. Hence, the Group’s exposure to other price risks is regarded as not material.
Credit riskThe credit risk incurred by the Group is the risk that counter parties fail to meet their obligations arising from operating activities and from financial transactions. Credit risk arises from cash and cash equivalents and deposits with banks and financial institutions, as well as credit exposures to customers, including outstanding receivables and committed transactions.
Credit risk is monitored on a Group basis. To minimise credit risk from operating activities and financial transactions, each counterparty is assigned a credit limit, the use of which is regularly monitored. Default risks are continuously monitored in the operating business.
The aggregate carrying amounts of financial assets represent the maximum default risk. For an overview of pastdue receivables, please refer to Note 24 ‘Trade and other receivables.’ Given the Group’s heterogeneous customer structure, there is no risk concentration.
Liquidity riskPrudent liquidity risk management implies maintaining sufficient cash and marketable securities, the availability of funding through an adequate amount of committed credit facilities and the ability to close out market positions. Due to the dynamic nature of the underlying businesses, Group Treasury maintains flexibility in funding by maintaining availability under committed credit lines.
With the IPO of NORMA Group in April 2011, all bank borrowings were refinanced. The new syndicated bank facilities amounted to EUR 250 million, of which EUR 55 million had been repaid before 31 December 2013. In January 2014 there was an additionally repayment of EUR 101.4 million. In addition, a borrowing facility
in the amount of EUR 125 million is available for future operating activities and to settle capital commitments of which EUR 5.5 million was drawn at 31 December 2013 (31 December 2012: EUR 18.5 million). In July 2013, NORMA Group has issued a promissory note valued at EUR 125 million with 5, 7 and 10 year terms.
Liquidity is monitored on an ongoing basis with regard to the Group’s business performance, planned investment and redemption of capital.
The amounts disclosed in the table are the contractual, undiscounted cash flows. The early repayment in an amount of EUR 101.4 million is already considered within the maturity analysis. Financial liabilities denominated in foreign currencies are translated at the closing rate at the balance sheet date. Interest payments on financial instruments with variable interest rates are calculated on the basis of the interest rates applicable as of the reporting date.
31 DECEMBER 2013
in EUR thousands
up to 1 year
> 1 year
up to 2 years
> 2 years up to
5 years > 5 years
Borrowings 133,495 26,728 119,043 79,692
Trade payables 59,025 0 0 0
Finance lease liabilities 342 236 158 0
Other financial liabilities 4,367 508 736 0
197,229 27,472 119,937 79,692
31 DECEMBER 2012
in EUR thousands
up to 1 year
> 1 year
up to 2 years
> 2 years up to
5 years > 5 years
Borrowings 60,215 90,645 127,291 0
Trade payables 37,663 0 0 0
Finance lease liabilities 450 553 32 0
Other financial liabilities 1,820 1,792 489 0
100,148 92,990 127,812 0

NORMA Group SE Annual Report 2013140
The maturity structure of the derivative financial instruments based on cash flows is as follows:
31 DECEMBER 2013
in EUR thousands
up to 1 year
> 1 year
up to 2 years
> 2 years up to
5 years > 5 years
Derivative receivables – gross settlement
Cash outflows – 3,100
Cash inflows 3,192
Derivative liabilities – gross settlement
Cash outflows – 1,176
Cash inflows 1,126
Derivative liabilities – net settlement
Cash outflows – 6,927 – 8,293
– 6,885 0 – 8,293 0
31 DECEMBER 2012
in EUR thousands
up to 1 year
> 1 year
up to 2 years
> 2 years up to
5 years > 5 years
Derivative receivables – gross settlement
Cash outflows – 2,658
Cash inflows 2,761
Derivative liabilities – gross settlement
Cash outflows – 2,561
Cash inflows 2,447
Derivative liabilities – net settlement
Cash outflows – 24,675
– 11 0 – 24,675 0
2. Capital risk managementThe Group’s objectives when managing capital are to ensure that it will continue to be able to repay its debt and remain financially sound.
The Group is subject to certain financial covenants, total interest cover, total net debt cover, and equity ratio, which are monitored on an on-going basis. These financial covenants are based on the Group’s consolidated financial statements as well as on special definitions of the bank facilities agreements.
According to the covenants agreement total net debt cover, which is defined as Total net debt / Adjusted consolidated EBITDA,
should not exceed the value of 3.0 (2012: 3.0). The ratio is calcu-lated according to bank definitions. There were no covenant breaches in 2013 and 2012.
In the case of a covenant breach the Facility Agreement includes several ways to remedy a potential breach by rules of exemption or shareholder actions. If a covenant breach occurs and is not remedied the syndicated loans may, but are not required to be, withdrawn.
6. CRITICAL ACCOUNTING ESTIMATES
AND JUDGEMENTS
Estimates and judgments are continually evaluated and are based on historical experience, and expectations regarding future events that are believed to be reasonable under the circumstances.
The Group makes estimates and assumptions concerning the future. The resulting accounting estimates will, by definition, sel-dom equal the respective actual results. The estimates and assump tions that have a significant risk of causing a material adjustment to the carrying amounts of assets and liabilities with-in the next financial year are addressed below.
Estimated impairment of goodwillNORMA Group tests annually whether goodwill has suffered any impairment, in accordance with the accounting policy stated in Note 3.5. The recoverable amounts of cash-generating units have been determined based on fair-value-less-costs-to-sell calcula-tions. These calculations are based on discounted cash flow models, which require the use of estimates (Note 20).
In 2013 and 2012, no impairment of goodwill, which amounted to EUR 233,239 thousand at 31 December 2013 (31 December 2012: EUR 235,262 thousand), was necessary. Even if the dis-count rate would increase by + 2 % and the terminal value growth rate would be 0 %, the change of these key assumptions would not cause in any CGU the carrying amount to exceed its re-coverable amount.
Income taxesThe Group is subject to income taxes in numerous jurisdictions. Significant judgements are required in determining the worldwide provision for income taxes. There are many transactions and calculations for which the ultimate tax determination is uncertain. The Group recognises liabilities for anticipated tax audit issues based on estimates of whether additional taxes will be due. Where the final tax outcome of these matters is different from the amounts that were initially recorded, such differences will impact the current and deferred income tax assets and liabilities in the period in which such determination is made. At 31 December
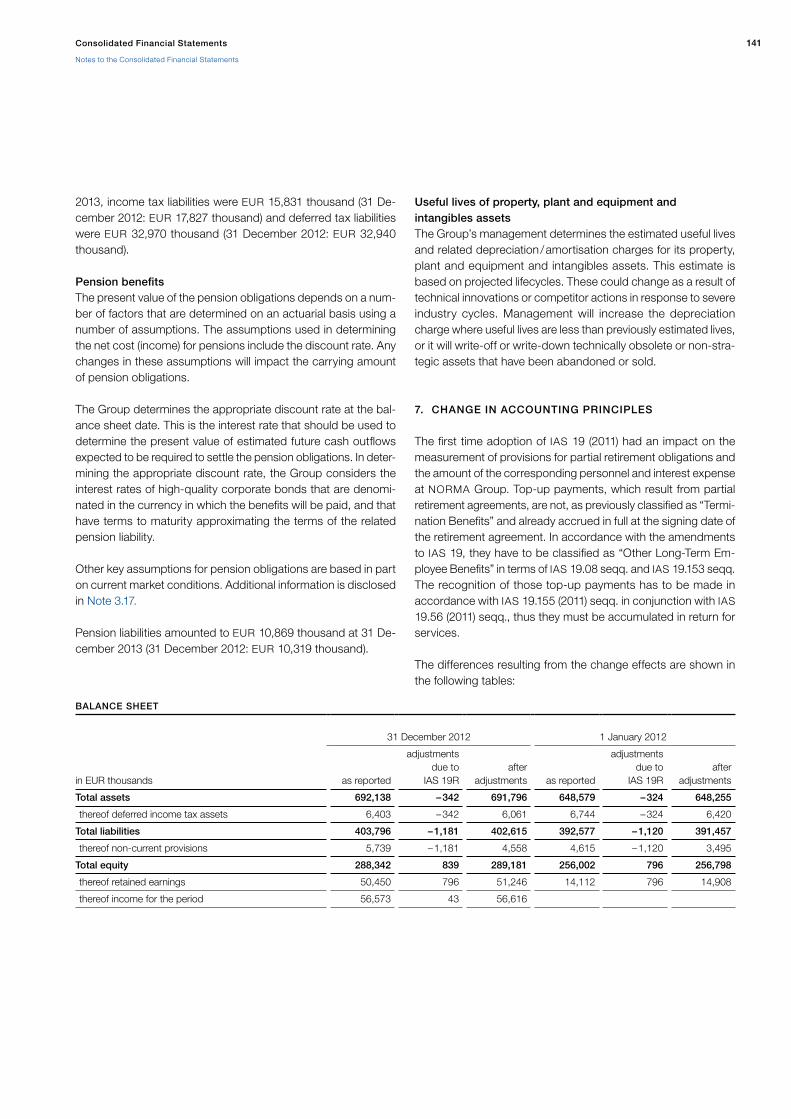
141Consolidated Financial Statements
Notes to the Consolidated Financial Statements
2013, income tax liabilities were EUR 15,831 thousand (31 De-cember 2012: EUR 17,827 thousand) and deferred tax liabilities were EUR 32,970 thousand (31 December 2012: EUR 32,940 thousand).
Pension benefitsThe present value of the pension obligations depends on a num-ber of factors that are determined on an actuarial basis using a number of assumptions. The assumptions used in determining the net cost (income) for pensions include the discount rate. Any changes in these assumptions will impact the carrying amount of pension obligations.
The Group determines the appropriate discount rate at the bal-ance sheet date. This is the interest rate that should be used to determine the present value of estimated future cash outflows expected to be required to settle the pension obligations. In deter-mining the appropriate discount rate, the Group considers the interest rates of high-quality corporate bonds that are denomi-nated in the currency in which the benefits will be paid, and that have terms to maturity approximating the terms of the related pension liability.
Other key assumptions for pension obligations are based in part on current market conditions. Additional information is disclosed in Note 3.17.
Pension liabilities amounted to EUR 10,869 thousand at 31 De-cember 2013 (31 December 2012: EUR 10,319 thousand).
Useful lives of property, plant and equipment and intangibles assetsThe Group’s management determines the estimated useful lives and related depreciation / amortisation charges for its property, plant and equipment and intangibles assets. This estimate is based on projected lifecycles. These could change as a result of technical innovations or competitor actions in response to severe industry cycles. Management will increase the depreciation charge where useful lives are less than previously estimated lives, or it will write-off or write-down technically obsolete or non-stra-tegic assets that have been abandoned or sold.
7. CHANGE IN ACCOUNTING PRINCIPLES
The first time adoption of IAS 19 (2011) had an impact on the measurement of provisions for partial retirement obligations and the amount of the corresponding personnel and interest expense at NORMA Group. Top-up payments, which result from partial retirement agreements, are not, as previously classified as “Termi-nation Benefits” and already accrued in full at the signing date of the retirement agreement. In accordance with the amendments to IAS 19, they have to be classified as “Other Long-Term Em-ployee Benefits” in terms of IAS 19.08 seqq. and IAS 19.153 seqq. The recognition of those top-up payments has to be made in accordance with IAS 19.155 (2011) seqq. in conjunction with IAS 19.56 (2011) seqq., thus they must be accumulated in return for services.
The differences resulting from the change effects are shown in the following tables:
BALANCE SHEET
31 December 2012
1 January 2012
in EUR thousands as reported
adjustments due to
IAS 19R after
adjustments as reported
adjustments due to
IAS 19R after
adjustments
Total assets 692,138 – 342 691,796 648,579 – 324 648,255
thereof deferred income tax assets 6,403 – 342 6,061 6,744 – 324 6,420
Total liabilities 403,796 – 1,181 402,615 392,577 – 1,120 391,457
thereof non-current provisions 5,739 – 1,181 4,558 4,615 – 1,120 3,495
Total equity 288,342 839 289,181 256,002 796 256,798
thereof retained earnings 50,450 796 51,246 14,112 796 14,908
thereof income for the period 56,573 43 56,616

NORMA Group SE Annual Report 2013142
INCOME STATEMENT
2012
in EUR thousands as reported
adjustments due to
IAS 19R after
adjustments
Profit before income tax 81,142 61 81,203
thereof personnel expenses – 156,468 – 36 – 156,504
thereof financial costs – 14,069 97 – 13,972
Income taxes – 24,569 – 18 – 24,587
Profit of the period 56,573 43 56,616
If the Group would have applied the previously existing version of IAS 19 in all periods presented in the consolidated financial statement 2013, the provisions were approximately EUR 1,100 thousand higher, the deferred income tax assets EUR 330 thou-sand lower and retained earnings EUR 770 thousand lower than reported as per December 2013. There would be no material impact on personnel, interest and tax expenses compared to the values reported in 2013.
Notes to the consolidated statement of comprehensive income
8. ADJUSTMENTS
In the financial year 2013, EUR 910 thousand tax expenses from corporate restructuring measures were adjusted within the position income taxes. Aside from this, in 2013, as already in 2012, no material one-time items occurred. Therefore, only de-preciation in the amount of EUR 496 thousand (2012: EUR 273 thousand) and amortisation in the amount of EUR 7,661 thousand (2012: EUR 7,211 thousand), both from purchase price allocations, were further adjusted.
The following table shows profit and loss net of these expenses:
in EUR thousands Note
2013 20121)
Revenue (9) 635,545 604,613
Changes in inventories of finished goods and work in progress 1,894 1,588
Other own work capitalised 3,377 1,671
Raw materials and consumables used (10) – 269,421 – 263,489
Gross profit 371,395 344,383
Other operating income and expenses (11, 12) – 72,387 – 67,090
Employee benefits expense (13) – 169,689 – 156,504
EBITDA 129,319 120,789
Depreciation without PPA depreciation – 16,699 – 15,392
Adjusted EBITA 112,620 105,397
Amortisation without PPA amortisation – 4,943 – 3,538
Adjusted operating profit (EBIT) 107,677 101,859
Financial costs – net (14) – 15,585 – 13,172
Adjusted profit before income tax 92,092 88,687
Adjusted income taxes – 30,027 – 26,853
Adjusted profit for the period 62,065 61,834
Non-controlling interests 59 0
Adjusted profit attributable to shareholders of the parent 62,006 61,834
Adjusted earnings per share (in EUR) 1.95 1.94
1) Restated due to effects from the application of IAS 19R. See: Section 2 Basis of preparation and Section 7 Change in accounting principles.
9. REVENUE
Revenue recognised during the period related to the following:
in EUR thousands
2013 2012
Engineered Joining Technologies 443,874 427,638
Distribution Services 193,617 174,505
Other revenue 2,190 6,319
Deductions – 4,136 – 3,849
635,545 604,613
Revenue for 2013 (EUR 635,545 thousand) was 5.1 % above revenue for 2012 (EUR 604,613 thousand).
The sales figures for 2013 include sales of EUR 8,061 thousand from the companies acquired in 2013. The distribution business of Davydick & Co. Pty Limited (Australia), which was acquired in the first quarter, contributed EUR 3,246 thousand, the distribution business of Variant S.A. (Poland), which was acquired in the

143Consolidated Financial Statements
Notes to the Consolidated Financial Statements
second quarter, contributed EUR 1,183 thousand and Guyco Pty Limited (Australia), which was acquired in the third quarter, con-tributed EUR 3,632 thousand.
For the analysis of sales by region please refer to Note 37 “Seg-ment reporting”.
10. RAW MATERIALS AND CONSUMABLES USED
Raw materials and consumables used comprised the following:
in EUR thousands
2013 2012
Cost of raw materials, consumables and supplies – 242,717 – 237,986
Cost of purchased services – 26,704 – 25,503
– 269,421 – 263,489
The material costs decreased in relation to revenue from 43.6 % in 2012 to 42.4 % in 2013.
The companies and distribution businesses acquired in 2013 contributed EUR 4,102 thousand to the material costs.
11. OTHER OPERATING INCOME
Other operating income comprised the following:
in EUR thousands
2013 2012
Currency gains operational 2,838 3,105
Reversal of provisions 352 367
Grants related to employee benefits expense 351 381
Reimbursement of vehicle costs 566 468
Other income from disposal of fixed assets 152 467
Foreign exchange derivatives 0 68
Government Grants 310 437
Others 2,414 4,243
6,983 9,536
The position “others” includes mainly reversal from accruals for variable components of remuneration for employees.
In 2012, the position “others” includes a one-time effect from the full consolidation of Groen Bevestigingsmaterialen B.V. amount-ing to EUR 1,296 thousand.
12. OTHER OPERATING EXPENSES
Other operating expenses comprised the following:
in EUR thousands
2013 2012
Consulting and marketing – 11,003 – 12,467
Expenses for temporary workforce and other personnel related costs – 12,326 – 12,045
Freights – 8,308 – 7,854
Other administrative expenses – 5,274 – 5,964
Rentals and other building costs – 6,965 – 6,063
Currency losses operational – 3,156 – 4,359
Travel and entertaining – 6,073 – 5,359
Research & development – 2,505 – 3,247
Vehicle costs – 2,691 – 2,445
Maintenance (external) – 2,223 – 1,884
Commission payable – 3,028 – 2,584
Non-income-related taxes – 1,734 – 1,529
Insurances – 1,993 – 1,614
IT and telecommunication – 9,059 – 7,372
Others – 3,032 – 1,840
– 79,370 – 76,626
The companies and distribution businesses acquired in 2013 contributed EUR 1,620 thousand to the other operating ex-penses.
13. EMPLOYEE BENEFITS EXPENSE
Employee benefits expense comprised the following:
in EUR thousands
2013 20121)
Wages and salaries and other termination benefits – 140,099 – 127,691
Social security costs – 21,839 – 21,877
Pension costs – defined contribution plans – 7,513 – 6,681
Pension costs – defined benefit plans – 238 – 255
– 169,689 – 156,504
1) Restated due to effects from the application of IAS 19R. See: Section 2 Basis of preparation and Section 7 Change in accounting principles.
The companies and distribution businesses acquired in 2013 contributed EUR 1,776 thousand to the employee benefits ex-penses.

NORMA Group SE Annual Report 2013144
14. FINANCIAL INCOME AND COSTS
Financial income and costs comprised the following:
in EUR thousands
2013 20121)
Financial costs
Interest expenses
Bank borrowings – 13,118 – 12,284
Finance lease – 28 – 34
Expenses for interest accrued on provisions – 55 – 271
Expenses for interest accrued on pensions – 248 – 356
Foreign exchange result on financing activities – 1,355 775
Losses on evalution of derivatives – 140 – 367
Other financial cost – 1,196 – 1,435
– 16,140 – 13,972
Financial income
Interest income on short-term bank deposits 485 263
Gains on evaluation of derivatives 0 136
Other financial income 70 401
555 800
Net financial cost – 15,585 – 13,172
1) Restated due to effects from the application of IAS 19R. See: Section 2 Basis of preparation and Section 7 Change in accounting principles.
The total interest expenses calculated using the effective interest method for financial liabilities that are not measured at fair value through profit or loss amount to EUR 13,118 thousand in 2013 (2012: EUR 12,284 thousand). The total interest income calcu lated using the effective interest method for financial assets not mea-sured at fair value through profit or loss amounts to EUR 485 thousand in 2013 (2012: EUR 263 thousand).
Costs amounting to EUR 7,859 thousand that are directly attri-butable to the refinancing of the IPO in April 2011 were netted with the bank borrowings in accordance with IAS 39.43. They are amortised over the financing period of five years using the effective interest method.
15. NET FOREIGN EXCHANGE GAINS/LOSSES
The exchange differences recognised in profit or loss are as follows:
in EUR thousands Note
2013 2012
Currency gains operational (11) 2,838 3,105
Currency losses operational (12) – 3,156 – 4,359
Foreign exchange result on financing activities (14) – 1,355 775
– 1,673 – 479
16. EARNINGS PER SHARE
Earnings per share are calculated by dividing net income for the period attributable to NORMA Group’s shareholders by the weighted average number of shares issued during the period under review. NORMA Group has only issued common shares. In 2013, as in the previous year, the average weighted number of shares was 31,862,400.
Options issued out of the Matching-Stock-Programme (“MSP”) for the Board of NORMA Group had dilutive effects on earnings per share in the financial year 2013. A detailed description of the MSP can be found in Note 28 “Share based payments”. The dilutive effect on earnings per share is calculated using the trea-sury stock method.
Earnings per share in 2013 and 2012 were as follows:
Q4 2013 Q4 20121)
2013 20121)
Profit attributable to shareholders of the parent (in EUR thousands) 12,617 9,435 55,557 56,616
Number of weighted shares 31,862,400 31,862,400 31,862,400 31,862,400
Effect of dilutive share-based payment 145,020 0 138,204 0
Number of weighted shares (diluted) 32,007,420 31,862,400 32,000,604 31,862,400
Earnings per share (in EUR) 0.40 0.30 1.74 1.78
Earnings per share diluted (in EUR) 0.39 0.30 1.74 1.78
1) Restated due to effects from the application of IAS 19R. See: Section 2 Basis of preparation and Section 7 Change in accounting principle.
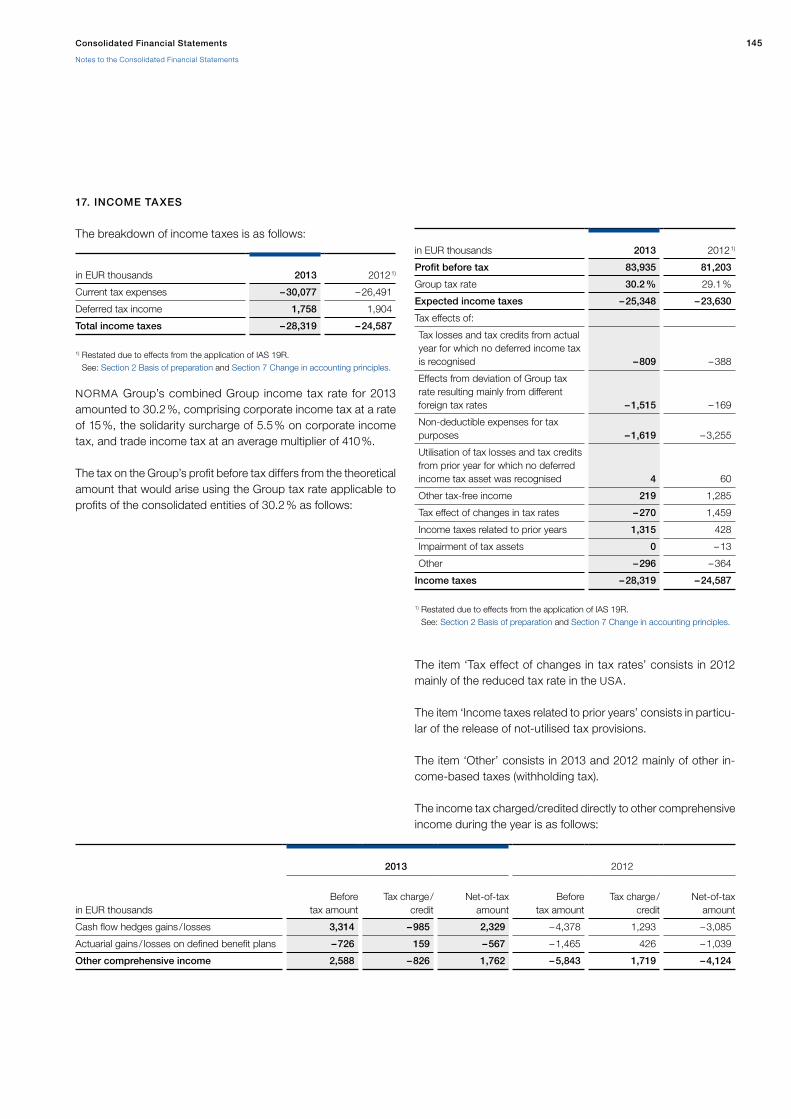
145Consolidated Financial Statements
Notes to the Consolidated Financial Statements
17. INCOME TAXES
The breakdown of income taxes is as follows:
in EUR thousands
2013 20121)
Current tax expenses – 30,077 – 26,491
Deferred tax income 1,758 1,904
Total income taxes – 28,319 – 24,587
1) Restated due to effects from the application of IAS 19R. See: Section 2 Basis of preparation and Section 7 Change in accounting principles.
NORMA Group’s combined Group income tax rate for 2013 amounted to 30.2 %, comprising corporate income tax at a rate of 15 %, the solidarity surcharge of 5.5 % on corporate income tax, and trade income tax at an average multiplier of 410 %.
The tax on the Group’s profit before tax differs from the theo retical amount that would arise using the Group tax rate applicable to profits of the consolidated entities of 30.2 % as follows:
in EUR thousands
2013 20121)
Profit before tax 83,935 81,203
Group tax rate 30.2 % 29.1 %
Expected income taxes – 25,348 – 23,630
Tax effects of:
Tax losses and tax credits from actual year for which no deferred income tax is recognised – 809 – 388
Effects from deviation of Group tax rate resulting mainly from different foreign tax rates – 1,515 – 169
Non-deductible expenses for tax purposes – 1,619 – 3,255
Utilisation of tax losses and tax credits from prior year for which no deferred income tax asset was recognised 4 60
Other tax-free income 219 1,285
Tax effect of changes in tax rates – 270 1,459
Income taxes related to prior years 1,315 428
Impairment of tax assets 0 – 13
Other – 296 – 364
Income taxes – 28,319 – 24,587
1) Restated due to effects from the application of IAS 19R. See: Section 2 Basis of preparation and Section 7 Change in accounting principles.
The item ‘Tax effect of changes in tax rates’ consists in 2012 mainly of the reduced tax rate in the USA.
The item ‘Income taxes related to prior years’ consists in particu-lar of the release of not-utilised tax provisions.
The item ‘Other’ consists in 2013 and 2012 mainly of other in-come-based taxes (withholding tax).
The income tax charged/credited directly to other comprehensive income during the year is as follows:
2013 2012
in EUR thousands
Before
tax amountTax charge /
creditNet-of-tax
amount
Before
tax amountTax charge /
creditNet-of-tax
amount
Cash flow hedges gains / losses 3,314 – 985 2,329 – 4,378 1,293 – 3,085
Actuarial gains / losses on defined benefit plans – 726 159 – 567 – 1,465 426 – 1,039
Other comprehensive income 2,588 – 826 1,762 – 5,843 1,719 – 4,124

NORMA Group SE Annual Report 2013146
Notes to the Consolidated Statement of Financial Position
18. INCOME TAX ASSETS AND LIABILITIES
Due to changes in German corporate tax laws (“SE-Steuergesetz” or “SEStEG”, which came into effect on 31 December 2006) an imputation credit asset (“Körperschaftsteuerguthaben gem. § 37 KStG”) has been set up. As a result, an unconditional claim for payment of the credit in ten annual instalments from 2008 through 2017 has been established. The resulting receivable is included in income tax assets and amounted to EUR 1,737 thousand on 31 December 2013 (31 December 2012: EUR 2,133 thousand). In 2013, EUR 1,260 thousand are classified as non-current (31 December 2012: EUR 1,656 thousand).
19. DEFERRED INCOME TAX
The analysis of deferred tax assets and deferred tax liabilities due to maturity is as follows:
in EUR thousands
31 Dec 2013 31 Dec 20121)
Deferred tax assets
Deferred tax assets to be recovered after more than 12 months 1,035 2,301
Deferred tax assets to be recovered within 12 months 6,480 3,760
Deferred tax assets 7,515 6,061
Deferred tax liabilities
Deferred tax liabilities to be recovered after more than 12 months 32,565 31,812
Deferred tax liabilities to be recovered within 12 months 405 1,128
Deferred tax liabilities 32,970 32,940
Deferred tax liabilities (net) 25,455 26,879
1) Restated due to effects from the application of IAS 19R. See: Section 2 Basis of preparation and Section 7 Change in accounting principles.
The movement in deferred income tax assets and liabilities during the year is as follows:
in EUR thousands
2013 20121)
Deferred tax liabilities (net) – at 1 January 26,879 27,355
Deferred tax income – 1,758 – 1,904
Tax charged to other comprehensive income 826 – 1,719
Exchange differences – 926 – 977
Acquisition of subsidiaries 434 4,124
Deferred tax liabilities (net) – at 31 December 25,455 26,879
1) Restated due to effects from the application of IAS 19R. See: Section 2 Basis of preparation and Section 7 Change in accounting principles.
The analysis of deferred income tax assets and deferred income tax liabilities, without taking into consideration the offsetting of balances within the same tax jurisdiction, is as follows:
DEFERRED TAX ASSETS
in EUR thousands
31 Dec 2013 31 Dec 20121)
Intangible assets 1,596 2,152
Property, plant and equipment 79 249
Other assets 184 202
Inventories 1,173 901
Trade receivables 280 470
Retirement benefit obligations / pension liabilities 1,387 1,081
Provisions 1,088 671
Borrowings 3,227 796
Other liabilities, incl. derivatives 4,442 9,222
Trade payables 392 68
Tax losses and tax credits 441 772
Deferred tax assets (before valuation allowances) 14,289 16,584
Valuation allowance – 19 – 13
Deferred tax assets (before offsetting) 14,270 16,571
Offsetting effects – 6,755 – 10,510
Deferred tax assets 7,515 6,061
1) Restated due to effects from the application of IAS 19R. See: Section 2 Basis of preparation and Section 7 Change in accounting principles.

147Consolidated Financial Statements
Notes to the Consolidated Financial Statements
DEFERRED TAX LIABILITIES
in EUR thousands
31 Dec 2013 31 Dec 2012
Intangible assets 26,591 27,843
Property, plant and equipment 8,759 9,100
Other assets 399 1,201
Inventories 384 156
Trade receivables 459 96
Borrowings 2,084 4,219
Provisions 0 14
Other liabilities, incl. derivatives 169 137
Trade payables 6 9
Untaxed reserves 874 675
Deferred tax liabilities (before offsetting) 39,725 43,450
Offsetting effects – 6,755 – 10,510
Deferred tax liabilities 32,970 32,940
Deferred tax liabilities (net) 25,455 26,879
Deferred income tax assets are recognised for all deductible temporary differences to the extent that it is probable that future taxable profits will be available against which the deductible tem-porary difference can be utilised. The Group did not recognise deferred income tax assets amounting to EUR 38 thousand in respect of deductible temporary differences amounting to EUR 116 thousand at 31 December 2012. As at 31 December 2013, deferred tax assets for all deductable temporary differences could be recognised.
In 2013 and prior years, the Group had tax losses at several subsidiaries in several countries. After offsetting the deferred tax assets with deferred tax liabilities, the deferred tax assets not subject to valuation allowances amounted to EUR 34 thousand for those foreign subsidiaries (31 December 2012: EUR 167 thou-sand). NORMA Group believes it is more likely than not that due to future taxable income, deferred tax assets which are not sub-ject to valuation allowances can be utilised.
Deferred income tax assets are recognised for tax losses carry- forwards to the extent that the realisation of the related tax benefit through future taxable profits is probable.
The Group did recognise the following tax losses:
in EUR thousands
31 Dec 2013 31 Dec 2012
Expiry within 1 year 0 0
Expiry in 2–5 years 31 894
Expiry later than 5 years 2,628 3,465
Unlimited carry forward 475 687
Total 3,134 5,046
The Group did not recognise deferred income tax assets in respect of losses amounting to EUR 5,579 thousand at 31 De-cember 2013 (31 December 2012: EUR 7,328 thousand) that can be carried forward against future taxable income. Theoretically, the deferred tax assets on not recognised tax losses would be EUR 1,058 thousand at 31 December 2013 (31 December 2012: EUR 1,814 thousand).
The unrecognised losses expire as follows:
in EUR thousands
31 Dec 2013 31 Dec 2012
Expiry within 1 year 29 285
Expiry in 2–5 years 0 1,643
Expiry later than 5 years 2,256 806
Unlimited carry forward 3,294 4,594
Total 5,579 7,328
Taxable temporary differences amounting to EUR 113,059 thou-sand at 31 December 2013 (31 December 2012: EUR 69,451 thousand) associated with investments in subsidiaries are not recognised as deferred tax liabilities, since the respective parent is able to control the timing of the reversal of the temporary differ-ence and it is probable that the temporary difference will not reverse in the foreseeable future. These unremitted earnings of non-German subsidiaries, the amount of which cannot be practi-cably computed, could become subject to additional tax if they were remitted as dividends or if the Group were to sell its share-holdings in the subsidiaries.

NORMA Group SE Annual Report 2013148
20. GOODWILL AND OTHER INTANGIBLE ASSETS The acquisition costs as well as accumulated amortisation and impairment of intangible assets consist of the following:
in EUR thousandsAt
1 Jan 2013 Additions Deductions TransfersChanges in
consolidationCurrency
effects
At
31 Dec 2013
Acquisition costs
Goodwill 266,296 0 0 0 1,683 – 4,670 263,309
Certificates (Customer lists) 57,402 2 0 0 5,881 – 2,367 60,918
Licenses, rights 2,178 111 – 2 4 211 – 4 2,498
Trademarks 20,903 0 0 0 75 – 840 20,138
Patents & technology 29,952 996 0 0 1,120 – 1,277 30,791
Internally generated intangible assets 2,014 3,060 – 27 114 0 – 34 5,127
Intangible assets, other 25,346 5,092 – 146 – 118 0 – 505 29,669
Total 404,091 9,261 – 175 0 8,970 – 9,697 412,450
Amortisation and Impairment
Goodwill 31,034 0 0 0 0 – 964 30,070
Certificates (Customer lists) 11,501 4,192 0 0 0 – 451 15,242
Licenses, rights 777 378 – 2 0 0 – 2 1,151
Trademarks 4,290 1,080 0 0 0 – 220 5,150
Patents & technology 14,780 2,374 0 0 0 – 667 16,487
Internally generated intangible assets 293 683 0 0 0 – 11 965
Intangible assets, other 13,676 3,897 – 146 0 0 – 191 17,236
Total 76,351 12,604 – 148 0 0 – 2,506 86,301
in EUR thousandsAt
1 Jan 2012 Additions Deductions TransfersChanges in
consolidationCurrency
effects
At
31 Dec 2012
Acquisition costs
Goodwill 256,287 0 0 0 11,905 – 1,896 266,296
Certificates (Customer lists) 44,049 120 0 0 13,966 – 733 57,402
Licenses, rights 849 334 – 5 121 882 – 3 2,178
Trademarks 20,189 0 0 0 1,086 – 372 20,903
Patents & technology 29,444 654 0 – 1 354 – 499 29,952
Internally generated intangible assets 208 1,817 0 0 0 – 11 2,014
Intangible assets, other 19,234 4,889 – 6 – 120 1,146 203 25,346
Total 370,260 7,814 – 11 0 29,339 – 3,311 404,091
Amortisation and Impairment
Goodwill 31,446 0 0 0 0 – 412 31,034
Certificates (Customer lists) 8,472 3,162 0 0 0 – 133 11,501
Licenses, rights 655 128 – 5 0 0 – 1 777
Trademarks 3,360 1,015 0 0 0 – 85 4,290
Patents & technology 12,678 2,369 0 0 0 – 267 14,780
Internally generated intangible assets 172 124 0 0 0 – 3 293
Intangible assets, other 9,696 3,951 – 5 0 0 34 13,676
Total 66,479 10,749 – 10 0 0 – 867 76,351

149Consolidated Financial Statements
Notes to the Consolidated Financial Statements
Carrying amounts
in EUR thousands
31 Dec 2013 31 Dec 2012
Goodwill 233,239 235,262
Certificates (Customer lists) 45,676 45,901
Licenses, rights 1,347 1,401
Trademarks 14,988 16,613
Patents & technology 14,304 15,172
Internally generated intangible assets 4,162 1,721
Intangible assets, other 12,433 11,670
Total 326,149 327,740
The item ‘Patents & technology’ at 31 December 2013 consists of patents worth EUR 4,180 thousand (31 December 2012: EUR 3,794 thousand) and technology worth EUR 10,124 thousand (31 December 2012: EUR 11,378 thousand).
The item ‘Intangible assets, other’ consists mainly of software and prepayments. Software is amortised over the useful life of three to five years.
Internally generate intangible assets mainly include technologies.
The change in goodwill from EUR 235,262 thousand to EUR 233,239 thousand results from negative exchange differences and from the acquisition of the distribution business of Variant S.A., in the amount of EUR 252 thousand, the acquisition of the distribution business of Davydick & Co. Pty. Limited in the first half year of 2013, which increased the goodwill by EUR 451 thou-sand as well as the acquisition of Guyco Pty Limited in the amount of EUR 980 thousand in the third quarter of 2013.
The change in goodwill is summarised as follows:
in EUR thousands
Balance at 31 December 2012 235,262
Changes in consolidation 1,683
Variant S.A. 252
Davydick & Co. Pty. Limited 451
Guyco Pty Limited 980
Currency effect – 3,706
Balance at 31 December 2013 233,239
In 2013 and 2012, no material impairment for intangible assets or write ups were recognised. Besides the goodwill, there are no intangible assets with an indeterminable useful life.
At 31 December 2013 and 2012, the intangible assets are un-secured.
Impairment tests for goodwillGoodwill is allocated to the Group’s cash-generating units (CGUs) identified according to geographical areas. A summary of the goodwill allocation is presented below.
in EUR thousands
31 Dec 2013 31 Dec 2012
CGU EMEA 154,141 153,993
CGU Americas 73,598 76,904
CGU Asia-Pacific 5,500 4,365
233,239 235,262
Goodwill for the cash-generating unit EMEA increased in 2013 due to the acquisition of the distribution business of Variant S.A. amounting to EUR 252 thousand, partly offset by currency effects. Goodwill for the CGU Americas changed in 2013 solely due to currency effects. Goodwill for the CGU Asia-Pacific was increased by the acquisition of Guyco Pty Limited and the acquisition of the distribution business of Davydick & Co. Pty. Limited amounting to EUR 1,431 thousand. Other changes were driven by currency effects.
The recoverable amount of a CGU is determined based on fair-value-less-costs-to-sell, which is calculated by discounting pro-jected cash flows. Based on the inputs used for this valuation technique, fair values are classified as level 3 fair values (Note 3.3 “Fair value estimation”). These calculations use cash flow projec-tions based on financial budgets approved by the management covering a five-year period. Cash flows beyond the five-year period are extrapolated using the estimated growth rates stated below. The growth rate does not exceed our expectations for the long-term average growth rate for the geographical area of the respective CGU.
The discount rates used are after-tax-rates and reflect the specific risk of each CGU. The respective before-tax-rates are 13.36 % (2012: 13.45 %) for the CGU EMEA, 14.74 % (2012: 15.07 %) for the CGU Americas and 13.16 % (2012: 13.54 %) for the CGU Asia-Pacific.
The key assumptions used for fair-value-less-costs-to-sell calcu-lations are as follows:
31 December 2013
CGU EMEA
CGU Americas
CGU Asia-Pacific
Terminal value growth rate 1.50 % 1.50 % 1.50 %
Discount rate 10.31 % 9.62 % 10.50 %
Costs to sell 1.00 % 1.00 % 1.00 %
31 December 2012
CGU
EMEACGU
AmericasCGU
Asia-Pacific
Terminal value growth rate 1.50 % 1.50 % 1.50 %
Discount rate 10.20 % 9.60 % 10.74 %
Costs to sell 1.00 % 1.00 % 1.00 %
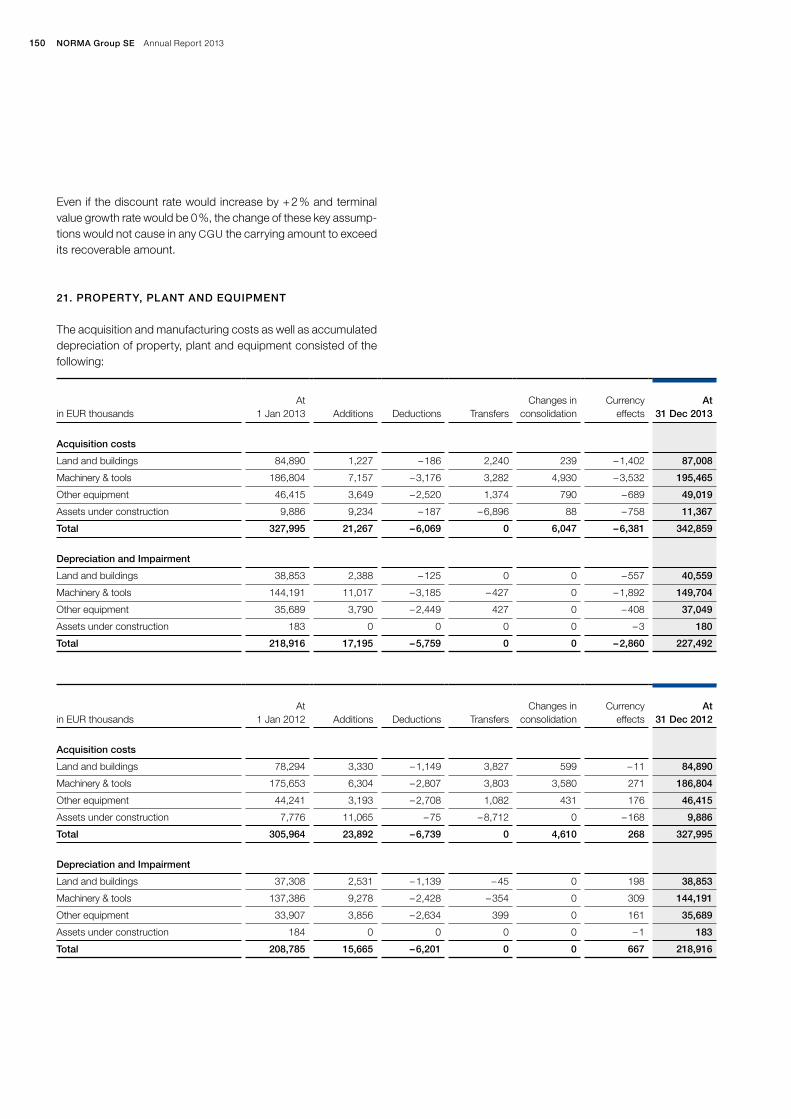
NORMA Group SE Annual Report 2013150
Even if the discount rate would increase by + 2 % and terminal value growth rate would be 0 %, the change of these key assump-tions would not cause in any CGU the carrying amount to exceed its recoverable amount.
21. PROPERTY, PLANT AND EQUIPMENT
The acquisition and manufacturing costs as well as accumulated depreciation of property, plant and equipment consisted of the following:
in EUR thousandsAt
1 Jan 2013 Additions Deductions Transfers
Changes in
consolidationCurrency
effects
At
31 Dec 2013
Acquisition costs
Land and buildings 84,890 1,227 – 186 2,240 239 – 1,402 87,008
Machinery & tools 186,804 7,157 – 3,176 3,282 4,930 – 3,532 195,465
Other equipment 46,415 3,649 – 2,520 1,374 790 – 689 49,019
Assets under construction 9,886 9,234 – 187 – 6,896 88 – 758 11,367
Total 327,995 21,267 – 6,069 0 6,047 – 6,381 342,859
Depreciation and Impairment
Land and buildings 38,853 2,388 – 125 0 0 – 557 40,559
Machinery & tools 144,191 11,017 – 3,185 – 427 0 – 1,892 149,704
Other equipment 35,689 3,790 – 2,449 427 0 – 408 37,049
Assets under construction 183 0 0 0 0 – 3 180
Total 218,916 17,195 – 5,759 0 0 – 2,860 227,492
in EUR thousandsAt
1 Jan 2012 Additions Deductions Transfers
Changes in
consolidationCurrency
effects
At
31 Dec 2012
Acquisition costs
Land and buildings 78,294 3,330 – 1,149 3,827 599 – 11 84,890
Machinery & tools 175,653 6,304 – 2,807 3,803 3,580 271 186,804
Other equipment 44,241 3,193 – 2,708 1,082 431 176 46,415
Assets under construction 7,776 11,065 – 75 – 8,712 0 – 168 9,886
Total 305,964 23,892 – 6,739 0 4,610 268 327,995
Depreciation and Impairment
Land and buildings 37,308 2,531 – 1,139 – 45 0 198 38,853
Machinery & tools 137,386 9,278 – 2,428 – 354 0 309 144,191
Other equipment 33,907 3,856 – 2,634 399 0 161 35,689
Assets under construction 184 0 0 0 0 – 1 183
Total 208,785 15,665 – 6,201 0 0 667 218,916

151Consolidated Financial Statements
Notes to the Consolidated Financial Statements
Carrying amounts
in EUR thousands
31 Dec 2013 31 Dec 2012
Land and buildings 46,449 46,037
Machinery and tools 45,761 42,613
Other equipment 11,970 10,726
Assets under construction 11,187 9,703
Total 115,367 109,079
At 31 December 2013, the item ‘Machinery and tools’ includes tools of EUR 7,952 thousand (31 December 2012: EUR 4,205 thousand).
No material impairment and no material write ups were recog-nised on property, plant and equipment in 2013 and 2012.
At 31 December 2013 and 2012, property, plant and equipment are unsecured.
Land and buildings includes the following amounts where the Group is a lessee under a finance lease:
in EUR thousands
31 Dec 2013 31 Dec 2012
Cost – capitalised finance leases 523 0
Accumulated depreciation 0 0
Net carrying amount 523 0
In financial year 2013, a contract for the use of land in China was signed for a period of 50 years by NORMA Group. Since the present value of the minimum lease payments is equal to fair value of the leased item, it was classified as a finance lease.
Machinery includes the following amounts where the Group is a lessee under a finance lease:
in EUR thousands
31 Dec 2013 31 Dec 2012
Cost – capitalised finance leases 661 472
Accumulated depreciation – 431 – 388
Net carrying amount 230 84
Other equipment includes the following amounts where the Group is a lessee under a finance lease:
in EUR thousands
31 Dec 2013 31 Dec 2012
Cost – capitalised finance leases 367 367
Accumulated depreciation – 248 – 170
Net carrying amount 119 197
The Group leases various property, machinery, technical and IT equipment under non-cancellable finance lease agreements. The lease terms for machinery and other equipment are between three and ten years, the lease terms for land and building are up to 50 years.

NORMA Group SE Annual Report 2013152
22. FINANCIAL INSTRUMENTS
Financial instruments according to classes and categories were as follows:
Measurement basis IAS 39
in EUR thousandsCategory
IAS 39
Carrying amount
31 Dec 2013Amortised
Cost
Fair value through
profit or loss
Derivatives used for hedging
Measurement basis IAS 17
Fair value31 Dec 2013
Financial assets
Derivative financial instruments – hedge accounting
Foreign exchange derivatives n /a 92 92 92
Trade and other receivables LaR 90,138 90,138 90,138
Cash and cash equivalents LaR 194,188 194,188 194,188
Financial liabilities
Borrowings FLAC 326,108 326,108 329,273
Derivative financial instruments – hedge accounting
Interest derivatives n /a 5,375 5,375 5,375
Cross-currency swaps n /a 9,845 9,845 9,845
Foreign exchange derivatives n /a 50 50 50
Trade payables FLAC 59,025 59,025 59,025
Other financial liabilities
Contingent considerations n /a 1,371 1,371 1,371
Other liabilities FLAC 4,241 4,241 4,241
Finance lease liabilities n /a 683 683 705
Totals per category
Loans and receivables (LaR) 284,326 284,326 284,326
Financial liabilities at amortised cost (FLAC) 389,374 389,374 392,539

153Consolidated Financial Statements
Notes to the Consolidated Financial Statements
Measurement basis IAS 39
in EUR thousandsCategory
IAS 39
Carrying amount
31 Dec 2012Amortised
Cost
Fair value through
profit or loss
Derivatives used for hedging
Measurement basis IAS 17
Fair value31 Dec 2012
Financial assets
Derivative financial instruments – hedge accounting
Foreign exchange derivatives n /a 103 103 103
Trade and other receivables LaR 79,293 79,293 79,293
Cash and cash equivalents LaR 72,389 72,389 72,389
Financial liabilities
Borrowings FLAC 241,696 241,696 241,696
Derivative financial instruments – held for trading
Foreign exchange derivatives FLHfT 114 114 114
Derivative financial instruments – hedge accounting
Interest derivatives n /a 5,807 5,807 5,807
Cross-currency swaps n /a 18,868 18,868 18,868
Trade payables FLAC 37,663 37,663 37,663
Other financial liabilities FLAC 3,951 3,951 3,951
Finance lease liabilities n /a 940 940 996
Totals per category
Loans and receivables (LaR) 151,682 151,682 151,682
Financial liabilities held for trading (FLHfT) 114 114 114
Financial liabilities at amortised cost (FLAC) 283,310 283,310 283,310
Financial instruments, that are recognised in the balance sheet at amortised cost and for which the fair value is stated in the notes, are also allocated within a three step fair value hierarchy.
The fair value calculation of the fixed-interest promissory note that is recognised at amortised cost and for which the fair value is stated in the notes, was based on the market yield curve accord ing to the zero coupon method considering credit spreads (level 2). Interests accrued on the reporting date are included.
Trade and other receivables and cash and cash equivalents have short-term maturities. Their carrying amounts at the reporting date equal their fair values, as the impact of discounting is not significant.
Trade payables and other financial liabilities have short times to maturity; therefore the carrying amounts reported approximate the fair values. At 31 December 2013, liabilities in the amount of EUR 3,500 thousand resulting from the acquisitions in 2013 and 2012, are included in the position other financial liabilities. Further-more, this position includes a contingent consideration measured at fair value amounting to EUR 1,371 thousand from the acqui-sition of Guyco Pty Limited (EUR 1,274 thousand) and Davydick & Co. Pty Limited (EUR 97 thousand). For details, please refer to Note 40 ‘Business combinations’.
The fair values of finance lease liabilities are calculated as the present values of the payments associated with the debts based on the applicable yield curve and NORMA Group’s credit spread curve.

NORMA Group SE Annual Report 2013154
Derivative financial instruments held for trading and those used for hedging are carried at their respective fair values. They have been categorised entirely within level 2 in the fair value hierarchy.
None of the financial assets that are fully performing have been renegotiated in the last year.
The tables below provide an overview of the classification of finan cial assets and liabilities measured at fair value in the fair value hierarchy under IFRS 13 as at 31 December 2013 as well as at 31 December 2012:
in EUR thousands Level 11) Level 2 2) Level 3 3)
Total at
31 Dec 2013
Recurring fair value measurements
Assets
Foreign exchange derivatives – hedge accounting 92 92
Total 0 92 0 92
Liabilities
Cross-currency swaps – hedge accounting 9,845 9,845
Interest swap – hedge accounting 5,375 5,375
Foreign exchange derivatives – hedge accounting 50 50
Other financial liabilities 1,371 1,371
Total 0 15,270 1,371 16,641
1) Fair value measurement based on quoted prices (unadjusted) in active markets for these or identical assets or liabilities. 2) Fair value measurement for the asset or liability based on inputs that are observable on active markets either directly (i. e. as priced) or indirectly (i. e. derived from prices). 3) Fair value measurement for the asset or liability based on inputs that are not observable market data.
in EUR thousands Level 11) Level 2 2) Level 3 3)
Total at
31 Dec 2012
Recurring fair value measurements
Assets
Foreign exchange derivatives – hedge accounting 103 103
Total 0 103 0 103
Liabilities
Cross-currency swaps – hedge accounting 18,868 18,868
Interest swap – hedge accounting 5,807 5,807
Foreign exchange derivatives – held for trading 114 114
Total 0 24,789 0 24,789
1) Fair value measurement based on quoted prices (unadjusted) in active markets for these or identical assets or liabilities. 2) Fair value measurement for the asset or liability based on inputs that are observable on active markets either directly (i. e. as priced) or indirectly (i. e. derived from prices). 3) Fair value measurement for the asset or liability based on inputs that are not observable market data.

155Consolidated Financial Statements
Notes to the Consolidated Financial Statements
In 2013, no transfers between the different levels occurred.
The fair value of interest swaps and cross-currency swaps is calculated as the present value of estimated future cash flows. The fair value of forward foreign exchange contracts is determined using a present value model based on forward exchange rates.
Level 3 includes fair values of financial liabilities from contingent consideration resulting from the acquisition of Guyco Pty Limited and the acquisition of Davydick & Co. Pty Limited. The agreement on the contingent consideration related to the acquisition of Guyco Pty Limited is committed NORMA Group to pay an amount depending on the gross profits made by the Guyco Pty Limited in the period from 1 July 2013 to 30 June 2014. The fair value of the contingent consideration was determined at the acquisition date with taking into account the budget of the Company and set to the maximum value of EUR 1,274 thousand. The key para-meters, for which no observable market data are available are shown below:
Assumed, gross profit: > TAUD 5,500Discount rate: 4 %
A decrease in the estimated gross profit to a value below AUD 5,500 thousand but above AUD 4,500 thousand would lead in a lower value of the contingent consideration. A decrease in the estimated gross profit to a value below AUD 4,500 thousand would lead in a value of EUR 0 thousand. Furthermore, a signifi-cant increase (decrease) in the discount rate would lead in a lower (higher) value of the contingent consideration.
The agreement on the contingent consideration related to the acquisition of Davydick & Co. Pty Limited committed NORMA Group to pay an amount depending on the revenues made by the Davydick & Co. Pty Limited in the period from 1 January 2013 to 31 December 2013. The fair value of the contingent consider-ation was determined at the acquisition date with taking into ac-count the budget of the Company and set to the maximum value of EUR 285 thousand. On 31 December 2013, an adjustment of the fair value was made to reflect the achieved revenues, the difference of EUR 188 thousand in the fair values was recog nised as income in profit or loss in the period. The key parameters, for which no observable market data are available, are shown below:
Used revenue of Davydick & Co. Pty Limited as at 31 December 2013: AUD 4,909 thousand
The development of the financial assets that are recognised at fair value and assigned in level 3 of the fair value hierarchy is stated below:
in EUR thousands
Contingent
consideration in business
combinations Total
At 1 January 0 0
Acquisition of Guyco Pty Limited 1,249 1,249
Acquisition of Davydick & Co. Pty Limited 285 285
Gains and losses recognised in profit or loss 163 163
At 31 December 1,371 1,371
Total gains or losses for the period included in profit or loss for financial liabilities held at the end of the reporting period, under ‘Financial result’ 163 163
In accordance with IFRS 7.20 (a) net gains and losses from finan-cial instruments by measurement category are as follows:
in EUR thousands
2013 2012
Available-for-sale financial assets (AfS) 0 50
Loans and receivables (LaR) – 33 255
Financial instruments held for trading (FAHfT and FLHfT) 0 – 152
Financial liabilities at cost (FLAC) – 14,563 – 12,742
– 14,596 – 12,589
In 2012, net gains and losses of available-for-sale financial assets included dividend income from associates not accounted for using the equity method. At 31 December 2012, NORMA Group acquired an additional 60 % of the shares of Groen Bevestigings-materialen B.V. The previously held shares of 30 % were de-recognised and Groen Bevestigingsmaterialen B.V. is now fully consolidated. The gain in 2012 resulted from the periods before the acquisition.
Net gains and losses of loans and receivables comprise cur rency effects, impairment of trade receivables, and interest income on short-term bank deposits. Fair value gains and losses on trading derivatives are net gains and losses of financial instruments held for trading and net gains and losses of financial liabilities at cost comprise interest expenses and currency effects on loans, bor-rowings and bank deposits.

NORMA Group SE Annual Report 2013156
23. DERIVATIVE FINANCIAL INSTRUMENTS
The derivative financial instruments were as follows:
31 December 2013
31 December 2012
in EUR thousands Assets Liabilities Assets Liabilities
Cross-currency swaps – cash flow hedges 9,845 18,868
Interest rate swaps – cash flow hedges 5,375 5,807
Foreign exchange derivatives – cash flow hedges 92 50 103
Foreign exchange derivatives – held for trading 114
Total 92 15,270 103 24,789
Less non-current portion
Cross-currency swaps – cash flow hedges 8,293 18,868
Interest rate swaps – cash flow hedges 5,807
Non-current portion 0 8,293 0 24,675
Current portion 92 6,977 103 114
Foreign exchange derivativesAt 31 December 2013, foreign exchange derivatives with a posi-tive market value of EUR 92 thousand and with a negative market value of EUR 50 thousand were classified as cash flow hedges. The notional principal amount was EUR 3,100 thousand and EUR 1,126 thousand.
Interest rate swaps and cross-currency swapsIn order to avoid interest rate fluctuations, NORMA Group has hedged parts of the loans against changes in the interest rates as well as changes in the exchange rates. The remaining part of NORMA Group’s financing was hedged against interest rate changes.
The ineffective portion recognised in profit or loss amounts to a loss of EUR 140 thousand in 2013 (2012: profit of EUR 102 thou-sand).
The effective part recognised in other comprehensive income reduced the equity in 2013 by EUR 1,527 thousand before taxes (2012: reduction of EUR 9,409 thousand). Of this amount, EUR 4,404 thousand are due to the measurement of the derivatives held as cash flow hedges and EUR – 5,931 thousand are due to the change in value of the underlying. In the period, an addition-al EUR 4,841 thousand before tax were reclassified from the hedging reserve to the profit and loss and thus increased other comprehensive income (2012: increase of EUR 5,031 thousand).
Amounts recognised in the hedging reserve in equity at 31 De-cember 2013 will be released in profit or loss until the repayment of the loans.
The notional principal amounts of the outstanding cross-cur-rency-swap contracts at 31 December 2013 were EUR 117 million (31 December 2012: EUR 132 million). Interest rate derivatives had a notional principal amount of EUR 199 million (31 December 2012: EUR 160 million).
At 31 December 2013 and 2012, the hedged fixed interest rate was between 0.981 % and 4.04 %; the variable interest rate was the 3-months-EURIBOR.
The maximum exposure to credit risk at the reporting date is the fair value of the derivative assets in the consolidated statement of financial position.
24. TRADE AND OTHER RECEIVABLES
The trade receivables were as follows:
in EUR thousands
31 Dec 2013 31 Dec 2012
Trade receivables 91,092 81,110
Less: allowances for doubtful accounts – 1,638 – 2,350
89,454 78,760
All trade receivables are due within one year. The following table shows the maturity analysis for trade receivables and other cur-rent receivables that are not impaired:

157Consolidated Financial Statements
Notes to the Consolidated Financial Statements
AT 31 DECEMBER 2013
in EUR thousands Not past due < 30 days30 to
90 days91 to
180 days181 days to 1 year > 1 year
Total
Trade receivables 64,563 17,439 5,528 1,133 483 201 89,347
Other receivables 681 2 0 0 0 0 683
65,244 17,441 5,528 1,133 483 201 90,030
AT 31 DECEMBER 2012
in EUR thousands Not past due < 30 days30 to
90 days91 to
180 days181 days to 1 year > 1 year
Total
Trade receivables 61,121 13,676 2,798 592 287 170 78,644
Other receivables 487 0 46 0 0 0 533
61,608 13,676 2,844 592 287 170 79,177
At 31 December 2013 and 2012, there was no indication that trade receivables that were neither past due nor impaired could be irrecoverable.
The amount of receivables that were impaired and provided for was as follows:
in EUR thousands
31 Dec 2013 31 Dec 2012
Trade receivables impaired and provided for 1,746 2,466
Allowances for doubtful accounts – 1,638 – 2,350
The carrying amounts of the Group’s trade and other receivables are denominated in the following currencies:
in EUR thousands
31 Dec 2013 31 Dec 2012
Euro 44,547 40,211
US dollar 28,782 24,717
Chinese renminbi 4,428 3,237
British pound 2,515 2,155
Australian dollar 2,704 1,434
Swedish krona 1,232 1,228
Swiss franc 1,220 1,136
Indien rupee 685 982
Malaysian ringgit 900 1,137
Thai baht 457 700
Russian ruble 731 1,014
Other currencies 1,937 1,342
90,138 79,293
All trade receivables were impaired by specific valuation allow-ances. There have been no general allowances. Movements on the Group provision for impairment of trade receivables are as follows:
in EUR thousands
2013 2012
At 1 January 2,350 2,247
Additions 273 913
Amounts used – 716 – 671
Reversals – 221 – 454
Allowances acquired in a business combination 0 327
Currency effects – 48 – 12
At 31 December 1,638 2,350
The creation and release of allowances for doubtful accounts have been included in ‘other operating income / expenses’ in the consolidated statement of comprehensive income. Amounts charged to the allowance account are generally written off, when there is no expectation of recovering additional cash.
The other classes within trade and other receivables do not con-tain impaired assets.
The maximum exposure to credit risk at the reporting date is the carrying amount of each class of receivables mentioned above. The Group does not hold any collateral as security.
At 31 December 2013 and 2012, the trade and other receivables are unsecured.
Receivables of EUR 1,339 thousand (2012: EUR 1,296 thousand) were sold in a factoring contract.

NORMA Group SE Annual Report 2013158
25. INVENTORIES
The inventories were as follows:
in EUR thousands
31 Dec 2013 31 Dec 2012
Raw materials 25,134 25,018
Work in progress 7,271 7,123
Finished goods and goods for resale 47,365 42,172
79,770 74,313
At 31 December 2013, impairments on inventories amounting to EUR 2,919 thousand (31 December 2012: EUR 2,044 thousand) were made.
At 31 December 2013 and 2012, the inventories are unsecured.
26. OTHER NON-FINANCIAL ASSETS
Other non-financial assets were as follows:
in EUR thousands
31 Dec 2013 31 Dec 2012
Deferred costs 1,019 1,208
VAT assets 2,751 3,543
Receivables against factor 767 352
Prepayments 1,061 1,094
Reimbursement insurance contracts 1,141 0
Other assets 1,375 1,590
8,114 7,787
27. EQUITY
Subscribed capitalThe subscribed capital of the Company at 31 December 2013 and 2012 amounted to EUR 31,862 thousand and was fully paid in. It is divided into 31,862,400 shares with no par value and a notional value of EUR 1. The liability of the shareholders for the obligations of the Company to its creditors is limited to this capi-tal. The amount of the subscribed capital is not permitted to be distributed by the Company to its shareholders.
With the change of the legal form of NORMA Group to a public Company on 14 March 2011, EUR 24,786 thousand, including acquired treasury shares, were reclassified from the capital re-serves to subscribed capital.
In the course of the IPO on 8 April 2011 a capital increase of seven million shares was placed, leading to an increase in the subscribed capital of EUR 7,000 thousand.
Authorised and conditional capitalThe Management Board was authorised by the extraordinary shareholders’ meeting on 6 April 2011 for the period ending on 5 April 2016, to increase the Company’s registered share capital in one or more transactions by up to EUR 15,931,200 in aggregate by issuing up to 15,931,200 new no par value registered shares against cash contributions or contributions in kind (authorised capital).
With the resolution of the extraordinary shareholders’ meeting on 6 April 2011, the Company’s share capital has been conditionally increased by up to EUR 12,505,000 through the issuance of up to 12,505,000 new no par value registered shares (conditional capi-tal). The conditional capital increase serves to issue shares to the holders or creditors of convertible or warrant-linked bonds as well as profit participation rights based on the authorisation approved by the extraordinary shareholders’ meeting of 6 April 2011.
Capital reserveThe capital reserve contains:
amounts (premiums) received for the issuance of shares,
premiums paid by shareholders in exchange for the granting of a preference for their shares,
amounts resulted from other capital contributions of the owners.
NORMA Group SE began trading on the Prime Standard of the Frankfurt Stock Exchange on 8 April 2011. The issue price for NORMA Group’s shares was EUR 21.00. In the course of the IPO a capital increase of seven million shares with a value of EUR 147,000 thousand was placed, leading to an increase in the sub-scribed capital of EUR 7,000 thousand and an increase of the capital reserve of EUR 140,000 thousand.
Costs for the Operational Performance Incentive Cash Pro-gramme (OPICP) of EUR 2,762 thousand were reimbursed in accordance with the agreement by the previous shareholders. In 2013, EUR 1,067 thousand (2012: EUR 1,307 thousand) was paid and recognised in the capital reserve.
Retained earningsThe retained earnings consisted of the following:

159Consolidated Financial Statements
Notes to the Consolidated Financial Statements
in EUR thousandsRetained earnings
Remeasure-ments of
post employ-ment benefit
obligationsStock
options
IPO costs directly
netted with equity
Reimburse-ment IPO-
costs by shareholder
Acquisition of non-
controlling interest
Effects from the
application of IAS 19R
Total
Balance at 31 December 2011 15,662 165 184 – 4,640 4,681 – 1,940 0 14,112
Profit for the year 56,573 43 56,616
Dividends paid – 19,125 – 19,125
Stock options 418 418
Acquisition of non-controlling interests – 489 – 489
Effect before taxes – 1,465 1,120 – 345
Tax effect 426 – 324 102
Balance at 31 December 2012 1) 53,110 – 874 602 – 4,640 4,681 – 2,429 839 51,289
Balance at 31 December 2012 (as reported) 53,110 – 874 602 – 4,640 4,681 – 2,429 0 50,450
Profit for the year 55,557 55,557
Dividends paid – 20,711 – 20,711
Stock options – 602 – 602
Effect before taxes – 726 1,181 455
Tax effect 159 – 342 – 183
Balance at 31 December 2013 87,956 – 1,441 0 – 4,640 4,681 – 2,429 839 84,966
1) Restated due to effects from the application of IAS 19R. See: Section 2 Basis of preparation and Section 7 Change in accounting principles.
A dividend of EUR 20,711 thousand (EUR 0,65 per share) was paid to the shareholders of NORMA Group after the Annual Gen-eral Meeting in May 2013, which reduced the retained earnings.
Other reservesThe other reserves consisted of the following:
in EUR thousands Cashflow hedges
Exchange differences on translating foreign
operations
Total
Balance at 1 January 2012 – 3,614 946 – 2,668
Currency translation – 2,797 – 2,797
Effect before taxes – 4,378 – 4,378
Tax effect 1,293 1,293
Balance at 31 December 2012 – 6,699 – 1,851 – 8,550
Currency translation – 7,636 – 7,636
Effect before taxes 3,314 3,314
Tax effect – 985 – 985
Balance at 31 December 2013 – 4,370 – 9,487 – 13,857

NORMA Group SE Annual Report 2013160
28. SHARE BASED PAYMENTS
Management incentive schemesThe matching stock programme (MSP) for the Management Board provides a long-term incentive to commit to the success of the Group. The MSP is a share-based option.
To this end, the Supervisory Board specifies a number of share options to be granted each financial year with the proviso that the Management Board member makes a corresponding per-sonal investment in the Group.
The shares involved in the share options are those shares allo-cated or acquired and qualified as part of the MSP defined in the Management Board contract. The number of share options is calculated by multiplying the qualified shares (2013: 108,452) held at the time of allotment by the option factor specified by the Supervisory Board. A new option factor is set for every tranche (the option factor for 2013 is 1.5). The MSP is split into five tran-ches. The first tranche was allocated on the day of the IPO. The other tranches will be allocated on 31 March each following year. There are therefore 162,679 share options in the 2013 finan cial year.
The holding period is four years (on 31 March 2017 for the 2013 tranche, on 31 March 2016 for the 2012 tranche and on 31 March 2015 for the 2011 tranche). The exercise price for the 2011 tranche is the issue price at the time of the Group’s IPO. The exercise price for the other tranches will be the weighted average of the closing price of the Group’s share on the 60 trading days directly preceding the allocation of each tranche. Dividend payments by the Group during the vesting period are deducted from the ex-ercise price of each tranche. The value of the share option is calculated using a generally accepted valuation methodologies. The Group used the volatility of the NORMA Group SE share of the last six months to determine the volatility of 2013.
The Group used the following parameters for its evaluation:
Expected duration until exercised in years 4.00
Risk-free interest rate in % 0.75
Expected volatility in % 35.00
Expected dividend payment in in % 0.00
Share price when granted in EUR 24.59
Share price on 31 December 2013 reporting date 36.09
Each tranche is recalculated, taking changes in influencing factors into account, and prorated over the vested period.
The options of a tranche can only be exercised within a period of two years following the expiry of the holding period. In order for an option to be exercised, the exercise price must be at least 1.2 times the issue price (basis: weighted average of the last ten trading days). When the option is exercised, the Group can decide at its own discretion whether to settle the option in shares or cash. The 2011, 2012 and 2013 tranche will likely be settled in equity instruments (no cash settlement).
The fair value was determined when the options were granted. Because the tranches will be settled in equity instruments the fair value of the option rights will not be adjusted during the holding period (vesting period). The fair value of the option rights for 2013 was EUR 7.33 per option right when the option rights were grant-ed (2012: EUR 5.67). The fair value of the 162,679 option rights granted with the 2013 tranche came to EUR 1,191,674.
The resulting personnel expenses will be recorded over the course of the vesting period. They came to EUR 698,531 for the 2013 financial year (2012: EUR 417,476), assuming no staff turn-over. This amount was allocated to capital reserve.
The option rights granted under the matching stock programme (MSP) changed as follows in the 2013 financial year:
Number of option rights outstanding
Exercise price per right (in EUR)
Waiting period
(service period) in years
Balance at 31 December 2012 325,358 19.44 1.75
Granted 162,679 23.71 3.25
Exercised - - -
Lapsed /expired - - -
Balance at 31 December 2013 488,037 20.86 2.25
The aggregated intrinsic value, based on the closing share price on 31 December 2013, was EUR 7,429 thousand.
The exercise prices of the option rights granted under the MSP are between EUR 17.87 and EUR 23.71 per right.

161Consolidated Financial Statements
Notes to the Consolidated Financial Statements
In the financial year 2013, NORMA Group has installed a share-based, long-term, variable compensation component for execu-tives and certain other groups of employees (Long-Term Incentive Plan). The Long-Term Incentive Plan (LTI) is a share-based pay-ment, cash settled plan that takes into account both the per-formance of the Company and the share price development.
The participants receive a preliminary number of share units (virtual shares) at the start of the performance period based on a percentage of the respective base salary multiplied with a con-version rate. The conversion rate is determined based on the average share price of the previous 60 trading days of the calen-dar year prior to the grant date. Once four years have elapsed, the number of share units granted at the start of the performance period is adjusted based on the Company’s performance achieved, incorporating both the targets defined during the per-formance period and the Company / regional factor.
The goal achievement factor, measured by adjusted EBITA, as well as the Company / regional factor are applied as performance targets. The goal achievement factor is based on the adjusted EBITA of the NORMA Group. The absolute adjusted EBITA target is determined for every year of the performance period based on the budgeted value. After conclusion of the four-year-period, the yearly recorded adjusted EBITA values are defined as percentage in relation to the target values and averaged out over the four years. Allocation occurs above a goal achievement ratio of 90 %. Between 90 % and 100 % goal achievement every percentage point amounts to 10 percentage points of goal achievement fac-tor. Between 100 % and 200 % goal achievement the goal achievement factor grows by 1.5 percentage points per percent-age point of goal achievement.
The company factor is determined by the Group Senior Manage-ment based on the development of the Company, as well as the development in relation to comparable companies. In addition to this, the development of free cash flows are taken into account when determining the factor. At the discretion of the Group Senior Management, unanticipated developments can also be taken into account and the company factor corrected either downward or upward accordingly. The factor can assume values between 0.5 and 1.5.
The regional factor is defined by the Group Senior Management prior to pay-out and can assume a value between 0.5 and 1.5. The factor takes into account the results of the region, as well as any region-specific aspects.
The value of the share units is then determined at the end of the fourth calendar year based on the average share price of the last 60 days of trading in this fourth year. In case that the calculated Long-term Incentive pay-out exceeds 250 % of initial grant value,
the maximum pay-out is capped at 250 %. The value determined is paid out to the participants in cash in May of the fifth year.
The LTI is a group-wide and global compensation instrument with a long-term orientation. Due to the coupling to the develop-ment not only of the stock price, but also the Company’s perfor-mance, the LTI provides an additional incentive to create value through value-based action, aligned with the goals of NORMA Group.
The determination of fair value, which is the basis for determining the pro rata provision at the balance sheet date, was performed using a Monte Carlo simulation. Due to the cash settlement of the virtual share units the fair value is measured at each balance sheet date and the resulting changes in the fair value are recog-nised in income or loss. The allocation of the expenses is made on a pro rate basis over the performance period.
The share units granted under the LTI changed as follows in the 2013 financial year:
1. Tranche
LTI 2013
Expected duration until exercised in years 3.00
Fair value per “Share Unit” in EUR 30.73
Share price when granted in EUR 20.68
Balance at 31 December 2012 0
Tentatively granted “Share Units” 43,394
Exercised -
Lapsed 6,272
Balance at 31 December 2013 37,122
In the financial year 2013, expenses resulting from the LTI in an amount of EUR 285 thousand were recorded under personnel expense and within a corresponding liability.
29. RETIREMENT BENEFIT OBLIGATIONS
Retirement benefit obligations result mainly from the German pension plan and a Swiss post-employment benefit plan.
The German defined benefit pension plan was closed for new entrants in 1990 and provides benefits in case of retirement, disability, and death as life-long pension payments. The benefits entitlements depend on years of service and salary. The portion of salary that is above the income threshold for social security contribution leads to higher benefit entitlements compared to the portion of the salary up to that threshold. Even the plan was closed in 1990, NORMA Group is still exposed to certain actu-

NORMA Group SE Annual Report 2013162
arial risks associated with defined benefit plans, such as lon gevity and compensation increases. Due to the amount of the obligation and the composition of the plan participants, approximately 95 % are pensioners, significant change in the actuarial assumptions would have no significant effects on the NORMA Group. Em-ployees hired after 1990 are eligible under a defined contribution scheme. The contributions are paid into an insurance contract providing lump sum payments in case of retirements and death.
Besides the German plan there is a further benefit plan in Switzer-land resulting from the Swiss “Berufliches Vorsorgegesetz” law (BVG). According to the BVG each employer has to grant post-em-ployment benefits for qualifying employees. The plan is a capital based plan under which the Company has to make contributions equivalent to at least the limits specified in the plan conditions employee contributions. These plans are administered by foun-dations that are legally separated from the entity and are subject to the BVG. The Group has outsourced the investment process to the Foundation, which sets the strategic asset allocation in their group life portfolio. All regulatory granted obligations out of the plan are reinsured by an insurance company. This covers risks of disability, death and longevity. Furthermore, there is, for the retirement assets invested, a 100 % capital and interest guar-antee. In the case of a shortfall, the employer and plan partici-pants’ contribution might be increased according to decisions of the relevant foundation board. Strategies of the foundation boards to make up for potential shortfalls are subject to approval by the regulator.
Reconciliation for defined benefit obligations (DBO) and plan assetsThe amounts included in the Group’s Consolidated Financial Statements arising from its post-employment defined benefit plans are as follows:
in EUR thousands
31 Dec 2013 31 Dec 2012
Present value of obligations 12,907 10,319
Fair Value of plan assets 2,038 0
Effects in connection with assets ceiling 0 0
Liability in the balance sheet 10,869 10,319
A detailed reconciliation for the changes in the DBO is provided in the following table:
in EUR thousands
2013 2012
At 1 January 10,319 8,407
Current service cost 238 255
Past service cost 0 0
Settlement (gains) losses 0 0
Interest expenses 248 356
Remeasurements:
Actuarial (gains) losses from changes in demographic assumptions – 51 1,465
Actuarial (gains) losses from changes in financial assumptions – 101 0
Experience (gains) losses 181 0
Plan participants contribution 0 0
Benefits paid – 656 – 656
Settlement payments 0 0
Business combinations, disposals and other 2,730 489
Foreign currency translation effects – 1 3
At 31 December 12,907 10,319
The changes in the scope of consolidation and other are due to the initial consolidation of the Swiss plan.
The total defined benefit obligation at the end of financial 2013 includes EUR 4,711 thousand for active employees, EUR 77 thou-sand for former employees with vested benefits and EUR 8,119 thousand for retirees and surviving dependents.
A detailed reconciliation of the changes in the fair value of plan assets is provided in the following table:
in EUR thousands
2013
At 1 January 0
Interest income 0
Remeasurement:
Return on plan assets excluding amounts included in net interest expenses 0
Employer contributions 0
Plan participants contributions 0
Benefits paid 0
Settlement payments 0
Business combinations, disposal and other 2,038
Liability administration costs 0
Foreign currency translation effects 0
Fair value of plan assets at end of year 2,038
The other changes are due to the initial consolidation of the Swiss plan.

163Consolidated Financial Statements
Notes to the Consolidated Financial Statements
Disaggregation of plan assetsThe allocation of the plan assets of the benefit plans is as follows:
in EUR thousands
2013
Asset class
Insurance contracts 1,956
Cash deposit 80
Equity securities 3
Total 2,038
Cash deposits and equity securities have quoted prices in active markets. The values for insurance contracts represent the re-demption value, for these no quoted prices in an active market are available.
Actuarial assumptionsThe principal actuarial assumptions are as follows:
in %
2013 2012
Discount rate 2.85 2.91
Inflation rate 1.77 2.00
Future salary increases 2.40 2.52
Future pension increases 2.00 2.00
The biometric assumptions are based on the 2005 G Heubeck life-expectancy tables for the German plan and on the life-ex-pectancy tables of the BVG 2010 G for the Swiss plan.
Sensitivity analysisIf the discount rate were to differ by + 0.25 % / – 0.25 % from the interest rate used at the balance sheet date, the defined benefit obligation for pension benefits would be an estimated EUR 369 thousand lower or EUR 399 thousand higher. If the future pension increase used were to differ by + 0.25 % / – 0.25 % from manage-ment’s estimates, the defined benefit obligation for pension bene-fits would be an estimated EUR 207 thousand higher or EUR 200 thousand lower. The reduction / increase of the mortality rates by 10 % results in an increase / deduction of life expectancy depend-ing on the individual age of each beneficiary. That means for example, that the life expectancy of a male NORMA employee age 55 years as at 31 December 2013 increases / decreases by approximately one year. In order to determine the longevity sen-sitivity the mortality rates were reduced / increased by 10 % for all beneficiaries. The effect on DBO as at 31 December 2013 due to a 10 % reduction / increase in mortality rates would result in an increase of EUR 642 thousand or decrease of EUR 670 thousand.
When calculating the sensitivity of the defined benefit obligation to significant actuarial assumptions the same method (present value of the defined benefit obligation calculated with the pro-
jected unit credit method) has been applied as when calculating the post-employment benefit obligation recognised in the Con-solidated Statement of Financial Position. Increases and decreas-es in the discount rate or rate of pension progression which are used in determining the DBO do not have a symmetrical effect on the DBO due to the compound interest effect created when determining the net present value of the future benefit. If more than one of the assumptions are changed simultaneously, the combined impact due to the changes would not necessarily be the same as the sum of the individual effects due to the changes. If the assumptions change at a different level, the effect on the DBO is not necessarily in a linear relation.
Future cash flowsEmployer contributions expected to be paid to the post-employ-ment defined benefit plans in financial year 2014 are EUR 165 thousand.
Expected payments from post-employment benefit plans are as follows:
in EUR
31 Dec 2013
Expected benefit payments
2014 761,788
2015 751,766
2016 740,945
2017 730,478
2018 719,915
2019 – 2023 3,443,497
The weighted average duration of the defined benefit obligation is 9.9 years.

NORMA Group SE Annual Report 2013164
30. PROVISIONS
The development of provisions is as follows:
in EUR thousandsAt
1 Jan 2013
Effects from the
application of IAS 19R
At1 Jan 2013 Additions
Amounts used
Unused amounts reversed
Interest accrued
Changes in consoli-
dation
Foreign currency
translation
At 31 Dec
2013
Guarantees 1,652 0 1,652 578 – 131 – 4 0 95 – 46 2,144
Restructuring 621 0 621 437 – 507 0 0 0 – 2 549
Early retirement 1) 3,936 – 1,181 2,755 2,136 – 2,060 0 52 0 0 2,883
Other personnel-related obligations 2,611 0 2,611 1,565 – 217 – 115 3 217 – 101 3,963
Outstanding credit notes 1,653 0 1,653 532 – 659 – 113 0 0 – 22 1,391
Outstanding invoices 839 0 839 269 – 182 – 99 0 0 – 25 802
Others 1,170 0 1,170 837 – 532 – 21 0 510 – 78 1,886
Total provisions 12,482 – 1,181 11,301 6,354 – 4,288 – 352 55 822 – 274 13,618
in EUR thousandsAt
1 Jan 2012
Effects from the
application of IAS 19R
At1 Jan 2012 Additions
Amounts used
Unused amounts reversed
Interest accrued
Changes in consoli-
dation
Foreign currency
translation
At 31 Dec
2012
Guarantees 1,507 0 1,507 222 – 837 0 0 758 2 1,652
Restructuring 782 0 782 455 – 586 – 34 0 1 3 621
Early retirement 1) 3,902 – 1,120 2,782 1,876 – 2,059 0 156 0 0 2,755
Other personnel-related obligations 1,790 0 1,790 1,113 – 548 0 115 122 19 2,611
Outstanding credit notes 2,541 0 2,541 695 – 1,300 – 319 0 0 36 1,653
Outstanding invoices 99 0 99 746 – 283 0 0 276 1 839
Others 353 0 353 738 – 135 – 14 0 229 – 1 1,170
Total provisions 10,974 – 1,120 9,854 5,845 – 5,748 – 367 271 1,386 60 11,301
31 December 2013 31 December 2012
in EUR thousands Total
thereof current
thereof non-current Total
thereof current
thereof non-current
Guarantees 2,144 1,835 309 1,652 1,354 298
Restructuring 549 549 0 621 621 0
Early retirement 1) 2,883 0 2,883 2,755 0 2,755
Other personnel-related obligations 3,963 2,289 1,674 2,611 1,155 1,456
Outstanding credit notes 1,391 1,391 0 1,653 1,653 0
Outstanding invoices 802 802 0 839 839 0
Others 1,886 1,468 418 1,170 1,121 49
Total provisions 13,618 8,334 5,284 11,301 6,743 4,558
1) Restated due to effects from the application of IAS 19R. See: Section 2 Basis of preparation and Section 7 Change in accounting principles.

165Consolidated Financial Statements
Notes to the Consolidated Financial Statements
Employees at NORMA Group in Germany can engage in an early retirement contract (“Altersteilzeit”). The employee reduces his / her working hours in preparation of his / her retirement. In the first phase the employee works 100 % (“Arbeitsphase”). In the second phase he / she is exempt from work (“Freistellungsphase”). The employees receive half of their payment for the total early retire-ment-phase as well as top-up payments (including social secu-rity costs paid by the employer). The duration of the early retire-ment has a maximum of six years.
The accounting for early retirement (“Altersteilzeit”) is based on actuarial valuations taking into account assumptions such as a discount rate of 1.75 % (2012: 1.80 %) as well as the 2005 G Heu-beck life-expectancy tables. For signed early retirement contracts a liability has been recognised. The liability includes top-up pay-ments (“Aufstockungsbeträge”) as well as deferred salary pay-ments (“Erfüllungsrückstände”).
Provisions for guarantees include provisions due to circum stances where a final agreement has not yet been achieved and provisions based on experience (customer claim quota, amount of damage, etc.). Future price increases are considered if material.
Other personnel-related obligations include long-term incentives in an amount of EUR 2,113 thousand (2012: EUR 635 thousand), which are mainly due to a variable element of the board compen-sation (LTI) of the Management Board. The Company’s long-term incentive (LTI) plan is a component of a variable remuneration element designed to maximise the Company’s long-term perfor-mance. The LTI plan also comprises an EBITA component and an operating free cash flow before external use (FCF) component, each of which are observed over a period of three years (perfor-mance period). A new three year performance period begins every year. Both components are calculated by multiplying the average annual adjusted EBITA and FCF values actually achieved in the performance period by the adjusted EBITA and FCF bonus percentages specified in the employment contract. In the second step, the actual value of a component is compared to the medi-um-term plan approved by the Supervisory Board to evaluate the Company’s performance and adjustments are made to the LTI plan. The LTI plan is limited to two and a half times the amount that would be arrived at on the basis of the figures in the Com-pany’s medium-term plan. If the actual value is lower than the planned value, the LTI plan is reduced on a straight-line basis down to a minimum of EUR 0 if the three year targets are missed by a significant amount. Due to the calculation of the variable remuneration based on future results of the Group, uncertainties exist regarding the amount of the future outflows. Parts of the long-term compensation component will be paid out in the first half of the following financial year and are therefore reported under the current provisions.
Furthermore other personnel-related provisions include jubilee provisions in an amount of EUR 585 thousand (2012: EUR 622 thousand) and provisions for payable income tax and social security contributions in foreign countries and other personnel- related provisions.
Jubilee provisions are based on actuarial valuations taking into account assumptions such as a discount rate of 2.8 % as well as the 2005 G Heubeck life-expectancy tables.
Provisions for outstanding credit notes in an amount of EUR 1,391 thousand (2012: 1,653 thousand) include obligations for sub-sequent price adjustments for past periods due to ongoing ne-gotiations with customers. There are uncertainties regarding the amount and timing of the outflows. However, it is expected that this results within a year in payments.
The position “Other” includes provisions for dismantling obligations in an amount of EUR 1,117 thousand (2012: EUR 545 thousand).
31. BORROWINGS
The borrowings were as follows:
in EUR thousands
31 Dec 2013 31 Dec 2012
Non-current
Bank borrowings 200,981 190,727
200,981 190,727
Current
Bank borrowings 117,856 25,681
Revolving credit facility 5,500 18,500
Other borrowings (e. g. factoring and reverse-factoring) 1,771 6,788
125,127 50,969
Total borrowings 326,108 241,696
Bank borrowingsThe syndicated bank facilities agreed upon in the second quarter of 2011 of EUR 250 million have a maturity until 2016 and are denominated in euro. By 31 December 2013, EUR 55 million were repaid according to the payment plan. Additionally, a revolving credit facility of EUR 125 million is available for financing the oper-ating business or future acquisitions within the line of the facility agreement. At 31 December 2013, EUR 5.5 million of this credit line was used (31 December 2012: EUR 18.5 million). Furthermore, NORMA Group issued a promissory note valued at EUR 125 million with 5, 7 and 10 year terms in July 2013.

NORMA Group SE Annual Report 2013166
The maturity of the syndicated bank borrowings and the prom-issory note at 31 December 2013 is as follows:
in EUR thousands
up to
1 year
> 1 year
up to 2 years
> 2 years up to
5 years
> 5 years
Bank borrowings, net 115,800 19,200 60,000 0
Promissory Note, net 0 0 52,000 73,000
Total 115,800 19,200 112,000 73,000
The maturity of the syndicated bank borrowings at 31 December 2012 is as follows:
in EUR thousands
up to
1 year
> 1 year
up to 2 years
> 2 years up to
5 years
> 5 years
Bank borrowings, net 25,000 70,000 125,000 0
Total 25,000 70,000 125,000 0
The early repayment made in January 2014 in an amount of EUR 101.4 million is already considered within the maturity analysis ( Note 43).
Costs amounting to EUR 7,859 thousand that are directly attri-butable to the refinancing were netted with the bank borrowings in accordance with IAS 39.43. They are amortised over the finan-cing period of five years using the effective interest method.
The syndicated bank facilities are hedged against foreign ex-change rate and interest rate changes. Furthermore, tranches of the promissory note with variable interest rates are hedged against interest rate changes. The derivative liability was de-creased from EUR 24,675 thousand at 31 December 2012 to EUR 15,220 thousand at 31 December 2013.
The bank borrowings are unsecured at 31 December 2013. With renegotiations of the credit facilities in the fourth quarter of 2012 the established securities for the existing credit lines were fully released.
FactoringNORMA Group has sold a portion of their receivables (EUR 1,339 thousand) and payables (EUR 432 thousand) to a factor. NORMA Group still bears the opportunities and risks resulting from the receivables. The transactions are therefore shown as financial liabilities.
32. OTHER NON-FINANCIAL LIABILITIES
The other non-financial liabilities are as follows:
in EUR thousands
31 Dec 2013 31 Dec 2012
Non-current
Government grants 1,163 1,394
Other liabilities 235 195
1,398 1,589
Current
Non-income tax liabilities 2,859 1,606
Social liabilities 3,021 3,285
Personnel-related liabilities (e. g. holiday, bonus, premiums) 14,827 13,278
Other liabilities 1,547 1,341
Deferred income 153 90
22,407 19,600
Total other non-financial liabilities 23,805 21,189
NORMA Group received government grants amounting to EUR 1,163 thousand. They consist of grants in cash as well as land. The grants are bound to capital expenditures and employees. NORMA Group recognises the government grants as income over the period in which related expenses occur. In 2013, EUR 301 thousand were recognised as income (2012: EUR 139 thou-sand).
33. OTHER FINANCIAL LIABILITIES
The other financial liabilities were as follows:
in EUR thousands
31 Dec 2013 31 Dec 2012
Non-current
Lease liabilities 375 535
Acquisition liability 544 2,131
Other liabilities 700 0
1,619 2,666
Current
Lease liabilities 308 405
Outstanding credit notes 225 225
Acquisition liability 2,956 589
Other liabilities 1,187 1,006
4,676 2,225
Total other financial liabilities 6,295 4,891

167Consolidated Financial Statements
Notes to the Consolidated Financial Statements
The future aggregate minimum lease payments under non-can-cellable finance leases and their respective present values are as follows:
in EUR thousands
31 Dec 2013 31 Dec 2012
Gross finance lease liabilities – minimum lease payments
Up to 1 year 343 450
Later than 1 year and up to 5 years 395 585
Later than 5 years 0 0
738 1,035
Future finance charges on finance lease 55 95
Present value of finance lease liabilities
Up to 1 year 308 405
Later than 1 year and up to 5 years 375 535
Later than 5 years 0 0
683 940
Lease liabilities are effectively secured because the rights to the leased assets will revert to the lessor in the event of default.
34. TRADE PAYABLES
All trade payables are due to third parties within one year. For information regarding trade payables, please refer to Note 3.14.
35. FINANCIAL LIABILITIES AND NET DEBT
The financial liabilities of NORMA Group have the following maturity:
31 DECEMBER 2013
in EUR thousands
up to
1 year
> 1 year
up to 2 years
> 2 years up to
5 years
> 5 years
Borrowings 125,127 19,326 108,619 73,036
Trade payables 59,025 0 0 0
Finance lease liabilities 309 221 153 0
Other financial liabilities 4,367 508 737 0
188,828 20,055 109,509 73,036
31 DECEMBER 2012
in EUR thousands
up to
1 year
> 1 year
up to 2 years
> 2 years up to
5 years
> 5 years
Borrowings 50,969 28,971 161,756 0
Trade payables 37,663 0 0 0
Finance lease liabilities 405 340 195 0
Other financial liabilities 1,820 758 1,373 0
90,857 30,069 163,324 0
Net debt of the NORMA Group is as follows:
in EUR thousands
31 Dec 2013 31 Dec 2012
Bank borrowings, net 324,338 234,908
Derivative financial liabilities – hedge accounting 15,270 24,675
Derivative financial liabilities – held for trading 0 114
Other borrowings (e.g. factoring and reverse-factoring) 1,770 6,788
Lease liabilities 683 940
Other financial liabilities 5,612 3,951
Financial debt 347,673 271,376
Cash and cash equivalents 194,188 72,389
Net debt 153,485 198,987
The financial debt of NORMA Group increased by 28.1 % from EUR 271,376 thousand as at 31 December 2012 to EUR 347,673 thousand as at 31 December 2013. The increase is mainly due to the issue of a promissory note valued at EUR 125 million. Conversely bank borrowings were repaid in an amount of EUR 47 million and the derivative financial liabilities decreased as a result of the valuation as at 31 December 2013.
The net debt of EUR 153,485 thousand decreased significantly in comparison to 31 December 2012 (EUR 198,987 thousand).

NORMA Group SE Annual Report 2013168
Other Notes
36. INFORMATION ON THE CONSOLIDATED
STATEMENT OF CASH FLOWS
In the statement of cash flows a distinction is made between cash flows from operating activities, investing activities and financing activities.
Cash flows from operating activities represent the cash effects of transactions and other events relating to the principal revenue- producing activities. The Group participates in a reverse-factor-ing-programme. The payments to the factor are included in cash flows from operating activities, since this represents the econom-ic substance of the transaction. Other non-cash ex penses and revenues in financial year 2013 mainly include the non-cash val-uation of interest rate swaps amounting to EUR 2,329 thousand (2012: EUR – 3,085 thousand), the non-cash evaluation of bank borrowings amounting to EUR 6,430 thousand (2012: EUR – 2,885 thousand).
Furthermore, non-cash expenses from the stock option pro-gramme amounting to EUR 699 thousand (2012: EUR 418 thou-sand) and non-cash interest expenses amounting to EUR 1,710 thousand (2012: EUR 1,694 thousand) are included in non-cash expenses and revenues.
In 2012, a one-time-income of EUR 1,296 thousand resulting from the fair-value-evaluation of the 30 %-share in Groen Bevestigings-materialen B.V. is also recognised in this item.
Cash flows resulting from interest paid (2013: EUR – 9,773 thou-sand; 2012: EUR – 11,630 thousand) are disclosed as cash flows from financing activities.
Cash flows from investing activities in 2013 in an amount of EUR 13,210 thousand include the cash effects from the purchases of the distribution business of Davydick & Co. Pty Limited and Variant S.A., the purchase of a portion of the production of Click Automotiva Industrial Ltda., as well as the purchase of Guyco Pty Limited. In 2012, cash effects from acquisitions in the amount of EUR 28.976 were recognised.
Furthermore, cash flows from investing activities include transac-tions relating to the acquisition and disposal of non-current assets. Cash flows from the acquisition of non-current assets of EUR 30,528 thousand include cash flows for growth of EUR 23,191 thousand and cash flows for maintenance of EUR 7,337 thousand.
The net payments for acquisitions of subsidiaries in 2013 were as follows:
in EUR thousands
Consideration 16,819
Acquired cash and cash equivalents – 109
Acquisition liability – 3,500
Net payments for acquisitions of subsidiaries 13,210
Cash flows from financing activities comprise proceeds from borrowings (2013: EUR 128,118 thousand, 2012: EUR 18,500 thousand), repayments of borrowings (2013: EUR – 47,051 thou-sand; 2012: EUR – 23,173 thousand), payment of the dividend (2013: EUR – 20,711 thousand, 2012: EUR – 19,125 thousand), reimbursement of OPICP by shareholders (2013: EUR 1,067 thou-sand, 2012: EUR 1,307 thousand) as well as cash flows resulting from interest paid (2013: EUR – 9,773 thousand, 2012: EUR – 11,630 thousand).
Cash is comprised of cash on hand and demand deposits of EUR 194,188 thousand at 31 December 2013 (31 December 2012: EUR 72,389 thousand). Cash from China, Serbia, Brazil and Malay sia (31 December 2013: EUR 9,272 thousand, 31 Decem-ber 2012: EUR 4,963 thousand) cannot currently be distributed due to restrictions on capital movements.
37. SEGMENT REPORTING
NORMA Group segments the Group at a regional level. The report able segments of NORMA Group are EMEA, the Americas, and Asia-Pacific. NORMA Group’s vision includes regional growth targets. Distribution Services are focused regionally and locally. EMEA, the Americas and Asia-Pacific have linked regional inter-company organisations of different functions. As a result, the Group’s management reporting and controlling system has a regional focus. The product portfolio does not vary significantly between these segments.
Revenues of each segment are generated from the three product categories clamps (CLAMP), joining elements (CONNECT) and fluid systems/connectors (FLUID).
NORMA Group measures the performance of its segments through profit or loss indicators which are referred to as “adjust-ed EBITDA” and “adjusted EBITA”.
The “adjusted EBITDA” comprises revenue, changes in invento-ries of finished goods and work in progress, other own work capitalised, raw materials and consumables used, other operat-ing income and expenses, and employee benefits expense, ad-justed for material one-time effects. EBITDA is measured in a manner consistent with that used in the statement of compre-hensive income.

169Consolidated Financial Statements
Notes to the Consolidated Financial Statements
The “adjusted EBITA” includes, in addition to the EBITDA, the depreciation adjusted for depreciation from purchase price allo-cations.
In 2013 and 2012, no material one-time items occurred, therefore the EBITA is only adjusted by depreciation from purchase price allocations.
Inter-segment revenue is recorded at values that approximate third-party selling prices.
Segment assets comprise all assets less (current and deferred) income tax assets. Taxes are shown in the reconciliation. Seg-ment assets and liabilities are measured in a manner consistent with that used in the statement of financial position.
Assets of the “Central Functions” include mainly cash and inter-company receivables.
Segment liabilities comprise of all liabilities less (current and de-ferred) income tax liabilities. Taxes are shown in the reconciliation. Segment assets and liabilities are measured in a manner consis-tent with that used in the statement of financial position. Liabilities of the “Central Functions” include mainly borrowings.
Capex equals additions to non-current assets.
The reconciliation of the segments’ adjusted EBITDA and EBITA is as follows:
in EUR thousands
2013 20121)
Total segments’ adjusted EBITDA 129,319 120,789
Depreciation without PPA depreciation – 16,699 – 15,392
Total adjusted EBITA of the Group 112,620 105,397
Depreciation from PPA – 496 – 273
EBITA of the Group 112,124 105,124
Amortisation – 12,604 – 10,749
Financial costs – net – 15,585 – 13,172
Profit before tax 83,935 81,203
1) Restated due to effects from the application of IAS 19R. See: Section 2 Basis of preparation and Section 7 Change in accounting principles.
Current and deferred tax assets and liabilities are shown in the consolidation. At 31 December 2013, EUR 13,105 thousand (31 December 2012: EUR 21,434 thousand) tax assets and EUR 43,217 thousand (31 December 2012: EUR 50,767 thousand) tax liabilities were shown in the consolidation.
External sales per country, measured according to the place of domicile of the company which manufactures the products, are as follows:
in EUR thousands
2013 2012
Germany 188,414 197,281
USA, Mexico 191,569 193,328
Other countries 255,562 214,004
635,545 604,613
The non-current assets per country include non-current assets less deferred tax assets, derivative financial instruments, and shares in consolidated related parties.
in EUR thousands
31 Dec 2013 31 Dec 2012
Germany 118,879 121,028
USA, Mexico 152,854 158,165
Sweden 53,239 54,746
Other countries 129,463 123,648
Consolidation – 11,386 – 18,515
443,049 439,072
38. CONTINGENCIES
The Group has contingent liabilities in respect of legal claims arising in the ordinary course of business.
NORMA Group does not believe that any of these contingent liabilities will have a material adverse effect on its business or any material liabilities will arise from contingent liabilities.
39. COMMITMENTS
Capital commitmentsCapital expenditure (nominal value) contracted for at the balance sheet date but not yet incurred is as follows:
in EUR thousands
31 Dec 2013 31 Dec 2012
Property, plant and equipment 1,443 1,191
1,443 1,191
There are no material commitments concerning intangible assets.
Operating lease commitmentsThe Group leases various vehicles, property and technical equip-ment under non-cancellable operating lease agreements. The lease terms are between 1 and 15 years. The Group also leases various technical equipment under cancellable operating lease agreements.

NORMA Group SE Annual Report 2013170
NORMA Group has significant operating lease arrangements with annual lease payments of more than EUR 200 thousand, con-cerning the leasing of land and buildings. Except for usual renew-able options, the lease contracts do not comprise other options. The lease arrangements are held by the following companies:
NORMA UK Ltd. (Great Britain): lease-term from 2006 to 2016, prolonged to 2028, soonest termination in 2023,
NORMA Pacific Pty Ltd. (Australia): lease-term from 2013 to 2017, soonest termination in 2017,
NORMA Michigan Inc. (USA): lease-term from 2008 to 2018, soonest termination in 2018,
NORMA Pennsylvania Inc. (USA): lease-term from 2011 to 2016, soonest termination in 2016,
Connectors Verbindungstechnik AG (Switzerland): lease-term from 2012 to 2016, soonest termination in 2016,
Nordic Metalblok S.r.l. (Italy): lease-term from 2012 to 2018, soonest termination in 2018.
Lease expenditure (including non-cancellable and cancellable operating leases) amounting to EUR 8,345 thousand in 2013 (2012: EUR 7,774 thousand) is included in profit or loss in ‘other operating expenses.’
The following table shows the future aggregate minimum lease payments (nominal value) under non-cancellable operating leases:
in EUR thousands
31 Dec 2013 31 Dec 2012
No later than 1 year 5,191 4,356
Later than 1 year and no later than 5 years 9,780 10,306
Later than 5 years 6,053 6,605
21,024 21,267
40. BUSINESS COMBINATIONS
Business combinations in the financial yearNORMA Group acquired the distribution business of Davydick & Co. Pty Limited (Australia), the distribution business for joining technology from Variant S.A. (Poland), 100 % of the shares in the Guyco Pty Limited (Australia) as well as a portion of the produc-tion of Click Automotiva Industrial Ltda. (Brazil) in 2013.
In the purchase price allocation, mainly immaterial assets were identified. Customer lists were evaluated using the ‘Multi Period Excess Earnings Method’ amounting to EUR 5,375 thousand. Patents & technology of EUR 1,120 thousand were evaluated with the ‘Relief from Royalty Method.’ Distribution rights were evalu-ated using the ‘Multi Period Excess Earnings Method’ amounting to EUR 717 thousand.
The acquired assets and liabilities are shown in detail in the fol-lowing section.
Davydick & Co. Pty. LimitedNORMA Group signed an agreement on 10 January 2013 to acquire the distribution business of Davydick & Co. Pty. Limited in Australia.
Davydick & Co. Pty. Limited, based in Goulburn, approximately 150 kilometres southwest of Sydney, has been a distributor of various elements for the transportation of water in irrigation sys-tems for more than 20 years. The Company is specialised in supplying a comprehensive range of rural irrigation fittings, valves, and pumps under the appellation “PUMPMASTER” to around 700 customers throughout Australia in the agricultural, hardware and plumbing markets. Davydick & Co. Pty. Limited maintains branches in Melbourne, Adelaide and Brisbane. In the financial year 2012, the Company generated overall sales of around EUR 5 million. With the acquisition of the distribution business of Davydick NORMA Group builds on its water platform and com-plements its product range in the infrastructure business area. The Company expands its distribution network with a focus on agriculture and irrigation.
Change of the primarily purchase price allocation of the distribution business of Davydick & Co. Pty. Limited acquired in the first quarter of 2013The purchase price allocation was adjusted in the third quarter of 2013 based on new information regarding facts and circum-stances that existed as of the acquisition date. Had this infor-mation been available at the time, it would have had an effect on the allocation of the purchase price.
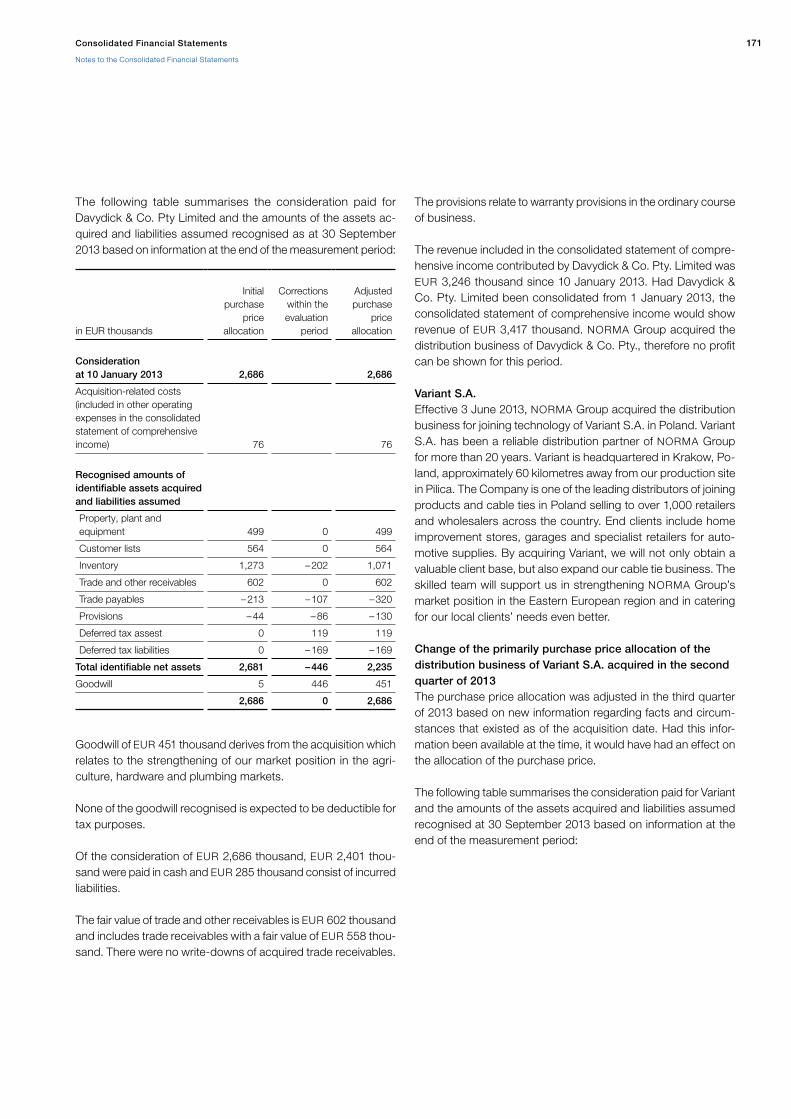
171Consolidated Financial Statements
Notes to the Consolidated Financial Statements
The following table summarises the consideration paid for Davydick & Co. Pty Limited and the amounts of the assets ac-quired and liabilities assumed recognised as at 30 September 2013 based on information at the end of the measurement period:
in EUR thousands
Initial purchase
price allocation
Corrections
within the evaluation
period
Adjusted purchase
price allocation
Consideration at 10 January 2013 2,686 2,686
Acquisition-related costs (included in other operating expenses in the consolidated statement of comprehensive income) 76 76
Recognised amounts of identifiable assets acquired and liabilities assumed
Property, plant and equipment 499 0 499
Customer lists 564 0 564
Inventory 1,273 – 202 1,071
Trade and other receivables 602 0 602
Trade payables – 213 – 107 – 320
Provisions – 44 – 86 – 130
Deferred tax assest 0 119 119
Deferred tax liabilities 0 – 169 – 169
Total identifiable net assets 2,681 – 446 2,235
Goodwill 5 446 451
2,686 0 2,686
Goodwill of EUR 451 thousand derives from the acquisition which relates to the strengthening of our market position in the agri-culture, hardware and plumbing markets.
None of the goodwill recognised is expected to be deductible for tax purposes.
Of the consideration of EUR 2,686 thousand, EUR 2,401 thou-sand were paid in cash and EUR 285 thousand consist of incurred liabilities.
The fair value of trade and other receivables is EUR 602 thousand and includes trade receivables with a fair value of EUR 558 thou-sand. There were no write-downs of acquired trade receivables.
The provisions relate to warranty provisions in the ordinary course of business.
The revenue included in the consolidated statement of compre-hensive income contributed by Davydick & Co. Pty. Limited was EUR 3,246 thousand since 10 January 2013. Had Davydick & Co. Pty. Limited been consolidated from 1 January 2013, the consolidated statement of comprehensive income would show revenue of EUR 3,417 thousand. NORMA Group acquired the distribution business of Davydick & Co. Pty., therefore no profit can be shown for this period.
Variant S.A.Effective 3 June 2013, NORMA Group acquired the distribution business for joining technology of Variant S.A. in Poland. Variant S.A. has been a reliable distribution partner of NORMA Group for more than 20 years. Variant is headquartered in Krakow, Po-land, approximately 60 kilometres away from our production site in Pilica. The Company is one of the leading distributors of joining products and cable ties in Poland selling to over 1,000 retailers and wholesalers across the country. End clients include home improvement stores, garages and specialist retailers for auto-motive supplies. By acquiring Variant, we will not only obtain a valuable client base, but also expand our cable tie business. The skilled team will support us in strengthening NORMA Group’s market position in the Eastern European region and in catering for our local clients’ needs even better.
Change of the primarily purchase price allocation of the distribution business of Variant S.A. acquired in the second quarter of 2013 The purchase price allocation was adjusted in the third quarter of 2013 based on new information regarding facts and circum-stances that existed as of the acquisition date. Had this infor-mation been available at the time, it would have had an effect on the allocation of the purchase price.
The following table summarises the consideration paid for Variant and the amounts of the assets acquired and liabilities assumed recognised at 30 September 2013 based on information at the end of the measurement period:
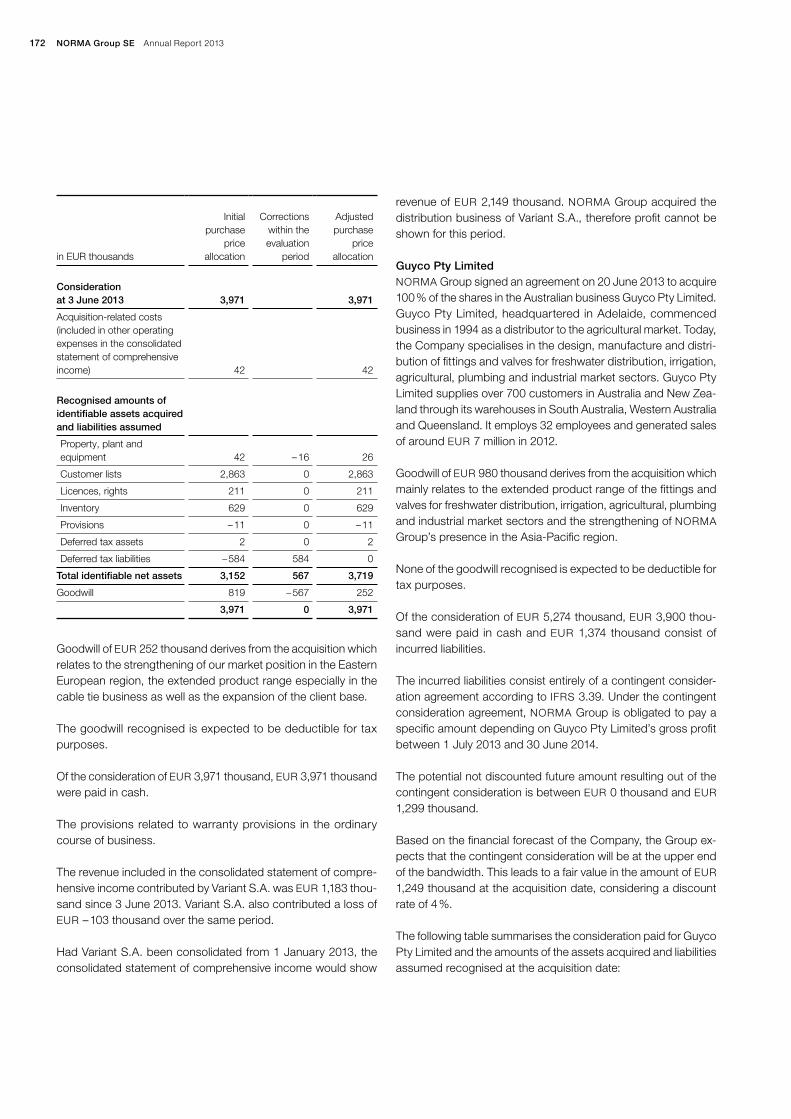
NORMA Group SE Annual Report 2013172
in EUR thousands
Initial purchase
price allocation
Corrections
within the evaluation
period
Adjusted purchase
price allocation
Consideration at 3 June 2013 3,971 3,971
Acquisition-related costs (included in other operating expenses in the consolidated statement of comprehensive income) 42 42
Recognised amounts of identifiable assets acquired and liabilities assumed
Property, plant and equipment 42 – 16 26
Customer lists 2,863 0 2,863
Licences, rights 211 0 211
Inventory 629 0 629
Provisions – 11 0 – 11
Deferred tax assets 2 0 2
Deferred tax liabilities – 584 584 0
Total identifiable net assets 3,152 567 3,719
Goodwill 819 – 567 252
3,971 0 3,971
Goodwill of EUR 252 thousand derives from the acquisition which relates to the strengthening of our market position in the Eastern European region, the extended product range especially in the cable tie business as well as the expansion of the client base.
The goodwill recognised is expected to be deductible for tax purposes.
Of the consideration of EUR 3,971 thousand, EUR 3,971 thousand were paid in cash.
The provisions related to warranty provisions in the ordinary course of business.
The revenue included in the consolidated statement of compre-hensive income contributed by Variant S.A. was EUR 1,183 thou-sand since 3 June 2013. Variant S.A. also contributed a loss of EUR – 103 thousand over the same period.
Had Variant S.A. been consolidated from 1 January 2013, the consolidated statement of comprehensive income would show
revenue of EUR 2,149 thousand. NORMA Group acquired the distribution business of Variant S.A., therefore profit cannot be shown for this period.
Guyco Pty LimitedNORMA Group signed an agreement on 20 June 2013 to acquire 100 % of the shares in the Australian business Guyco Pty Limited. Guyco Pty Limited, headquartered in Adelaide, commenced business in 1994 as a distributor to the agricultural market. Today, the Company specialises in the design, manufacture and distri-bution of fittings and valves for freshwater distribution, irrigation, agricultural, plumbing and industrial market sectors. Guyco Pty Limited supplies over 700 customers in Australia and New Zea-land through its warehouses in South Australia, Western Aus tralia and Queensland. It employs 32 employees and generated sales of around EUR 7 million in 2012.
Goodwill of EUR 980 thousand derives from the acquisition which mainly relates to the extended product range of the fittings and valves for freshwater distribution, irrigation, agricultural, plumbing and industrial market sectors and the strengthening of NORMA Group’s presence in the Asia-Pacific region.
None of the goodwill recognised is expected to be deductible for tax purposes.
Of the consideration of EUR 5,274 thousand, EUR 3,900 thou-sand were paid in cash and EUR 1,374 thousand consist of incurred liabilities.
The incurred liabilities consist entirely of a contingent consider-ation agreement according to IFRS 3.39. Under the contingent consideration agreement, NORMA Group is obligated to pay a specific amount depending on Guyco Pty Limited’s gross profit between 1 July 2013 and 30 June 2014.
The potential not discounted future amount resulting out of the contingent consideration is between EUR 0 thousand and EUR 1,299 thousand.
Based on the financial forecast of the Company, the Group ex-pects that the contingent consideration will be at the upper end of the bandwidth. This leads to a fair value in the amount of EUR 1,249 thousand at the acquisition date, considering a discount rate of 4 %.
The following table summarises the consideration paid for Guyco Pty Limited and the amounts of the assets acquired and liabilities assumed recognised at the acquisition date:
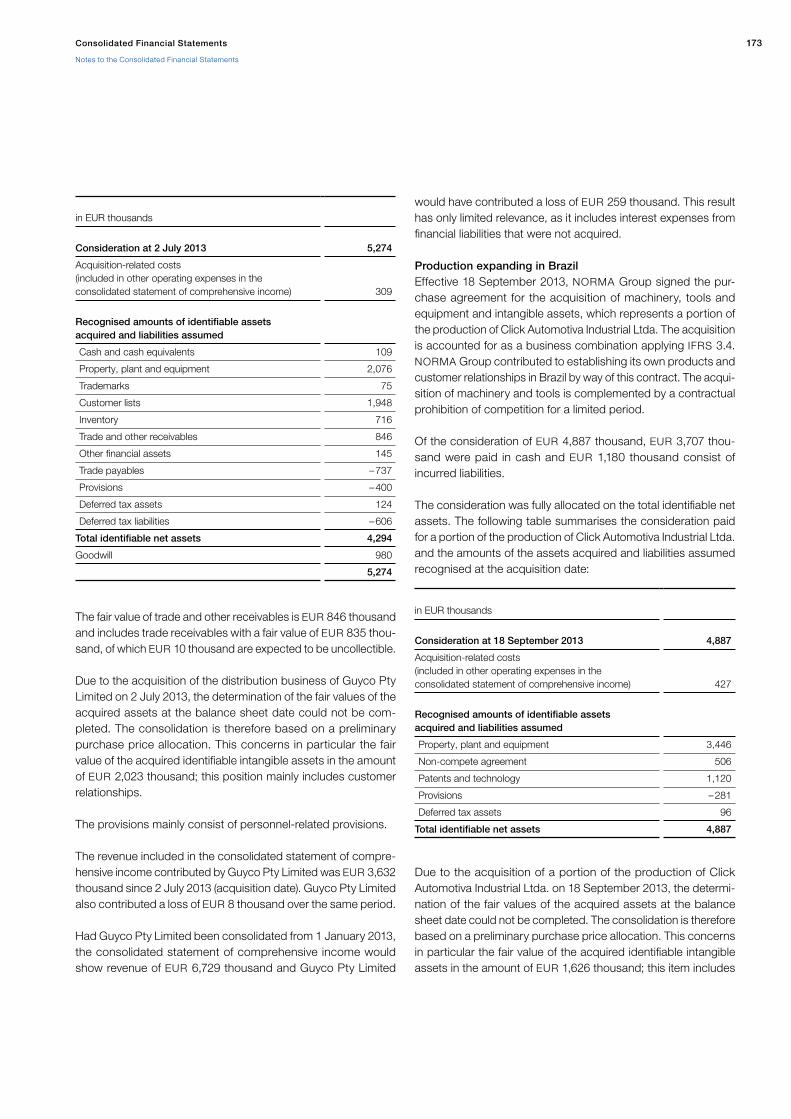
173Consolidated Financial Statements
Notes to the Consolidated Financial Statements
in EUR thousands
Consideration at 2 July 2013 5,274
Acquisition-related costs (included in other operating expenses in the consolidated statement of comprehensive income) 309
Recognised amounts of identifiable assets acquired and liabilities assumed
Cash and cash equivalents 109
Property, plant and equipment 2,076
Trademarks 75
Customer lists 1,948
Inventory 716
Trade and other receivables 846
Other financial assets 145
Trade payables – 737
Provisions – 400
Deferred tax assets 124
Deferred tax liabilities – 606
Total identifiable net assets 4,294
Goodwill 980
5,274
The fair value of trade and other receivables is EUR 846 thousand and includes trade receivables with a fair value of EUR 835 thou-sand, of which EUR 10 thousand are expected to be uncollectible.
Due to the acquisition of the distribution business of Guyco Pty Limited on 2 July 2013, the determination of the fair values of the acquired assets at the balance sheet date could not be com-pleted. The consolidation is therefore based on a preliminary purchase price allocation. This concerns in particular the fair value of the acquired identifiable intangible assets in the amount of EUR 2,023 thousand; this position mainly includes customer relationships.
The provisions mainly consist of personnel-related provisions.
The revenue included in the consolidated statement of compre-hensive income contributed by Guyco Pty Limited was EUR 3,632 thousand since 2 July 2013 (acquisition date). Guyco Pty Limited also contributed a loss of EUR 8 thousand over the same period.
Had Guyco Pty Limited been consolidated from 1 January 2013, the consolidated statement of comprehensive income would show revenue of EUR 6,729 thousand and Guyco Pty Limited
would have contributed a loss of EUR 259 thousand. This result has only limited relevance, as it includes interest expenses from financial liabilities that were not acquired.
Production expanding in BrazilEffective 18 September 2013, NORMA Group signed the pur-chase agreement for the acquisition of machinery, tools and equipment and intangible assets, which represents a portion of the production of Click Automotiva Industrial Ltda. The acquisition is accounted for as a business combination applying IFRS 3.4. NORMA Group contributed to establishing its own products and customer relationships in Brazil by way of this contract. The acqui-sition of machinery and tools is complemented by a contractual prohibition of competition for a limited period.
Of the consideration of EUR 4,887 thousand, EUR 3,707 thou-sand were paid in cash and EUR 1,180 thousand consist of incurred liabilities.
The consideration was fully allocated on the total identifiable net assets. The following table summarises the consideration paid for a portion of the production of Click Automotiva Industrial Ltda. and the amounts of the assets acquired and liabilities assumed recognised at the acquisition date:
in EUR thousands
Consideration at 18 September 2013 4,887
Acquisition-related costs (included in other operating expenses in the consolidated statement of comprehensive income) 427
Recognised amounts of identifiable assets acquired and liabilities assumed
Property, plant and equipment 3,446
Non-compete agreement 506
Patents and technology 1,120
Provisions – 281
Deferred tax assets 96
Total identifiable net assets 4,887
Due to the acquisition of a portion of the production of Click Automotiva Industrial Ltda. on 18 September 2013, the determi-nation of the fair values of the acquired assets at the balance sheet date could not be completed. The consolidation is therefore based on a preliminary purchase price allocation. This concerns in particular the fair value of the acquired identifiable intangible assets in the amount of EUR 1,626 thousand; this item includes

NORMA Group SE Annual Report 2013174
mainly a non-compete agreement as well as patented and un-patented technologies.
The provisions relate to unfavorable contractual relationships.
NORMA Group acquired a portion of the production of Click Automotiva Industrial Ltda., which led to individual assets and processes being transferred to NORMA Group; therefore no profit can be shown for this period.
41. RELATED-PARTY TRANSACTIONS
Sales and purchases of goods and servicesIn 2013 and 2012, no management services were bought from related parties.
There are no material sales or purchases of goods and services from non-consolidated companies, from the shareholders of NORMA Group, from key management or from other related par-ties in 2013 and 2012.
Details regarding the compensation of the Management Board can be found on pages 107 to 109 and Notes 28 and 42.
Reimbursement claim to 3i fundsCosts for the Operational Performance Incentive Cash Pro-gramme (OPICP) were reimbursed by the previous shareholders; in 2013 the last part of the costs for the OPICP in the amount of EUR 1,067 thousand was paid by the previous shareholders and recognised in the capital reserve in accordance with the agree-ment ( Note 27).
42. ADDITIONAL DISCLOSURES PURSUANT TO
SECTION 315A (1) OF THE GERMAN COMMERCIAL
CODE (HGB)
Compensation of board membersThe remuneration of Management Board and Supervisory Board of NORMA Group GmbH for the period 2013 was as follows:
in EUR thousands
2013
Total Management Board 3,923
Total Supervisory Board 450
4,373
Fees for the auditorFees for the auditor, PricewaterhouseCoopers AG Wirtschafts-prüfungsgesellschaft, Frankfurt am Main were expensed as fol-lows:
in EUR thousands
2013 2012
Audit fees 356 393
Audit-related fees 18 7
Other fees 111 0
485 400
HeadcountThe average headcount breaks down as follows:
Number
2013 2012
Direct labour 1,833 1,705
Indirect labour 931 858
Salaried 1,181 1,014
3,945 3,577
The category ‘direct labour’ consists of employees that are directly engaged in the production process. The numbers fluc-tuate according to the level of output. The category ‘indirect labour’ consists of personnel that do not directly produce prod-ucts, but rather support production. Salaried employees are employees in administrative/sales/central functions.
ConsolidationName, place of domicile and share in capital pursuant to section 313 (2) No. 1 HGB of the consolidated group of companies is presented in Note 4.
Proposal for the distribution of earnings The Management Board proposes that a dividend of EUR 0.70 be paid as a dividend per bearer of shares, leading to a total dividend payment of EUR 22,303,680.
Corporate governance (Section 161 AktG)The Management Board and Supervisory Board have issued a corporate governance declaration pursuant to section 161 of the German Stock Corporation Act (Aktiengesetz) and made it avail-able to shareholders on the website of NORMA Group.

175Consolidated Financial Statements
Notes to the Consolidated Financial Statements
43. EVENTS AFTER THE BALANCE SHEET DATE
Unscheduled repayment of syndicated bank facilitiesIn January 2014, NORMA Group has repaid parts of the existing syndicated financing with the proceeds of the promissory notes. The repayment amounted to EUR 101.4 million. Due to the re-payment NORMA Group will in future benefit from lower interest expense that will already have a positive effect on the result in the first quarter of 2014. The associated hedging instruments (cross-currency and interest rate swaps) were dissolved at the time of repayment. These releases will have a one-off negative effect on the first quarter in the amount of EUR 6.8 million. The savings that will result from lower interest expenses starting in January 2014 will already compensate for roughly half of the one-off expenditures during the current year. By the end of the financing term, NORMA Group will have saved more than EUR 3.6 million by repaying this loan and cancelling the derivative. Including the early termination of deferred financing costs, we expect for 2014 overall financing costs of approximately EUR 18 million, which are reduced in the following year on a comparable basis to approximately EUR 10 million.
Acquisition of the outstanding shares of Chien Jin Plastic Sdn. Bhd. In February 2013, NORMA Group has acquired the remaining 15 % of the shares in Chien Jin Plastic Sdn. Bhd. located in Malay-sia, by redemption of the outstanding purchase price liability in an amount of EUR 0.9 million. This transaction brings NORMA Group’s share in the Company to 100 %. Since we have already fully consolidated Chien Jin Plastic from the acquisition in No-vember 2012 on, there are no effects on the Group’s financial figures. Chien Jin Plastic Sdn. Bhd. is based in Ipohis specialised in joining elements for plastic and iron pipe systems. Chien Jin Plastic manufactures joining solutions for plastic and cast iron pipe systems used in diverse applications with a focus on drink-ing and domestic water supply as well as irrigation systems. Being in the market for 20 years, Chien Jin Plastic manufactures pipe couplings for different application areas, in particular for drinking and domestic water distribution, and irrigation systems. In addition, the Company produces components for sanitary appliances and globally distributes its products. For more infor-mation, please refer to our Annual Report 2012. The acquisition of outstanding shares of Chien Jin Plastic goes in line with stra-tegic aim to expand our presence in Asia.

NORMA Group SE Annual Report 2013176
Appendix to the Notes to the Consolidated Financial Statements
NOTIFICATIONS OF VOTING RIGHTS
According to section 160 (1) No. 8 AktG information regarding voting rights that have been notified to the company pursuant to section 21 (1) or (1a) of the German Securities Trading Act (Wert-papierhandelsgesetz – WphG) have to be disclosed.
The following sheet gives an overview of all voting rights that have been notified to the company as of 12 March 2014. It contains the information of the last notification of each shareholder and the percentage and shares can have changed in the meantime.
Notifying party
Achievement of voting rights Notification limit
Share in % Shares Pursuant to section 22 WpHG
The Capital Group, Inc., Los Angeles, USA 7 March 2014 3 % exceedance 3.05 973,100
§ 22 (1) sent. 1 no. 6 in connection with sent. 2 and sent. 3 WpHG
Capital Research and Management Company, Los Angeles, USA 7 March 2014 3 % exceedance 3.05 973,100 § 22 (1) sent. 1 no. 6 WpHG
Threadneedle Asset Management Holdings SARL, Luxembourg 1) 12 February 2014 5 % shortfall 4.98 1,585,678
§ 22 (1) sent. 1 no. 6 in connection with sent. 2 WpHG
BlackRock Financial Management, Inc., New York, USA 21 January 2014 5 % exceedance 5.10 1,626,217
§ 22 (1) sent. 1 no. 6 in connection with sent. 2 WpHG
BlackRock Holdco 2, Inc., Wilmington, USA 21 January 2014 5 % exceedance 5.10 1,626,217
§ 22 (1) sent. 1 no. 6 in connection with sent. 2 WpHG
BlackRock, Inc., New York, USA 21 January 2014 5 % exceedance 5.10 1,626,217
§ 22 (1) sent. 1 no. 6 in connection with sent. 2 WpHG
Allianz Global Investors Europe GmbH, Frankfurt/Main, Germany 21 January 2014 5 % exceedance 5.02 1,601,001
thereof 0.50 % (157,764) accord-ing to § 22 (1) sent. 1 no. 6 WpHG
ODDO et Cie., Paris, France 6 December 2013 3 % shortfall 2.84 903,541
§ 22 (1) sent. 1 no. 6 in connection with sent. 2 WpHG
ODDO Asset Management, Paris, France 6 December 2013 3 % shortfall 2.84 903,541 § 22 (1) sent. 1 no. 6 WpHG
Threadneedle Asset Management Holdings Limited, London, United Kingdom 1) 19 November 2013 5 % shortfall 4.95 1,576,817
§ 22 (1) sent. 1 no. 6 in connection with sent. 2 WpHG
Threadneedle Asset Management Limited, London, United Kingdom 1) 19 November 2013 5 % shortfall 4.95 1,576,817 § 22 (1) sent. 1 no. 6 WpHG
BNP Paribas Investment Partners S.A., Paris, France 5 November 2013 3 % shortfall 2.86 912,398
thereof 2.12 % (676,754) accord-ing to § 22 (1) sent. 1 no. 1 WpHG and likewise 0.74 % (235,644) ac-cording to § 22 (1) sent. 1 no. 6 in
connection with sent. 2 WpHG
Threadneedle Investment Funds ICVC, London, United Kingdom 17 October 2013 5 % shortfall 4.94 1,575,121
Threadneedle Investment Services Limited, London, United Kingdom 1) 17 October 2013 5 % shortfall 4.94 1,575,121 § 22 (1) sent. 1 no. 6 WpHG
1) The voting rights attributed to the notifying party are held by the following shareholder which share in the voting rights in NORMA Group SE exceeds 3 % or more: Threadneedle Investment Funds ICVC

177Consolidated Financial Statements
Appendix to the Notes to the Consolidated Financial Statements
Notifying party
Achievement of voting rights Notification limit
Share in % Shares Pursuant to section 22 WpHG
BlackRock Group Limited, London, United Kingdom 2 August 2013 3 % exceedance 3.02 961,863
§ 22 (1) sent. 1 no. 6 in connection with sent. 2 WpHG
BR Jersey International Holdings, L.P., St. Helier, Jersey, Channel Islands 2 August 2013 3 % exceedance 3.02 962,003
§ 22 (1) sent. 1 no. 6 in connection with sent. 2 WpHG
BlackRock International Holdings, Inc., New York, USA 2 August 2013 3 % exceedance 3.02 962,003
§ 22 (1) sent. 1 no. 6 in connection with sent. 2 WpHG
BlackRock Advisors Holdings, Inc., New York, USA 2 August 2013 3 % exceedance 3.02 962,003
§ 22 (1) sent. 1 no. 6 in connection with sent. 2 WpHG
DWS Investment GmbH, Frankfurt am Main, Germany 24 July 2013 3 % shortfall 2.98 949,650
Ameriprise Financial Inc., Minneapolis, USA 1) 9 May 2013 10 % shortfall 9.96 3,172,259
§ 22 (1) sent. 1 no. 6 in connection with sent. 2 WpHG
Columbia Wanger Asset Management LLC, Chicago, USA 20 March 2013 3 % shortfall 2.82 897,250 § 22 (1) sent. 1 no. 6 WpHG
3i EF4 GP Limited, London, United Kingdom 14 January 2013 5 % and 3 % shortfall 0.00 0
3i Group Investments LP, London, United Kingdom 14 January 2013 3 % shortfall 0.00 0
3i Pan European Buyouts 2004–06 LP; London, United Kingdom 14 January 2013 3 % shortfall 0.00 0
3i Investments GP Limited, London, United Kingdom 14 January 2013 5 % and 3 % shortfall 0.00 0
3i Investments plc, London, United Kingdom 14 January 2013
15 %, 10 %, 5 % and 3 % shortfall 0.00 0
3i plc, London, United Kingdom 14 January 2013
15 %, 10 %, 5 % and 3 % shortfall 0.00 0
3i Holdings plc, London, United Kingdom 14 January 2013
15 %, 10 %, 5 % and 3 % shortfall 0.00 0
3i Group plc, London, United Kingdom 14 January 2013
15 %, 10 %, 5 % and 3 % shortfall 0.00 0
1) The voting rights attributed to the notifying party are held by the following shareholder which share in the voting rights in NORMA Group SE exceeds 3 % or more: Threadneedle Investment Funds ICVC
All notifications of voting rights by the company in the reporting period and until 12 March 2014 are available on the website of NORMA Group (@ http://investoren.normagroup.com).

NORMA Group SE Annual Report 2013178
MEMBERS OF THE MANAGEMENT BOARD
Werner DeggimDiplom-Ingenieur, Chief Executive Officer (CEO)
Dr. Othmar BelkerDiplom-Volkswirt, Chief Financial Officer (CFO)
Bernd KleinhensDiplom-Ingenieur, Managing Director Business Development
John StephensonMaster of Science, Chief Operating Officer (COO)
The members of the Management Board are appointed members of various Supervisory Boards of NORMA Group companies.
MEMBERS OF THE SUPERVISORY BOARD
Dr. Stefan Wolf (Chairman) Chief Executive Officer (CEO) of ElringKlinger AG,
Dettingen, Germany Member of the Supervisory Board of Fielmann AG,
Hamburg, Germany Member of the Board of Directors of Micronas
Semiconductor Holding AG, Zurich, Switzerland
Lars M. Berg (Deputy Chairman) Consultant Chairman of the Supervisory Board of Net Insight AB,
Stockholm, Sweden Chairman of the Supervisory Board of KPN OnePhone
Holding B.V., Duesseldorf, Germany Member of the Supervisory Board of Ratos AB,
Stockholm, Sweden Member of the Supervisory Board of Tele2 AB,
Stockholm, Sweden
Günter Hauptmann Consultant Member of the Supervisory Board of Geka GmbH,
Bechhofen, Germany Chairman of the Advisory Board of GIF GmbH,
Alsdorf, Germany
Knut J. Michelberger Consultant (no seats on other Supervisory Boards)
Dr. Christoph Schug Consultant Member of the Supervisory Board of Tom Tailor Holding AG,
Hamburg, Germany Member of the Supervisory Board of
BCG Baden-Baden-Cosmetics AG, Baden-Baden, Germany Member of the Board of Directors of AMEOS Gruppe AG,
Zurich, Switzerland
Erika Schulte (since 18 February 2013) Managing Director of Hanau Wirtschaftsförderung GmbH,
Managing Director of Brüder-Grimm-Berufsakademie Hanau GmbH and Liquidator of Technologie- und Gründerzentrum Hanau GmbH (no seats on other Supervisory Boards)

179Consolidated Financial Statements
Responsibility Statement
To the best of our knowledge, and in accordance with the applicable reporting principles, the consoli-dated financial statements give a true and fair view of the assets, liabilities, financial position and profit or loss of the Group, and the Group Management Report includes a fair review of the development and performance of the business and the position of the Group, together with a description of the principal opportunities and risks associated with the expected development of the Group.
Maintal, 12 March 2013
NORMA Group SE
Management Board
Responsibility Statement
Werner Deggim Dr. Othmar Belker Bernd Kleinhens John Stephenson
NORMA Group SE Annual Report 2013180
Auditor’s Report
We have audited the consolidated financial statements prepared by NORMA Group SE, Maintal, com-prising the statement of financial position, the statement of comprehensive income, the statement of changes in equity, the cash flow statement and the notes to the consolidated financial statements, to gether with the Group management report for the business year from January 1 2013 to December 31 2013. The preparation of the consolidated financial statements and the Group management report in accordance with the IFRSs, as adopted by the EU, and the additional requirements of German commercial law pursuant to § (Article) 315a Abs. (paragraph) 1 HGB (“Handelsgesetzbuch”: German Commercial Code) is the responsibility of the parent Company’s Board of Managing Directors. Our responsibility is to express an opinion on the consolidated financial statements and on the Group management report based on our audit.
We conducted our audit of the consolidated financial statements in accordance with § 317 HGB and German generally accepted standards for the audit of financial statements promulgated by the Institut der Wirtschaftsprüfer (Institute of Public Auditors in Germany) (IDW). Those standards require that we plan and perform the audit such that misstatements materially affecting the presentation of the net assets, financial position and results of operations in the consolidated financial statements in accor-dance with the applicable financial reporting framework and in the Group management report are detected with reasonable assurance. Knowledge of the business activities and the economic and legal environment of the Group and expectations as to possible misstatements are taken into account in the determination of audit procedures. The effectiveness of the accounting-related internal control system and the evidence supporting the disclosures in the consolidated financial statements and the group management report are examined primarily on a test basis within the framework of the audit. The audit includes assessing the annual financial statements of those entities included in consolidation, the determination of the entities to be included in consolidation, the accounting and consolidation principles used and significant estimates made by the Company’s Board of Managing Directors, as well as evaluating the overall presentation of the consolidated financial statements and the group management report. We believe that our audit provides a reasonable basis for our opinion.Our audit has not led to any reservations.
In our opinion based on the findings of our audit the consolidated financial statements comply with the IFRSs as adopted by the EU and the additional requirements of German commercial law pursuant to § 315a Abs. 1 HGB and give a true and fair view of the net assets, financial position and results of operations of the Group in accordance with these requirements. The Group management report is consistent with the consolidated financial statements and as a whole provides a suitable view of the Group’s position and suitably presents the opportunities and risks of future development.
Frankfurt am Main, March 12 2014
PricewaterhouseCoopers AktiengesellschaftWirtschaftsprüfungsgesellschaft
Dr. Ulrich Störk ppa. Benjamin HesselWirtschaftsprüfer Wirtschaftsprüfer Glossar (German Public Auditor) (German Public Auditor)

181Further Information
Glossary
Glossary
EUROPEAN MARKET INFRASTRUCTURE REGULATION
(EMIR)
EU regulation that regulates the over-the-counter market with derivative products. The main stipulation of this regulation obli-gates market participants to clear their over-the-counter standard derivative transactions through a central counterpart and report these transactions to a transaction registry. FERRITIC STEELS
Ferritic chromium steel is a stainless steel that normally cannot be hardened. It is magnetisable and is used in environments that contain little or no chloride.
FLUID PRODUCTS / SYSTEMS
Single or multiple-layer thermoplastic fluid systems /connections.
FSC-CERTIFICATE
International label for wood and wood products that originate exclusively from sustainably managed forests.
HYBRID VEHICLE
A vehicle that contains at least two types of energy transformers and two energy storage systems that allow it to drive forward. The energy transformers can be electric, petrol or diesel engines. The energy storage systems are usually accumulators, fuel or petrol tanks.
INDUCTION
Generation of an electric current in a conductor using varying magnetic fields.
INSOURCING
The reincorporation of processes and functions into a company.
ISO 9001
Describes the minimum requirements for quality management systems.
Technical Terms
AFTERMARKET SEGMENT
The market concerned with the maintenance /repair of investment goods (e. g. machines), long-life final goods (e. g. vehicles), the sale of replacement parts or complementary parts for the goods. This involves the sale of services and /or parts that are directly related to the previous sale of the goods.
AIAG (AUTOMOTIVE INDUSTRY ACTION GROUP)
Not-for-profit association that develops and publishes uniform standards for the automotive industry.
AUSTENITIC STEELS
Austenitic steel is a stainless steel that normally contains an alloy of 15–20 % chromium and 5–15 % nickel. Other alloy components can have an impact on these figures. Austenitic steels cannot be hardened by way of heat treatment and are usually not mag-netisable.
CAQ-SOFTWARE
Software for quality assurance.
CO2
Carbon dioxide, a chemical compound of carbon and oxygen.
DISTRIBUTION SERVICES (DS)
One of NORMA Group’s two ways to market, which provides a wide range of high-quality, standardised joining products for a broad range of applications and customers.
ELASTOMERS
Elastomers are stable but elastic plastics which are used at a temperature above their glass transition temperature. The plastics can deform under tensile load or compressive load, but then return to their original undeformed shape.
ENGINEERED JOINING TECHNOLOGY (EJT)
One of NORMA Group’s two ways to market. It provides custom-ised, highly engineered joining technology products primarily, but not exclusively, for industrial OEM customers.

NORMA Group SE Annual Report 2013182
ISO 14001
An international environmental management standard that speci-fies the internationally accepted requirements for an en vironmental management system.
ISO / TS 16949
A standard that combines the existing general demands on qual-ity management systems of the (mostly North American and European) automotive industry.
IT
Information technology, an umbrella term for information and data processing.
LEAKAGE
A leak is an unwanted hole in a product or technical system, through which solids, liquids or gases can enter or exit. A leak can lead to the failure of an entire technical system. The size of a leak is measured by the leakage rate.
NITROGEN OXIDE
Nitrogen oxide is the generic term for oxygen and nitrogen com-pounds. These are gaseous compounds with low solubility in water. Nitrogen oxides are hazardous for people and the envi-ronment and are a waste gas produced by combustion engines.
OHSAS 18001
Occupational Health and Safety Assessment Series; certification of occupational health and safety management systems.
ORIGINAL EQUIPMENT MANUFACTURER (OEM)
A company that retails products under its own name.
PA12 RESINS
Polyamide 12 resin (laurinlactam or -aminododecanoic acid)
SELECTIVE CATALYTIC REDUCTION (SCR)
Selective catalytic reduction of nitrogen oxides to reduce particle and nitrogen oxide emissions.
SIX SIGMA
A management system for process improvement using analytic and statistical methods.
SUPPLY CHAIN MANAGEMENT
Supply chain management is the planning and management of all activities involved in supplier selection, procurement and con-version, as well as manufacturing, logistics and even sales.
THERMOPLASTICS (ALSO KNOWN AS PLASTOMERS)
These are plastics which become elastic (thermoplastic) in a par-ticular temperature range, whereby this process is reversible.
Other Terms
ACQUISITION
Acquisition of companies or parts of companies for strategic purposes.
BEST LANDED COST APPROACH
Takes all logistics and storage costs for the procurement of a purchased part into consideration and thus ensures that the most competitive suppliers are selected.
BEST PRACTICE APPROACH
This term comes from Anglo-American economics and refers to proven, good or exemplary methods, practices or procedures within a company.
BRIC STATES
An acronym that refers to the emerging markets of Brazil, Russia, India and China.
CASH-POOLING
Pooling of liquidity within the group with the help of central finan-cial management with the purpose of balancing surplus liquidity or a shortage of liquidity.

183Further Information
Glossary
CODE OF CONDUCT
A set of policies which can /should be applied in a wide range of contexts and environments depending on the situation. In con-trast to a rule, the target audience is not always obliged to com-ply with the code of conduct. For this reason, you will often hear the term “voluntary self-control.” A code of conduct is more of a personal commitment to follow or abstain from certain patterns of behaviour and ensure that nobody gains an unfair advantage by circumventing these patterns.
COMMODITY
A term used in procurement concerning every kind of merchan-dise for the tangible assets transcribed by tradesmen.
COMPLIANCE
Conforming to rules: companies adhering to codes of conduct, laws and guidelines.
CORPORATE GOVERNANCE
Corporate governance is the set of all international and national rules, regulations, values and principles which apply to com-panies and determine how these companies are managed and monitored.
COST OF MATERIALS RATIO
Share of the costs of materials in sales revenues.
COVERAGE
The regular assessment of the economic and financial situation of a listed company by banks or financial research institutions.
DODD FRANK ACT
An American federal law with the objective of promoting the sta-bility of the financial market in the United States of America.
EARNINGS BEFORE INTEREST, TAXES
AND AMORTISATION (EBITA)
Earnings before interest, taxes and amortisation of intangible assets.
EARNINGS BEFORE INTEREST, TAXES, DEPRECIATION
AND AMORTISATION (EBITDA)
Earnings before interest, taxes, depreciation (of property, plant and equipment) and amortisation (of intangible assets). It is a measure of a company’s operating performance before invest-ment expenses.
ECONOMIES OF SCALE
Defined in business economics’ production theory and micro-economics as the connection between the scale of a company’s output and the number of factors of production that it uses.
EMEA
An Anglo-American abbreviation for the economic area of Europe (made up of Western and Eastern Europe), the Middle East and Africa.
ESS (EMPLOYEE SATISFACTION SURVEY)
Survey on employee satisfaction.
EURIBOR
Reference rate for time deposits in the interbank business (cur-rency: EUR).
ISSUE PRICE
The first off-market purchase price of new securities determined by the issuer.
FREE CASH FLOW
Indicates the amount of money that is available to pay dividends to shareholders and / or repay loans.
GLOBAL EXCELLENCE PROGRAMME
A cost optimisation programme that was started in 2009. It co-ordinates and manages all of NORMA Group’s sites and business units.
INITIAL PUBLIC OFFERING (IPO)
First offering of shares of a company on the organised capital market.
NORMA Group SE Annual Report 2013184
INTERNATIONAL SECURITIES IDENTIFICATION NUMBER
(ISIN)
A 12-digit alphanumerical code used to identify a security traded on the stock market.
INVESTMENT RATIO
Share of the investments made in total assets.
LTI (LONG-TERM INCENTIVE PROGRAMME)
A form of profit-sharing to create long term performance incen-tives, usually offered to those who hold management positions.
MDAX
(Derived from Mid-Cap DAX) The MDAX was introduced on 19 January 1996. It is made up of 50 securities – primarily from traditional sectors – that track the values of the DAX in the rank-ing list based on market capitalisation and level of trading on the stock exchange. The MDAX reflects the price performance of shares in medium-sized German companies or companies pri-marily operating in Germany (Mid Caps).
MSP
Matching Stock Programme: a stock-based option right that is part of the remuneration for Management Board members.
OECD
(ORGANISATION FOR ECONOMIC
CO-OPERATION AND DEVELOPMENT)
Organisation for economic co-operation and development seeks to contribute to successful economic development, high employ-ment, and rising living standards in its member states.
PRIME STANDARD
A segment of the regulated stock market with higher inclusion requirements than the General Standard. It is the private law segment of the Frankfurt Stock Exchange with the highest trans-parency standards. All companies listed in the DAX, MDAX, TecDAX and SDAX must be included in the Prime Standard.
PROCEEDS OF THE ISSUE
The total capital the issuer benefits from in case of an issuance of securities. The proceeds of issue consist of the nominal value
and the issue price each multiplied by the number of shares placed in the example of an issuance of shares.
PROLONGATION
Lifetime extensions of loans or financial investments.
REVERSE FACTORING
Reverse factoring or purchase factoring is where the factoring company commits to its supplier to prefinance the customer’s obligations.
ROADSHOW
A series of corporate presentations made to investors by an issuer at various financial locations to attract investment in the company.
SECURITIES ID NUMBER (WKN)
A six-character combination of numbers and letters used to iden-tify securities in Germany.
SOCIETAS EUROPAEA (SE)
A legal form for stock companies in the European Union and the European Economic Area. With the SE, the EU started allowing for companies to be founded in accordance with a largely uniform legal framework at the end of 2004.
SYNERGIES
This term refers to organisms, materials or forces working together to gain mutual benefits.
TAX RATIO
Share of taxes payable in annual earnings.
WORKING CAPITAL
Represents the net current assets of a company. Working capital is equal to current assets less current liabilities. This difference and the ratio (current assets divided by current liabilities), known as the working capital ratio, are used as indicators of the liquidity situation of a company and are particularly important for credit analyses.
XETRA
An electronic trading system operated by Deutsche Börse AG for the spot market.

185Further Information
Overview by Quarter 2013
Overview by Quarter 2013
Q1 2013 Q2 2013 Q3 2013 Q4 2013
Income statement
Revenue EUR million 159.3 163.5 159.9 152.8
Gross profit EUR million 91.0 94.6 93.0 92.8
Adjusted EBITA EUR million 28.3 27.9 28.8 27.6
Adjusted EBITA margin % 17.8 17.1 18.0 18.0
EBITA EUR million 28.3 27.8 28.7 27.3
Adjusted profit for the period EUR million 17.3 16.1 13.8 14.9
Adjusted EPS EUR 0.54 0.51 0.43 0.47
Profit for the period EUR million 15.8 14.7 12.5 12.6
EPS EUR 0.50 0.46 0.39 0.40
Cash flow
Cash flow from operating activities EUR million 9.8 35.1 27.8 42.7
Operating net cash flow EUR million 7.6 38.3 26.9 31.1
Cash flow from investing activities EUR million – 6.4 – 9.5 – 11.9 – 15. 6
Cash flow from financing activities EUR million 1.6 – 39.5 108.2 – 18.5
Balance sheet
Total assets EUR million 720.3 701.8 826.2 823.7
Equity EUR million 305.6 298.1 308.9 319.9
Equity ratio % 42.4 42.5 37.4 38.8
Net debt EUR million 200.3 193.6 181.0 153.5
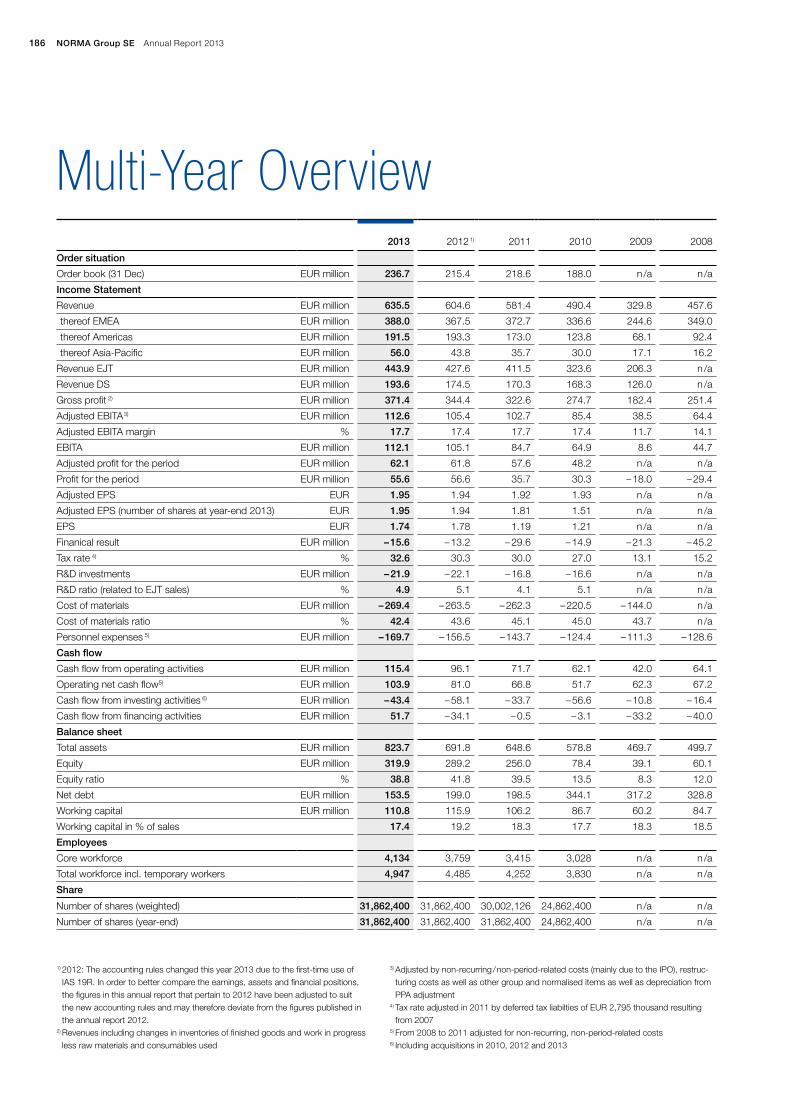
NORMA Group SE Annual Report 2013186
2013 2012 1) 2011 2010 2009 2008
Order situation
Order book (31 Dec) EUR million 236.7 215.4 218.6 188.0 n /a n /a
Income Statement
Revenue EUR million 635.5 604.6 581.4 490.4 329.8 457.6
thereof EMEA EUR million 388.0 367.5 372.7 336.6 244.6 349.0
thereof Americas EUR million 191.5 193.3 173.0 123.8 68.1 92.4
thereof Asia-Pacific EUR million 56.0 43.8 35.7 30.0 17.1 16.2
Revenue EJT EUR million 443.9 427.6 411.5 323.6 206.3 n /a
Revenue DS EUR million 193.6 174.5 170.3 168.3 126.0 n /a
Gross profit 2) EUR million 371.4 344.4 322.6 274.7 182.4 251.4
Adjusted EBITA 3) EUR million 112.6 105.4 102.7 85.4 38.5 64.4
Adjusted EBITA margin % 17.7 17.4 17.7 17.4 11.7 14.1
EBITA EUR million 112.1 105.1 84.7 64.9 8.6 44.7
Adjusted profit for the period EUR million 62.1 61.8 57.6 48.2 n /a n /a
Profit for the period EUR million 55.6 56.6 35.7 30.3 – 18.0 – 29.4
Adjusted EPS EUR 1.95 1.94 1.92 1.93 n /a n /a
Adjusted EPS (number of shares at year-end 2013) EUR 1.95 1.94 1.81 1.51 n /a n /a
EPS EUR 1.74 1.78 1.19 1.21 n /a n /a
Finanical result EUR million – 15.6 – 13.2 – 29.6 – 14.9 – 21.3 – 45.2
Tax rate 4) % 32.6 30.3 30.0 27.0 13.1 15.2
R&D investments EUR million – 21.9 – 22.1 – 16.8 – 16.6 n /a n /a
R&D ratio (related to EJT sales) % 4.9 5.1 4.1 5.1 n /a n /a
Cost of materials EUR million – 269.4 – 263.5 – 262.3 – 220.5 – 144.0 n /a
Cost of materials ratio % 42.4 43.6 45.1 45.0 43.7 n /a
Personnel expenses 5) EUR million – 169.7 – 156.5 – 143.7 – 124.4 – 111.3 – 128.6
Cash flow
Cash flow from operating activities EUR million 115.4 96.1 71.7 62.1 42.0 64.1
Operating net cash flow5) EUR million 103.9 81.0 66.8 51.7 62.3 67.2
Cash flow from investing activities 6) EUR million – 43.4 – 58.1 – 33.7 – 56.6 – 10.8 – 16.4
Cash flow from financing activities EUR million 51.7 – 34.1 – 0.5 – 3.1 – 33.2 – 40.0
Balance sheet
Total assets EUR million 823.7 691.8 648.6 578.8 469.7 499.7
Equity EUR million 319.9 289.2 256.0 78.4 39.1 60.1
Equity ratio % 38.8 41.8 39.5 13.5 8.3 12.0
Net debt EUR million 153.5 199.0 198.5 344.1 317.2 328.8
Working capital EUR million 110.8 115.9 106.2 86.7 60.2 84.7
Working capital in % of sales 17.4 19.2 18.3 17.7 18.3 18.5
Employees
Core workforce 4,134 3,759 3,415 3,028 n /a n /a
Total workforce incl. temporary workers 4,947 4,485 4,252 3,830 n /a n /a
Share
Number of shares (weighted) 31,862,400 31,862,400 30,002,126 24,862,400 n /a n /a
Number of shares (year-end) 31,862,400 31,862,400 31,862,400 24,862,400 n /a n /a
Multi-Year Overview
1) 2012: The accounting rules changed this year 2013 due to the first-time use of IAS 19R. In order to better compare the earnings, assets and financial positions, the figures in this annual report that pertain to 2012 have been adjusted to suit the new accounting rules and may therefore deviate from the figures published in the annual report 2012.
2) Revenues including changes in inventories of finished goods and work in progress less raw materials and consumables used
3) Adjusted by non-recurring / non-period-related costs (mainly due to the IPO), restruc-turing costs as well as other group and normalised items as well as depreciation from PPA adjustment
4) Tax rate adjusted in 2011 by deferred tax liabilties of EUR 2,795 thousand resulting from 2007
5) From 2008 to 2011 adjusted for non-recurring, non-period-related costs6) Including acquisitions in 2010, 2012 and 2013

NORMA Group worldwideEMEA
Czech Republic (P)France (P, D)Germany (P, D)Italy (P, D)Netherlands (D)Poland (P, D)Russia (P, D)Serbia (P)Spain (D)Sweden (P, D)Switzerland (D)Turkey (D)United Kingdom (P, D)
AMERICAS
Brazil (P, D)Mexico (P)USA (P, D)
ASIA-PACIFIC
Australia (D)China (P, D)India (P, D)Indonesia (D)Japan (D)Korea (D)Malaysia (P, D)Philippines (D)Singapore (D)Thailand (P)Vietnam (D)
P = Production D = Distribution centre, Sales
centre, Competence centre
SALES AMERICAS
Employees: 711Sales growth: – 0.9 %
2012
EUR 193.3 million
EUR 191.6 million
2013
NO
RM
A G
rou
p w
orl
dw
ide

SALES EMEA
Employees: 2,820Sales growth: + 5.6 %
2012 2013
EUR 367.5 million
EUR 387.9 million
SALES ASIA-PACIFIC
Employees: 603Sales growth: + 28.1 %
2012 2013
EUR 43.8 million
EUR 56.0 million

Andreas TröschVice President Investor RelationsPhone: + 49 6181 6102 741Fax: + 49 6181 6102 7641E-Mail: [email protected]
Vanessa MieschkeSenior Manager Investor RelationsPhone: + 49 6181 6102 742Fax: + 49 6181 6102 7642E-Mail: [email protected]
Note on the annual reportThis annual report is also available in German. If there are differences between the two, the German version takes priority.
Note on roundingPlease note that slight differences may arise as a result of the use of rounded amounts and percentages.
Forward-looking statementsThis annual report contains certain future-oriented statements. Future-oriented statements include all statements which do not relate to historical facts and events and contain future-oriented expressions such as “believe”, “estimate”, “assume”, “expect”, “forecast“, “intend”, “could” or “should” or expressions of a similar kind. Such future-oriented statements are subject to risks and uncertainties since they relate to future events and are based on the company’s current assumptions, which may not in the future take place or be fulfilled as expected. The company points out that such future-oriented statements provide no guarantee for the future and that the actual events including the financial position and profitability of NORMA Group SE and developments in the economic and regulatory fundamentals may vary substantially (particularly on the down side) from those explicitly or implicitly assumed in these statements. Even if the actual assets for NORMA Group SE, including its financial position and profitability and the economic and regulatory fundamentals, are in accordance with such future-oriented statements in this annual report, no guarantee can be given that this will continue to be the case in the future.
EDITOR
NORMA Group SE Edisonstrasse 4 63477 Maintal
Phone: + 49 6181 6102 740E-Mail: [email protected]
CONCEPT AND LAYOUT
3st kommunikation, Mainz
Financial Calendar 2014
Contact and Imprint
19 / 02 / 2014 Preliminary Financial Figures 2013
27 / 03 / 2014 Publication of Full Year Results 2013
07 / 05 / 2014 Publication of Q1 Interim Results 2014
21 / 05 / 2014 Annual General Meeting in Frankfurt / Main
06 / 08 / 2014 Publication of Q2 Interim Results 2014
05 / 11 / 2014 Publication of Q3 Interim Results 2014
We constantly update our financial calendar. Please visit the Investor Relations section on our website @ www.normagroup.com for up-to-date information.
If you have any questions regarding NORMA Group or would like to be included in our distribution list, please contact the Investor Relations Team:
E-Mail: [email protected]

AN
NU
AL
RE
PO
RT
20
13N
OR
MA
Gro
up S
E
NORMA Group SEEdisonstrasse 463477 Maintal
Phone: +49 6181 6102 740E-Mail: [email protected]